Forex analysis review
Forex analysis review |
- Technical analysis of BTC/USD for June 18, 2022
- Technical analysis on the Dollar index.
- Will Litecoin repeat the past bullish break out?
- GBP/USD analysis on June 18. The pound builds a complex correctional structure, which nevertheless correlates with the European.
- EUR/USD analysis on June 18. Jerome Powell can't stop inflation and the growth of the dollar yet.
- Ethereum falls to new lows.
- Gold continues to respect weekly support.
- Ichimoku cloud indicator analysis on EURUSD for the week that ended on June 17th, 2022.
- Analysis of the trading week of June 13-17 for the GBP/USD pair. COT report. The pound is making another attempt to correct.
- Analysis of the trading week of June 13-17 for the EUR/USD pair. COT report. The European currency could not rise from its
- June 17, 2022 : EUR/USD daily technical review and trading opportunities.
- June 17, 2022 : EUR/USD Intraday technical analysis and trading plan.
- June 17, 2022 : GBP/USD Intraday technical analysis and significant key-levels.
- Technical analysis of BTC/USD for June 17, 2022.
- Forex forecast 06/17/2022 USD/JPY, EUR/JPY, SP500, Oil and Bitcoin from Sebastian Seliga
- Bitcoin went underwater: for how long?
- Technical analysis of GBP/USD for June 17, 2022
- GBP/USD: trading plan for American session on June 17 (analysis of morning trades)
- Technical analysis of EUR/USD for June 17, 2022
- USD/CHF Technical Analysis and Trading Tips on June 17, 2022
- EUR/CHF: Features and recommendations
- US premarket on June 17, 2022
- Trading plan for Ripple for June 17, 2022
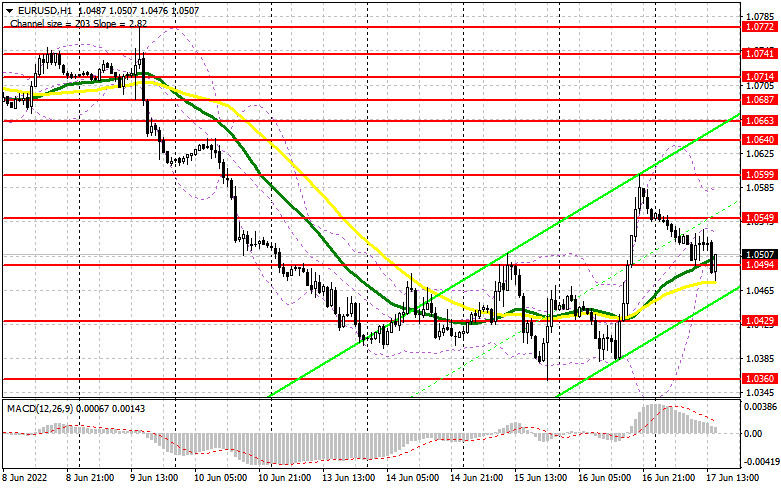
- EUR/USD: trading plan for US session on June 17 (morning trades analysis). Euro plummets but bulls protect 1.0494 and continue
- Trading plan for Ethereum on June 17, 2022
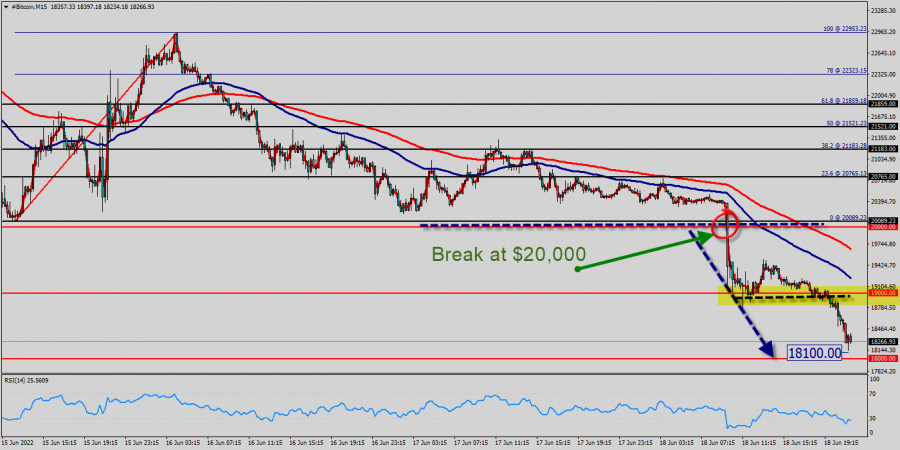
| Technical analysis of BTC/USD for June 18, 2022 Posted: 18 Jun 2022 12:25 PM PDT
Trading Cryptocurrency BTC/USD (Bitcoin): Bitcoin (BTC) is down -8.22% to €18,100 in the last 24 hours. BTC dropped below the $20,000 level for the first time since two years. The price of $20,000 is coincided with the major support in the hourly time frame. Right now, BTC stood at $18,100 per 1USD, after touching a high of $21k earlier in the day. But the BTC has rebounded from the price of $21k to close below the price of $20,000 at the same time frame. Please, note that the prices of $21k and $20 coincide with the Fibonacci expansion of 23.6% and 00% respectively. Bitcoin has been in a volatile trading range for almost a week now, bouncing between $20k and $18k. Resistance of the Bitcoin pair is seen at the price of $20,000. The Bitcoin is trading below its resistance for a while. It is likely to trade in a lower range as long as it remains below resistance. Furthermore, it should bear in mind that resistance has set at $20,000. The Bitcoin pair has made an important significant movement from yesterday. For that my foresee will focus on bearish market in my technical outlook. The bias remains bearish in the nearest term testing $18,000 or lower. If the trend can break the first target at $18,000, the market will call for a strong bearish trend towards the next target at $17,000. However, stop loss has always been in consideration. Thus it will be useful to set it above the last double top at the level of $20,000 (notice that the major resistance today has set at $21,000). Downtrend scenario : On the downside, the $18,000 level represents support. The next major support is located near the $18,000, which the price may drift below towards the $18,000 support region. Forecast: The volatility is very high for that the BTC/USD is still moving between $20,000 and $18,00 in coming hours. Consequently, the market is likely to show signs of a bearish trend again. As a result, it is gainful to sell below this price of $19k with targets at $18k and $17k. However, the bullish trend is still expected for the upcoming days as long as the price is above $21k. Cryptocurrency trading is subject to high market risk. My analysis will make the best efforts to choose high-quality of my forecast, but will not be responsible for your trading losses. Please trade with caution. The material has been provided by InstaForex Company - www.instaforex.com |
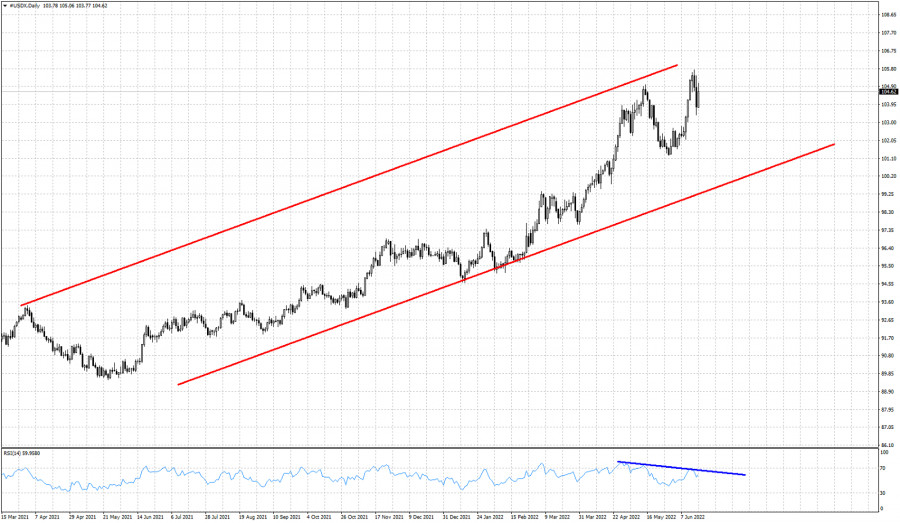
| Technical analysis on the Dollar index. Posted: 18 Jun 2022 05:07 AM PDT
Red lines- bullish channel Blue line- bearish divergence Can the Dollar index sustain its upward trend? Price is clearly still in a bullish trend by making higher highs and higher lows. Price is still inside a bullish channel with no sign of a reversal. The only signs we have so far, are signs that the up trend is weakening. This is noted by the bearish divergence in the RSI. Price is trading very close to the upper channel boundary with the RSI providing a bearish divergence. This combination is not good. This combination justifies at least a pull back towards 101-101.50. Bulls need to be cautious over the coming sessions. Recent low at 103.39 is also considered important short-term support that if broken will increase chances of the index reaching 101-101.50. The material has been provided by InstaForex Company - www.instaforex.com |
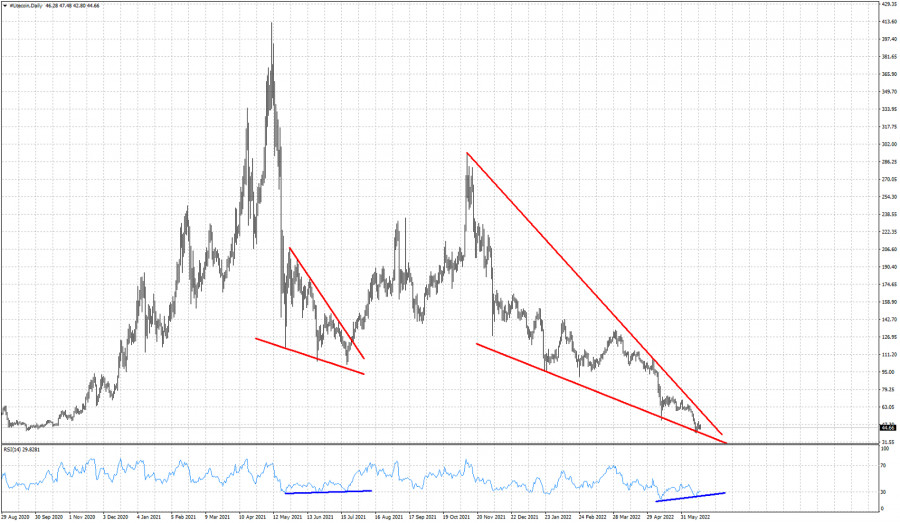
| Will Litecoin repeat the past bullish break out? Posted: 18 Jun 2022 05:03 AM PDT
Red lines- downward sloping wedge patterns Blue lines- bullish divergence Litecoin remains in a bearish trend making lower lows and lower highs. Price is showing a similarity to the pattern it followed one year ago. In both cases we see price forming a downward sloping wedge pattern and the RSI providing bullish divergence signals. Resistance by the wedge pattern upper boundary is at $58-59. A break above this level will be a bullish signal. Until then I would expect price to continue its drift lower. The material has been provided by InstaForex Company - www.instaforex.com |
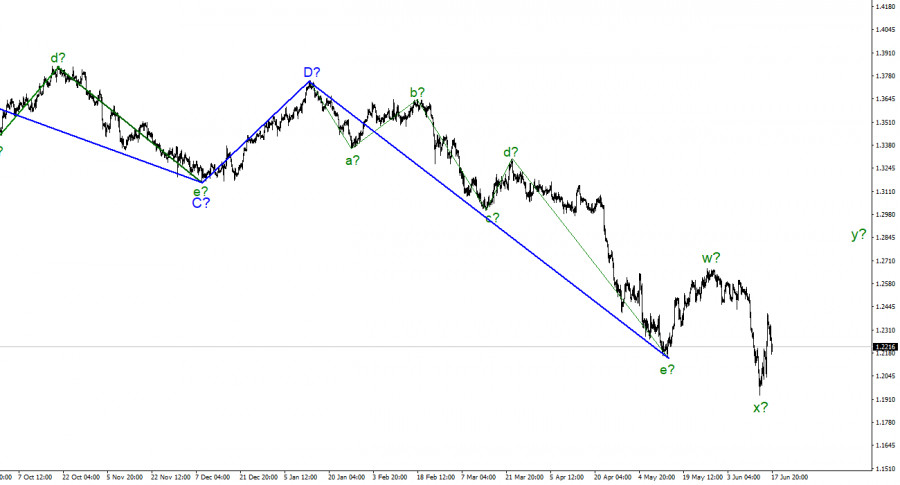
| Posted: 18 Jun 2022 05:02 AM PDT
For the pound/dollar instrument, the wave markup already requires additions and adjustments, but it may still take on a more or less digestible form. At the moment, the last downward wave has gone beyond the low of the expected downward trend segment, which I consider completed. Thus, we will no longer see the classical correction structure a-b-c. Nevertheless, wave analysis allows for the construction of various correction structures, so a more complex three-wave formation w-x-y can be constructed. Anyway, the pound and the euro continue to show a very high degree of correlation, and both instruments should build approximately the same structures. At the same time, according to the euro currency, it can be a classic a-b-c, and according to the pound, a rarer w-x-y. But in both cases, the instruments should now build an ascending wave, which should go beyond the peak of the previous ascending one. The wave marking on the British now looks not quite unambiguous, but still has the right to life. The fact that a stronger appreciation of the US currency did not begin after the Fed meeting is encouraging and gives chances for building the necessary upward wave. The topic of inflation is starting to depress the markets. The exchange rate of the pound/dollar instrument decreased by 140 basis points on June 17. Since I expect an upward wave to be built at this time, this decline was a surprise. On Friday, from the news background, I can only highlight the report on industrial production in the United States, which turned out to be much weaker than market expectations - +0.2% versus 0.7%. However, the demand for the US currency grew throughout the day, so this report did not affect the market mood in any way. The same applies to Jerome Powell's speech at the economic forum in Washington. He said that the Fed considers its main task to slow down inflation to the target of 2%. He also called the preservation of the world's confidence in the US dollar one of the priorities. However, the topic of high inflation has already begun to bother the market. More and more often it tries to make decisions based on simpler indicators. For example, on interest rates. What difference does it make how much inflation has increased in the UK or the US, if it is still only growing every month? Everyone is already used to it. But rates affect the economy, economic growth, various economic indicators, investments, borrowing costs, and cash flows. Thus, in general, the logic of the market is now extremely simple. Whose bid is higher – we buy that currency. Of course, the market cannot constantly buy only the dollar. From time to time, there are still corrective waves. But the downward section of the trend has been under construction for 18 months and during this time the corrective waves were almost all, not the strongest. With the current news background, the demand for the British simply refuses to grow. I note that the Bank of England is also raising the interest rate, but it is doing it more slowly than the Fed. Therefore, even the pound continues to decline against the dollar, although there are objectively fewer reasons for this than the euro currency. Even the construction of an upward wave is now in doubt due to the news background and the actions of central banks. General conclusions. The wave pattern of the pound/dollar instrument has become clearer. I still expect the construction of an upward wave within the corrective upward structure. If the current wave marking is correct, then the instrument's increase will continue with targets located above the calculated mark of 1.2671, which corresponds to 100.0% Fibonacci. I recommend buying on each MACD signal "up".
On an older scale, the entire downward trend section looks fully equipped but may take on a more extended appearance. If the current correctional structure still takes an even more non-standard form, then adjustments will have to be made. The material has been provided by InstaForex Company - www.instaforex.com |
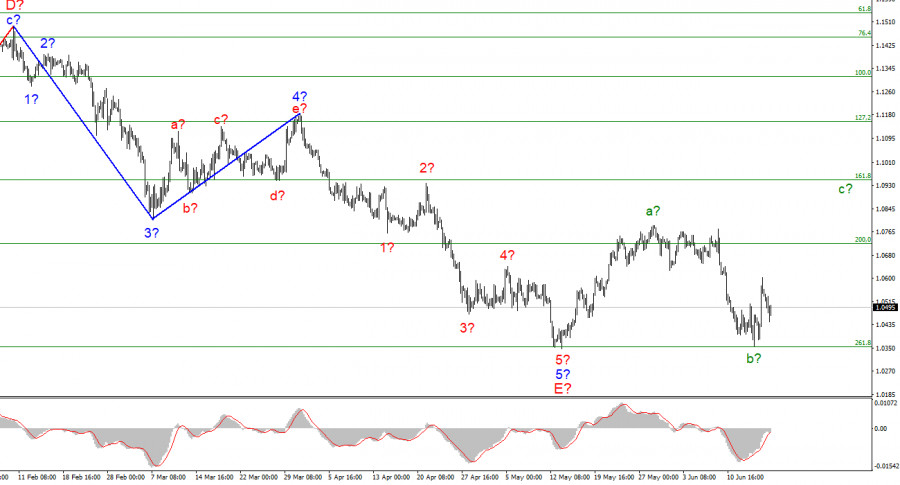
| EUR/USD analysis on June 18. Jerome Powell can't stop inflation and the growth of the dollar yet. Posted: 18 Jun 2022 05:02 AM PDT
The wave marking of the 4-hour chart for the euro/dollar instrument continues to look convincing and does not require adjustments yet. The instrument has completed the construction of the descending wave 5-E, which is the last in the structure of the descending trend section. If this is indeed the case, then at this time the construction of a new upward trend section has begun. It can turn out to be three-wave, or it can be pulsed. At the moment, two waves of a new section of the trend are visible. Wave A is completed, and wave b is also presumably completed. If this is indeed the case, then the construction of an ascending wave c should begin now. The instrument has not decreased under the low of the descending trend section, so the wave marking still retains its integrity. However, I note that the downward section of the trend may complicate its internal wave structure and take a much more extended form. Unfortunately, a very promising wave markup may be broken due to the news background, which at the end of last week led to a strong decline in demand for the euro currency. At the moment, the chances of building an upward wave c remain. Jerome Powell repeats the same thing in each of his speeches. The euro/dollar instrument fell by 55 basis points on Friday. From the point of view of waves, such a movement means absolutely nothing. I assume that wave b is completed, and the targets of wave c are located above the peaks of wave a, that is, 300 points above the current marks. Thus, until a successful attempt to break through the 1.0355 mark, which corresponds to 261.8% Fibonacci, I still expect an increase in demand for the euro currency. However, it is becoming more and more difficult to wait for such a movement every day. Although wave b did not break the wave marking, it turned out to be too deep. The news background for the European currency remains very bad. Especially after the Fed raised the interest rate by 75 basis points and promised to raise it again by 50-75 points next month. Jerome Powell has also been receiving only "hawkish" messages lately. Thus, if you look only at the news background, it will be very difficult for the European currency to rise even by 300 points. Difficult, but not impossible.If only the European Central Bank in the person of Christine Lagarde had at least some support for the euro currency. However, Lagarde barely agreed to follow the requests of the presidents of other central banks of the Eurozone, who insisted on raising the rate in the coming months. However, this is not enough to compete in this issue with the Fed, which tightens monetary policy every month while the ECB hesitates and thinks. And the question of inflation. It is no longer as important as it was a few months ago. If a few months ago everyone was terrified of another increase in this indicator, now it seems that no one is afraid of inflation even at 10%, since there is not such a big difference between 10% and 8%. No matter how much the Fed raises the rate, so far inflation is only accelerating. Then what difference does it make how much it will be in the end? General conclusions. Based on the analysis, I conclude that the construction of the downward trend section is completed. If so, then now you can buy a tool with targets located near the estimated mark of 1.0947, which equates to 161.8% Fibonacci, for each MACD signal "up". Wave c-b is presumably completed. An unsuccessful attempt to break through the level of 261.8% indicates that the market is not ready for new sales of the instrument. On a larger scale, it can be seen that the construction of the proposed wave E has been completed. Thus, the entire downward trend has acquired a complete look. If this is indeed the case, then in the future for several months the instrument will rise with targets located near the peak of wave D, that is, to the 15th figure. The material has been provided by InstaForex Company - www.instaforex.com |
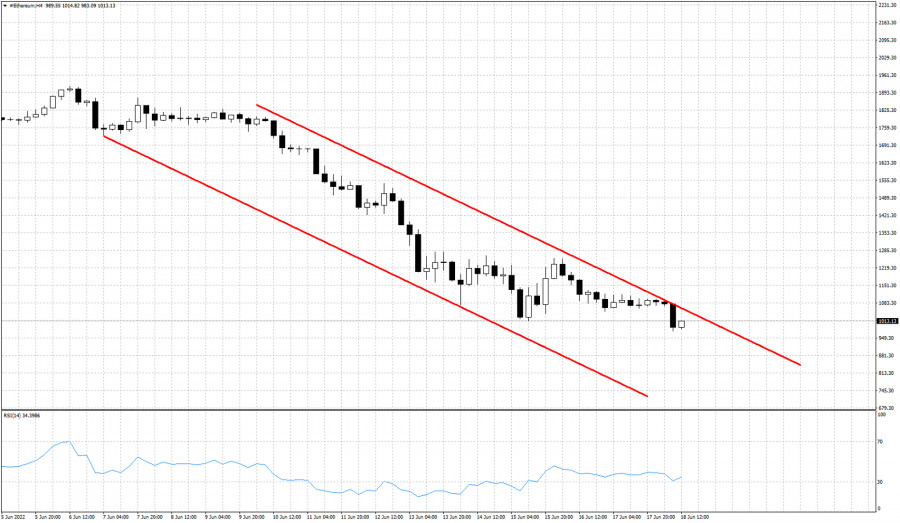
| Posted: 18 Jun 2022 04:59 AM PDT
Red lines- bearish channel Ethereum remains vulnerable inside the medium-term bearish channel. Price got rejected at the upper channel resistance and price turned around quickly. Price remains under pressure and as explained in our previous analysis on Ethereum, bears have the upper hand and it is very likely to see price below $1,000. Short-term resistance is found at $1,088 where the latest rejection took place. Price continues making lower lows and lower highs. The RSI has started providing some bullish divergence signals in the 4 hour chart but not in the daily. This justifies a bounce higher but most probably it will be a relief bounce. The material has been provided by InstaForex Company - www.instaforex.com |
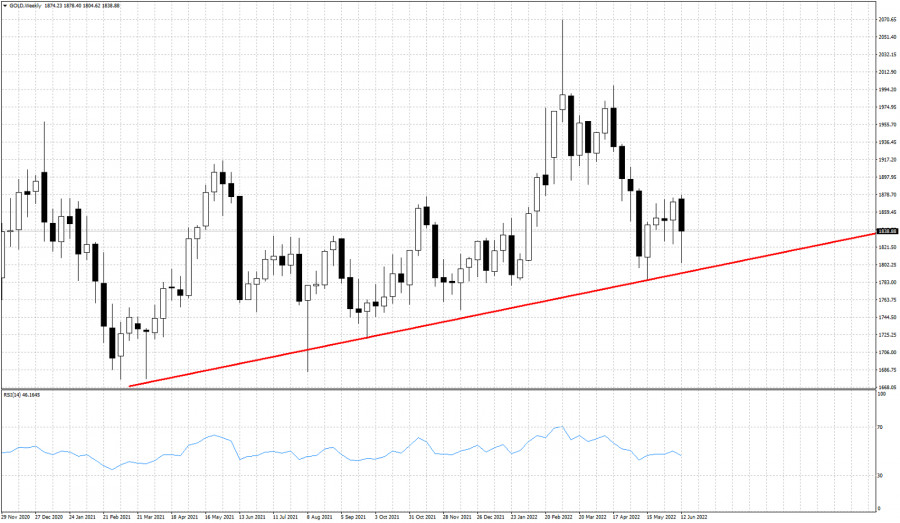
| Gold continues to respect weekly support. Posted: 18 Jun 2022 04:53 AM PDT
Red line -support trend line Gold price ended the week around $1,838, after making a low close to $1,804. Gold price remains vulnerable to a move lower as long as price is below $1,880. On a weekly basis price continues to trade above the long-term upward sloping support trend line. Support by the red trend line is found at $1,793. Holding above this level is crucial for bulls. Failure to hold above it, will destroy any chances bulls have more another test of $1,900. Last week price closed off its lows, but still it was the lowest close of the last 4 weeks. Long-term trend remains supportive due to the red trend line. The material has been provided by InstaForex Company - www.instaforex.com |
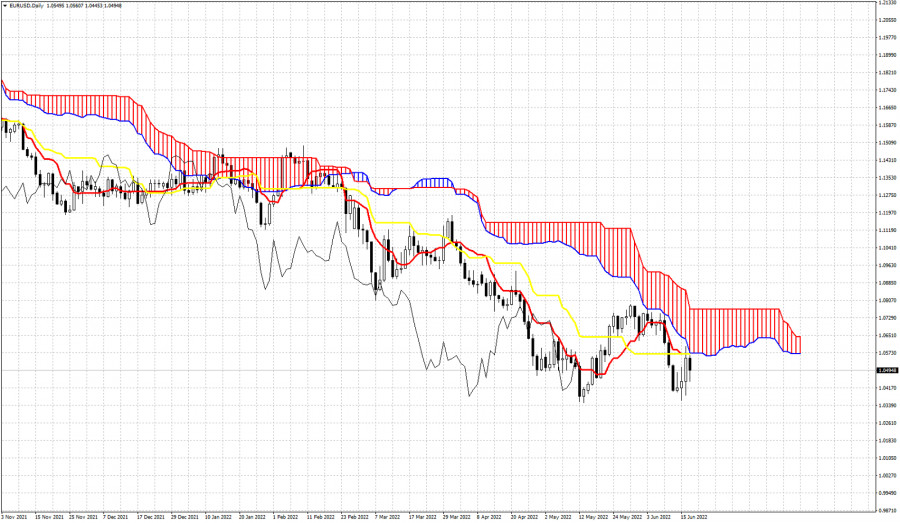
| Ichimoku cloud indicator analysis on EURUSD for the week that ended on June 17th, 2022. Posted: 18 Jun 2022 04:50 AM PDT
EURUSD remains in a bearish trend according to the Ichimoku cloud indicator. During the week price tried to push above resistance but failed and price got rejected. We saw lower lows relative to last week but in the end we saw a close well above its lows. Price remains below key resistance at 1.0570 where we find a confluence of resistance indicators. First we find the lower cloud boundary of the Daily Kumo (cloud). We also at the same area we find both the tenkan-sen (red line indicator) and the kijub-sen (yellow line indicator). In Ichimoku cloud terms, trend changes only if price breaks above the cloud. This happens if price breaks above 1.0770. Until then bears have the upper hand. Next week if EURUSD bulls manage to break above 1.0570 then they will have increased hopes for a move even higher towards 1.0770 resistance. The material has been provided by InstaForex Company - www.instaforex.com |
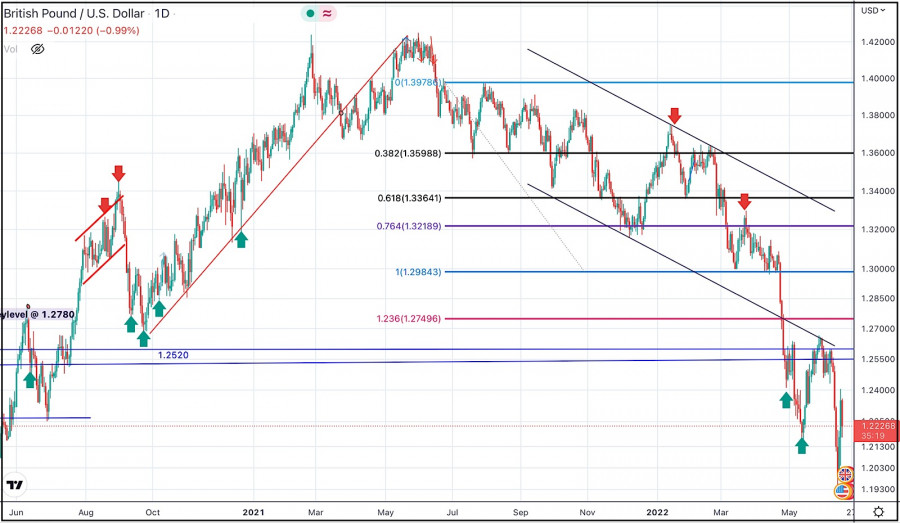
| Posted: 18 Jun 2022 03:00 AM PDT Long-term perspective.
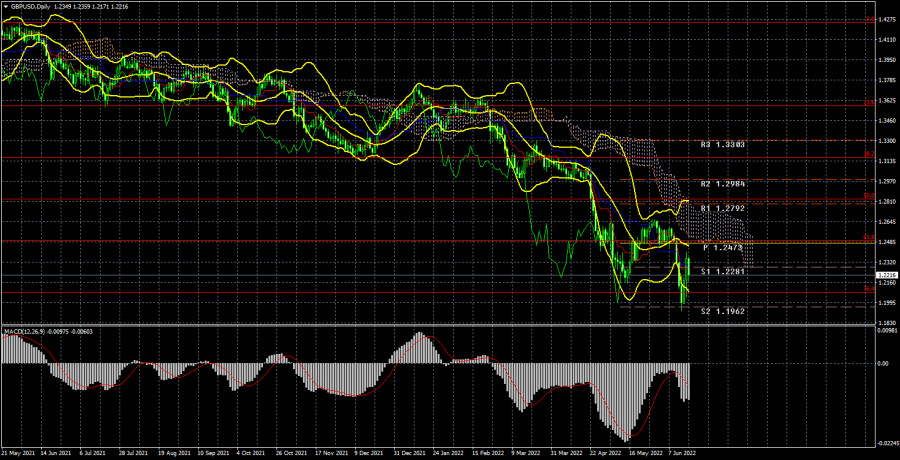
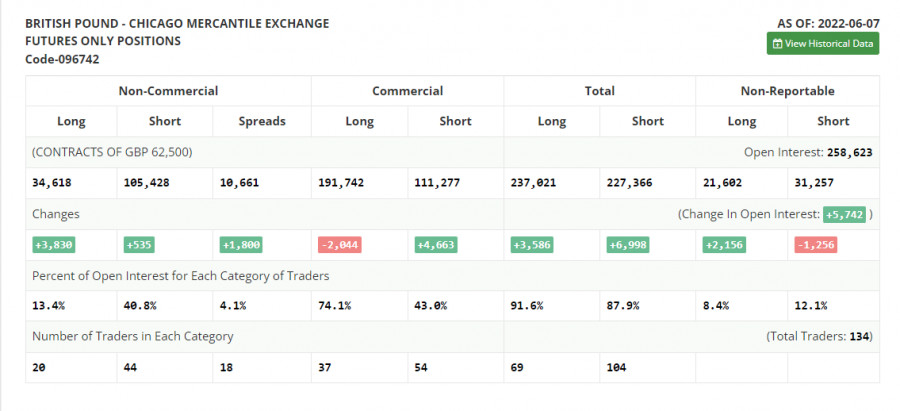
The GBP/USD currency pair has fallen by 100 points during the current week. Although the pound rose by 370 points on Wednesday and Thursday. A stronger fall in the other three days easily blocked even such a strong rise. Thus, from our point of view, there is no doubt about what kind of trend the pair is currently on. The picture this week was almost identical to the picture for the euro/dollar pair. The market began to work out the results of the Fed meeting on Monday. Or maybe at the end of last week. When on Wednesday evening it became known about the increase in the key rate by 0.75%, we already saw a reverse movement, which was also supported on Thursday, when the Bank of England raised the rate for the fifth time in a row. However, as before, the pound failed to extract any benefit for itself from this. Yes, in the context of two days, the British currency showed good growth. This only led to the fact that the price once again worked out the critical line, which was located not so far from it. Starting from February, the month of correction for the pound is so weak that the pair cannot even work out the lower boundary of the Ichimoku cloud. And at the beginning of the year, the correction was not strong. It was just flat, and the lines of the Ichimoku indicator tend to the price in time. Thus, this Ichimoku cloud decreased, which allowed the price to work out, and not vice versa. Therefore, the pound remains as weak as the euro, and as it was before. The fifth increase in the BA rate again did not give any support to the British currency. In addition, the latest macroeconomic reports in the UK left much to be desired. In the States now, not everything is in order with statistics, but the American economy continues to give the impression of an unsinkable ship. Of course, it can also go underwater, but the American ship is also in the port, where no one will let him sink. And the US dollar continues to be the world's reserve currency, no matter what anyone says. Therefore, in the conditions of a difficult geopolitical situation in the world, investors and traders prefer the American economy and the American dollar. COT analysis. The latest COT report on the British pound again showed insignificant changes. During the week, the Non-commercial group closed 5.2 thousand buy contracts and 10.5 thousand sell contracts. Thus, the net position of non-commercial traders increased by 5.3 thousand. However, the mood of the major players remains "pronounced bearish". And the pound, despite the growth of the net position, continues to fall. The net position has been falling for 3 months, which is perfectly visualized by the green line of the first indicator in the illustration above or the histogram of the second indicator. Therefore, two or three insignificant increases in this indicator hardly unambiguously indicate the end of the downward trend in the pound. The "Non-commercial" group has a total of 95 thousand contracts for sale and only 29 thousand contracts for purchase. As you can see, the difference between these numbers is more than three times. Note that in the case of the pound sterling, the data from the COT report very accurately reflect what is happening in the market: the mood of traders is "very bearish", and the pound has been falling against the US dollar for a long time. In the last few weeks, the pound has been trying to show growth, but even in the illustration in this paragraph (daily TF), these attempts look pathetic. Since in the case of the pound, the COT report data shows the real picture of things, we note that a strong divergence of the red and green lines of the first indicator often means the end of the trend. Therefore, formally, now we can count on a new upward trend. However, weak geopolitical, fundamental, and macroeconomic backgrounds for European currencies continue to put pressure on them. Analysis of fundamental events. This week, the hit parade of failed macroeconomic statistics continued in the UK. GDP shrank by 0.3% in April, industrial production fell by 0.6%, the unemployment rate rose to 3.8%, and wages rose less than forecast. Individually, these reports could not and should not have provoked a strong fall in the pound. But paired with all the other factors (which we constantly talk about), traders got even more reasons to get rid of the British currency. The BA meeting and its results can be considered twofold. It turns out a picture in which the regulator seems to raise the rate, but at the same time raises the inflation forecasts for 2022. That is, we are tightening monetary policy, but we do not even believe that inflation will fall. All this is a negative background for the pound. Trading plan for the week of June 20-24: 1) The pound/dollar pair completed the upward correction very quickly and now there is very little chance of a new uptrend. The pair could not even work out the Senkou Span A line. Thus, purchases are not relevant again now, and they can be considered no earlier than fixing the price above the Ichimoku cloud. The pair retains theoretical chances of growth, but the pound's position and the aggressiveness of the bulls are not at the level to be sure of growth. 2) The pound sterling, we can say, resumed the downward trend, as it consolidated below the critical line. Formally, on a 24-hour TF, a lateral correction could begin, which is popularly called a "swing". However, so far everything looks as if the fall will continue. Currently, sales with targets of 1.2080 and 1.1410 (76.4% and 100.0% by Fibonacci) are relevant. Explanations of the illustrations: Price levels of support and resistance (resistance /support), Fibonacci levels - target levels when opening purchases or sales. Take Profit levels can be placed near them. Ichimoku indicators (standard settings), Bollinger Bands (standard settings), MACD (5, 34, 5). Indicator 1 on the COT charts - the net position size of each category of traders. Indicator 2 on the COT charts - the net position size for the "Non-commercial" group. The material has been provided by InstaForex Company - www.instaforex.com |
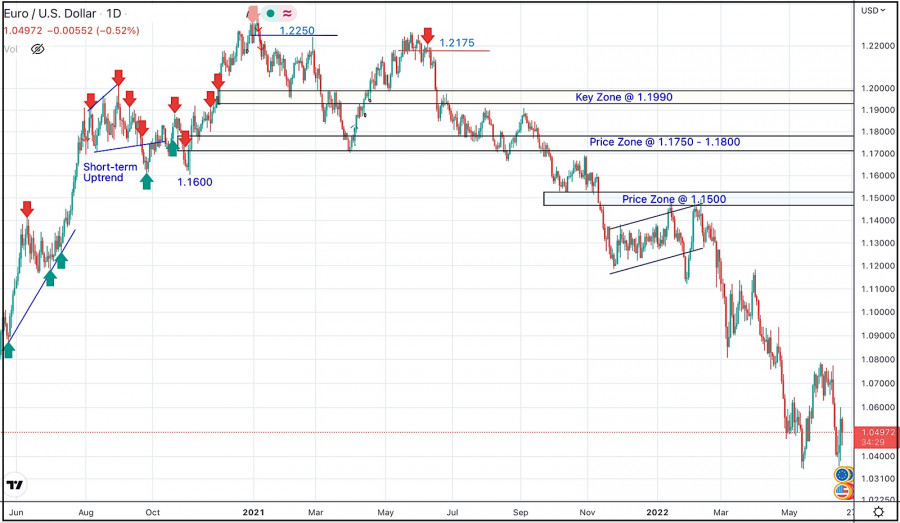
| Posted: 18 Jun 2022 03:00 AM PDT Long-term perspective.
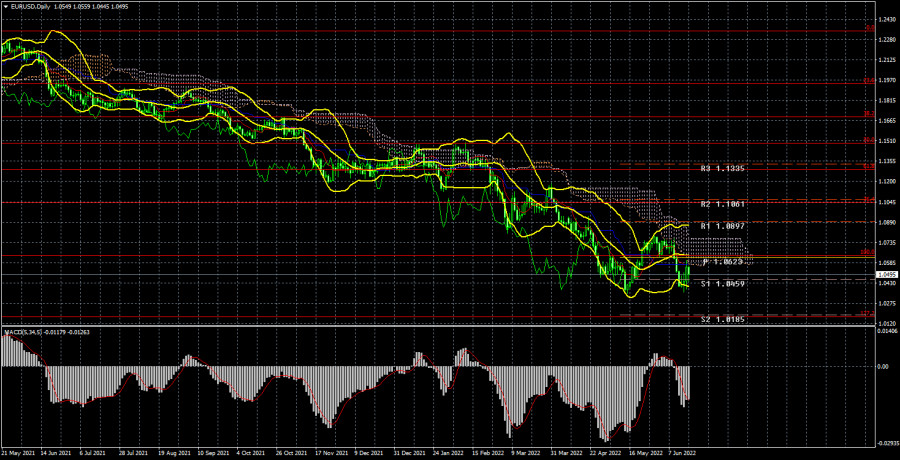
The EUR/USD currency pair has decreased by 30 points during the current week. Volatility during the week was high, and the pair did not stand in one place at all, which is not surprising, since the results of the Fed meeting were announced on Wednesday. It should be noted right away that the market seems to have started working out the results of the meeting a few days before the end of this very meeting. The market was confident that the rate would be raised by at least 0.5%, and from Monday it expected an increase of 0.75%. After the next report on US inflation, which showed another acceleration, it became clear to traders that the Fed would tighten its already aggressive monetary approach. The state of the American economy allows you to raise the rate as much as necessary, so the question was only in the pace. And if a month ago we were talking about an increase of 0.5% at the June and July meetings, now we are talking about increases of 0.75% at the same two meetings. Naturally, in the medium term, the US currency receives additional support. It is noteworthy that on the day of the publication of the results of the meeting, the European currency rose, and the next day it rose even more. However, we warned that the market could have worked out any Fed rate hike in advance, so immediately after the announcement, we saw a reverse movement. But the general picture of the state of things does not change. The fundamental background was on the side of the dollar and remained. The geopolitical conflict both had a greater negative impact on the EU economy than on the United States, and it does. The ECB has not considered the possibility of a sharp increase in rates, and it is not considering it. Therefore, we believe that the euro may continue its decline in the next few months. It has already been around its 20-year lows for several weeks, it's time to update them already. COT analysis. The latest COT reports on the euro currency raised a lot of questions. Recall that in the last few months, they have shown a frank "bullish" mood of professional players, but at the same time, the European currency has been falling all the time. At this time, the situation is beginning to change, and again, not in favor of the euro currency. If earlier the mood was "bullish", but the euro was falling, now the mood has become "bearish". During the reporting week, the number of buy contracts decreased by 23.2 thousand, and the number of shorts from the "Non-commercial" group increased by 33.3 thousand. Thus, the net position fell by 56.5 thousand contracts in just one week. From our point of view, this fact very eloquently indicates that now even major players do not believe in the euro currency. The number of buy contracts is now lower than that of sell contracts for non-commercial traders by 6 thousand. Therefore, we can well expect that now not only the demand for the US dollar will remain high, but also the demand for the euro will decline. Again, this may lead to an even greater fall in the euro currency. In principle, over the past few months or even more, the euro has not been able to show even a strong correction, let alone something more. The maximum upward movement was about 400 points. All fundamental and geopolitical factors remain in favor of the US dollar. Analysis of fundamental events. During the current week, there was not a single important report in the European Union. Only the inflation report on Friday in the second assessment can be called "conditionally important", as traders were once again convinced that inflation in the European Union is growing and does not want to follow the hopes of Christine Lagarde, who seems to continue to believe that prices will stop rising "by themselves". Recall that Lagarde (like many other heads of central banks) very much expects that supply chains will recover after the pandemic, and oil and gas prices will someday stop rising. Naturally, it will happen someday. But what if inflation is already double-digit at that time? Is the ECB ready for this option? Judging by his rhetoric and plans, he is ready. Because at the moment we are talking about one or two rate increases this year. The Bank of England and the Fed have already proved that such a tightening of monetary policy will not even be noticed by inflation. Therefore, even an increase in the rate to 1% will not stop the acceleration of price growth in Europe. Trading plan for the week of June 20-24: 1) On the 24-hour timeframe, the pair stopped just a step away from the minimum for the last 20 years – 1.0340 and has already rushed to it again. Almost all factors still speak in favor of the long-term growth of the US dollar. Traders failed to overcome the Ichimoku cloud, so the upward movement and purchases of the euro currency are still not relevant. You need to wait, at least, to overcome the Senkou Span B line, and only after that consider buying the euro currency. 2) As for the sales of the euro/dollar pair, they are still more relevant now. The price has fixed back below the critical line, so we have a new sales signal at our disposal with a target of 1.0172 (127.2% Fibonacci), which is already below 20-year lows. Explanations of the illustrations: Price levels of support and resistance (resistance /support), Fibonacci levels - target levels when opening purchases or sales. Take Profit levels can be placed near them. Ichimoku indicators (standard settings), Bollinger Bands (standard settings), MACD (5, 34, 5). Indicator 1 on the COT charts - the net position size of each category of traders. Indicator 2 on the COT charts - the net position size for the "Non-commercial" group. The material has been provided by InstaForex Company - www.instaforex.com |
| June 17, 2022 : EUR/USD daily technical review and trading opportunities. Posted: 17 Jun 2022 01:30 PM PDT
In late September, Re-closure below the price level of 1.1700 has initiated downside-movement towards 1.1500 where some recovery was witnessed. Shortly after, Price levels around 1.1700 managed to hold prices for a short period of time before another price decline took place towards 1.1200. Then the EURUSD has temporarily moved-up within the depicted movement channel until downside breakout occurred recently. Since then, the price zone around 1.1500 has applied significant SELLING pressure when a valid SELL Entry was offered upon the previous ascending movement towards it. Shortly after, the EURUSD looked oversold while approaching the price levels of 1.0800 few weeks ago. That's where the recent upside movement was previously initiated. However, the recent movement towards 1.1200 was considered for another SELL Trade which is already running in profits now. The previous ascending movement above 1.0600 enabled further advancement towards 1.0800 where bearish rejection could be applied again. The material has been provided by InstaForex Company - www.instaforex.com |
| June 17, 2022 : EUR/USD Intraday technical analysis and trading plan. Posted: 17 Jun 2022 01:29 PM PDT
The EURUSD looked oversold while approaching the price levels of 1.0800. That's when a temporary upside movement was approaching the price levels around 1.1200. This recent movement towards 1.1200 was suggested for another SELL opportunity which already reached its targets beyond the price level of 1.0400. The previous ascending movement above 1.0600 enabled further advancement towards 1.0800 where evident bearish rejection arises again. On the other hand, the pair remains trapped under selling pressure to challenge the recent daily low around 1.0350 where price action should be watched. The material has been provided by InstaForex Company - www.instaforex.com |
| June 17, 2022 : GBP/USD Intraday technical analysis and significant key-levels. Posted: 17 Jun 2022 01:28 PM PDT
The short-term outlook turned bearish when the market went below 1.3600. This enhanced the bearish side of the market initially towards 1.3360 then 1.3200 which initiated a temporary bullish movement towards 1.3600 for a final re-test. The price level of 1.3600 corresponding to the upper limit of the ongoing bearish channel initiated an aggressive bearish movement towards 1.2980 - 1.3000. The price level of 1.3000 stood a transient Support where a short-term consolidation movement existed. This happened just before two successive bearish dips could take place towards 1.2550 and 1.2160. Considerable bullish rejection was expressed around 1.2200. However, the pair failed to persist above 1.2550. This was needed to abolish the short-term bullish scenario for sometime. Instead, a quick bullish movement was executed towards 1.2650 where extensive bearish rejection existed. The GBP/USD pair remained under bearish pressure to challenge the new low around 1.2150 again which was temporarily bypassed before Immediate bullish rejection could brin the pair back above 1.2150 again. Bullish persistence above 1.2300 will probably enable further bullish continuation towards 1.2650 where further decisions can be taken. On the other hand, another bearish visit may be expected to challenge 1.1950 again if sufficient bearish momentum is expressed. The material has been provided by InstaForex Company - www.instaforex.com |
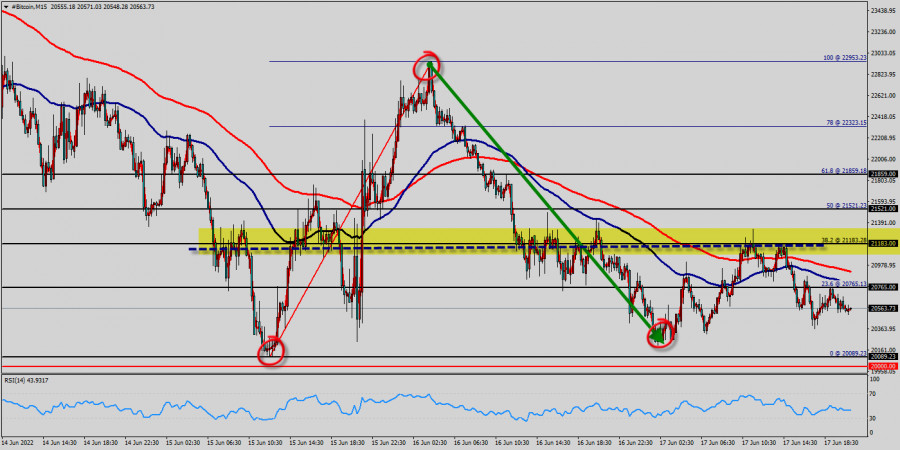
| Technical analysis of BTC/USD for June 17, 2022. Posted: 17 Jun 2022 11:33 AM PDT
Trading Bitcoin (BTC/USD) : Bitcoin is at an all-time lowest against the dollar around the spot of $20,089 - Bitcoin is inside in downward channel. Since three weeks BTC/USD decreased within an down channel, for that Bitcoin hits new lowest $22k, $21k and $20,089. Consequently, the first resistance is set at the level of $21,183. Hence, the market is likely to show signs of a bearish trend around the area of $21,183 and $20,765. Bitcoin price could be awaiting a major downswing if the digital savings manages to slice below a fatal line of the first resistance that sets at the price of $21,183 (Horizontal black line). The prevailing chart pattern suggests that if the leading cryptocurrency could be expecting to rebound from the levels of $21,183. Psychological level has already set at the price of $20,000. If the BTC/USD fails to break through the support prices of $20,000 today, the market will rise further to $21,183 so as to try to break it. Bitcoin is one the best overall investment for 2022 and coming years. However, if you want to try to improve the growth of Bitcoin, thus it seems great to buy above the last bearish waves of $20,000 and $20,100. Buy orders are recommended above the majors support rates of ($20,000 and $20,100.) with the first target at the level of $21,183. Furthermore, if the trend is able to breakout through the first resistance level of $21,183. We should see the pair climbing towards the next target of $21,521 (to test the 50% of Fibonacci retracement levels). The pair will move upwards continuing the development of the bullish trend to the level $21,859 - golden ratio 61.8%. It might be noted that the level of $21,859 is a good place to take profit because it will form a new double top in coming hours. Trading recommendations : The trend is still bullish as long as the price of $20,000 is not broken. Thereupon, it would be wise to buy above the price of at $20,000 with the primary target at $21,183. Then, the BTC/USD pair will continue towards the second target at $ $21,521 (a new target is around $21,859). Alternative scenario : The breakdown of $20,000 will allow the pair to go further down to the prices of $19k and $18k. The material has been provided by InstaForex Company - www.instaforex.com |
| Forex forecast 06/17/2022 USD/JPY, EUR/JPY, SP500, Oil and Bitcoin from Sebastian Seliga Posted: 17 Jun 2022 11:07 AM PDT Let's take a look at the technical picture of USD/JPY, EUR/JPY, SP500, Oil and Bitcoin The material has been provided by InstaForex Company - www.instaforex.com |
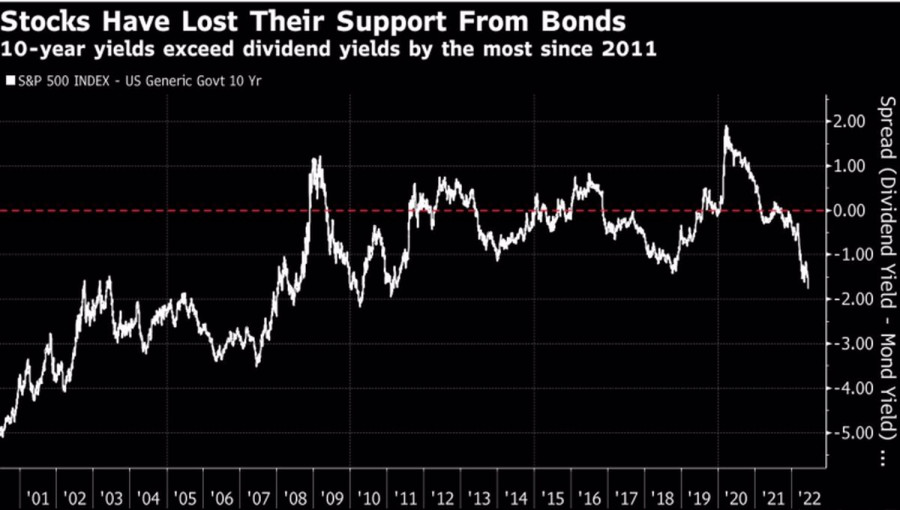
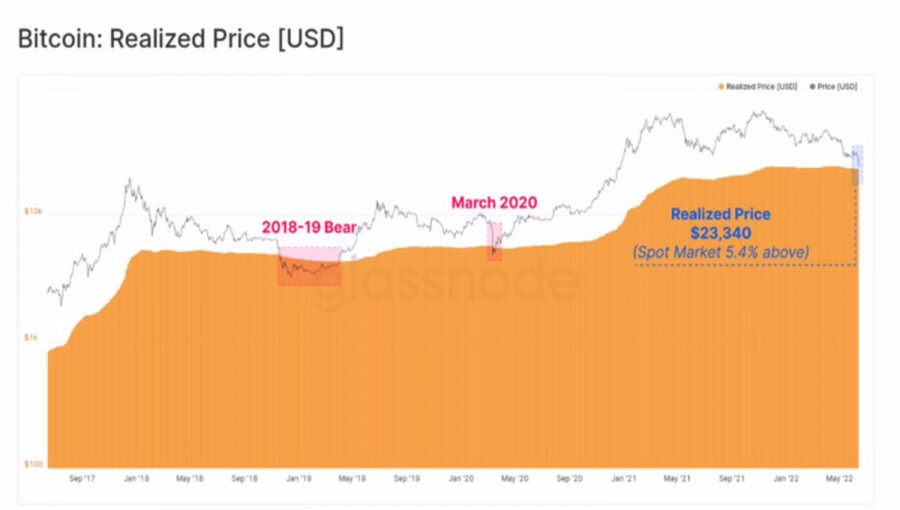
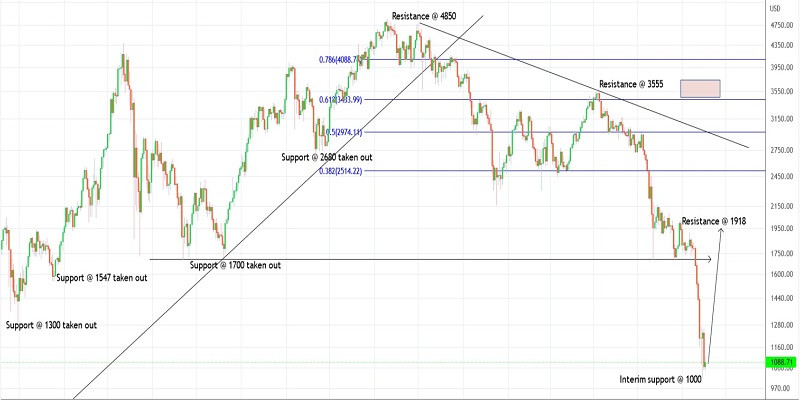
| Bitcoin went underwater: for how long? Posted: 17 Jun 2022 08:02 AM PDT Defeat and capitulation. This is how the cryptocurrency market can be characterized. The aggressive tightening of the Fed's monetary policy, rampant growth in debt rates, the collapse of the stablecoin TerraUSD and its sister token Luna, as well as the intention of the largest crypto lender Celsius Network to suspend all withdrawals, exchanges and transfers made the bulls on BTCUSD a chop. Bitcoin went underwater, collapsing to the lowest levels over the past 1.5 years, leaving in the cold most of the buyers who bought it during this period. However, according to Bill Gates, cryptocurrencies and NFTs are assets 100% based on the fool's theory. What else did you want? Bitcoin and its analogues were bought only because people were sure that someone would pay more for them after a while. You will not receive any interest or dividends on them. There are no issuing companies or states behind them. Buying air, the Fed only inflated the bubble with its colossal monetary stimulus, which plunged real Treasury yields deep into the red and supported the entire risky asset class. The debt sell-off triggered by the Fed's aggressive monetary tightening returned the ratio between S&P 500 stock dividend yields and bond dividend yields to the lowest levels since the 2008 recession. Financial markets have returned to the era before the Lehman crisis, when bonds did not support stocks. Dynamics of the ratio of dividend yield on shares and interest on bonds
It is difficult to expect that a decrease in P/E to 15.7, the average value over the past 15 years, will reverse the downward trend in the S&P 500. In December 2018, the multiplier fell to 13.8, and in March 2020 to 13.4. As cheap as stocks look, they can get even cheaper. Given the close correlation between BTCUSD and the Nasdaq Composite, this does not bode well for fans of the leader in the cryptocurrency sector. Optimists hope that Bitcoin will be able to stabilize near the round mark of 20,000, as it did in 2018–2019 with the level of 5,000 and in 2014–2015 with the level of 300. Pessimists say that the peak to 10,000 will continue. At the same time, the lower the BTCUSD quotes will sink, the faster the sales will go. This is due to the departure of the token from the average price at which it was purchased. Parallels can be drawn with diving. In previous cases, in 2018–2019 and March 2020, it turned out to be relatively short. How will it be this time? Dynamics of BTCUSD and the average purchase price of Bitcoin
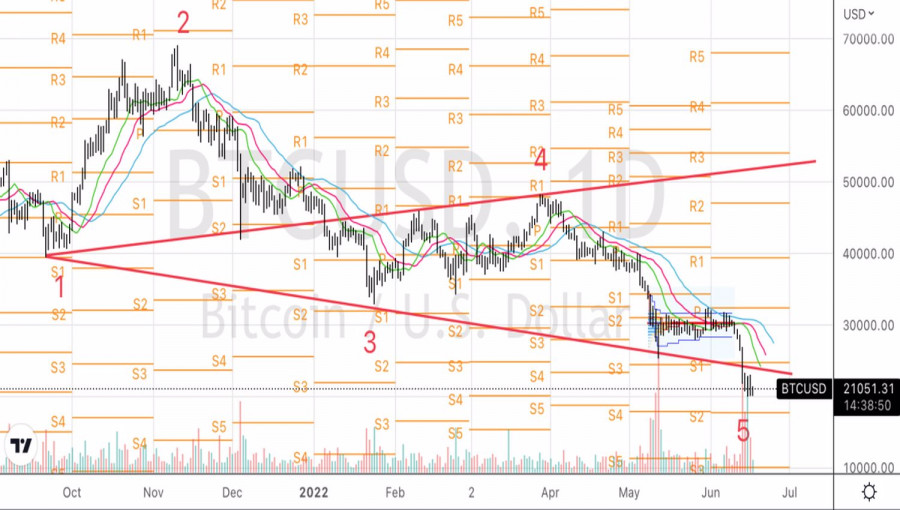
Personally, I remember the story of 2013 with gold. Then they also said that it could not sink too deep, since the cost of production is at the level of $1,300 per ounce. In fact, the precious metal almost reached $1,000. BTCUSD, Daily chart
Technically, to implement the reversal pattern of the Wolfe Wave, a return of Bitcoin to 30,000 is required. Until this happens, we use the rebound from the resistances at 23,300, 24,300, and 25,000 for sales. The material has been provided by InstaForex Company - www.instaforex.com |
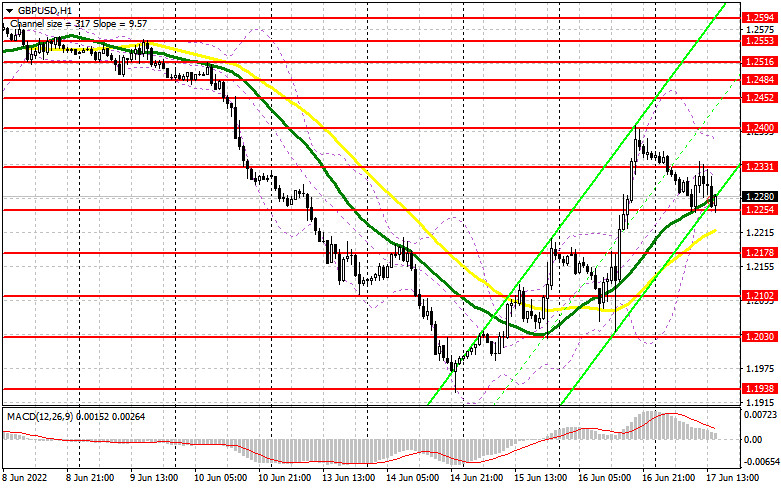
| Technical analysis of GBP/USD for June 17, 2022 Posted: 17 Jun 2022 06:56 AM PDT
|
| GBP/USD: trading plan for American session on June 17 (analysis of morning trades) Posted: 17 Jun 2022 06:53 AM PDT In my morning article, I focused on the level of 1.2325 and recommended making decisions to enter the market, taking it into account. Let's observe the 5-minute chart and analyze it. The pound's failed attempt to return above 1.2325 has resulted in formation of several false breaks which gave signals to sell the pound. Each of them outlined the fall from 60 to 70 pips. Consequently, in the morning the pair did not reach the level of 1.2241 due to the pound's decline. Therefore, it was not possible to await the formation of good entry points there. Besides, what were the euro's entry points this morning?
To open long positions in GBP/USD, you need: Although the technical picture was revised for the second half of the day, the trading strategy did not change. The US industrial production data will unlikely affect the pound significantly. Therefore, further upward correction is possible. Apparently, the volatility will surge after Fed Chairman Jerome Powell delivers his speech. Only the formation of a false break at 1.2254 which was revised and where the moving averages are, will give a signal to open new long positions with the possibility to rise to the nearest resistance at 1.2331. The bulls' key goal will be to regain control of this level as they failed to do it in the morning. This move will fuel demand for the pound and improve the market sentiment. A breakout and a top-down test of 1.2331 will give a buy signal counting on this week's high renewal near 1.2400. A breakout of this level, which occurred yesterday, will form another long entry point to 1.2452 where I recommend taking profits.The level of 1.2484 will be considered a more distant target. In case the GBP/USD pair falls and there are no buyers at 1.2254, the pressure on the pair will increase. In this case, I recommend opening new long positions only if there is a false break from 1.2178. It is possible to buy the GBP/USD pair on the rebound from 1.2102 or even lower, around 1.2030 with a target of 30-35 pips intraday correction. To open short positions on GBP/USD, you need: The bears are trying to take control of the market. However, they have difficulty with it. To build a downward correction, the bears need to reach 1.2254. Nevertheless, they failed to do it in the morning. Only consolidation below this range and reversed bottom-up test will give an entry point to short positions with possible return to 1.2178. The level of 1.2102 will be a more distant target where I recommend taking profits. In the case of the pound's rise, bears are likely to move to the nearest resistance at 1.2331. However, be careful while selling as this level has already been worked out in the morning. Only a false break similar to the discussed above will provide a good entry point to short positions counting on the downtrend resumption. In case there is lack of activity at 1.2331, the pair might surge again amid the cancellation of stop-loss orders of speculators. Therefore, I recommend not to open short positions to 1.2400. However, it is possible to sell the pound only in case of a false break as exit beyond this range will fuel demand for GBP/USD. Short positions can be opened from 1.2452 or even higher, from 1.2484, counting on the pair's downward rebound by 30-35 pips within a day.
The COT report from June 7 recorded a large increase in long positions and only a small increase in short positions. However, it is clear that the current picture is quite different: the last three trading days turned the market upside down. The further direction of the pair, which is near its year lows, depends on the Federal Reserve's meeting and its decisions. A more aggressive policy will lead to the GBP/USD pair's further decline as the UK economy is gradually collapsing according to the latest data. This fact undermines investors' confidence. The Bank of England's meeting is unlikely to support the pound as the regulator will further implement its policy of raising rates. I doubt its further aggressive moves aimed at fighting inflation by reducing economic growth. Although Bank of England Governor Andrew Bailey states that the regulator will definitely raise the interest rates, there are no signs of a more aggressive approach to the monetary policy either. The COT report indicated that long non-commercial positions rose by 3,830 to 34,618, while short non-commercial positions increased by 535 to 105,428. This led to a decrease in the negative non-commercial net position from -74,105 to -70,810. The weekly closing price climbed by 1.2481 to 1.2511.
Indicator Signals: Moving averages. Trading is conducted around the 30 and 50 day moving averages, indicating some uncertainty before significant statistics..Note. The period and prices of moving averages are considered by the author on hourly chart H1 and differ from the common definition of classic daily moving averages on daily chart D1. Bollinger Bands. In the case the GBP/USD pair rises, the middle boundary of the indicator will provide resistance around 1.2370. Description of indicators
|
| Technical analysis of EUR/USD for June 17, 2022 Posted: 17 Jun 2022 06:45 AM PDT
The EUR/USD pair continues to move upwards from the level of 1.0435. Today, the first support level is currently seen at 1.0435, the price is moving in a bullish channel now. Furthermore, the price has been set above the strong support at the level of 1.0435, which coincides with the 23.6% Fibonacci retracement level. This support has been rejected three times confirming the veracity of an uptrend. According to the previous events, we expect the EUR/USD pair to trade between 1.0435 and 1.0602. Also, the daily resistance and support are seen at the levels of 1.0602 and 1.0435 respectively. Therefore, it is recommended to be cautious while placing orders in this area. The support stands at 1.0435, while daily resistance is found at 1.0602. Therefore, the market is likely to show signs of a bullish trend around the spot of 1.0435. The market is likely to show signs of a bullish trend around the spot of 1.0435. Moreover, the major support is also coinciding with the major support today. Additionally, the RSI is still calling for a strong bullish market as well as the current price is also above the moving average 100. Therefore, it will be advantageous to buy above the support area of 1.0435. In other words, buy orders are recommended above the spot of 1.0435 with the first target at the level of 1.0554; and continue towards 1.0602. However, if the EUR/USD pair fails to break through the resistance level of 1.0602 today, the market will decline further to 1.0383 so as to test the weekly bottom - the last bearish wave. The material has been provided by InstaForex Company - www.instaforex.com |
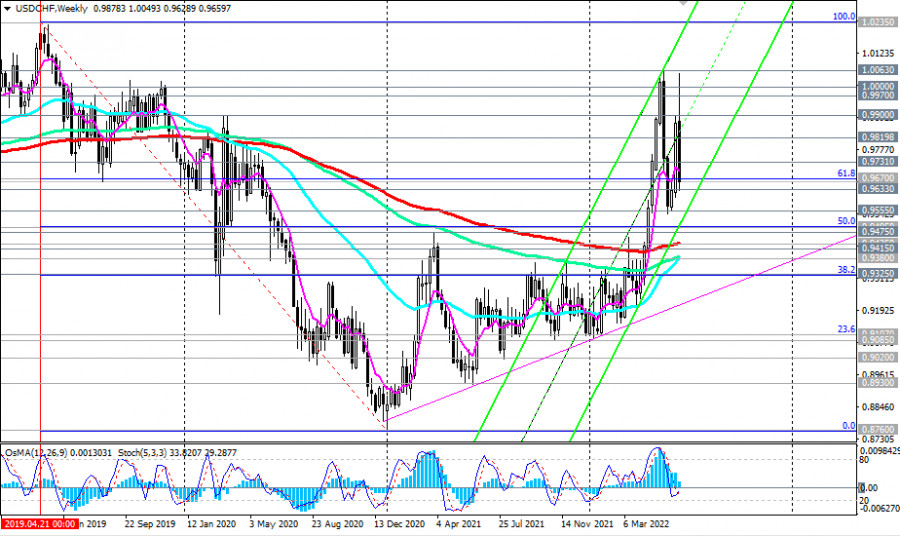
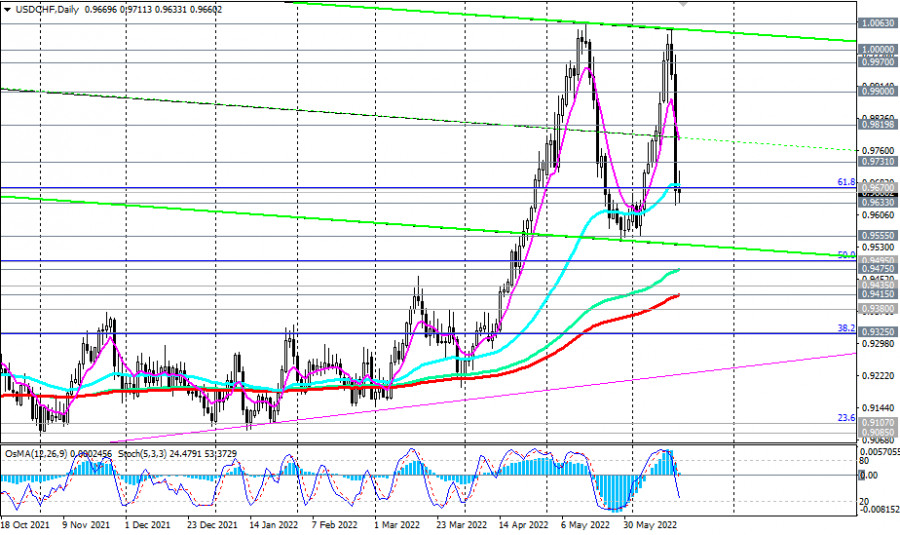
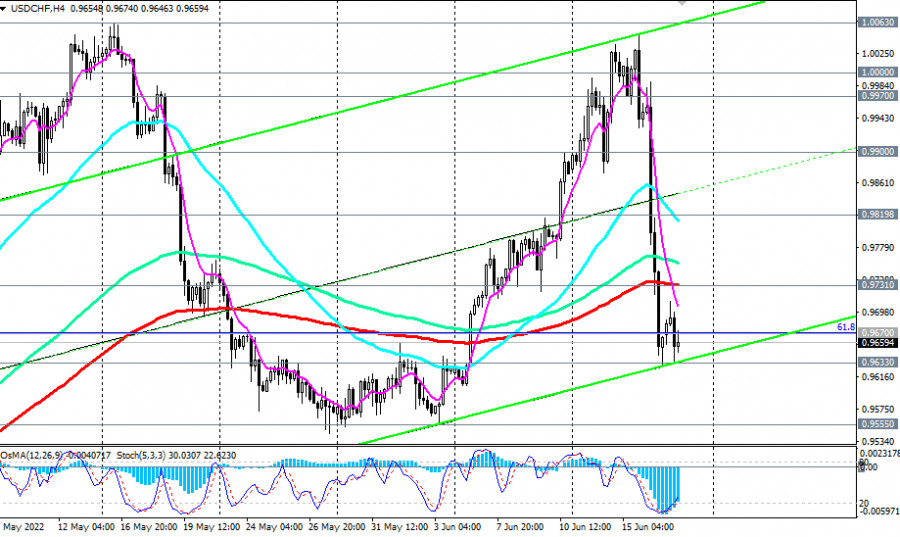
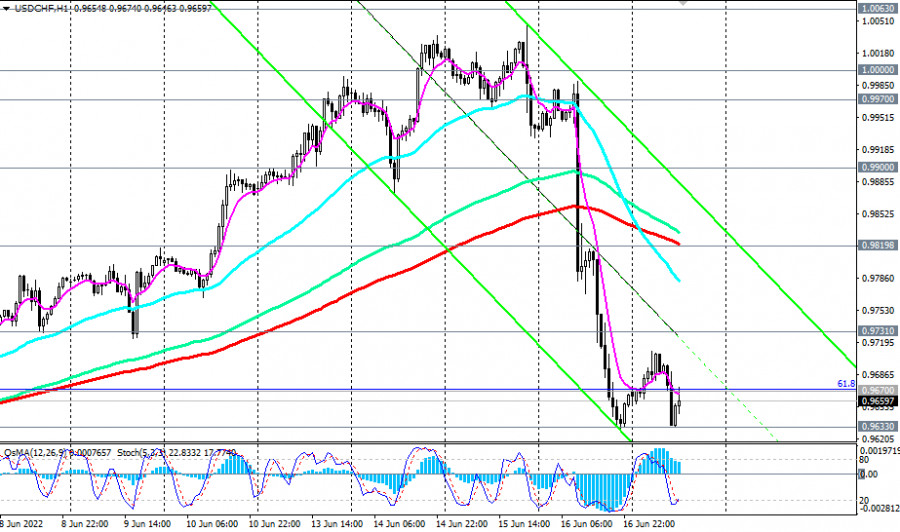
| USD/CHF Technical Analysis and Trading Tips on June 17, 2022 Posted: 17 Jun 2022 06:44 AM PDT
As of this writing, USD/CHF is trading near 0.9660, down from an intra-month high of 1.0049 (the last time the price was near this mark was in May 2022 and in May 2019). Despite today's renewed dollar strength, the USD/CHF remains under strong negative pressure after yesterday's unexpected decision by the Swiss Nation Bank to raise interest rates. As SNB Chairman Thomas Jordan said yesterday, the Swiss franc is no longer grossly overvalued, i.e. it accepts the possibility of further strengthening of the franc, which the SNB so consistently fought against recently by keeping the interest rate on deposits at a record low of -0.75% and intervening in the trading market with the sale of the franc.
Yesterday, USD/CHF reached a local low of 0.9629, breaking through an important support level of 0.9670 (50 EMA on the daily chart and the 61.8% Fibonacci retracement to the downward wave that began in April 2019 near 1.0235).
The breakdown of yesterday's local low may become a driver of further USD/CHF decline towards the local support level of 0.9555, the breakdown of which, in turn, will strengthen the negative dynamics of USD/CHF, sending it to the zone of key support levels 0.9435 (200 EMA on the weekly chart) and 0.9415 (200 EMA on the daily chart), separating the long-term bullish trend of the pair from the bearish one.
In an alternative scenario, and in view of the renewed strengthening of the dollar, an upward correction may begin from the current levels. The first signal to resume long positions will be a breakdown of the important resistance level 0.9731 (200 EMA on the 4-hour chart). In case of a breakdown of the resistance level 0.9820 (200 EMA on the 1-hour chart), USD/CHF is likely to continue rising towards recent highs above 1.0000. Support levels: 0.9630, 0.9555, 0.9500, 0.9495, 0.9475, 0.9435, 0.9415, 0.9380, 0.9325 Resistance levels: 0.9670, 0.9731, 0.9800, 0.9820, 0.9900, 0.9970, 1.0000, 1.0060 Trading Tips Sell Stop 0.9615. Stop-Loss 0.9715. Take-Profit 0.9555, 0.9500, 0.9495, 0.9475, 0.9435, 0.9415, 0.9380, 0.9325 Buy Stop 0.9715. Stop-Loss 0.9615. Take-Profit 0.9731, 0.9800, 0.9820, 0.9900, 0.9970, 1.0000, 1.0060 The material has been provided by InstaForex Company - www.instaforex.com |
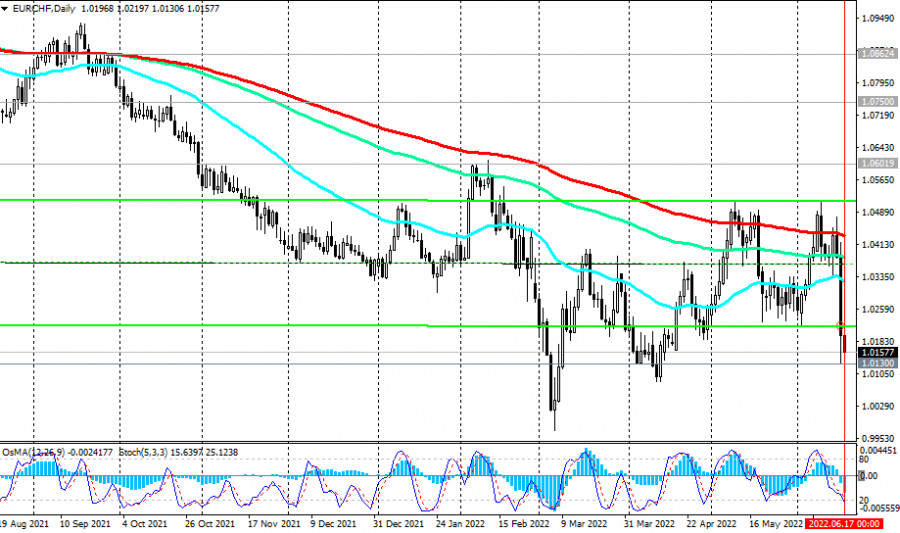
| EUR/CHF: Features and recommendations Posted: 17 Jun 2022 06:30 AM PDT
EUR/CHF belongs to the category of "cross-pairs" and shows how many units of the Swiss national currency (franc) you need to pay for one euro, which is the legal tender of 19 countries (as of September 2020) that are members of the eurozone (Austria, Belgium, Germany, Greece, Ireland, Spain, Italy, Cyprus, Latvia, Lithuania, Luxembourg, Malta, the Netherlands, Portugal, Slovakia, Slovenia, Finland, France, Estonia) and the national currency of another 12 states, 7 of which are located in Europe. The base currency in the EUR/CHF pair is the euro. This means that the commodity in the EUR/CHF pair is the euro, and the Swiss franc is the second currency in the pair, with which the base currency (the euro) is bought. The euro is included in the IMF basket, consisting of five major world currencies (in descending order): the US dollar, the euro, the yuan, the yen, and the pound sterling. At the same time, the euro and the franc are the world's reserve currencies, and the franc is considered the most stable currency in the world. At the moment (after the meeting of the Swiss National Bank on June 16, 2022, when the central bank of this country unexpectedly raised the key interest rate on deposits by 0.50% to -0.25%), the EUR/CHF pair is trading on the Forex market at a price below 1.0200. This means that for one euro they give less than 1.0200 francs.
Features of trading the EUR/ CHF pair 1. Both the euro and the franc and the EUR/CHF pair are characterized by high liquidity. At almost any moment, there will be both buyers and sellers for the franc or euro. The trading volumes of the EUR/CHF pair are quite high. According to various estimates, the euro accounts for slightly less than 30% of the total trading volume on the foreign exchange market. 2. Germany, whose economy is the locomotive of the Eurozone economy, at the beginning of 2020 was in 5th place in the world in terms of GDP (3.13%), while Switzerland is in 39th place (0.40%). 3. At the same time, Switzerland ranks 9th in the world in terms of GDP (according to the IMF rating) per capita, and its economy is one of the most stable in the world. The share of Switzerland in world GDP is approximately 0.40%, the share of the Eurozone is 17%. 4. The EUR/CHF pair is actively traded throughout the trading day. The highest peak of trading activity with the euro, the franc, and the EUR/CHF pair and the largest trading volumes occur during the European session (06:00 – 16:00 GMT). Moreover, the first two or three hours at the beginning of trading in London (07:00 – 10:00) are the most active in trading the EUR/CHF pair. In the period from 10:00 to 15:00 (GMT), sharp, as it seems, sometimes unreasonable, movements of the pair are often observed, and in any direction. 5. The surge in trading volatility in the EUR/CHF pair falls, in addition to the release of news of a political nature, during the publication of important macroeconomic indicators for the Eurozone, Germany, and Switzerland. The following macroeconomic factors and indicators give the greatest volatility to the EUR/CHF pair:
Strong macroeconomic data in Switzerland or the euro area lead to the strengthening of the franc or the euro, respectively, as they contribute to the growth of "tough sentiment" of the central banks of Switzerland or the Eurozone regarding an increase in the interest rate. And this is a positive factor for the national currency, which leads to an increase in its value. 6. Important political events in Switzerland, the euro area, and in the world also affect the quotes of currencies, and above all, the franc and the euro. The sale of assets on the stock markets of Europe leads, as a rule, to an increase in the value of the euro, including in the EUR/CHF pair. And vice versa. The growth of the stock market in the euro area, as a rule, is accompanied by a decrease in the value of the euro. 7. Although the franc has recently lost its status as a safe-haven currency due to active intervention in the trades of the Swiss central bank, it is still in active demand among investors during periods of economic or political uncertainty in the world. The franc retains a fairly strong direct correlation with the yen and gold, which have the status of safe-haven assets in the financial markets. 8. Investors still have fresh memories of when the Swiss National Bank "untied" the franc rate from the euro on January 15, 2015. The EUR/CHF pair saw a dramatic jump in volatility. In one day the EUR/CHF lost 2250 pips. In the next 4 weeks, the EUR/CHF pair "beat off" about a third of the losses, however, the EUR/CHF pair never again rose to levels near the 1.2000 mark. Currently, the EUR/CHF pair is trading near the 1.0700 mark, and the SNB periodically interferes in the trading in the foreign exchange market with the sale of the franc. In recent years, the SNB has traditionally considered the franc overbought and relatively expensive, which, according to the bank, hinders the growth of the Swiss economy and harms the country's exporters. 9. The intraday volatility of the EUR/CHF pair fluctuates in different periods of the month and year. On average, it is 65 points, but it can exceed 150 points during periods of publication of important news of a political or economic nature. 10. Many traders prefer to trade this pair at the end of the trading day and the American session. The strategy is scalping. The material has been provided by InstaForex Company - www.instaforex.com |
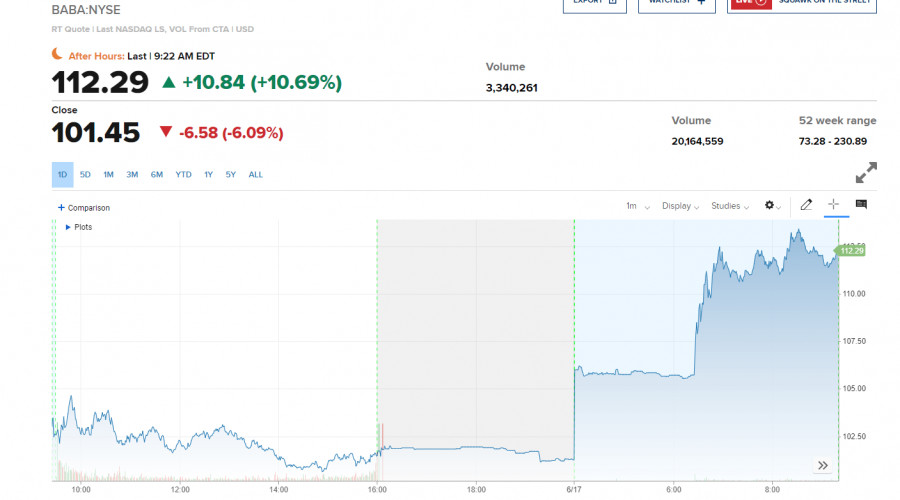
| Posted: 17 Jun 2022 06:24 AM PDT US stock index futures recovered slightly early on Friday after yesterday's sell-off. Some investors assumed Thursday's sell-off, which was caused by recession fears, has peaked. S&P 500 and Nasdaq 100 futures increased by 1%, but lost their gains at the time of writing, indicating the upward sentiment in the market was fleeting. Another sell-off in the US stock market is possible at the end of this week, particularly after another statement by Fed chairman Jerome Powell.
The markets are very likely to finish this week in negative territory, pushed down by the interest rate increase, which will continue in July. The rate hike is set to remove liquidity from the markets, resulting in losses for various asset classes. Currently, global stock indexes experience one of the worst weeks since the crash of early 2020 caused by the coronavirus pandemic. However, some investors expect regulators to adjust their monetary tightening cycles, which should help markets recover in the near future. Many market players now wonder about the size of the rate hike, as well as how much the economy will slump. Premarket movers Shares of Adobe fell by 3.7% during the premarket after the software company issued a weaker-than-expected revenue forecast for the current quarter and the full year. However, the company's quarterly results exceeded market expectations.US Steel gained 7.7% in the premarket following the release of better-than-expected guidance for the current quarter. Rising demand and higher prices of steel also boosted the company's performance.Alibaba jumped by 9.2% during the premarket after Reuters reported that China's central bank approved Alibaba-affiliate Ant Group's application to form a financial holding company. That revives hopes of a possible Ant Group initial public offering.Shares of American Express advanced by 1.5% after Baird upgraded the company's rating to "outperform" from "neutral". Baird noted that "relentless panic selling" has provided an attractive buying opportunity.
On the technical side, the S&P 500 has plunged to new yearly lows. The only thing bullish traders can do today is steer the index above the resistance at $3,708. A breakout above this level would send the S&P 500 towards $3,730, where major market players would come into play. Some traders could likely take profits at this level as well. From there, the next target for the index is $3,755, but it is unlikely to reach it. If pessimism in the market prevails amid renewed speculation about fighting high inflation, the instrument could fall towards the closest support at $3,677. If the S&P 500 breaks below this level, it could result in a new sell-off at $3,640 and $3,608. The material has been provided by InstaForex Company - www.instaforex.com |
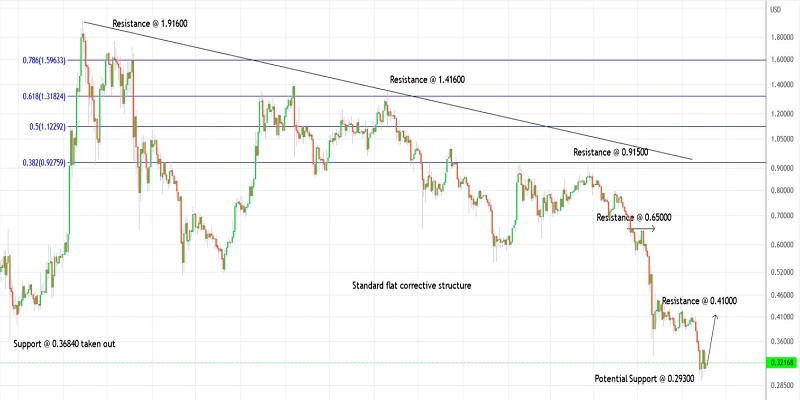
| Trading plan for Ripple for June 17, 2022 Posted: 17 Jun 2022 06:20 AM PDT
Technical outlook:Ripple dropped through the $0.29300 lows early this week before finding support again. The crypto confirmed a bullish Morning Star candlestick pattern after bouncing from the above and rose up to the $0.34600-700 mark thereafter. High probability remains for bulls to hold prices above $0.29300 and continue pushing higher towards the $0.41000 initial resistance in the near term. Ripple has been dropping since reaching the $1.91600 level, which was registered in April 2021. The above drop looks like a complex corrective structure, which was completed around $0.29300 early this week. A break above the initial price resistance seen through the $0.41000 mark would confirm that bulls are back in control in the near term. Ripple might continue its drop further but ideally after a meaningful corrective rally towards at least the $0.91500 level. Please note that it is passing close to the 0.382 Fibonacci retracement of the entire drop between the $1.91600 and $0.29300 levels respectively. Traders might be willing to initiate fresh long positions against the $0.29300 mark. Trading plan:Potential rally through $0.91500 against $0.29300 Good luck! The material has been provided by InstaForex Company - www.instaforex.com |
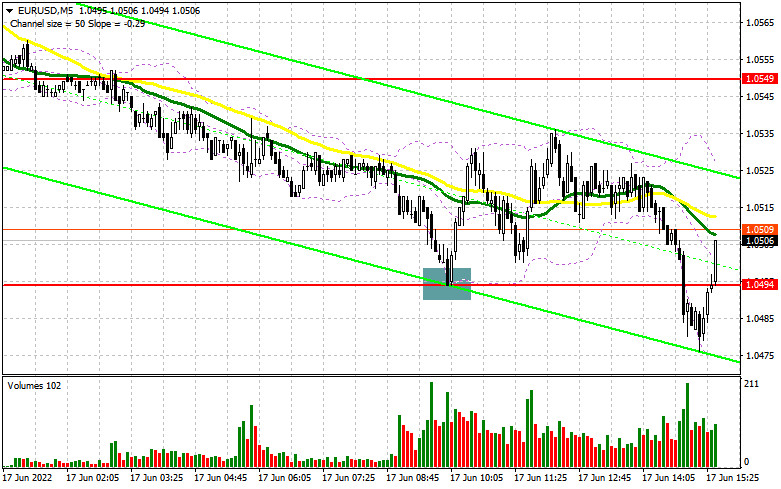
| Posted: 17 Jun 2022 06:09 AM PDT In my forecast this morning, I drew your attention to the level of 1.0494 and recommended entering the market from it. Let's have a look at the 5-minute chart and analyze what happened. The inflation in the eurozone matched economists' expectations, which put pressure on the euro in the first half of the day. Bulls took advantage of this and managed to keep the price above the support of 1.0494. Therefore, a false breakout and a signal to open long positions were formed. As a result, the pair increased by about 40 pips. At the time of writing, bulls are trying to hold the price above 1.0494, so we can expect that the upward correction is likely to continue.
Long positions on EUR/USD: In the afternoon, we expect some releases that may hurt the US dollar, allowing it to regain control over 1.0494. A weak report on US industrial production can push the pair above 1.0494, and a top/bottom test of that level may create a signal for the opening of long positions, aiming to return to 1.0549. If the Fed Chairman's statements do not bring back the demand for the US dollar, it is possible that we will see a breakthrough and a fixation above 1.0549 in the second half of the day. A breakout and a top/bottom test of this level are likely to trigger Stop Loss orders of speculative sellers, which will give a signal to open long positions while allowing a possible correction to 1.0599, where traders may lock in profits. If the EUR/USD pair declines in the afternoon and bulls show weak activity at 1.0494, the pressure on the euro will increase. This would activate buyers' Stop Loss orders, which may push the pair down to 1.0429. It will also allow the pair to lose almost the whole growth gained yesterday, which will threaten the pair's further uptrend next week. The optimal scenario to open long positions there would be a formation of a false breakout. It is better to buy the euro on a rebound only from 1.0360 or even lower near 1.0303, allowing an upward intraday correction of 30-35 pips. Short positions on EUR/USD: Bears showed strong activity in the first half of the day and they are counting on good US statistics now. If there is a lack of activity from bulls at 1.0494, the pair may decline, especially if we hear hawkish statements from Powell today. A breakthrough and a consolidation below 1.0494 as well as a retest of this level to the upside, are likely to create an additional sell signal. It may also trigger bulls' Stop Loss orders and a larger decline to 1.0429. A breakthrough of this level is likely to open a direct way to 1.0360 and 1.0303, where traders may close their short positions and generate profit. If the pair rises during the US session after an unsuccessful attempt to consolidate below 1.0494, it would be better to postpone opening short positions until the price reaches the level of 1.0549. The formation of a false breakout at this level will signal a new starting point for the continuation of the bear market. It is possible to sell the euro on a rebound from the high of 1.0599 or 1.0640, allowing a downward correction of 30-35 pips.
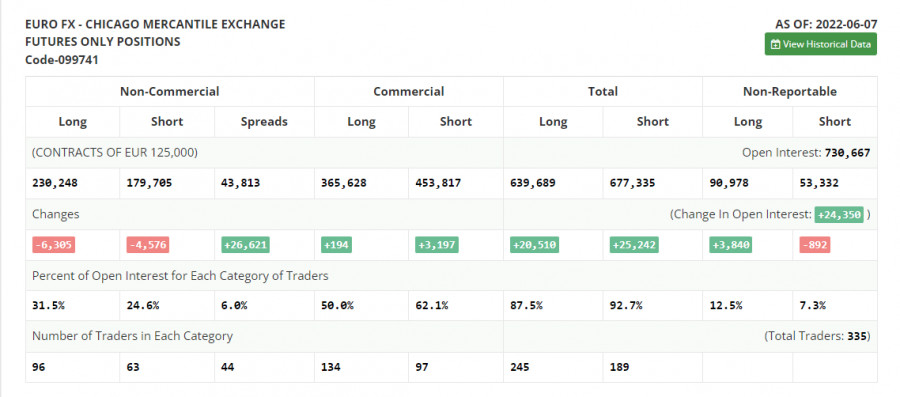
The COT report for June 7 logged a sharp decline in both long and short positions. Many traders were rather cautious about the European Central Bank meeting. For this reason, the market showed quite an idle trading. As time showed - being out of the market was the ideal scenario. The ECB Governing Council said last week that it would raise the rate at the following meeting, but even that did not save the euro in the face of the highest inflation in the US in 40 years. Friday's data last week caused all risky assets to fall, which also affected the European currency. The further direction of EUR/USD will depend on monetary policy decisions made by the Federal Reserve and the outlook for the coming years. If the central bank continues to act aggressively, it is likely that the euro will sink deeper, which may lead the pair to new yearly lows. The COT report showed that long non-commercial positions fell by 6,305 to 230,248, while short non-commercials fell by 4,576 to 179,705. Despite the low quotations on the euro, this does not make it very attractive. On the week, total non-commercial net positions declined to 50,543 from 52,272 a week earlier. The weekly closing price fell to 1.0710 from 1.0742.
|
| Trading plan for Ethereum on June 17, 2022 Posted: 17 Jun 2022 05:59 AM PDT
Technical outlook:Ethereum dropped through the $1,012 low early this week before finding interim support. The crypto is seen to be trading close to the $1075 mark and is expected to resume its rally towards $1,920 initial resistance soon. Bulls are looking poised to hold prices above the $1,000 mark to keep the near term structure intact and constructive. Ethereum has carved a meaningful downswing between $4,850 and $1,012 levels as seen on the daily chart. Ideally, prices need to retrace the above drop before the next leg lower could resume. Immediate price resistance is seen through the $1,920 mark and a minimum push towards that is expected in the near term. Ethereum might have terminated its decline around the $1,012 mark and could be preparing to resume its rally. A push above $1,244 will be required to confirm that bulls are back in control and further acceleration towards the $1,920 mark. Aggressive traders might be preparing to initiate fresh long positions against $1,000. Trading plan:Preparing to resume higher through $1,920 mark against $1,000 Good luck! The material has been provided by InstaForex Company - www.instaforex.com |

 The GBP/USD pair is at an all-time low against the dollar around the spot of 1.1933. The GBP/USD pair is inside in downward channel. Closing below the major resistance (1.2342 - 61.8% of Fibonacci) could assure that GBP/USD will move lower towards cooling new lows. The GBP/USD pair is continuing dropping by market cap at 3% in a day, 16.33% in a week, and 61.09% in a month, and is trading at 1.2230 after it reached 1.2186 earlier. The GBP/USD pair has been set below the strong resistance 1.2342, which coincides with the 61.8% Fibonacci retracement level. This resistance has been rejected three times confirming the veracity of an downtrend. RSI (14) sees major descending resistance line acting as resistance to push price down from here (1.2342). Equally important, the RSI and the moving average (100) are still calling for an downtrend. Therefore, the market indicates a bullish opportunity at the level of 1.2264 in the H1 chart. Also, if the trend is buoyant, then the currency pair strength will be defined as following: GBP is in an uptrend and USD is in a downtrend. The market is likely to show signs of a bearish trend around the spot of 1.2342 and/or 1.2264. Sell orders are recommended below the area of 1.2264 with the first target at the price of 1.2186; and continue towards 1.2089 in order to test the last bearish wave. The descending movement is likely to begin from the level 1.2264 with 1.2186 and 1.2089 seen as targets. Amid the previous events, the pair is still in a downtrend, because the GBP/USD pair is trading in a bearish trend from the new resistance line of 1.2264 towards the major support level at 1.2089 in order to test it. If the pair succeeds to pass through the level of 1.2089, the market will indicate a bearish opportunity below the level of 1.2089. On the other hand, if the GBP/USD fails to break through the support price of 1.2089 today, the market will rise further to 1.2342 in coming hours.

| You are subscribed to email updates from Forex analysis review. To stop receiving these emails, you may unsubscribe now. | Email delivery powered by Google |
| Google, 1600 Amphitheatre Parkway, Mountain View, CA 94043, United States | |


Comments