Forex analysis review
Forex analysis review |
- USD/JPY. The growth of the Japanese currency: a downward trend or a house of cards?
- January 21, 2021 : EUR/USD daily technical review and trading opportunities.
- January 21, 2021 : EUR/USD Intraday technical analysis and trading plan.
- January 21, 2021 : GBP/USD Intraday technical analysis and significant key-levels.
- Wave analysis of BTC/USD on January 21, 2022
- Wave analysis of EUR/USD on January 21, 2022
- The fate of the digital dollar for the next five years has been decided
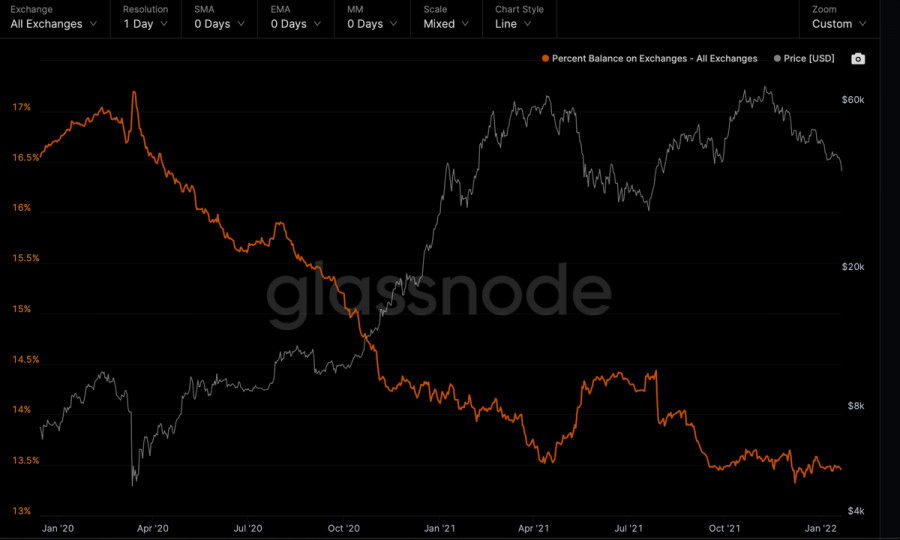
- Reasons for bitcoin's collapse despite large purchases of whales and minimum balance on cryptocurrency exchanges
- Trading signals for GOLD on January 21 - 24, 2022: sell in case of pullback around $1,843 ( 6/8 - diamond pattern)
- Technical analysis of EUR/USD for January 21, 2022
- EUR/USD: Did the dollar peak?
- NFLX stock price plummets towards $400 after earnings.
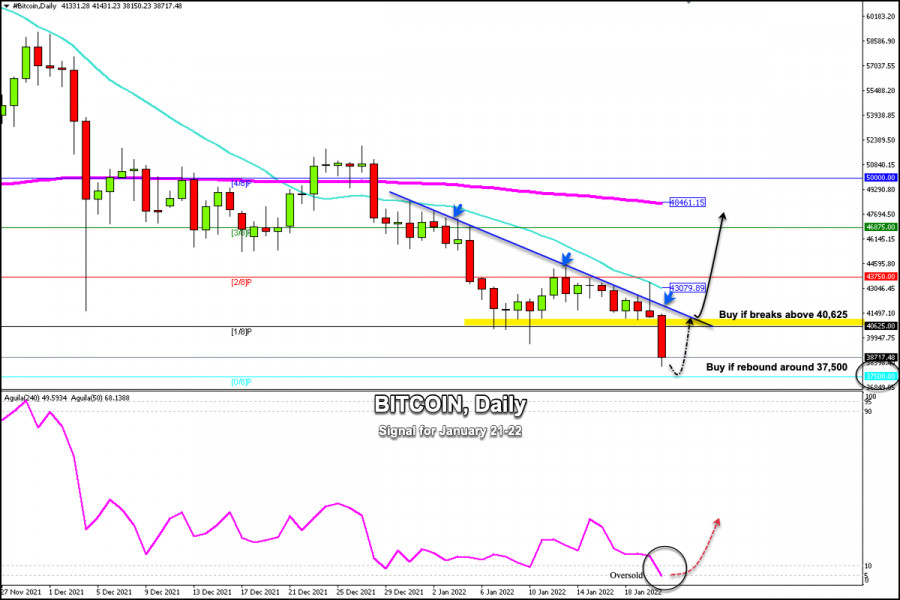
- Trading signals for BITCOIN on January 21 - 22, 2022 : buy in case of rebound around $ 37,500 (0/8)
- EURUSD bounces off short-term support.
- Ichimoku cloud indicator analysis on Gold for January 21, 2022.
- Crypto market collapses in 24 hours due to US and Russia news
- Weekly Dollar index analysis.
- New lows for Bitcoin.
- Asian stock markets tumble due to high inflation
- BTC down but mining activity rises. Bitcoin mining difficulty hits all-time highs
- BTC analysis for January 21,.2022 - Potential for upside rotation
- Video market update for January 21,,2022
- Bitcoin Updates Six-month Low, Gets One Step Closer to Bear Market
- GBP/USD update for January 21, 2022 - Breakout of exhaustion pattern to the upside
- Analysis of Gold for January 21,.2022 - Potential for the upside movement
| USD/JPY. The growth of the Japanese currency: a downward trend or a house of cards? Posted: 21 Jan 2022 09:50 AM PST The yen paired with the dollar continues its downward path. The USD/JPY pair in early January updated the five-year price maximum, reaching 116.36, but then turned around and began to slide down systematically. In two and a half weeks, the price has decreased by almost 300 points, despite the fairly strong positions of dollar bulls. In many pairs of the "major" group, the greenback is more resolutely on the defensive, while waiting for the results of the January Fed meeting. However, when paired with the yen, the dollar is consistently getting cheaper. At the same time, the Japanese currency ignores "its" fundamental factors. For example, the "dovish" remarks of the head of the Bank of Japan were ignored by traders. All this suggests that the Japanese currency is now in high demand as a protective asset. This is an important point that speaks volumes. In particular, the fact that the USD/JPY's downward trend depends on external circumstances, which are mostly caused by market nervousness on the eve of the January meeting of the Federal Reserve.
However, Friday's release of data on inflation growth in Japan still supported the yen. Thanks to a combination of fundamental factors, sellers of USD/JPY were able to test the support level of 113.60 (the lower line of the Bollinger Bands indicator) during the Asian session on Friday. The last time the pair was in this price area was a month ago - on the 20th of December. Still, it is too early to talk about a trend reversal: many factors speak in favor of further growth of USD/JPY in the medium term, at least in the context of testing the borders of the 115th figure. Japanese inflation in this case will not save the yen, especially since Friday's release also has its flaws. On the one hand, the data surprised with its "capital" indicator. The overall consumer price index in December not only went into the "green zone", exceeding the forecast values, but also updated a two-year high: the last time the indicator was at this level was in January 2020. It can also be noted here that from November 2020 to October 2021, the overall CPI was in the negative area, and only at the end of last year began to "show signs of life". And Friday's breakthrough would really surprise if not for one "but" - the rest of the components of the release showed either weak or negative dynamics. Thus, the consumer price index excluding food prices came out at around 0.5% after a similar increase in November. But the inflation index, excluding food and energy prices, was again in the "red zone", dropping to -0.7% (the forecast was at -0.4%). Considering the global energy crisis, which was felt back in October last year, one can come to a rather obvious conclusion that the growth of the "headline" indicator of Japanese inflation was due to temporary factors. For example, it is known that Japanese electricity producers in November last year - for the first time in 8 years - decided to raise prices. In December, electricity bills for Japanese consumers rose by 13.4% year-on-year. This is the fastest growth rate in the last 40 years. Gasoline prices, in turn, jumped 22.4%. The temporary nature of inflation growth, as well as weak wage growth, will not allow the Bank of Japan to follow the example of its counterparts from the U.K., New Zealand, or the U.S. This was announced on Friday by Bank of Japan Governor Haruhiko Kuroda. He noted that "unlike the central banks of the United States and the European Union, the Central Bank of Japan should continue our extremely accommodative, easy monetary policy for the time being." According to most experts, the Japanese regulator will remain one of the most dovish central banks for the foreseeable future. The Japanese Central Bank will not tighten measures and will maintain large-scale incentives. According to some analysts, the Bank of Japan will remain "on standby" until at least the spring of 2023 (in April this year, Haruhiko Kuroda should leave the position of the head of the Bank of Japan).
Actually, this is evidenced by the results of the last - January - meeting of the Central Bank of Japan (the results were announced this Tuesday). Members of the Governing Council maintained a cautious and wait-and-see attitude, assuring market participants that they would implement an ultra-soft policy. The regulator maintained a highly cautious recovery outlook, while stressing that the risks to the economy are now "tilted to the downside" due to the impact of Omicron. In other words, the yen did not have, and still does not have, its own arguments for strengthening. The Japanese currency is in high demand only due to the flight from risks. On the eve of the January Fed meeting, nervousness is growing in the markets. Traders presented too "large an account" to the representatives of the Federal Reserve. Whether they will be able to "pay for it" (by announcing three or four rate increases, the first of which should happen in March) is an open question. And the closer the "X hour" is, the more the spring is compressed. If the hawkish expectations come true, this spring will release even faster – the USD/JPY pair will shoot up. That is, the current strengthening of the yen is still a kind of "house of cards" than a steady downward trend. However, if we talk about the prospect of the next few days, the advantage is still on the side of the Japanese currency. Given such an ambiguous fundamental background, it is best to take a wait-and-see position for the pair, although bearish sentiment is likely to prevail until the announcement of the results of the January Fed meeting, that is, until January 26th. The support level is 113.00, which is the lower boundary of the Kumo cloud on the daily chart, and the middle line of the Bollinger Bands indicator on the weekly timeframe. The material has been provided by InstaForex Company - www.instaforex.com |
| January 21, 2021 : EUR/USD daily technical review and trading opportunities. Posted: 21 Jan 2022 09:17 AM PST
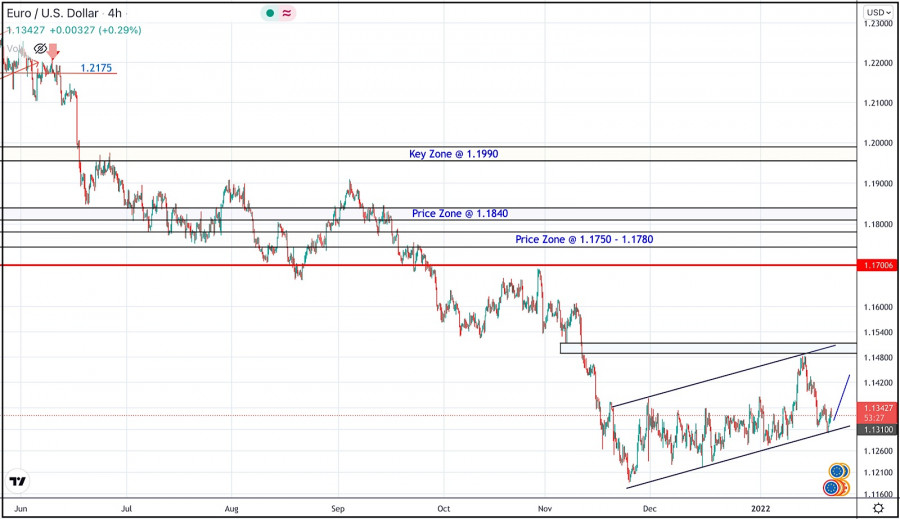
During the past few weeks, the EURUSD pair has been trapped within a consolidation range between the price levels of 1.1700 and 1.1900. In late September, Re-closure below the price level of 1.1700 has initiated another downside movement towards 1.1540. Price levels around 1.1700 managed to hold prices for a short period of time before another price decline towards 1.1200. Since then, the EURUSD has been moving-up within the depicted movement channel. Currently, the price zone of 1.1480-1.1500 stands as an intraday Resistance zone to be watched for short-term SELL trades. On the other hand, the price zone around 1.1500 stands as a prominent supply-zone to be watched for SELLING pressure and a possible SELL Entry upon the next ascending movement. The material has been provided by InstaForex Company - www.instaforex.com |
| January 21, 2021 : EUR/USD Intraday technical analysis and trading plan. Posted: 21 Jan 2022 09:16 AM PST
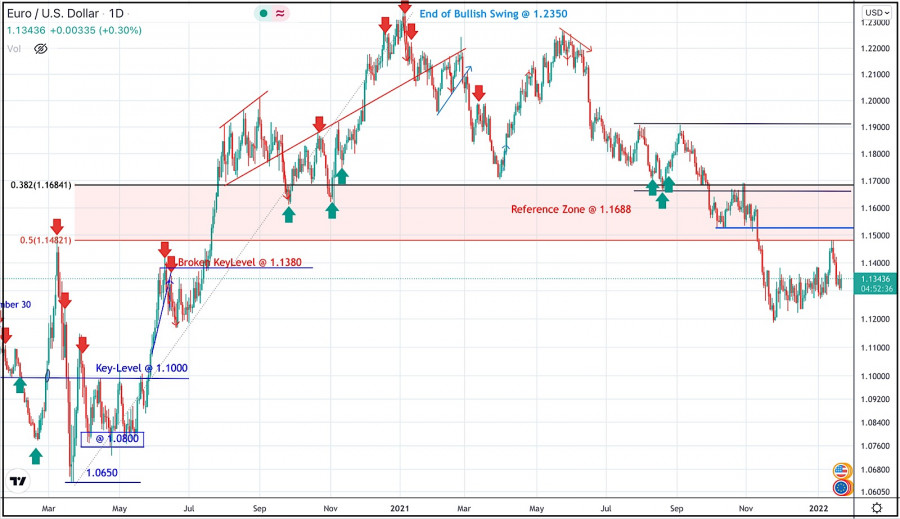
The bullish swing that originated around 1.1650 in August, failed to push higher than the price level of 1.1900. That's why, another bearish pullback towards 1.1650 was executed. However, extensive bearish decline has pushed the EURUSD pair towards 1.1600 and lower levels was reached. Shortly after, significant bullish recovery has originated upon testing the price level of 1.1570. The recent bullish pullback towards 1.1650-1.1680 was expected to offer bearish rejection and a valid SELL Entry. Significant bearish decline brought the EURUSD pair again towards 1.1550 levels which stood as an Intraday Support zone. Hence, sideway movement was demonstrated until quick bearish decline occurred towards 1.1200. Please note that any bullish movement above 1.1500 should be considered as an early exit signal to offset any SELL trades. The price levels around 1.1520 remain a reference zone that needs to be re-visited when the current bearish momentum ceases to dominate. The material has been provided by InstaForex Company - www.instaforex.com |
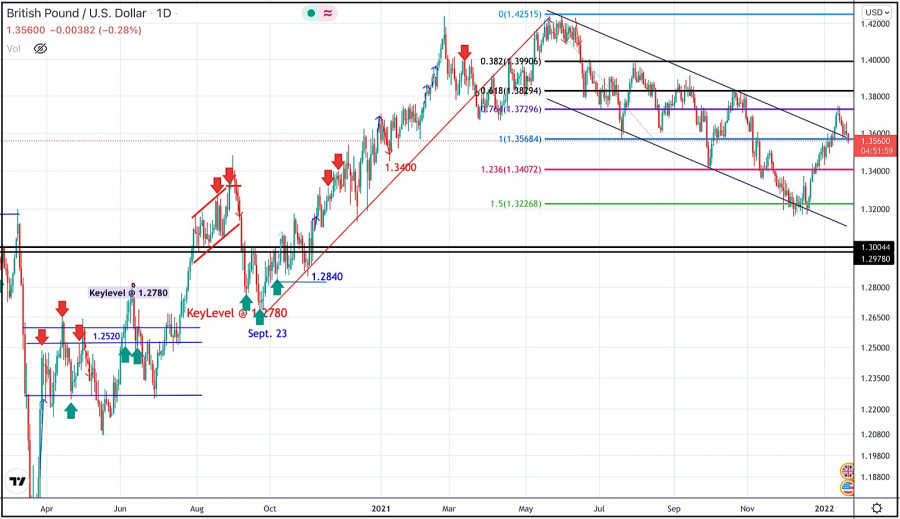
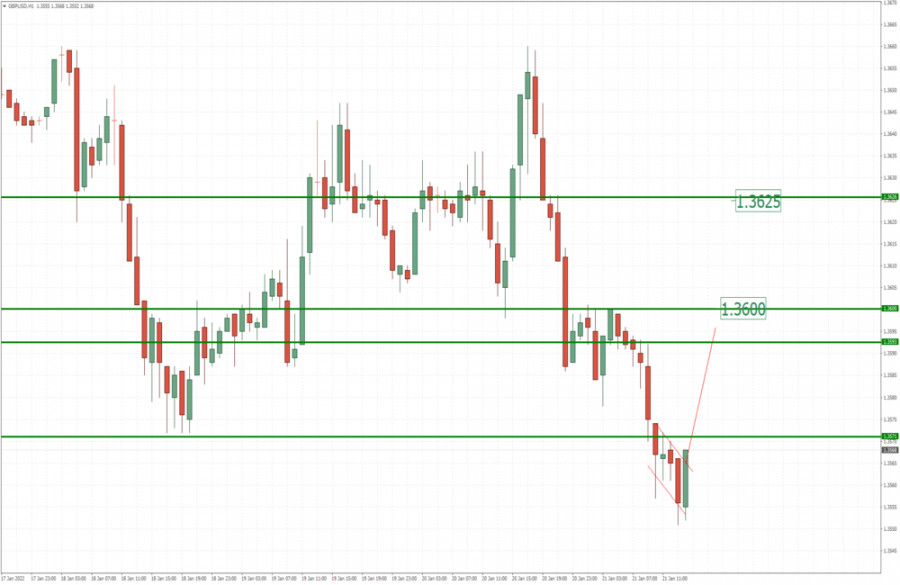
| January 21, 2021 : GBP/USD Intraday technical analysis and significant key-levels. Posted: 21 Jan 2022 09:13 AM PST
The GBPUSD pair has been moving within the depicted bearish channel since July. Bearish extension took place towards 1.3220 where the lower limit of the current movement channel came to meet with Fibonacci level. Conservative traders should have taken BUY trades around 1.3200 price levels as suggested in previous articles. Recent bullish breakout off the depicted bearish channel has occurred few days ago. However, BUYERS were watching the price levels of 1.3730 to have some profits off their trades. Moreover, the price level of 1.3720 stood as a key-resistance which offered bearish rejection on last Thursday. On the other hand, the short-term outlook remains bullish as long as the pair maintains its movement above the depicted channel above 1.3570 which stands as an intraday support to offer bullish trades. On the other hand, any bearish decline below 1.3570 will probably enhance the bearish side of the market at least towards 1.3400. The material has been provided by InstaForex Company - www.instaforex.com |
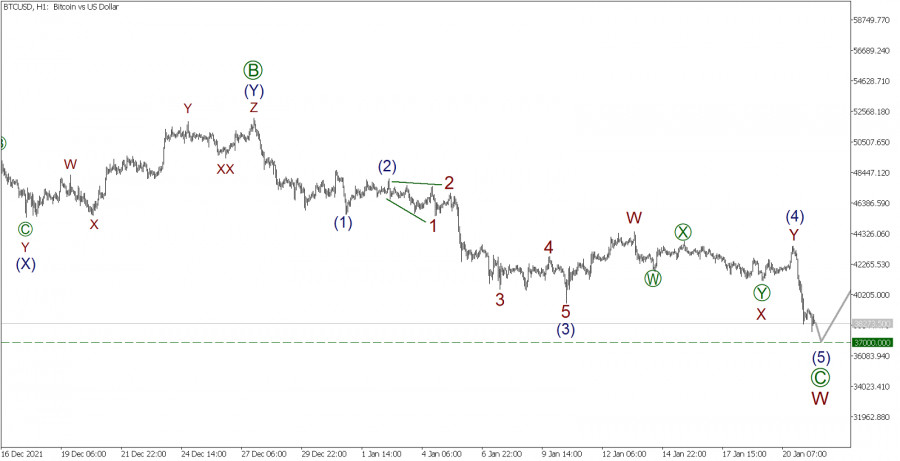
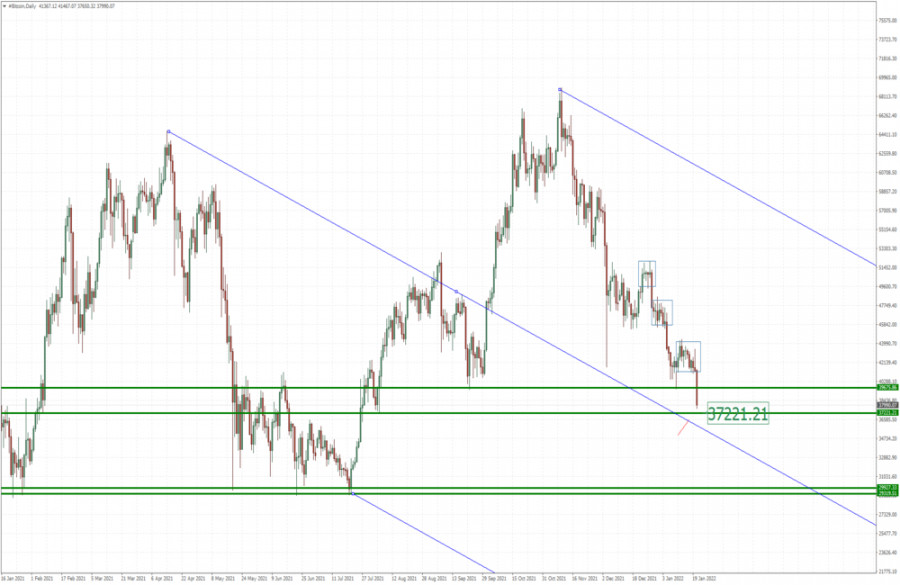
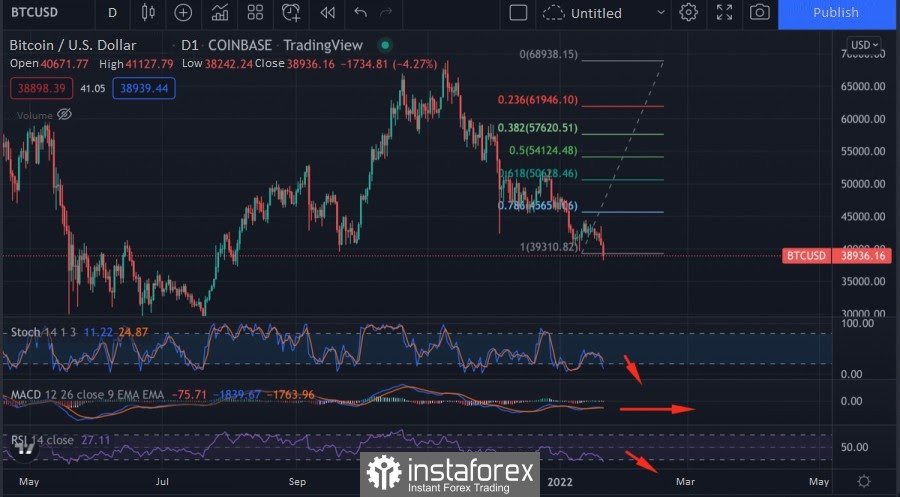
| Wave analysis of BTC/USD on January 21, 2022 Posted: 21 Jan 2022 08:34 AM PST The main news from the world of cryptocurrencies: Over the past three months, the price of bitcoin has been gradually declining. The asset moved to a downward movement after it hit an all-time high above $69,000 in early November 2021. Since then, it has fallen in price by 38%. On January 10, the price of the cryptocurrency for the first time since September fell below $40 million. On January 17, the asset is trading at $42,200. Most forecasts agree that the growth of bitcoin this year will definitely happen, recalled Artem Deev, head of the analytical department at AMarkets. In his opinion, the cryptocurrency is able to recover to $60,000–$68,000 and even reach $100,000. However, no one can say exactly when this will happen. BTCUSD, H1:
The formation of a large active wave W continues on the 1-hour chart of BTCUSD. This wave looks like a simple zigzag [A]-[B]-[C]. The last impulse wave [C], consisting of five sub-waves (1)-(2)-(3)-(4)-(5), is in the process of development. Most likely, the corrective wave (4) ended earlier than we expected. It has a complex horizontal structure and is a double three W-X-Y. Most likely, now the price is impulsively moving in wave (5) to the level of 37,000.00. It is possible that wave W will be completely completed at this level, after which a new bullish wave will begin to develop. In the current situation, it is possible to open short positions with a take profit at the level of 37,000. Trading recommendations: Sell 38,273.50 Take profit: 37,000.00. The material has been provided by InstaForex Company - www.instaforex.com |
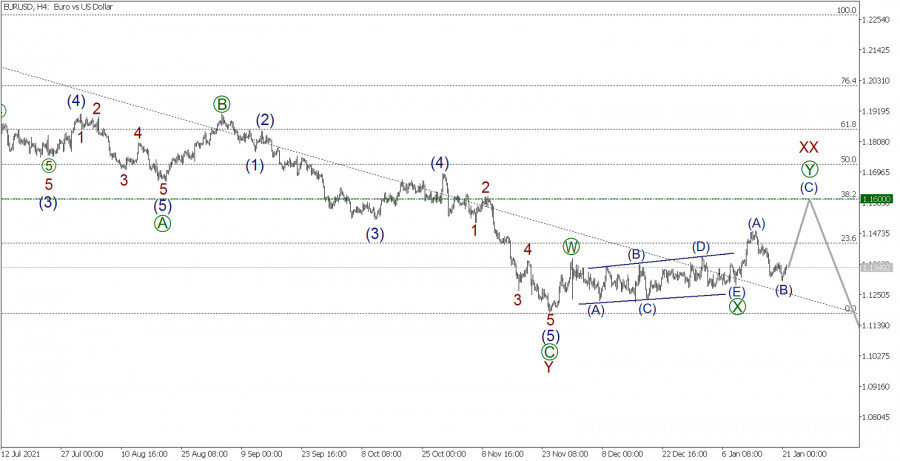
| Wave analysis of EUR/USD on January 21, 2022 Posted: 21 Jan 2022 08:33 AM PST EURUSD, H4:
The EURUSD currency pair continues to build the wave bundle XX, which is part of a large bearish corrective trend that takes the form of a triple zigzag W-X-Y-XX-Z. The wave bundle XX assumes a double zigzag [W]-[X]-[Y]. The active wave [W] was completed, as well as the horizontal wave bundle [X], which is similar to the inclined triangle (A)-(B)-(C)-(D)-(E). Currently, we are seeing the formation of an active wave [Y]. Perhaps it will be simple in shape and will be a simple zigzag (A)-(B)-(C). It is assumed that the correction (B) has come to an end, so in the near future the price may rise in impulse (C), approximately, to the level of 1.1600. At the indicated level, the value of wave XX will be 3.2% of the Fibonacci lines from wave Y. The probability of reaching the specified ratio is high. In the current situation, we can consider opening longs to take profit at the level of 1.1600. Trading recommendation: Buy 1.1349 Take profit 1.1600. The material has been provided by InstaForex Company - www.instaforex.com |
| The fate of the digital dollar for the next five years has been decided Posted: 21 Jan 2022 08:14 AM PST Officials of the Federal System did not delay and took a key step in the history of creating their digital currency. According to representatives of the institution, this will help ensure the dominance of the US dollar in the world market. The growing cryptocurrency market has had an impact, with which the central bank is struggling hard. Digital currencies of other countries will also compete. The fate of the digital dollar for the next five years has been decided At first glance, the central bank did not make firm conclusions about whether the issue of such a currency was reasonable, and in any case, stated that it did not intend to act without the support of the White House and Congress. So it is unlikely that the digital US dollar will be released in the near future.
However, note that the 35-page minutes of the meeting on the government-backed digital coin (known as CBDC) marks the Fed's most important action as it seeks to delve deeper into digital assets. In addition, the outcome of the meeting came down to a statement that the monetary policy authority prefers that legislators adopt a separate law allowing the currency. "The introduction of CBDC will represent a very important innovation in American money," the Fed document says. The Fed will continue to collect information from public organizations on this issue. The central bank also outlined several potential advantages of the US-backed coin, including the need for the dollar to remain the dominant currency in the international financial system. Representatives also said that CBDC can improve cross-border payments, increase financial accessibility and simplify the use of the dollar in new technologies. However, the central bank also warned of possible negative consequences, including an outflow of deposits from traditional banking systems and an increase in the likelihood of a more serious raid on financial firms. Privacy is also becoming a cornerstone since the government can have direct access to the transactions of individual citizens. The report provides few details on how these controversial issues can be resolved and say that the Fed "needs to find an appropriate balance between protecting consumers' privacy rights and ensuring transparency necessary to deter criminal activity." In addition, the infrastructure of this new system can become a tempting target for hackers. Thus, the Fed's CBDC protection could be "particularly challenging," the report says because it would have "more entry points than existing payment services." A Fed official told reporters that the central bank will evaluate the next steps after the deadline for comments. However, he did not name the start date of the program. The most interesting and frightening point of the future strategy is the possibility of participation of companies that are not banks. Thus, the Fed representatives noted that the authority is likely to rely on intermediaries from the private sector, which may be traditional lenders or non-banking institutions, to offer accounts and facilitate CBDC payments, rather than taking on this role. This is probably one of the most controversial points in the protocol, which, when implemented, can have serious consequences for the dollar and, ultimately, the national security of the United States. However, in general, the document is the result of Chairman Jerome Powell's decisive turn towards a deeper involvement in digital payment systems in May. A separate document on the technology that can manage the central bank's digital currency is expected from the Boston Fed in February. The latter is necessary because central banks around the world, primarily the People's Bank of China, are rushing with their digital currencies. Recall that China launched a pilot project of the digital yuan this year and is expected to announce its use at the Winter Olympic Games in Beijing in February. Some experts say that China and other countries that were the first to adopt digital currencies may set standards for other countries, partly because the digital currency systems of different countries will eventually have to coordinate cross-border payments. This could make the Fed's research important even if the digital US dollar is not launched for many years, as many countries will seek to adapt their systems to integrate with the US. However, if the yuan takes the lead, and it does, it is more likely that the dollar will have to "catch up", adjusting to existing payment systems, and this will also negatively affect the status of the dollar as a world currency. The greenback may lose this status in two years. Meanwhile, in the absence of a digital dollar issued by the Fed, private companies have launched their version in the form of stable coins that contain reserves designed to enable the exchange of coins for fiat currency on a one-to-one basis. It seems that this practice was made possible by the crypto market and, in particular, Defi (a system of decentralized financing on the blockchain). However, unlike the latter, the "stable coins" of companies are deprived of the advantages of the blockchain, such as the guarantee of anonymity and the highest priority of data security. Without state control of reserves, which, however, has its limits, the estimated value of such "stable coins" is questionable. Nevertheless, the phenomenon exists, and before the first serious thefts, it is quite part of the market. The material has been provided by InstaForex Company - www.instaforex.com |
| Posted: 21 Jan 2022 08:13 AM PST The cryptocurrency market has stabilized over the past seven days and the major coins have strongly consolidated at support levels. At the same time, there has been a decrease in volatility and active coin accumulation. All factors signaled the end of the correction and the upcoming broad market reversal. However, the situation turned out to be the opposite. The total capitalization of the crypto market fell by 3% and the major coins hit new local lows. Why did it occur? Pros before declineFirst of all, let's consider the inputs. I will analyze bitcoin, as it was its fall that triggered the market collapse. Before the significant collapse on January 20, the main cryptocurrency was at two strong support zones of $42,100 and $40,500. The asset was moving within a narrow range of $40,500-$44,600 with no impulse movements, indicating a slow consolidation and accumulation. At the same time, there was a drop in volatility and an increase in the cryptocurrency's hashrate. Miners and large investors continued to buy BTC, and the market gradually recovered.
ConsWhile moving in the range of $40,500-$44,600, bitcoin made attempts to test the upper boundary of the channel. However, each failed attempt resulted in a 3%-5% collapse. It was considered a warning sign. First, slow growth indicated weak positions of buyers and lack of desire to force the price. Besides, considerable drops underlined sellers' ability to close long positions. Low buying volumes and high exposure to impulse declines raised questions of concern, however they did not affect investors' positions. Results and possible reasons for collapseAt first the bitcoin price was moving from the upper end of the range to the lower end. However, before the collapse on the 4-hour timeframe, a strong bullish momentum followed, which brought the price to the border of the channel. Buyers did not support the momentum and the price moved towards the support area of $40,500, missing the level of $42,100. Consequently, the asset broke the level and managed to slow the decline around $39,000. The impulsive upward movement before the fall was the local activity of whales, which bought 40,000 BTC within two days. Bears took advantage of a failed retest of the trend resistance zone and launched a sell-off below $42,000. This decline can be seen as manipulation by whales to collect liquidity in the area of $38,000-$40,000. However, the percentage of bitcoin correction fell below 15%. Therefore, it is doubtful.
What is next?The collapse of bitcoin and the whole cryptocurrency market was most likely caused by passivity of buyers with a huge discrepancy of long / short positions in the direction of the longs. During the market collapse, the positions worth $727 million were liquidated, 80% of them were long positions. The market took no measures. However, the majority of players thought that opening long positions would be the best strategy if the market was on an impulse rise. Consequently, the market did not take the expectations of major players into account, and the cryptocurrency has consolidated below $40,000. The main concern is that investors do not hurry to buy back the fall, which means that the downside potential is pushed back to $35,000. The material has been provided by InstaForex Company - www.instaforex.com |
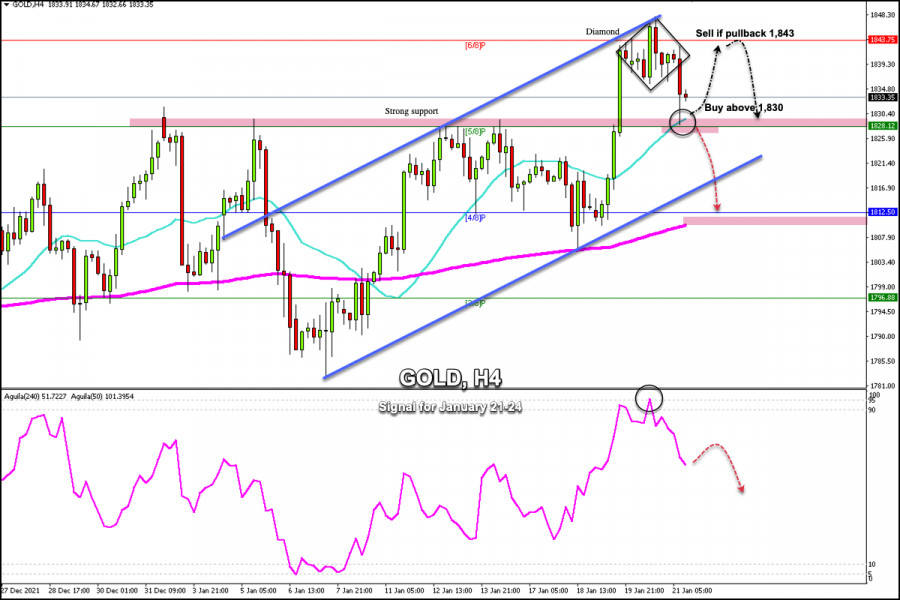
| Posted: 21 Jan 2022 07:24 AM PST
In the European session, gold fell to the strong support of 1,830. From this level it is making a technical correction. XAU/USD bottomed at 1,828, right at the level of 5/8 Murray and 21 SMA and then started a bounce. It is currently operating at 1,833, recovering part of the losses. The precious metal went through a downward correction, after reaching the highest level in two months at $1,848. On the 4-hour chart, you can see the formation of a diamond pattern. This pattern could mean that gold has reached a strong top. As long as it remains trading below 1,848, a correction and reversal is expected in the coming days. On January 19, the eagle indicator came to give an extreme overbought signal around 95-points. This indicator has a strong probability of success, and as the correction was imminent, gold made a drop to 1,828. Now hte price is recovering. However, it could resume its bearish movement and could fall below the 21 SMA with targets towards 1,812. Since January 6, gold has been trading within a trend channel that is formed on the 4-hour chart. The strong resistance at 6/8 Murray could be a barrier to prevent gold from a further rise. The level around 1,843 will give us an opportunity to sell again with targets at 1,828 and a break of 5/8 Murray could accelerate the decline to the 200 EMA located at 1,810. Our trading plan is to buy at current levels while price remains above1,828 with targets towards 1,843. If gold cannot consolidate above 1,843, it will be an opportunity to sell with targets at 1,830 and towards 4/8 Murray at 1,812. Support and Resistance Levels for January 20 - 24, 2022 Resistance (3) 1,851 Resistance (2) 1,843 Resistance (1) 1,841 ---------------------------- Support (1) 1,831 Support (2) 1,822 Support (3) 1,812 *********************************************************** Scenario Timeframe H4 Recommendation: sell if pullback Entry Point 1,840 - 1,843 Take Profit 1,830 (5/8) 1,812 (4/8) Stop Loss 1,849 *********************************************************** The material has been provided by InstaForex Company - www.instaforex.com |
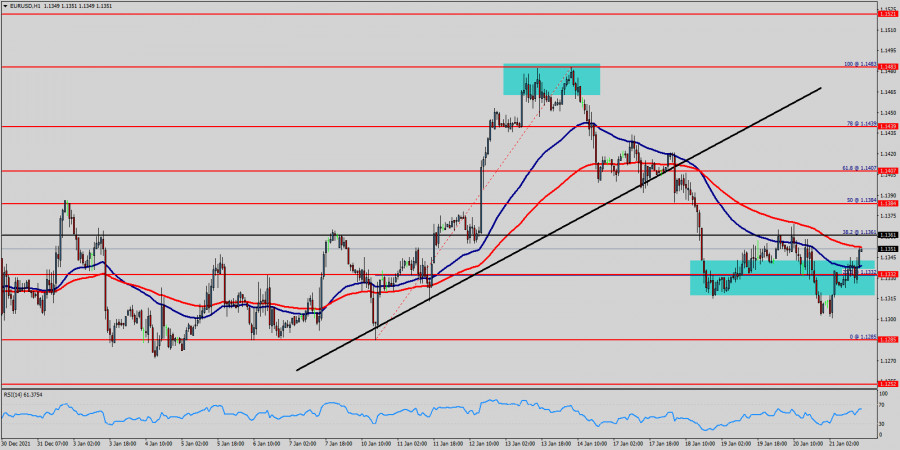
| Technical analysis of EUR/USD for January 21, 2022 Posted: 21 Jan 2022 07:09 AM PST
The EUR/USD pair continues to move upwards from the level of 1.1290. Yesterday, the pair rose from the level of 1.1290 to a top around 1.1361 (the level of 1.1361 coincides with a ratio of 38.2% Fibonacci retracement). Today, the first support level is seen at 1.1290 followed by 1.1252, while daily resistance 1 is seen at 1.1384. According to the previous events, the EUR/USD pair is still moving between the levels of 1.3232 and 1.1432; for that we expect a range of 100 pips (1.1432 - 1.3232). On the one-hour chart, immediate resistance is seen at 1.1407, which coincides with a ratio of 61.8% Fibonacci retracement -last bullish wave, top. Currently, the price is moving in a bullish channel. This is confirmed by the RSI indicator signaling that we are still in a bullish trending market. The price is still above the moving average (100) and (50). Therefore, if the trend is able to break out through the first resistance level of 1.1361, we should see the pair climbing towards the daily resistance at c to test it. The EUR/USD pair will demonstrate strength following a breakout of the high at 1.1407. Consequently, the market is likely to show signs of a bullish trend. In other words, buy orders are recommended above 1.1361 with the first target at 1.1407. Then, the pair is likely to begin an ascending movement to 1.1407 mark and further to 1.1483 levels. The level of 1.1483 will act as strong resistance. It would also be wise to consider where to place stop loss; this should be set below the second support of 1.1285. The material has been provided by InstaForex Company - www.instaforex.com |
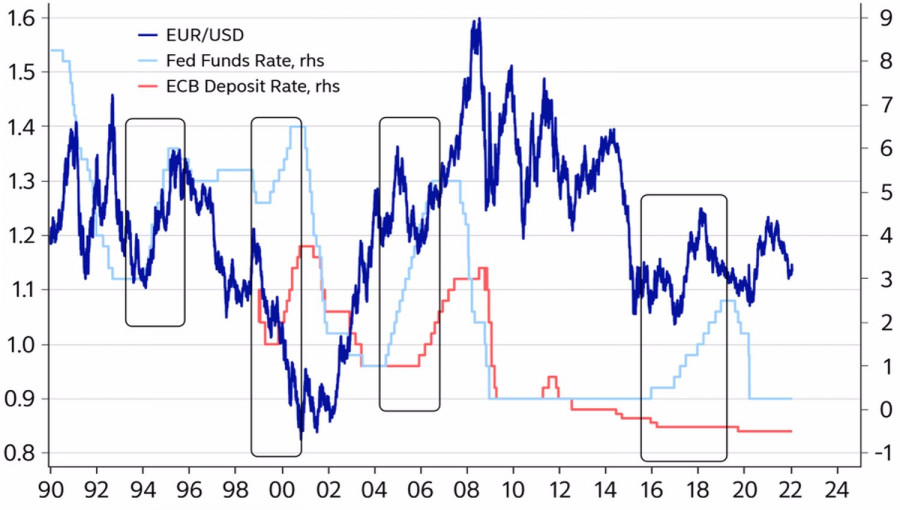
| Posted: 21 Jan 2022 06:44 AM PST The "bulls" on EURUSD did not find the strength to take quotes above 1.15, which, in my opinion, looks logical. The eurozone economy, weighed down by the energy crisis and the new wave of COVID-19, is not able to compete with the U.S., and the ECB is not going to raise rates in 2022. Unlike the Fed, which predicted in December that it would tighten monetary policy three times. Now the futures market insists on four acts of monetary restriction. The dollar is also in no hurry to play its own cards. History shows that the USD index rose until the first increase in the federal funds rate in the cycle, and then the dynamics of EURUSD was mixed. This is typical for 2015-2018, when the Fed raised borrowing costs by 300 basis points. The euro soared to $1.15, then fell to $1.05, then rushed to $1.25 thanks to the victory of Emmanuel Macron in the presidential elections in France and the hawkish rhetoric of Mario Draghi in Sintra, Portugal, but after that dived to $1.15. EURUSD dynamics and Fed tightening cycles
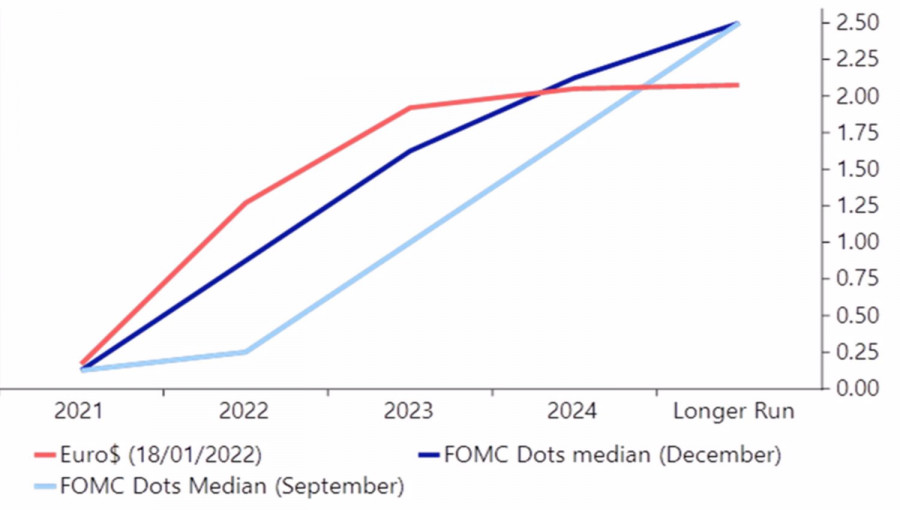
Traders use patterns in both technical and fundamental analysis, so the peak values of the USD index by the time of the first act of monetary restriction by the Fed in the cycle of many of them hold back EURUSD from selling. As a result, the main currency pair has been bored in the consolidation range of 1.122-1.138 for more than two months now. At the same time, the exit of quotes beyond its upper border became a real fiasco for the bulls. The U.S. dollar cannot benefit from the rising Treasury yields nor from a downturn in the U.S. stock market. In the latter case, the U.S. dollar should theoretically benefit as a safe-haven asset, but so far, this has not happened. However, on the eve of the FOMC meeting, which is considered the key event of the week to January 28, the dollar managed to lick some of its wounds. The Fed is gradually catching up with market expectations in its forecasts for the rate, and is ready to raise it in March. Will the first meeting of its representatives bring a "hawkish" surprise in the form of the completion of QE or rising borrowing costs? Investors reinsure themselves and return to the U.S. currency. Probably, the absence of something new from the Fed will bring EURUSD buyers back to the market. Dynamics of forecasts for the Fed rate
In my opinion, the consensus forecast assumes a 100 basis points increase in the federal funds rate in 2022 while maintaining the ECB deposit rate at -0.5%. These events are already included in EURUSD quotes. If the Fed surprises with a large number of monetary restrictions or starts to roll up the balance sheet before the third quarter, the U.S. dollar will have an opportunity for further growth against major world currencies. If, on the contrary, this does not happen, and the European Central Bank nevertheless raises rates in 2022, as the derivatives market expects, we should expect a reversal of the downward trend for the main currency pair. Technically, a repeated successful test of the fair value at 1.132 is fraught with the activation of the false breakout pattern, which will become the basis for building up the EURUSD shorts formed from the level of 1.1435 . EURUSD, Daily chart
|
| NFLX stock price plummets towards $400 after earnings. Posted: 21 Jan 2022 06:31 AM PST At he beginning of January we warned traders that NFLX stock price was breaking out of a wedge pattern and provided us with a bearish signal. On January 13th we came back with another warning for NFLX bulls warning them that the coming weeks could be ugly for the stock.
Blue line- support Black horizontal lines - Fibonacci retracements Last night NFLX announced its earnings report which was disappointing for most analysts, sending the stock price towards the $400 level in after hours trading. Today price is set to open around $400-$420 right around the 61.8% Fibonacci retracement of the entire rise from $231 to $700. After such a gap down open, I would prefer to take my profits and wait, as there are increased chances of a strong bounce higher as this is a major Fibonacci retracement level. The material has been provided by InstaForex Company - www.instaforex.com |
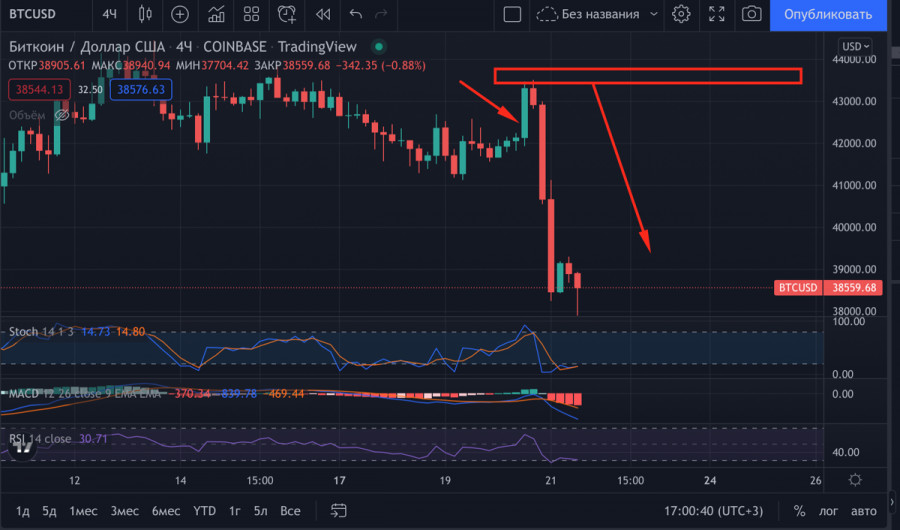
| Trading signals for BITCOIN on January 21 - 22, 2022 : buy in case of rebound around $ 37,500 (0/8) Posted: 21 Jan 2022 06:14 AM PST
The Bitcoin price lost 8.9% in the last 24 hours. At the time of writing this article, the digital token is trading close to $38,717. The price is expected to drop to support at 0/8 Murray around 37,500. Altcoins, due to the correlation with BTC, follow the downtrend of the flagship cryptocurrency. So, they are trading also in the red. The fall of Ether (ETH) is measured at almost 12%. Pessimism continues to grow among investors and traders when it comes to riskier assets like BTC. Due to worsening conditions on Wall Street, BTC could suffer in the coming months due to the correlation with the stock market. The increase in the interest rate in the United States could be another factor that keeps BTC under bearish pressure so that it could reach the level of 30,000. According to the daily chart, the price of bitcoin has broken the key support level of $40,000, which has already been tested several times. Now all eyes are on the following important price levels: 37,500, 34,375 and the psychological level of 30,000. We can see on the daily chart that Bitcoin is trading below a downtrend channel and below the 21 SMA located at 43,079. If the technical bounce found at 37,500 gives BTC the impetus to break the psychological level of 40,000, we could expect a recovery towards the 200 EMA located at 48,461 in the coming days. The eagle indicator has reached an extreme oversold zone and an imminent technical bounce towards 1/8 Murray around 40,625 is likely. Our trading plan for the next few hours is to buy around 37,500. Above this level, we will have the opportunity to buy with targets towards 40,625. If the price breaks the downtrend channel, we could buy with targets towards 43,750 and up to 48,461. Support and Resistance Levels for January 21 - 22, 2022 Resistance (3) 41,958 Resistance (2) 40,491 Resistance (1) 39,745 ---------------------------- Support (1) 37,455 Support (2) 35,359 Support (3) 34,375 *********************************************************** Scenario Timeframe H4 Recommendation: buy if it rebound around Entry Point 37,500 Take Profit 40,625 (1/8) 40,3750 (2/8) 48,875 (3/8) Stop Loss 36,500 Murray Levels 40,625 (1/8) 40,3750 (2/8) 48,875 (3/8) 50,000 (4/8) *************************************************************************** The material has been provided by InstaForex Company - www.instaforex.com |
| EURUSD bounces off short-term support. Posted: 21 Jan 2022 06:08 AM PST EURUSD is trading close to 1.1350. Price made a low at 1.1302 earlier today challenging the key short-term support trend line. Price remains inside the medium-term bearish channel but bouncing off the short-term support trend line gives hopes to bulls for another channel break out.
Green line - support trend line EURUSD continues to respect the green support trend line and this is a good sign for bulls. Bulls do not want to see price break below 1.13. This would be an added bearish signal and would increase chances of a decline towards 1.10. Bulls need to break out of the bearish channel and recapture 1.14-1.1450. Until then trend will remain unclear. The material has been provided by InstaForex Company - www.instaforex.com |
| Ichimoku cloud indicator analysis on Gold for January 21, 2022. Posted: 21 Jan 2022 06:04 AM PST Gold price remains in a short-term bullish trend. In previous posts we talked about the break out above the horizontal resistance of $1,830 and the potential for a move towards $1,860. Today we use the Ichimoku cloud indicator analysis to point key support levels as Gold is trading higher.
|
| Crypto market collapses in 24 hours due to US and Russia news Posted: 21 Jan 2022 06:03 AM PST Bitcoin sank by more than 7% to $38,5774 in the past 24 hours, while the second-largest virtual asset, Ethereum, fell by more than 8% to $2,809.51. At the same time, the overall cryptocurrency market lost about $147 billion. At the time of writing the article, bitcoin is trading at $38,093, while the price of Ethereum reaches $2,782. Bitcoin has declined sharply since November 2021. At that time, the coin hit a record high of $69,000. However, since then, the first cryptocurrency has lost more than 40%.
Crypto experts consider the correction of the US leading stock market indexes to be the main reason for a dramatic decline of digital coins. Thus, the high-tech Nasdaq lost about 5% since the beginning of the week, while the S&P 500 has been falling for the third week in a row. Traditionally, the sentiment of the cryptocurrency and stock market has a mutual influence on their dynamics. For example, a significant drop in the value of bitcoin could encourage investors to be risk-averse and could lead to a reduction in investments in the securities markets. Besides, in the coming year, the BTC dynamics is identical to the movement of the largest stock index NASDAQ Composite, formed from the shares of technology companies. The NASDAQ has lost 9.5% since early 2022 and entered the correction phase. The negative dynamics of Wall Street is the result of the market participants' concern about the US Federal Reserve's interest rate hike. As a result of the Federal Reserve's tightening of monetary policy at the beginning of the current week, US government bond yields soared overnight. Moreover, the rate hike forced investors to abandon positions on risky assets. Among the Fed's planned steps are curtailing of bond purchases and increase in the benchmark interest rate. In anticipation of these measures, analysts have opposing views on the future of bitcoin. Pessimistic crypto experts argue that the highly inflated BTC bubble will soon burst amid increased regulatory scrutiny. For example, the PRC has completely banned any transactions involving virtual assets. The US authorities are also tightening control on certain areas of the cryptocurrency market. Other analysts predict digital gold to fall below the level of $40,000 amid the publication of a report by the Central Bank of Russia. The Central Bank of Russia proposed banning the use and mining of cryptocurrencies on the territory of the state. It stated that the widespread distribution of digital assets posed risks to financial stability and the sovereignty of monetary policy. Notably, Russia is currently one of the top three leading countries in mining BTC. The material has been provided by InstaForex Company - www.instaforex.com |
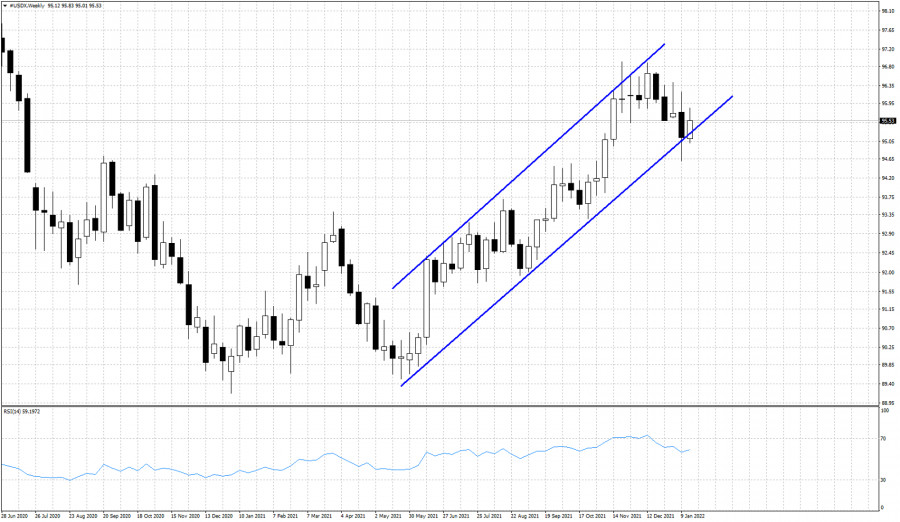
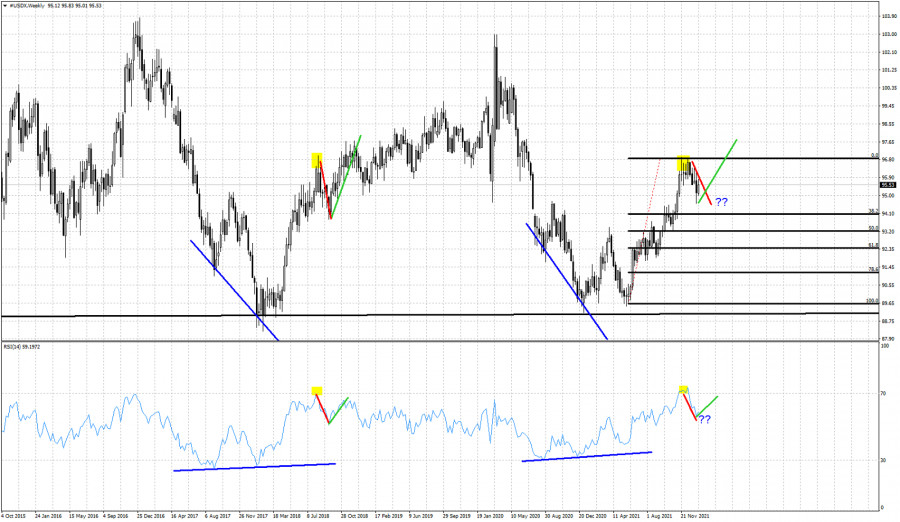
| Posted: 21 Jan 2022 06:00 AM PST The Dollar index is in a bullish weekly trend. Despite price briefly breaking out of the bullish channel, on a weekly basis we have not seen a break down out of the bullish channel. Price continues to follow our analogy to 2017 that we have talked about many times before.
Last week price almost exited the channel. This week price is bouncing off the channel boundary. What next? Bulls do not want to see price break below this week's lows. That would be a sign of weakness.
Red line- similar declines Yellow rectangle- similar RSI tops and short-term reversals Green lines- expected rise similar to 2018 Will the Dollar index resume its up trend like it did back in 2018 after the red corrective pull back? The Dollar index has so far retraced only a little bit more than the 23.6% of the entire rise from 89.60. The 38% Fibonacci level has not been met. It is not necessary to reach the 38% level in order to say that the pull back is complete, but for now we should keep this scenario open, as there are still chances of a deeper correction towards that Fibonacci level. The material has been provided by InstaForex Company - www.instaforex.com |
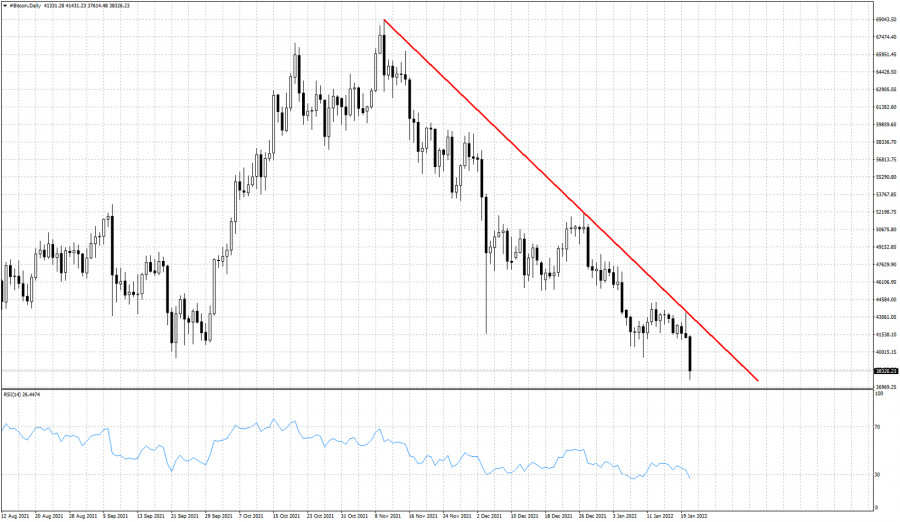
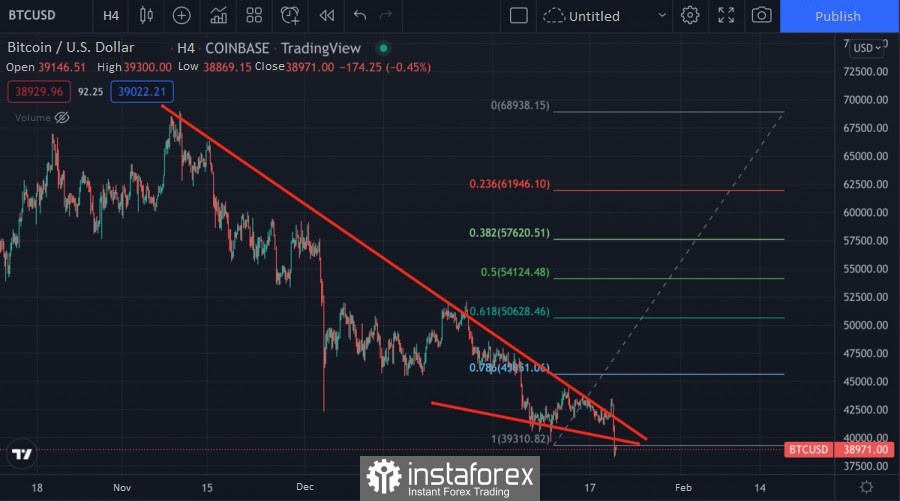
| Posted: 21 Jan 2022 05:53 AM PST In previous posts we talked about Bitcoin being in a bearish short-term trend as long as price was trading below the key downward sloping resistance trend line. Bitcoin broke below the $39,550 low and reached as low as $37,615. Bitcoin remains in a bearish trend. There is still no confirmation of a trend reversal.
Red line - resistance Bitcoin has now reached the 78.6% Fibonacci retracement of the entire rise from $29,000 to $69,000 all time highs. Price continues making lower lows and lower highs. Resistance is at $42,800-$43,500. As long as price is below this level, short-term trend will remain bearish. In the Daily chart we also have our first bullish RSI divergence. The RSI did not make new lows as price did. This is a signal that the downtrend is weakening. This is not a reversal signal. Only a warning. The material has been provided by InstaForex Company - www.instaforex.com |
| Asian stock markets tumble due to high inflation Posted: 21 Jan 2022 05:51 AM PST
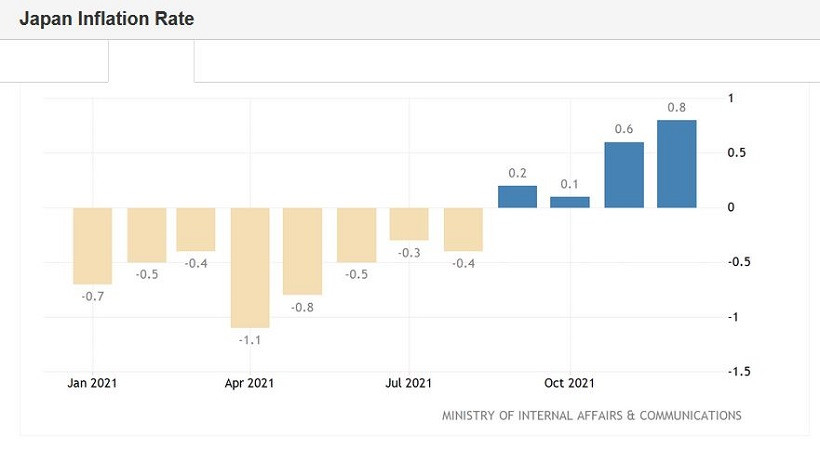
Asian stock market indexes went down during today's session. The Shanghai Composite lost 0.84%, the Shenzhen Composite declined by 1.19%, and the Hang Seng Index decreased by 0.64%. South Korea's KOSPI and Japan's Nikkei 225 fell by 1.38%. The sell-off was triggered by Japan's inflation data, which was released on Friday. Consumer prices in Japan increased by 0.8% in December 2021 compared to November's increase of 0.6%, reaching a 2-year high. Month-over-month, the inflation rate remains at 0.1%. On the Nikkei 225, the stocks with the biggest losses were Tokyo Electron, Ltd. (-6.6%), Advantest Corp. (-4.4%), Mitsubishi Motors Corp. (-5%), and Mazda Motor Corp. (-4.7%). Shares of Toyota Motor Corp. lost 2.8% due to supply issues. The company was forced to halt production at 11 factories due to a parts crunch, cutting its output by 9 million vehicles. Investors are also concerned by a record high increase in COVID-19 cases. The total daily number of infections has reached 3.7 million. A continuously high spread of the coronavirus would force governments to enact new quarantine measures, putting pressure on economic growth. On the Hang Seng Index, Alibaba Group Holding, Ltd. and Netease Inc. were the worst performing stocks, losing 5.3% and 4.2% respectively. Shares of PetroChina Co., Ltd. lost 3% on falling crude oil prices. The government of South Korea is planning to spend an additional $12 billion this year to support small and medium-sized businesses battered by the pandemic. On the KOSPI, the stocks with the biggest losses were Kia Corp (-1.7%), Hyundai Motor Co. (-1.2%), Samsung Electronics Co. (-1.8%), and LG Corp. (-0.8%). In Australia, shares of BHP Group, Ltd. and Rio Tinto, Ltd. fell by 4.8% and 4.1% respectively. The material has been provided by InstaForex Company - www.instaforex.com |
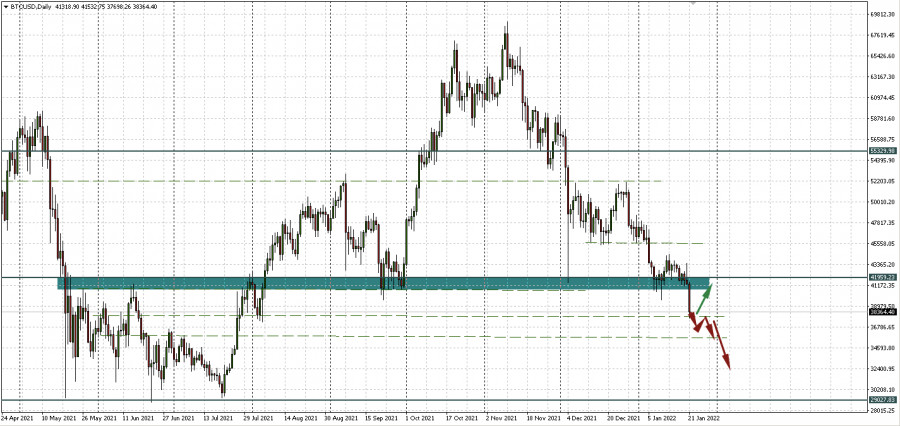
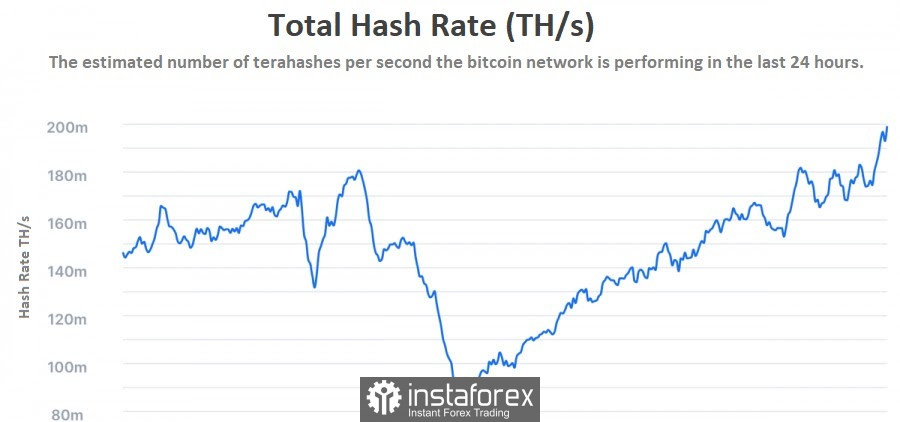
| BTC down but mining activity rises. Bitcoin mining difficulty hits all-time highs Posted: 21 Jan 2022 05:43 AM PST Bitcoin failed to hold above $40,000 today and crashed to a six-month low. However, on-chain analysis shows encouraging data on the Bitcoin network. Bitcoin mining difficulty reaches all-time highs According to Glassnode and BTC.com, Bitcoin mining difficulty recorded its biggest increase on Friday. It has exceeded 26 trillion for the first time. The mining difficulty measures how hard and time-consuming it is to find the right hash for each block. It is arguably the most important fundamental component of the Bitcoin network. This metric is automatically adjusted to the changes in mining efforts depending on how many miners participate in the process. The higher the competition, the higher the difficulty. This ensures the stability of mining regardless of such factors as sentiment, price, or unexpected events. After falling in mid-2021, mining difficulty recovered towards the end of the year. After that, the last automatic correction added 9.32% to the previous level. As a result, it has climbed above $26 trillion for the first time on record. Commenting on this event, cryptocurrency journalist and commentator Colin Wu noted that the increase is the highest in more than half a year. BTC.com data confirms that the last correction of more than 10% occurred at the end of August. Miners stay active despite falling prices As we can see, a decline in BTC value does not affect the determination of miners. The mining difficulty of Bitcoin has naturally followed the growth of the hash rate, which has consistently set new records in the past year. According to MiningPoolStats, the hash rate, an estimate of the computing power allocated to blockchain miners, currently stands at 192 exahashes per second (EC/s), having briefly reached 218 EH/s on January 10. As often reported by Cointelegraph, the old adage of "price follows hash rate" is still popular among BTC holders who do not sell Bitcoin under any circumstances. However, this trend is gradually fading away as fundamental indicators are moving in the opposite direction of the spot price. Thus, the growing hash rate means that miners are optimistic about the profitability of their operations in the long-term perspective. Calculations from last week showed that miners' break-even point currently stands at around $34,000. Bitcoin price prediction After breaking through the support zone of $40,000 - $42,000, the number one cryptocurrency reached the next downward target of $37,903.51. In this situation, two outcomes are possible. The first one is a recovery towards $40,000 in case current support proves to be strong. In the second scenario, a breakout of $37,903.51 and consolidation below it will open the way for BTC/USD to the next support level of $35,915.72.
|
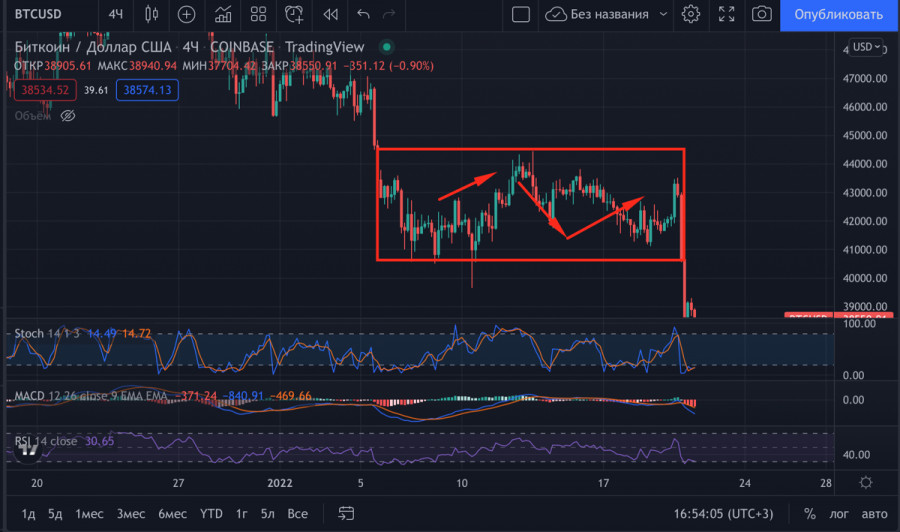
| BTC analysis for January 21,.2022 - Potential for upside rotation Posted: 21 Jan 2022 05:10 AM PST Technical analysis:
BTC has been trading downside and there was the breakout of the contraction. BTC almost reached pivot level at $37,220. Trading recommendation: BTC is trading around pivot support at the price of $37,220 and the Pitchfork median line, which is sign that there is potential upside rotation. Watch for upside movement and rotation towards $43,000 Key support is set at thee price of $37,22 The material has been provided by InstaForex Company - www.instaforex.com |
| Video market update for January 21,,2022 Posted: 21 Jan 2022 05:04 AM PST Watch for upside continuation on the Gold and upside rotation on GBP.... The material has been provided by InstaForex Company - www.instaforex.com |
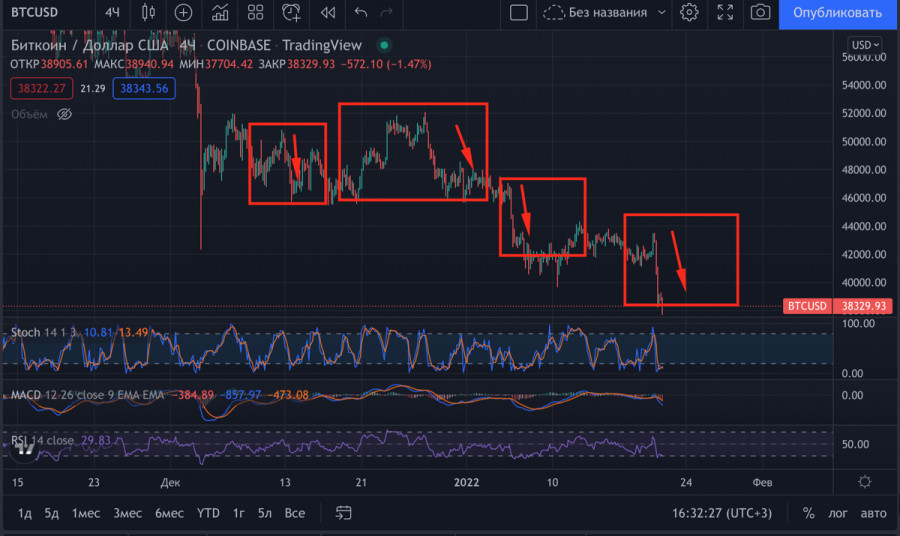
| Bitcoin Updates Six-month Low, Gets One Step Closer to Bear Market Posted: 21 Jan 2022 04:58 AM PST Bitcoin was one step away from the coveted breakdown of the mirror level and the downward trend line. But as we expected, the lack of large volumes of purchases and the general fear in the market played against the asset. As a result of an unsuccessful assault on the downward trend line, the cryptocurrency fell like a stone to the lower border of the range at around $40.5k. The bulls failed to defend this milestone as at the beginning of the week, and the asset continued its impulse decline. The main cryptocurrency has updated its six-month low at $39k. As a result of the collapse of Bitcoin, the altcoin market also moved into the red zone. The total capitalization of the crypto market decreased by 7.5%, and the total volume of liquidations reached $727 million. Large sales started in the $42k area as evidenced by the long upper wick. As of 09:30 UTC, the asset continues to trade below $40k, and in order to level out the negative scenario, buyers need to push the price above $40k. Otherwise, the price drop will continue.
The main problem at the current stage is the breakdown of the upward trend line, which played the role of a strong support zone. Now this line has become an important zone of resistance, over which it is necessary to gain a foothold in the near future. Bitcoin is in limbo, as it rests on the fading faith of the bulls. In case of consolidation in the range of $39k-$40k, the minimum target for the fall will be $36.7k. The next key BTC support zone will be $30k.
The sharp drop in the price of Bitcoin rejects all parallels with the May accumulation. The positions of the bulls in mid-2021 and now are incommensurable. The accumulation period continues, "whales" are actively buying up coins (40k BTC over the past week), the number of "weak hands" reaches an absolute minimum, and the bitcoin hashrate is growing. But at the same time, the price continues to decline and increasingly correlates with the stock markets. Bitcoin is at the stage of forming a new segment of the cycle, and therefore any long-term analysis does not make sense. The asset is moving to a new stage of development and its functionality in the eyes of investors is changing.
Bloomberg strategist Mike McGlone believes that the main cryptocurrency has great potential for growth in 2022 due to the fact that the asset is gradually changing its status. I assume that the current correction is part of the process of reorienting Bitcoin and its assimilation with class assets. The correlation with the S&P 500 and other key indices confirms this. But how positively this will affect bitcoin in the future is a big question. Right now, the cryptocurrency is one step away from a bear market with potential in the $20k region.
|
| GBP/USD update for January 21, 2022 - Breakout of exhaustion pattern to the upside Posted: 21 Jan 2022 04:50 AM PST Technical analysis:
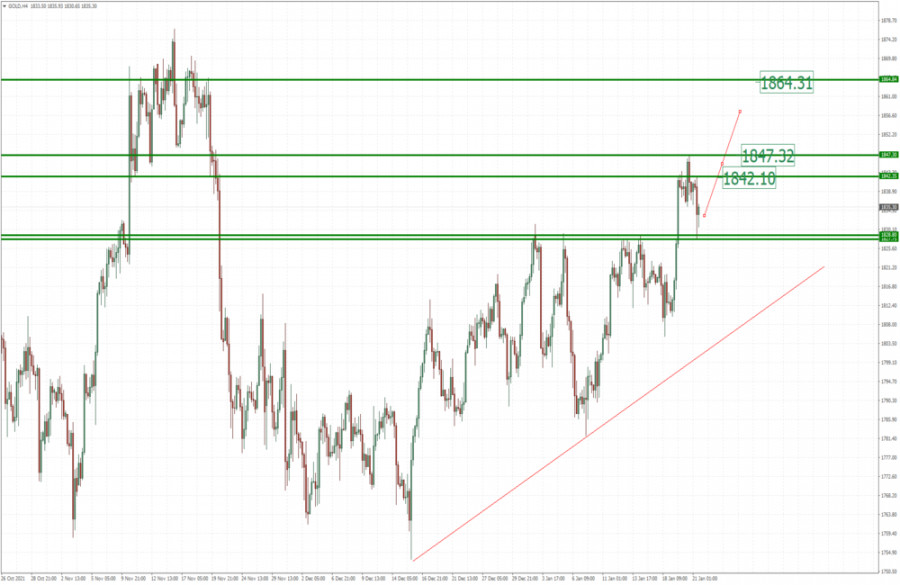
Gold has been trading downside today but I found strong support level at the price of $1,829 and strong rejection, which is good sign for further rally. Trading recommendation: Due to test and reject of key pivot support at the price of $1,828, I see potential for the upside movement today. Watch for buying opportunities on the intraday pullbacks with the upside objectives at $1,842, $1,847 and $1,864. Key support is set at $1,829 The material has been provided by InstaForex Company - www.instaforex.com |
| Analysis of Gold for January 21,.2022 - Potential for the upside movement Posted: 21 Jan 2022 04:44 AM PST Technical analysis:
Gold has been trading downside today but I found strong support level at the price of $1,829 and strong rejection, which is good sign for further rally. Trading recommendation: Due to test and reject of key pivot support at the price of $1,828, I see potential for the upside movement today. Watch for buying opportunities on the intraday pullbacks with the upside objectives at $1,842, $1,847 and $1,864. Key support is set at $1,829 The material has been provided by InstaForex Company - www.instaforex.com |


| You are subscribed to email updates from Forex analysis review. To stop receiving these emails, you may unsubscribe now. | Email delivery powered by Google |
| Google, 1600 Amphitheatre Parkway, Mountain View, CA 94043, United States | |


Comments