Forex analysis review
Forex analysis review |
- The Fed has finished off the last hopes of bitcoin.
- Analysis of GBP/USD on January 29. Results of the month. The potential for a fall in the British remains small.
- EUR/USD analysis on January 29. Results of the month. The dollar has made another breakthrough, but wave C is nearing its
- Analysis of the trading week of January 24-28 for the GBP/USD pair. COT report. The pound continues to fall down in full
- Analysis of the trading week of January 24-28 for the EUR/USD pair. A technical sell signal plus a "hawkish" Fed meeting
- GBP/USD rebound could end anytime
- Wave analysis of EUR/USD on January 28: dollar hitting 18-month high ahead of weekend
- USDCAD at important Fibonacci resistance.
- EURUSD justifies a bounce higher.
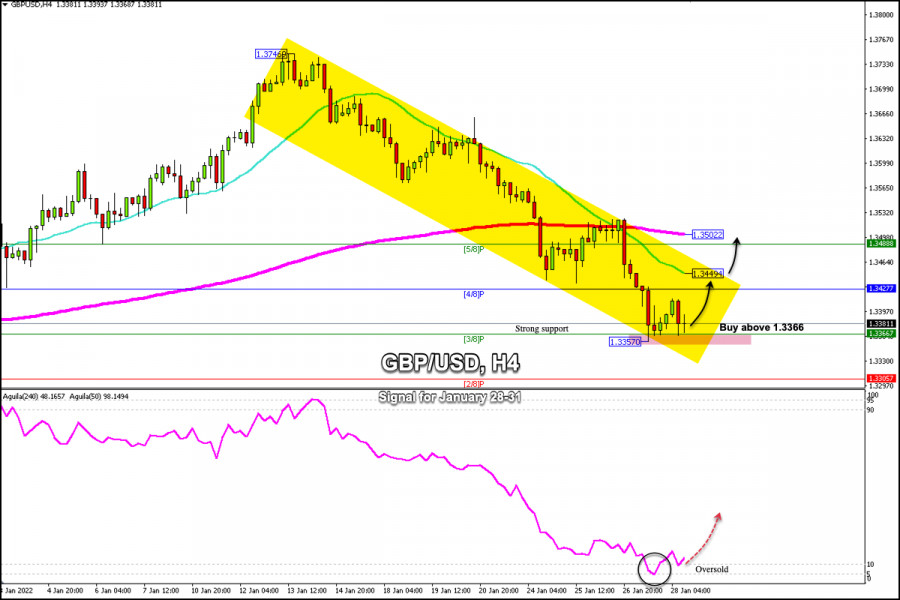
- Trading signals for GBP/USD on January 28 - 31, 2022: buy above 1.3366 (3/8 - strong support)
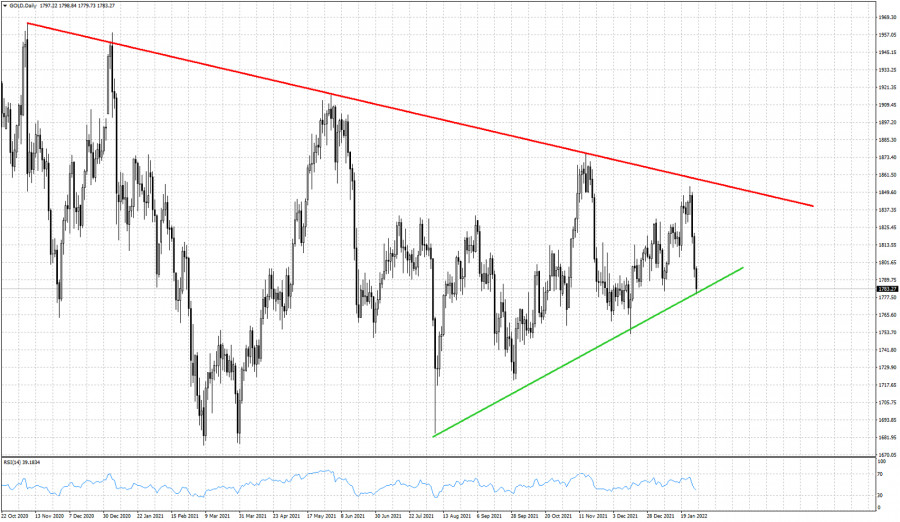
- Gold tests major trend line support.
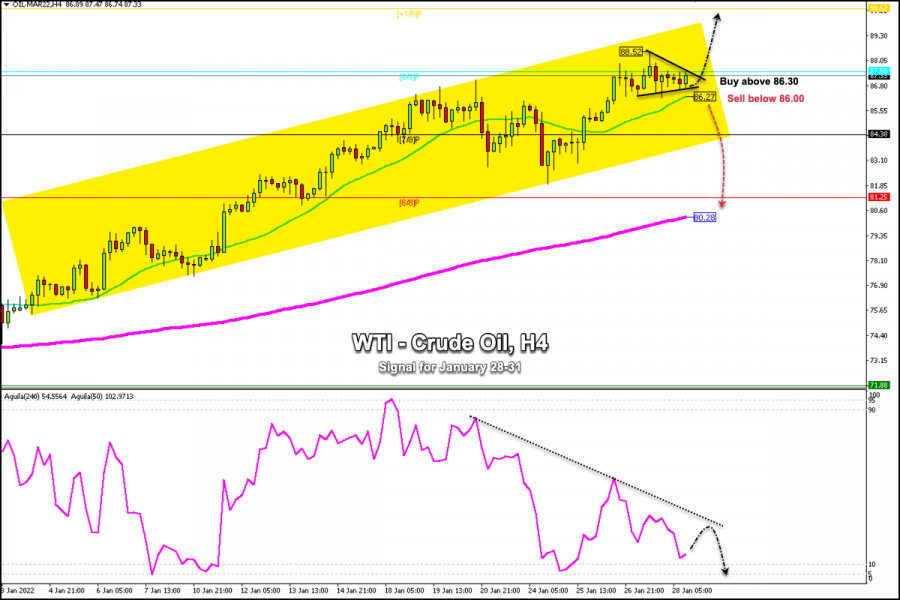
- Trading signals for Crude Oil (WTI - #CL) on January 28 - 31, 2022: buy above 86.30 (8/8 - symmetrical triangle )
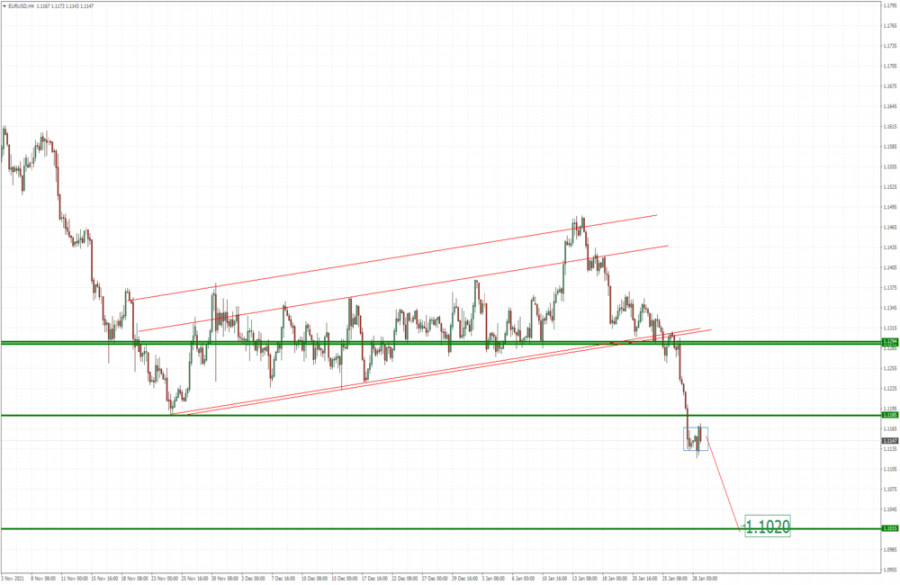
- EUR/USD analysis for January 28, 2022 - Strong breakout to the downside and potential for bigger drop
- Wave analysis of EUR/USD on January 28, 2022
- Could worldwide crypto acceptance harm its value and prices?
- Trading signals for GOLD (XAU/USD) on January 28 - 31, 2022: buy in case of rebound 41,781 (2/8)
- Technical analysis of EUR/USD for January 28, 2022
- EURUSD to mark worst weekly dynamics in last seven months
- Technical analysis of GBP/USD for January 28, 2022
- Video market update for January 28,,2022
- Oil-dollar: current dynamics and market expectations
- Analysis of Gold for January 28,.2022 - Strong downside momentum
- Asia-Pacific indicators show gains
- Ethereum loses its bullish momentum amid decline of interest in futures: what's next?
- EU economy could be hit by sanctions against Russia
| The Fed has finished off the last hopes of bitcoin. Posted: 29 Jan 2022 05:08 AM PST
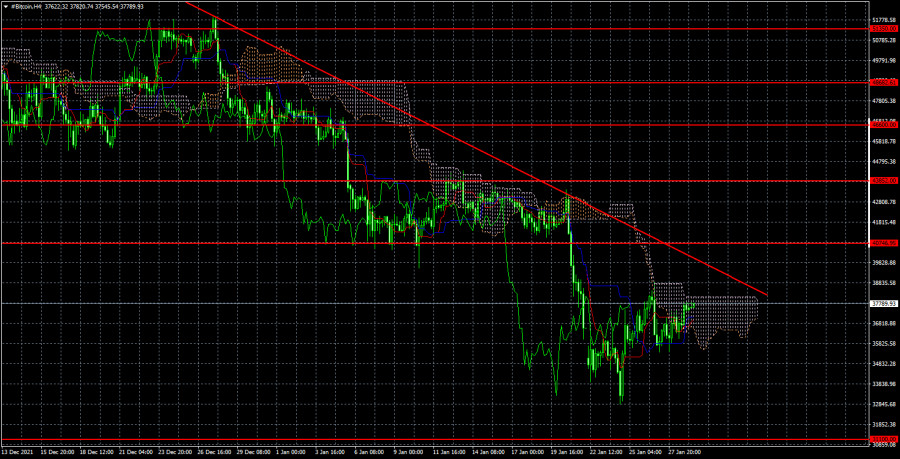
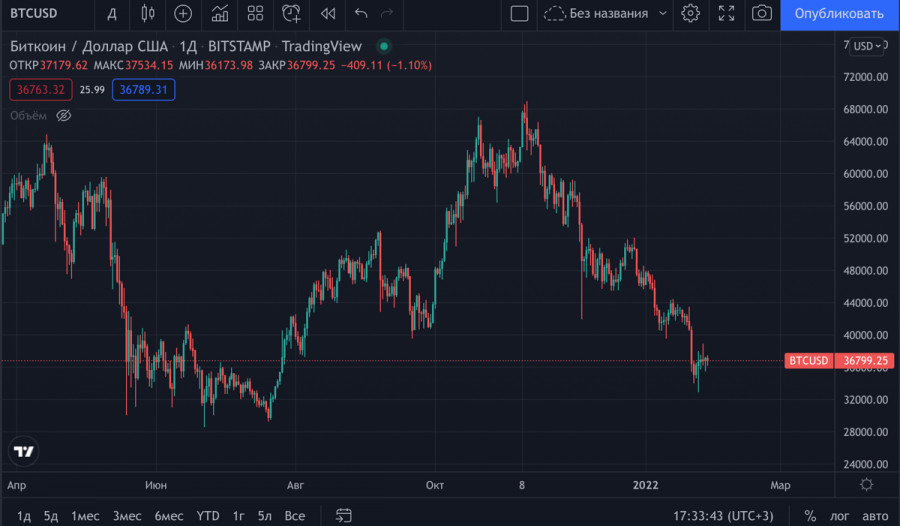
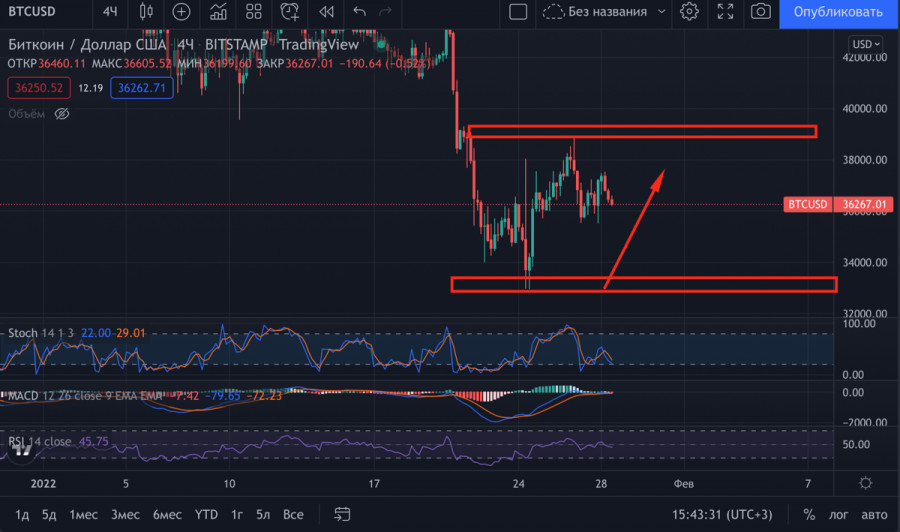
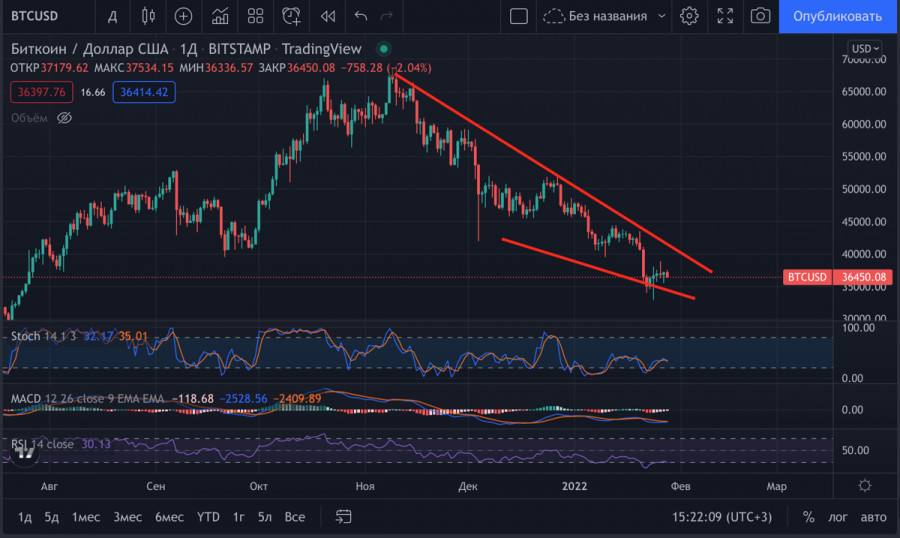
This week, of course, one of the most important events for all markets took place. This event is the Fed meeting. Let's figure out how the first cryptocurrency in the world is moving now, what it can expect in the near future, and also what was the reaction to the most important events. The first thing to start with is the Fed meeting. The reaction, as such, to this event was rather weak. Bitcoin very predictably fell on Jerome Powell's statements about his readiness to raise the key rate throughout 2022. Also, bitcoin could not help but react to a new reduction in the quantitative stimulus program, which will continue to function for exactly one more month, and during this period, bonds worth $ 30 billion will be redeemed. However, bitcoin fell by only $ 2,600 and in the next couple of days recovered all the lost positions. A larger drop in bitcoin occurred on January 20-21. Up to this point in time, the cryptocurrency had been in the side channel of $ 40,746 - $ 43,852 for a long time, and on January 20 it "collided" with a descending trend line. "Collided" just perfectly in accuracy, which is why a new powerful round of falling followed. Thus, bitcoin has already dropped to $ 33,000 per coin this week, and so far there is no reason to expect that the "bearish" trend is over. Even if we consider the Ichimoku indicator on a 4-hour timeframe, the price continues to be located below the Senkou Span B. And, of course, the trend line. Bitcoin is aiming for a new drop with a target of $ 31,100. From our point of view, the decline of cryptocurrency may continue in the coming weeks. First, the goal of $ 31,100 has not been fulfilled. Second, the fundamental background for bitcoin remains very weak. Of course, it is unlikely that bitcoin will lose several thousand dollars of its value every week now. After all, bitcoin has grown stronger in recent years, however, as practice shows, neither institutions, large traders, nor funds, nor anyone else can keep the "bitcoin" from falling if it starts to fall. For a long time, we listened to forecasts from various "experts" who predicted $ 100,000 per coin back in 2021. Only in the last few weeks, several new forecasts have been received on the Internet, which predicts bitcoin's growth in 2022 to $ 100,000 and above. However, now the cryptocurrency is at around $ 37,000 and is more inclined to continue falling. Until the moment when bitcoin overcomes the downward trend line, it is not worth thinking about buying it. Also, one should not hope that the institutionals will "save the situation" in any case and buy back all the coins that go on sale. Recall that each "bullish" trend on the "bitcoin" ended with a drop of 80-90%. Why can't this happen now? Moreover, there is no positive news for the cryptocurrency market right now. The news comes from all sides only that the regulation of the cryptocurrency sphere is being tightened and taxation of all transactions is being introduced.
On the 4-hour timeframe, the trend remains downward. The cryptocurrency overcame the $ 40,746 level on the fourth attempt, so the decline continues with a target of $ 31,100. We recommend considering bitcoin purchases only if there is a consolidation above the descending trend line. The targets, in this case, will be the levels of $ 40,746 and $ 43,852. But so far there are not enough forces even to overcome the Ichimoku cloud. The material has been provided by InstaForex Company - www.instaforex.com |
| Posted: 29 Jan 2022 05:08 AM PST
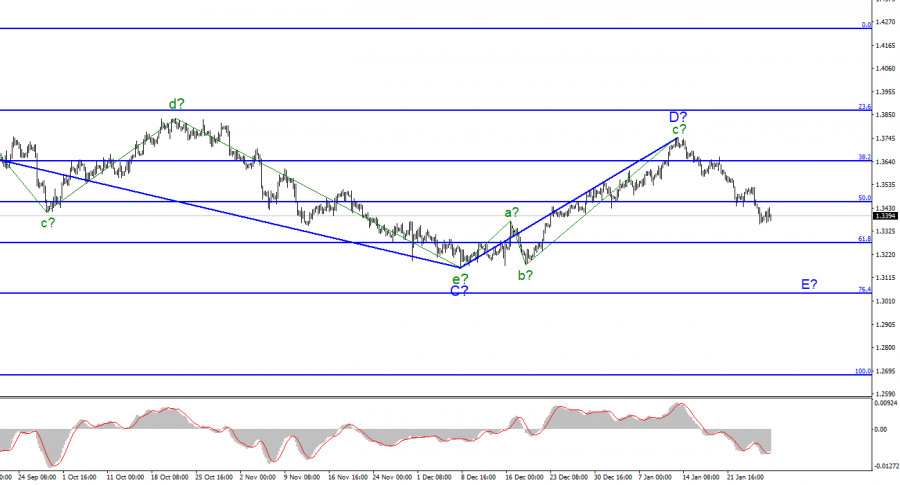
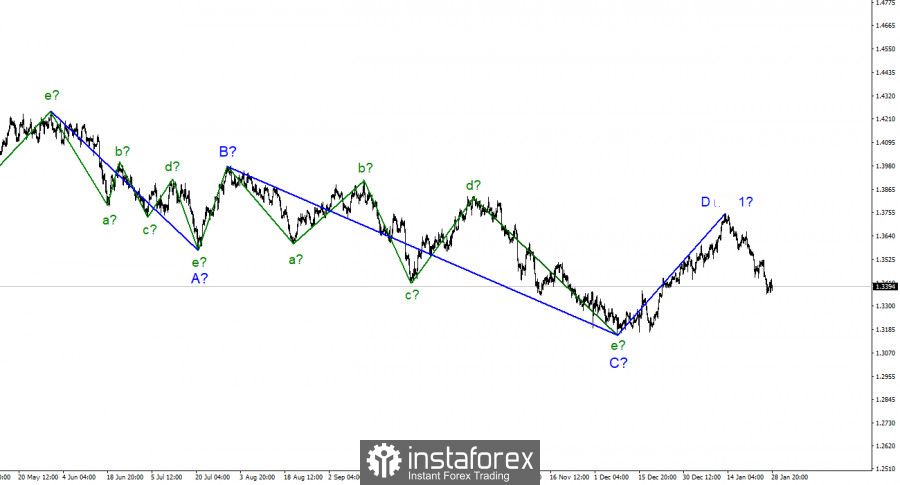
For the pound/dollar instrument, the wave markup continues to look convincing. In the last few weeks, the instrument has been at the stage of building an upward wave, which is currently interpreted as wave D of the downward trend section. However, if the current wave layout is correct, then this wave has completed its construction and the construction of wave E has begun. Thus, the entire downward section of the trend can take on an even more extended form. Wave D has taken a clear three-wave form and its internal wave marking does not cause any questions now. A successful attempt to break through the 50.0% Fibonacci level, which corresponds to 1.3458, indicates that the markets are ready for new sales of the British. Within the assumed wave E, lower-order waves are now being overlooked with great difficulty. There are five of them, but the low of wave E has not yet gone beyond the low of wave C. Thus, these may be waves of the most junior order. In other words, five waves are constructed as part of 1 or a-E. Both the euro and the pound may continue to fall in price in the coming weeks, as the wave marking for both instruments suggests a continuation of the decline. The British can hope for a small increase if the Bank of England raises the rate. The exchange rate of the pound/dollar instrument for January moved in the same way as the euro/dollar instrument. In the first two weeks of January, there was an increase in the instrument, and then a decrease. Wave E can take a very extended form, or it can be shortened. But so far there is no sign of the end of the downward wave for the British. In January, the market's attention was focused on America. In the UK, several important reports were released only a week earlier, but some of them turned out to be strong (unemployment rate, inflation rate), some failed (retail sales). Whatever the news background in Britain, both the euro and the pound moved identically. And this leads me to think that the market took into account only the American news background. And when it wasn't there, it traded based on the wave markup. Now that the wave pattern has remained relevant, the demand for the US currency must continue to grow. And for this, it is necessary that the markets either ignore the news background (which is unlikely to always be on the dollar's side now) or win back only the most important reports that would not violate the wave markup. I believe that the second option will be implemented. Thus, if the Bank of England raises the key rate next week, it may lead to the construction of a corrective wave 2 or b-E. After that, the decline in the quotes of the British may resume. General conclusions. The wave pattern of the pound/dollar instrument assumes the construction of an assumed wave E. A successful attempt to break through the 1.3458 mark allowed us to continue selling the instrument with targets located near the estimated 1.3271 mark, which corresponds to 61.8% Fibonacci. You can also sell using MACD signals "down". I am not considering alternative options right now, since there is no reason for this. The wave E can get a clear five-wave structure.
On the higher scale, wave D also looks complete, but the entire downward section of the trend does not. Therefore, in the coming weeks, I expect the instrument to continue to decline with targets below the low of wave C. Wave D turned out to be a three-wave one, so I cannot interpret it as wave 1 of a new upward trend section. The material has been provided by InstaForex Company - www.instaforex.com |
| Posted: 29 Jan 2022 05:08 AM PST
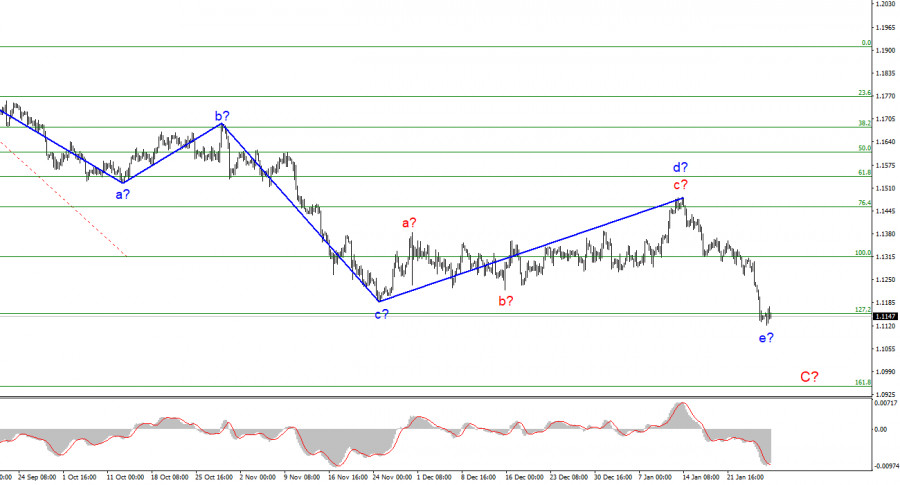
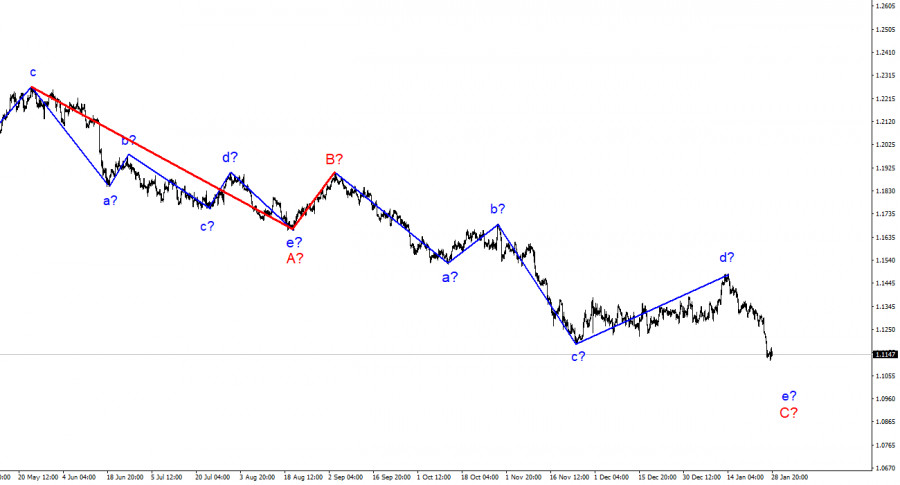
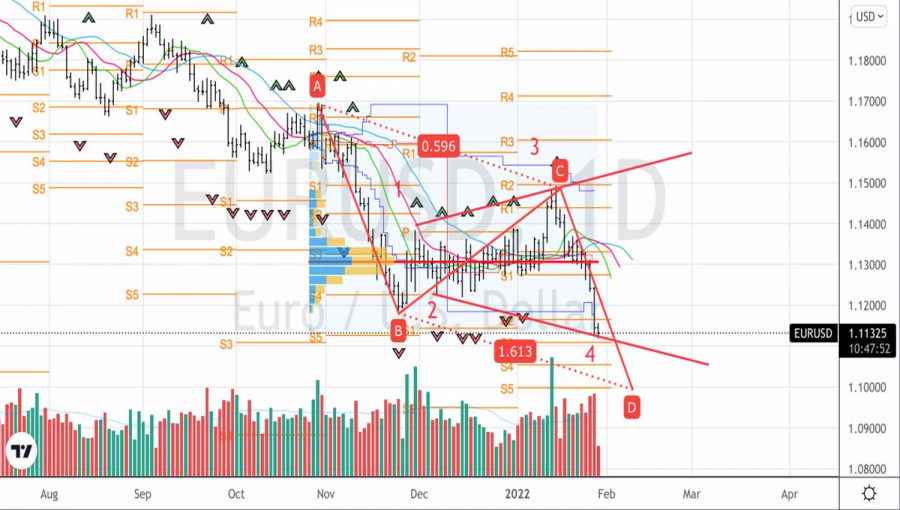
The wave marking of the 4-hour chart for the euro/dollar instrument still looks convincing. Wave d turned out to be more extended than I originally expected, but this does not change the essence of the wave marking. The decline in the quotes of the instrument in the last two weeks has led to the fact that the low of the wave c-C has been broken, so the current descending wave is already quite definitely the wave e-C, as I assumed earlier. Consequently, the entire wave C has assumed a five-wave form, and no internal waves are visible inside its wave e yet. Thus, this wave can also take either a pronounced five-wave form, or vice versa shortened. And in the second case, it is already nearing its completion. A successful attempt to break through the 1.1152 mark, which corresponds to 127.2% Fibonacci, will indicate that the market is ready to sell the instrument. But I admit that in the next week or two this wave may come to an end. Are there any prospects for further growth in the dollar? In the second half of the month, the instrument decreased by 360 basis points. After such a strong decline, I would expect to see at least an internal correction wave in the composition of e-C. However, the current wave marking is such that this wave may not be. Wave e can end very quickly and abruptly, and after it, the construction of either a new upward trend segment or a global wave D should begin, which will again be corrective. And this means that it can turn out to be of any length, three-wave, five-wave, and so on. In general, in almost any case, after the completion of wave C, I expect a certain increase in the instrument, but in global terms, it may not be so strong, in the area of 15-17 figures. The news background in January was not the strongest. The Nonfarm Payrolls report in the US turned out to be weak, inflation continued to rise and is already 7%, and the Fed announced its readiness to raise the interest rate, fully complete the QE program in March, and in the summer, perhaps, start selling off bonds that have accumulated on its balance sheet. All this may keep the demand for the US currency high in the coming months and even years. The Fed is going to normalize monetary policy next year, too. And, since we are currently building a correction section of the trend (waves A-B-C), then it can turn out to be much longer and more complicated than it is now. I would say that it is quite possible to continue its construction for most of 2022. General conclusions. Based on the analysis, I conclude that the construction of the ascending wave d is completed. Now, it is necessary to sell the instrument based on the construction of the wave e-C with targets located near the estimated mark of 1.0948, which equates to 161.8% Fibonacci. An unsuccessful attempt to break through the 1.1152 mark may lead to the construction of an upward correction wave in the composition of e-C.
On a larger scale, it can be seen that the construction of the proposed wave e-C is now continuing. This wave may turn out to be a five-wave, or it may be shortened. Considering that all the previous waves were not too large and were approximately the same size, the same can be expected from the current wave. I think there is a better chance that this wave will complete its construction soon. The material has been provided by InstaForex Company - www.instaforex.com |
| Posted: 29 Jan 2022 12:26 AM PST Long-term perspective.
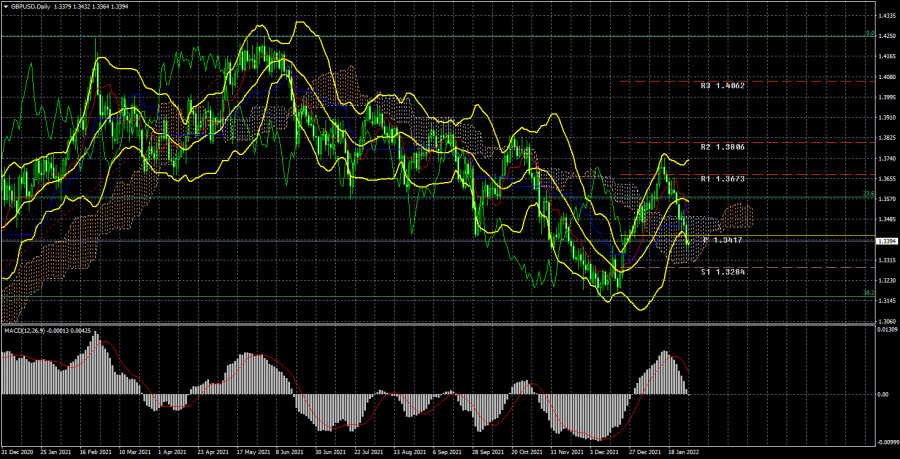
The GBP/USD currency pair has fallen by another 160 points during the current week. This, by the way, is not the worst option, since the volatility showed by the pound/dollar pair practically coincides with the volatility of the euro/dollar pair. And this rarely happens, usually, the pound is traded more volatile. As a result, the price easily overcame the Senkou Span B and Kijun-sen lines this week, so we can assume that it resumed the downward trend. If you remember, we said at the end of last year that we expect an upward movement of 400-500 points, after which the downward trend may resume. This is the nature of the movement observed in the pair in the last 13-14 months, which is visible in the illustration above. The pair will not move like this forever. But it's still moving that way. Thus, in technical terms, we now expect a fall to the previous local minimum of about 1.3162 and, possibly, even overcoming this level. By the way, many probably noticed the difference between the euro and the pound. If the euro currency has already updated its previous minimum, then the pound still needs to go down about 230 points to do the same. However, we recall that next week there will be meetings of the Bank of England and the ECB, and the British regulator has much more chances to change monetary policy, which can provoke a strong movement in the British pound. But strong movements are not expected for the euro currency, as no changes in rhetoric or monetary policy are expected from the ECB. Therefore, if we assume that traders will be disappointed with the results of the BA meeting, then the pound may fall next week and "catch up" with the euro. However, of course, the opposite option is also possible. COT analysis. The latest COT reports on the British pound signal only one thing: the end of the downward trend. Thus, we can at least conclude that the downward trend is nearing its end. The green line of the first indicator (the net position of the "Non-Commercial" group) first moved to zero from top to bottom, therefore it went much below the zero mark, and now it has returned to it. In addition, in recent weeks, the green and red lines have been moving towards each other, which signals the end of the trend. In our case, a downward trend. Thus, even if the fall of the British pound continues to the previous low, the trend may still end in the near future. Or, COT reports should again begin to indicate an increase in the "bearish" mood among professional traders. At the moment, COT reports suggest that the mood of the major players remains "bearish", but "minimally bearish", so to speak. The trend is now to strengthen the "bullish" intentions. Thus, we now expect the pound to fall to the level of 1.3162, but this round of decline may be the last. Analysis of fundamental events. In principle, everything we said in the article on the euro/dollar is also relevant for the pound/dollar, since there were no important macroeconomic statistics and fundamental events during the week in the UK. A couple of not the most important reports that did not have any impact on traders. In this regard, next week will be much more interesting, as the BA meeting will take place. And, according to the forecasts of many experts, the British regulator may raise the key rate. Naturally, such a decision by BA can provoke a storm of emotions in the foreign exchange market for those pairs in which the pound is present. In the same week, we saw a similar storm of emotions due to the Fed meeting and Jerome Powell's speech. Although, there is reason to assume that the British currency would have continued to fall in any case, even without the "hawkish" meeting of the Fed. For example, the pound sterling collapsed on Monday, when there were no special reasons for this. Thus, we believe that traders are now paying more attention to "technology". And it is based on technical analysis that we can expect a further fall in the pound sterling. In the UK, now it is possible to note only the indices of business activity in the fields of production and services, which decreased in January but did not decrease at all critically. Just a few tenths of a point. Trading plan for the week of January 31 - February 4: 1) The pound/dollar pair overcame the Kijun-sen and Senkou Span B lines and was ready to form a new upward trend. But it is already below these lines, so we are talking about the resumption of the downward trend, which may also end in the coming weeks/months. Thus, the new overcoming of the Kijun-sen and Senkou Span B lines should significantly increase the probability of growth of the British currency in the medium term. To buy a pair, you need to wait for this signal again. 2) The bears quickly regained the initiative in their own hands. Since the price has overcome the Senkou Span B and Kijun-sen lines, it is now necessary to consider sell orders again with a view to the Fibonacci level of 38.2% (1.3162). It is not a fact that the pound will continue to fall below this level, but it has every chance of reaching it. Next week, the "foundation" will again be of great importance. It can affect the technical picture. Explanations to the illustrations: Price levels of support and resistance (resistance /support), Fibonacci levels - target levels when opening purchases or sales. Take Profit levels can be placed near them. Ichimoku indicators (standard settings), Bollinger Bands (standard settings), MACD (5, 34, 5). Indicator 1 on the COT charts - the net position size of each category of traders. Indicator 2 on the COT charts - the net position size for the "Non-commercial" group. The material has been provided by InstaForex Company - www.instaforex.com |
| Posted: 29 Jan 2022 12:10 AM PST Long-term perspective.
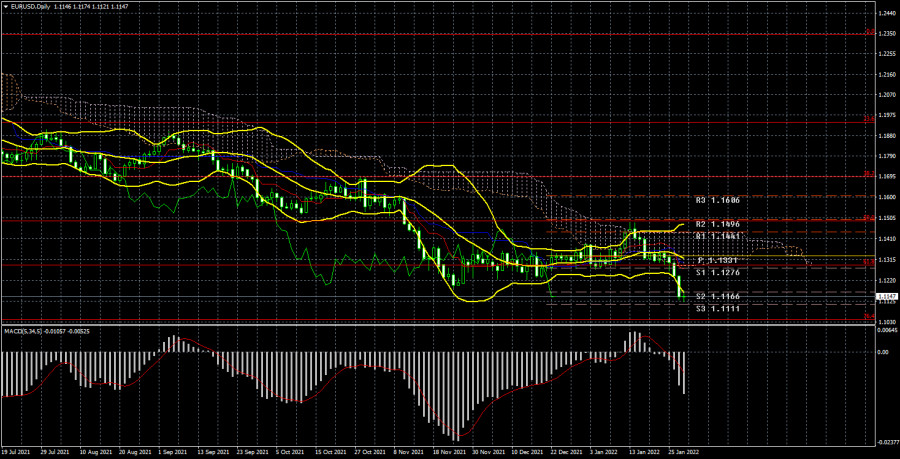
The EUR/USD currency pair continued to fall during the current week and this is very important from the point of view of understanding the whole technical picture. The most important signal was formed two weeks ago when the pair rose to the level of 1.1475 but was unable to overcome the upper boundary of the Ichimoku cloud on the 24-hour timeframe - the Senkou Span B. Thus, once again, after a slight correction, the downward trend resumed, and the bulls are unable to overcome either Kijun-sen or Senkou Span B. And it was this rebound that initially provoked the resumption of the growth of the US dollar. Well, this week, the dollar rose by 160 points in two days thanks to the results of the Fed meeting, which turned out to be even more "hawkish" than the most ardent optimists expected. By and large, all the main movement of the pair down this week was provoked only by the Fed meeting and Jerome Powell's speech. After all, even when an important and strong report on US GDP for the fourth quarter was published the next day, the US dollar did not continue to grow. Thus, Powell and the Fed are "to blame" for everything. We should also understand what to expect from the euro/dollar pair now? On the one hand, Powell gave a clear signal that monetary policy will be constantly tightened throughout the year. This is a clear bullish factor for the US currency. On the other hand, Powell has already absolutely revealed all the cards and now the markets clearly understand what to expect in 2022. And this factor may be worked out "quickly", after which the growth of the US currency will stop. After all, the dollar can't grow forever. But it is important to understand here that the assumption that the dollar will stop growing is a fundamental hypothesis that is not currently supported by technical signals. COT analysis. The new COT report, which was released yesterday, turned out to be very interesting. First of all, from the point of view that the European currency, even without adjusting, began a new decline, but at the same time, recent COT reports indicate an increase in buy contracts by non-commercial traders, which are the most important category. Recently, their net position has grown, and the mood has become "bullish" again. "Moderately bullish." However, over the past two weeks, the euro has fallen by 350 points, which does not correspond to the mood of professional players. However, this data should not be misleading. First, the last drop of 150 points after the Fed meeting happened at the end of the week, so these days were not included in the latest COT report (it comes out three days late). Second, if we cut off the last round of the fall of the euro currency, it turns out that there has not been any strong fall yet. The mood of traders may change in the direction of "bearish" in the next COT report, or it will not change, but then the euro will stop getting cheaper. The green and red lines of the first indicator (the net positions of the "Non-commercial" and "Commercial" groups) are currently moving away from each other, which indicates the beginning of a new trend. The growth of the green line indicates the beginning of a new upward trend. Therefore, we need to wait for the next COT report so that we can make a more accurate conclusion. Analysis of fundamental events. What to say about the "foundation" this week? First, it was the strongest in the US. Second, it was absent from the European Union. By and large, this week, there were two key events that traders worked out. Naturally, this is the Fed meeting, its results Jerome Powell's speech, and the GDP report for the fourth quarter. Although, as we have already said, after the publication of the GDP report, the dollar no longer grew. Nevertheless, the report still turned out to be strong in favor of the US dollar, as the US economy grew by 6.9% q/q against forecasts of +5.3%. Thus, from our point of view, there was a movement that should have happened. It remains only to understand whether the downward movement can continue? The ECB will hold a meeting next week, but it is unlikely to provide any important information and support for the European currency. Thus, the "foundation" now says that the dollar will continue to grow. However, do not forget about the "technique". Trading plan for the week of January 31-February 4: 1) On the 24-hour timeframe, the pair tried to start a new upward trend, but the Senkou Span B line could not be overcome. Therefore, a new round of downward movement began, and the price, as we expected, went below 1.1230. Thus, now we should consider sales with targets of 1.1111 and 1.1040. The "foundation" is still on the side of the bears. 2) As for purchases of the euro/dollar pair, in the current conditions, they should be considered no earlier than fixing the price above the Ichimoku cloud, because the price in 2021-2022 overcame the Kijun-sen several times, but then could not continue moving up. There are no fundamental prerequisites for a new uptrend to begin in the near future. The hope of the euro currency is still to saturate the buyers of the dollar. Explanations to the illustrations: Price levels of support and resistance (resistance /support), Fibonacci levels - target levels when opening purchases or sales. Take Profit levels can be placed near them. Ichimoku indicators (standard settings), Bollinger Bands (standard settings), MACD (5, 34, 5). Indicator 1 on the COT charts - the net position size of each category of traders. Indicator 2 on the COT charts - the net position size for the "Non-commercial" group. The material has been provided by InstaForex Company - www.instaforex.com |
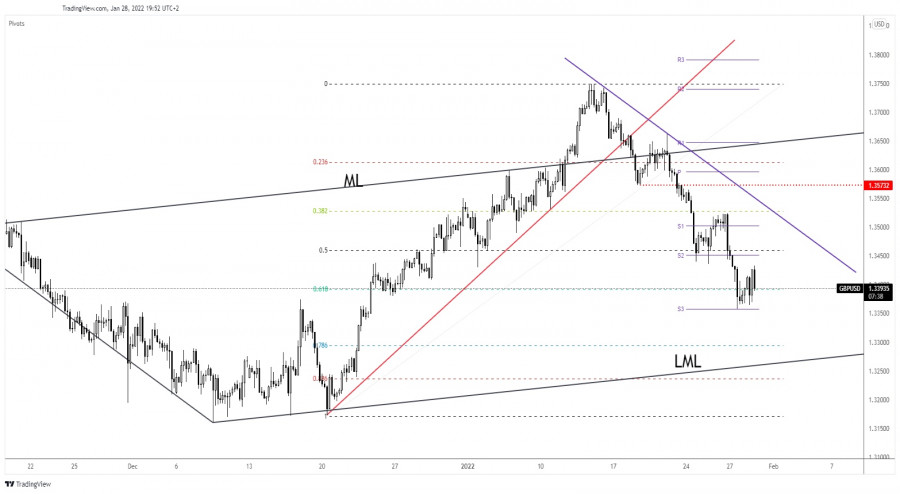
| GBP/USD rebound could end anytime Posted: 28 Jan 2022 11:35 AM PST GBP/USD plunged in the last hours after reaching the 1.3432 level. At the time of writing, it was traded at 1.3390. The bias remains bearish as the Dollar Index is bullish despite its temporary retreat. Actually, the DXY was expected to drop a little after the last leg higher. The pair rebounded only because the DXY dropped. Fundamentally, the US Core PCE Price Index registered a 0.5% growth matching expectations, while the Revised UoM Consumer Spending dropped unexpectedly from 68.8 to 67.2 points. In addition, Personal Spending came in line with expectations, but the Personal Income reported worse than expected data. GBP/USD erases today's gains
GBP/USD found support at the weekly S3 (1.3357) but it has failed to stabilize above the 1.34 psychological level and above the 61.8% retracement level signaling strong sellers. A temporary rebound was natural after the last sell-off. Stabilizing below the 61.8% (1.3392) retracement level may announce a downside continuation. A new lower low, a bearish closure below 1.3357 may activate a deeper drop towards the 1.3300 psychological level. GBP/USD predictionAs long as it stays under the downtrend line, GBP/USD could drop towards new lows. Dropping and closing below 1.3357 S3 may validate a downside continuation and could bring new selling opportunities. The lower median line (LML) could attract the price after failing to stabilize above the median line (ML). The material has been provided by InstaForex Company - www.instaforex.com |
| Wave analysis of EUR/USD on January 28: dollar hitting 18-month high ahead of weekend Posted: 28 Jan 2022 11:14 AM PST
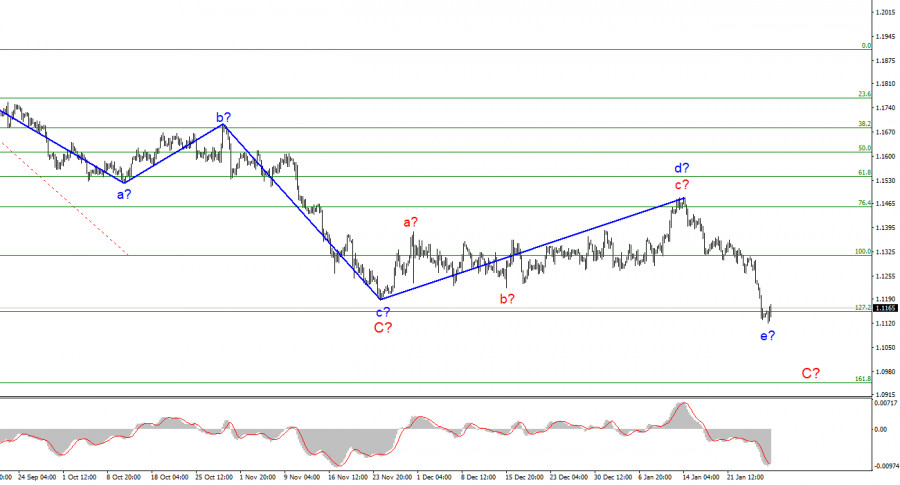
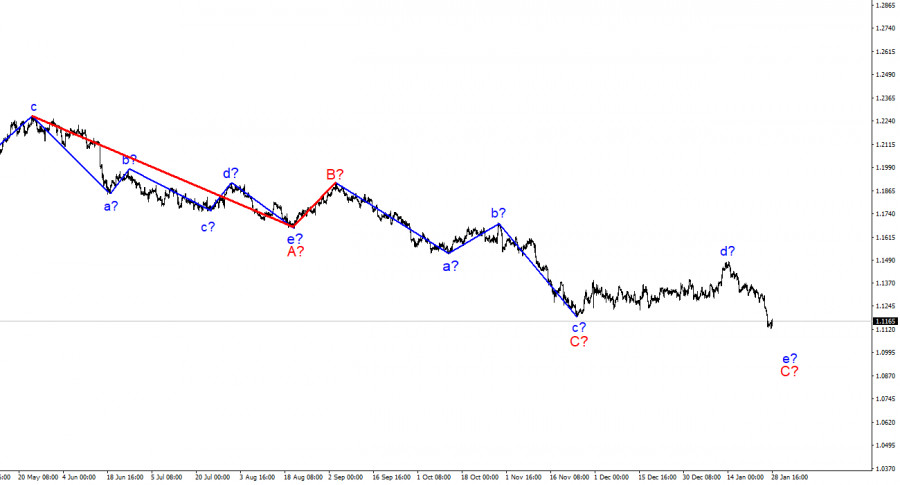
The wave picture in the 4-hour EUR/USD chart still looks rather convincing. The d wave turned out to be longer than expected. Still, it does not change the meaning of the wave structure. Last week's decline in the pair resulted in a break of the low of the c wave within C. Therefore, the current downward wave is undoubtedly the e wave within C just as I thought. As a result, the C wave consists of five sub-waves. The e wave, in turn, may also become much longer and consist of five smaller waves. A successful break of 1.1152 (127.2% Fibo) will indicate bears' readiness to continue selling EUR/USD. Still, traders decided to take a break ahead of the weekend. Today's news feed lacked any significant reports, and market participants seemed to be tired of the busy week. Will the USD bullish trend continue?On Friday, EUR/USD barely added 25 pips. The intraday range was also about 25 pips. So, the market was less active than yesterday or the day before yesterday. However, it is not surprising as a bunch of important reports saw the light in the United States on Wednesday and Thursday. Amid that, a new downward wave appeared which may become longer. Moreover, the general trend that started on May 25, 2021 may turn into the 5-wave structure. Currently, it is of the A-B-C type but it has every chance of becoming the A-B-C-D-E one. It may happen if the fundamental factors continue to be favorable for the US dollar. There is every indication that the year 2022 will be a rather good one for the American currency. The Federal Reserve can afford to take the most hawkish stance in comparison with other central banks, in particular, the ECB and the Bank of England. The European financial regulator has no intentions of hiking the rate this year. The most decisive action it can take is to withdraw from the emergent PEPP stimulus program and the basic APP program. In addition, the current economic indicators are rather disappointing. The EU consumer confidence index came in at -8.5 points. It is a minor report, but it clearly reflects the current state of things. Things are not going smoothly in the United States either, but inflation will continue to put pressure on the Fed until it starts to decline to 2%. And the Fed will have no other choice but to use all available tools to restrain inflation and prevent it from increasing further. These factors may last for most of this year and they are positive for the US dollar. The current wave picture indicates a further decline of the instrument. So these expectations may turn out to be valid. General conclusionI can conclude that the d wave has been completed. Therefore, it is reasonable to sell EUR/USD in case of the wave e within C forms with the target at 1.0948 (161.8% Fibo). If the level of 1.1152 fails to be broken, it may result in the completion of an upward corrective wave e within C.
As seen on a larger scale, the construction of the alleged wave e within C is now continuing. This wave may turn out to consist of five smaller waves, or it may become shorter. Bearing in mind that all previous waves were not too long and were of the same size, the current wave is likely to be the same. I expect this wave to get completed in the near future. The material has been provided by InstaForex Company - www.instaforex.com |
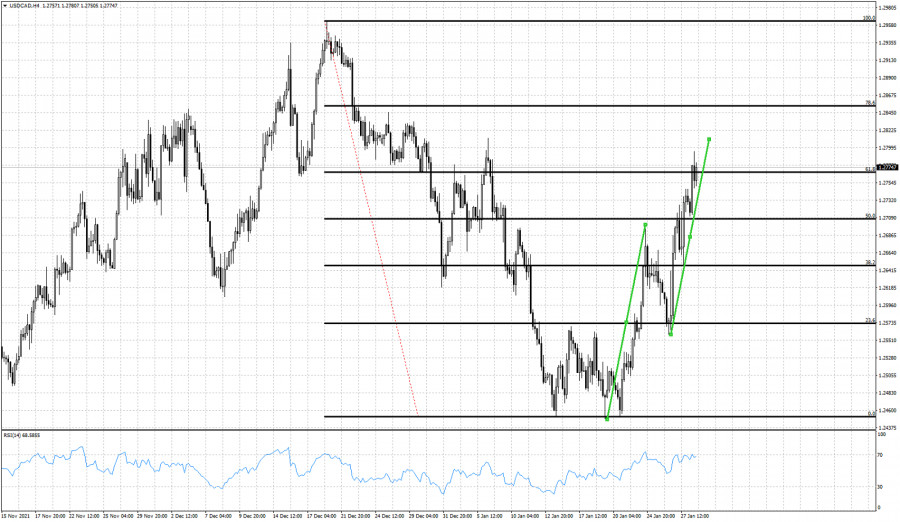
| USDCAD at important Fibonacci resistance. Posted: 28 Jan 2022 08:33 AM PST USDCAD is trading around 1.2764. Short-term trend is bullish but price has reached important resistance at 1.2767 where we find the 61.8% Fibonacci retracement of the entire decline from 1.2962 to 1.2450.
Green lines - Equal size upward movements USDCAD is very likely to turn lower and form an important top at recent highs at 1.2795. First of all as we mentioned above, price has reached the key Fibonacci resistance at 1.2767. Moreover the second leg higher is almost equal to the first upward movement from 1.2450 to 1.27. Price continues making higher highs and higher lows, technically trend remains bullish. A break below 1.27 would be the first signal of a reversal to the downside. The material has been provided by InstaForex Company - www.instaforex.com |
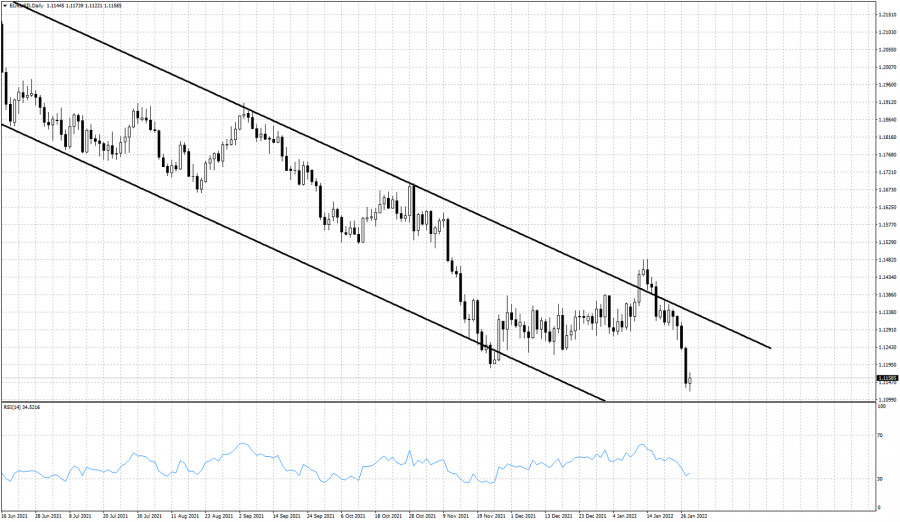
| EURUSD justifies a bounce higher. Posted: 28 Jan 2022 08:21 AM PST EURUSD made a new lower low today at 1.1122 but is now positive for the day above 1.1160. It is normal at the end of a bearish week to see profit taking and price bouncing. Trend remains bearish and we consider this move higher as a counter trend bounce.
EURUSD is bouncing today and as we said above, this is most probably due to the profit taking from bears closing short positions in order to avoid holding them during the weekend. Next week I expect Monday to start on a positive note. Price justifies a bounce towards 1.12 but I believe we should expect a new rejection and a new move lower. I do not believe the downward move is finished. The material has been provided by InstaForex Company - www.instaforex.com |
| Trading signals for GBP/USD on January 28 - 31, 2022: buy above 1.3366 (3/8 - strong support) Posted: 28 Jan 2022 08:15 AM PST
Early in the American session, the British pound is trading above the support of 3/8 Murray. After having found a strong bottom in this area, GBP is showing signs of a small recovery. The objectives will be to go up towards 4/8 Murray located at about 1.3427. The dollar index (#USDX) hit a high of 97.37, having reached overbought levels. It is likely that in the next few hours there will be a correction which could favor the recovery of the British pound and the other currency pairs that trade against the dollar. The zone of 3/8 Murray has been tested several times and has become a strong bottom for the British pound. This is a good sign to buy above 1.3366 with targets at 21 SMA 1.3449 and up to 200 EMA located at 1.3502. On January 26, the eagle indicator reached the 5-point level. It means that sterling is extremely oversold. So, this is a positive sign for the British Pound and we could have an opportunity to buy at current prices levels with targets at 1.3500 until the next week. The material has been provided by InstaForex Company - www.instaforex.com |
| Gold tests major trend line support. Posted: 28 Jan 2022 08:14 AM PST Gold price has broken below $1,800 and is now trading just above the $1,780 level. Price is challenging the major upward sloping support trend line coming from the $1,684 low. Gold price was expected to pull back towards this support after the rejection at $1,854.
Green line -support Gold price is very close to the support trend line. This is not the time to be opening short positions because we are above key support. A reversal and bounce off the green support trend line is justified. Bears need to be cautious in case we get a reversal signal. In the near term if bulls manage to recapture $1,800, we will then get our first reversal signal. The material has been provided by InstaForex Company - www.instaforex.com |
| Posted: 28 Jan 2022 07:31 AM PST
In the early American session, WTI (#CL) is trading around 86.50, just below 8/8 Murray and below its high of 88.52. According to the 4-hour chart, the trend for crude remains bullish, so our opportunity will be to continue buying while WTI remains above the 21 SMA located at 86.30. If in the next few hours Crude Oil consolidates again above 87.50 (8/8), it will be an opportunity to buy with targets towards +1/8 of Murray located at 90.62. The escalating jitters between Russia and Ukraine will drastically affect the energy markets. If the conflict escalates into war, this would push oil prices to the $125 level, as reported by Rabobank strategists. Assuming all countries stop Russian energy purchases, the potential impact on prices would be huge, with oil rising to $175 and European gas to $250. This Crude scenario could affect the global economy, a very expensive oil, will also raise the prices of raw materials and basic foods that affect the final consumer. Conversely, if Crude oil consolidates below the 21 SMA located at 86.27 and makes a daily close, it will be an opportunity to sell with targets at 84.38 and until the 200 EMA located at the psychological level of 80.28. Our trading plan for the next few hours is to continue buying crude with targets at 90.62. We can see the formation of a symmetrical triangle pattern. A break above this pattern could trigger a new round of buying WTI with targets towards 90.62 (+1/8). The material has been provided by InstaForex Company - www.instaforex.com |
| Posted: 28 Jan 2022 07:03 AM PST Technical analysis:
EUR/USD has been trading sideways today at the price of 1,1150 but there is still potential for the downside continuation due to strong downside cycle in the background. Trading recommendation: Due to strong downside momentum in the background and the breakout of key multi year pivot at the price of 1,1185, I see potential for bigger drop in next period. My advice is to watch for selling opportunities on the rallies with the downside objective at 1,1020 Resistance is set at the price of 1.1185 The material has been provided by InstaForex Company - www.instaforex.com |
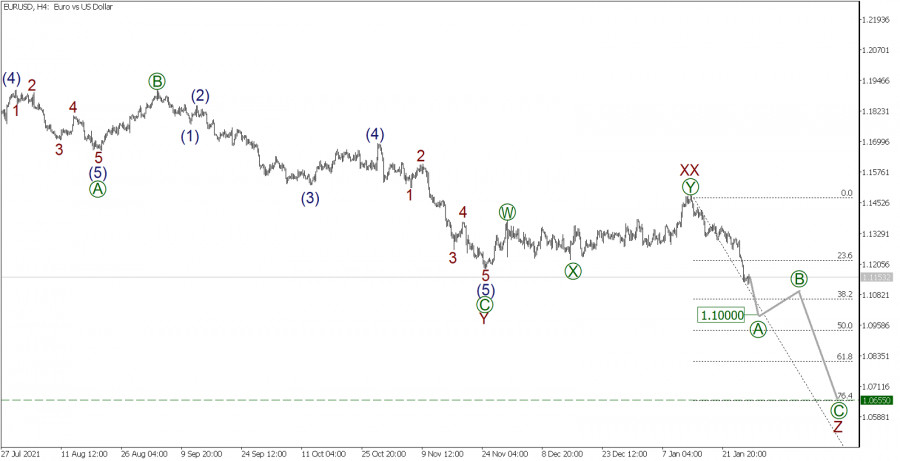
| Wave analysis of EUR/USD on January 28, 2022 Posted: 28 Jan 2022 06:43 AM PST EURUSD, H4:
The market continues to move according to the previously chosen scenario. A downward movement of the market and the construction of a complex corrective pattern are expected. It is possible that a triple zigzag W-X-Y-XX-Z is forming. Most likely, the first four parts of this triple zigzag are already fully completed, that is, we are talking about W-X-Y-XX sub-waves. The initial part of the final active wave Z is now in the development stage. Wave Z is supposed to take the form of a standard zigzag [A]-[B]-[C]. Now the price is going down in the first wave [A], which may take the form of an impulse. Its end is expected near the level of 1.100. Then, after a small correction [B], the decline can be continued in the sub-wave [C] towards the level of 1.065. The level of 1.065 was determined using a tool - the Fibonacci line. At this level, the value of wave Z will be 76.4% of wave Y. The probability of reaching the specified ratio is high. In the current situation, it is possible to consider short transactions. Trading recommendation: sell 1.1153, take profit 1.1000. The material has been provided by InstaForex Company - www.instaforex.com |
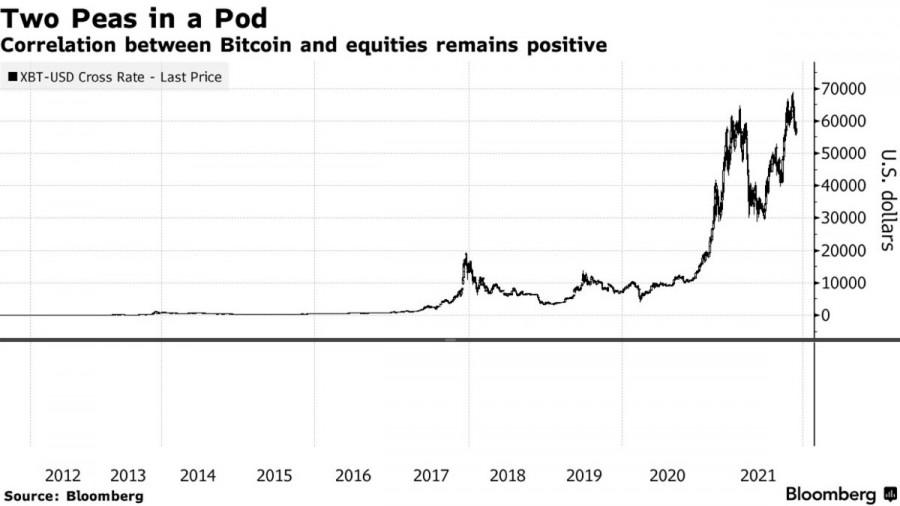
| Could worldwide crypto acceptance harm its value and prices? Posted: 28 Jan 2022 06:42 AM PST In January 2022, several major countries around the world expressed their position on cryptocurrencies. Some advocate for the total ban of digital assets, others support regulating and taxing the crypto sector. The recent market crash, coupled with a record high correlation between BTC and stock market indexes, suggest that cryptocurrencies are now becoming increasingly adopted globally. For many countries, banning such an important sector that could bring sizeable tax income is now counterproductive. Representatives of the Russian government have declined calls for a ban on crypto assets and are set to present a roadmap for crypto market regulation. South Korea is planning to become one of the world's major crypto markets in 5-10 years. The sector is used to lax regulation and a total absence of authority, and although stringent regulation could guarantee the rights and security of investors, it could also be detrimental to cryptocurrencies. According to Goldman Sachs strategists Zach Pandl and Isabella Rosenberg, integrating cryptocurrencies into the modern financial and taxation systems could negate the main value of crypto assets. Digital assets and trading indexes are already increasingly correlated, which could be detrimental to cryptocurrencies. This would make digital assets unsuitable for diversification and risk hedging, as well as take away its status as an alternative financial instrument.
At some point, the crypto industry possibly chose to move towards total regulation, similar to the stock market. This would lead to reduced investment activity and extra taxation. These factors, coupled with the current transaction costs, could be a key factor in rejection of investments into cryptocurrencies. As crypto becomes more assimilated by the financial system, it would become more and more dependent on macroeconomic factors and national policies. Goldman Sachs strategists believe that government regulation is unlikely to push cryptocurrencies up. However, it could bring investments from major funds and state institutions, and increased security would ensure a greater customer base for crypto assets. The correlation between cryptocurrencies and the stock market makes them less valuable as a next generation payment system. "Over time, further development of blockchain technology, including applications in the metaverse, may provide a secular tailwind to valuations for certain digital assets," Golden Sachs strategists noted. "But these assets will not be immune to macroeconomic forces, including central bank monetary tightening," they added. Time will tell whether the recent crypto crash during the stock market correction was only accidental or a true sign of the market's dependence on Fed policy. Bitcoin, which correlates with the SPX and the NASDAQ, is the key gauge of the current situation in the crypto market. BTC has a number of key resistance levels, the main one being located in the $39,000-40,000 area. As of January 28, the upside potential of BTC/USD and the altcoin market is largely determined by the upside potential of major stock indexes.
|
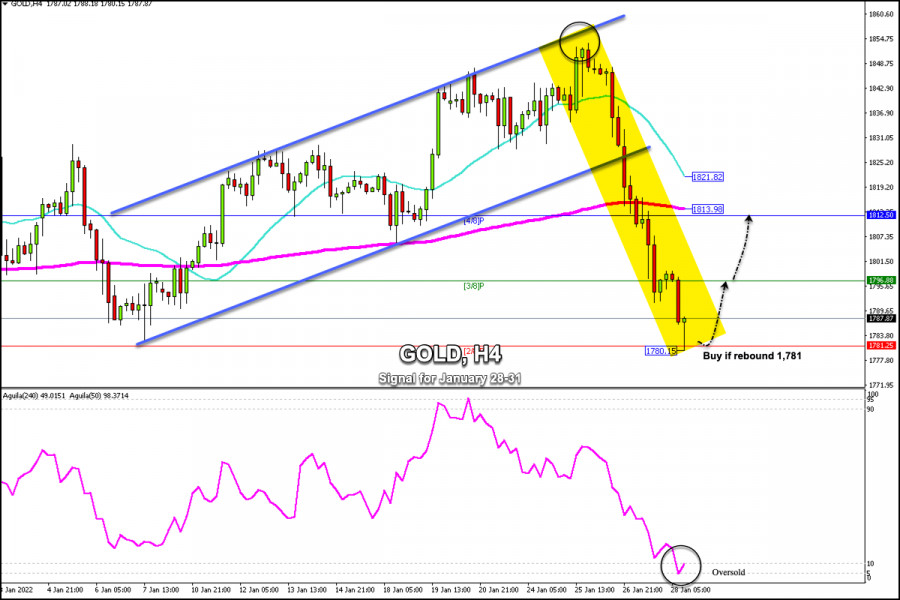
| Trading signals for GOLD (XAU/USD) on January 28 - 31, 2022: buy in case of rebound 41,781 (2/8) Posted: 28 Jan 2022 06:41 AM PST
Gold (XAU/USD) is down sharply for the third day in a row, hitting the intraday low at 1,780.75, right in the zone of 2/8 Murray Gold has lost approximately $73.00 per ounce troy, following an aggressive monetary policy announcement by the US Federal Reserve. The US central bank hinted at a rate hike in March, making it clear that the ECB is also ready to end its financial support due to the pandemic through its bond purchases. This is a sign that investors will now be more willing to invest in the US dollar because in the coming months its interest rate will increase and it will be more attractive to investors. Therefore, gold and other risky assets will be under downward pressure. Gold is likely to fall to the level of 1,700 in the coming months. In the short term, we can see on the 4-hour chart that gold is very oversold. A technical bounce above 2/8 Murray is expected in the next few hours with targets around 1,796 (3/8) and up to 1,812 (4/8). The eagle indicator has reached the line 5-points which represents an imminent technical bounce. As long as gold remains trading above 1,781, there will be an opportunity to buy with targets towards the 200 EMA located at 1,813. Our trading plan is to wait for a bounce off 1,781 as confirmation that gold has reached strong bottom. If the price fails to break below and bounces above 2/8 Murray, it will be an opportunity to buy with targets at 1,812 until the next week. The material has been provided by InstaForex Company - www.instaforex.com |
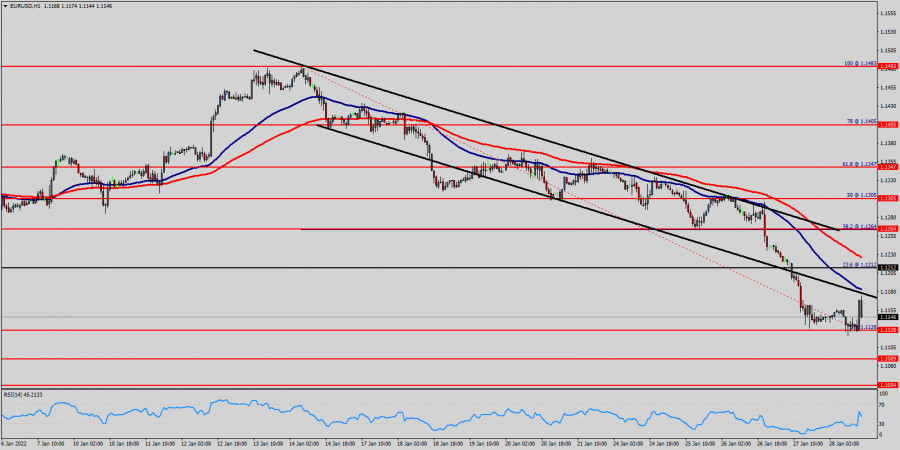
| Technical analysis of EUR/USD for January 28, 2022 Posted: 28 Jan 2022 06:35 AM PST
Yesterday, the EUR/USD pair reached a new minimum at the price of 1.1130. So, today the price may reach one more minimum around the spot of 1.1130, which coincides with the double bottom. Today, the EUR/USD pair is challenging the psychological resistance at 1.1212. Hence, the resistance is seen at the level of 1.1212 in the one-hour time frame. We expect the EUR/USD pair to continues moving in a downtrend below the level of 1.1212 towards the first target at 1.1089, while major resistance is found at 1.1264 (38.2% Fibonacci Expansion). On the downside, a clear break at the level of 1.1128 could trigger further bearish pressure testing 1.1089, which represents the major support today. As a result, it is gainful to sell below this price of 1.1160 with targets at 1.1089 and 1.1054. However, the bullish trend is still expected for the upcoming days as long as the price is above 1.1264. The material has been provided by InstaForex Company - www.instaforex.com |
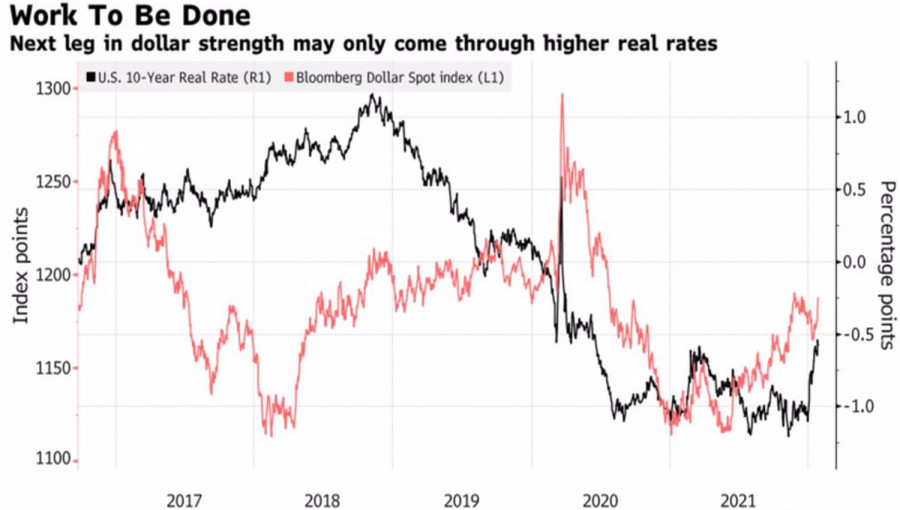
| EURUSD to mark worst weekly dynamics in last seven months Posted: 28 Jan 2022 06:32 AM PST Before January ended, divergence in monetary policy is back in vogue. The start of 2022 cast doubt on its effectiveness. The U.S. dollar started vaguely, reacting little to the rally in yields of Treasury bonds, and to the fall of U.S. stock indices, and the increase in the number of proposed acts of monetary restriction by the Fed in 2022 from three to four, and to rumors that the first of them will take place in March. Investors were worried that Fed Chairman Jerome Powell would not rush. They made a mistake, and the "bears" on EURUSD immediately rushed to the attack. The fight against high inflation is now a priority. Not only at the White House, but also at the Fed. Much is at stake, and the Fed is ready to turn a blind eye to both the potential slowdown in the U.S. economy and the fall in stock indices. For Donald Trump, the S&P 500 was an indicator of the president's popularity; for Joe Biden, it is more important that the cost of living for an ordinary American does not grow as quickly as it is now. What is needed for this? Bring down inflationary expectations so that their further promotion does not become a self-fulfilling forecast. That is, it did not lead to a further increase in consumer prices. And the Fed is ready to raise the federal funds rate in almost every meeting. Rising nominal yields of Treasury bonds and slowing inflationary expectations lead to an increase in real U.S. debt market rates, which is extremely bad for gold and good for the U.S. dollar. The latter, thanks to Powell, is ready to mark the best weekly gain against the euro in 7 months. Dynamics of the dollar and the real yield of U.S. bonds
After the January FOMC meeting, the futures market is waiting for not 4, but 5 acts of monetary restriction from the Fed. Yes, derivatives still believe that the ECB will begin to tighten monetary policy in the autumn, but once European inflation begins to draw the very hump that Christine Lagarde and her colleagues are talking about, the forecasts will immediately shift to 2023. And this is a completely different story. The history of a serious weakening of the euro this year. The first call may be the release of data on the German CPI. According to forecasts by Bloomberg experts, the indicator will slow down from 5.2% to 4.2% in January. If so, then the meeting of the Governing Council on February 3 will be nominal. The "hawks" will fall silent, and the "bulls" on EURUSD are unlikely to wait for support. A day later, the release of U.S. employment data for December will see the light of day. In the current environment, it is of particular importance. According to Powell, there is a lot of room for a rate increase that will not worsen the state of the labor market. The Fed chairman understands that an aggressive tightening of monetary policy is fraught with an increase in unemployment in the U.S. The main thing is not to go too far. Technically, as was expected, the implementation of the false breakout pattern took the EURUSD quotes below the lower limit of the medium-term consolidation range 1.122-1.138. Formed from the levels of 1.1435 and 1.132, in accordance with the previous recommendations, we hold short positions and build up on rollbacks. The initial target is 1.1. EURUSD, Daily chart
|
| Technical analysis of GBP/USD for January 28, 2022 Posted: 28 Jan 2022 06:15 AM PST
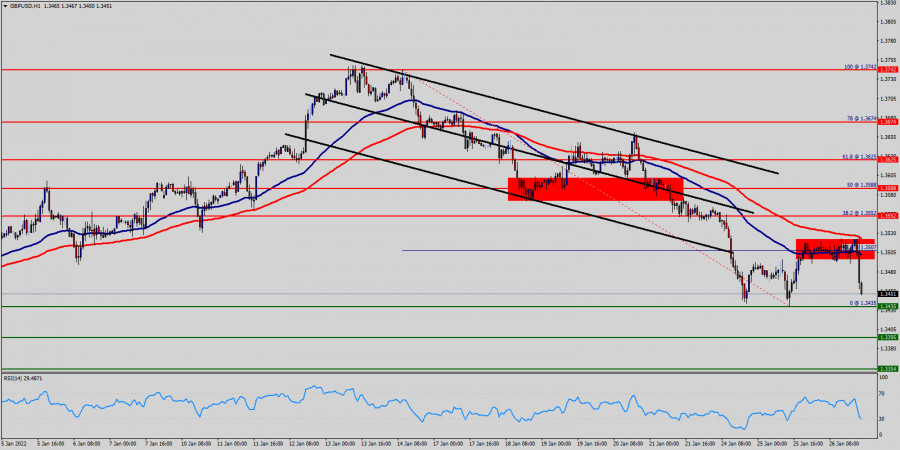
The GBP/USD pair has faced strong resistances at the levels of 1.3460 because support had become resistance. So, the strong resistance has been already formed at the level of 1.3460 and the pair is likely to try to approach it in order to test it again. However, if the pair fails to pass through the level of 1.3460, the market will indicate a bearish opportunity below the new strong resistance level of 1.3460 (the level of 1.3460 coincides with a ratio of 50% Fibonacci). Moreover, the RSI starts signaling a downward trend, as the trend is still showing strength below the moving average (100) and (50). Thus, the market is indicating a bearish opportunity below 1.3460 for that it will be good to sell at 1.3460 with the first target of 1.3353. It will also call for a downtrend in order to continue towards 1.3309. The daily strong support is seen at 1.3309. However, the stop loss should always be taken into account, for that it will be reasonable to set your stop loss at the level of 1.3528. The material has been provided by InstaForex Company - www.instaforex.com |
| Video market update for January 28,,2022 Posted: 28 Jan 2022 05:47 AM PST Watch for the downside continuation on the Gold... The material has been provided by InstaForex Company - www.instaforex.com |
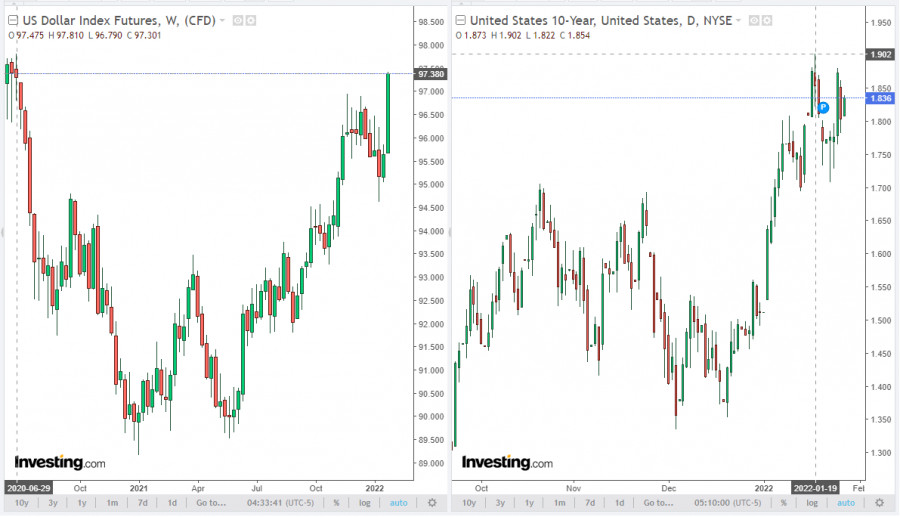
| Oil-dollar: current dynamics and market expectations Posted: 28 Jan 2022 05:44 AM PST The dollar continues to strengthen after the Fed meeting ended on Wednesday. Fed leaders have confirmed their intentions to start raising rates in March. Fed Chairman Jerome Powell also said that "there's room to raise interest rates without threatening the labor market," because "labor market conditions are already largely consistent with maximum employment." Regarding the accelerated inflation in the US, Powell said that "the Fed's policy will have to react in case of further deterioration of the situation." At the time of writing, the DXY dollar index has grown since the beginning of this week by 1.8%, adding to the current mark of 97.38, 171 points and returning to June 2020 levels. Even if, closer to the middle of the American trading session, profit-taking begins in long dollar positions, it is obvious that this week, the second in a row, the DXY dollar index will end in positive territory, with a noticeable increase.
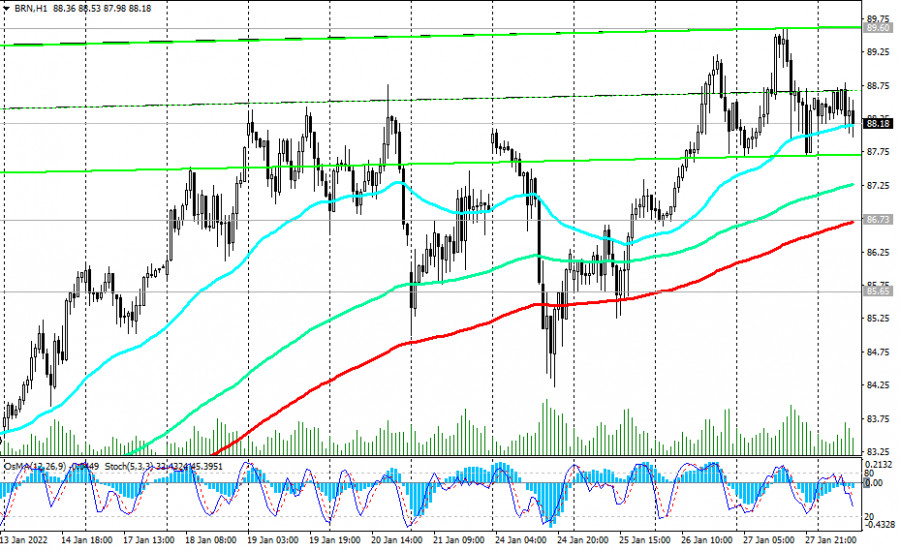
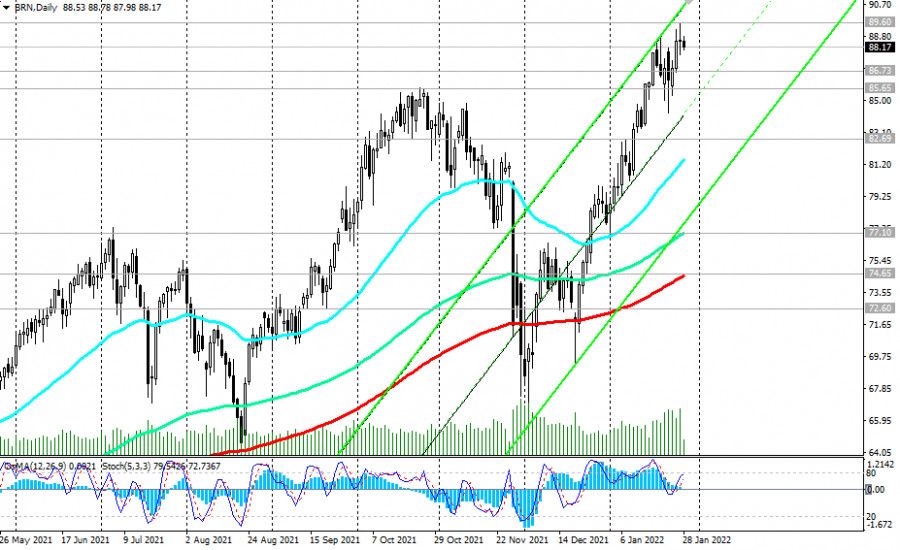
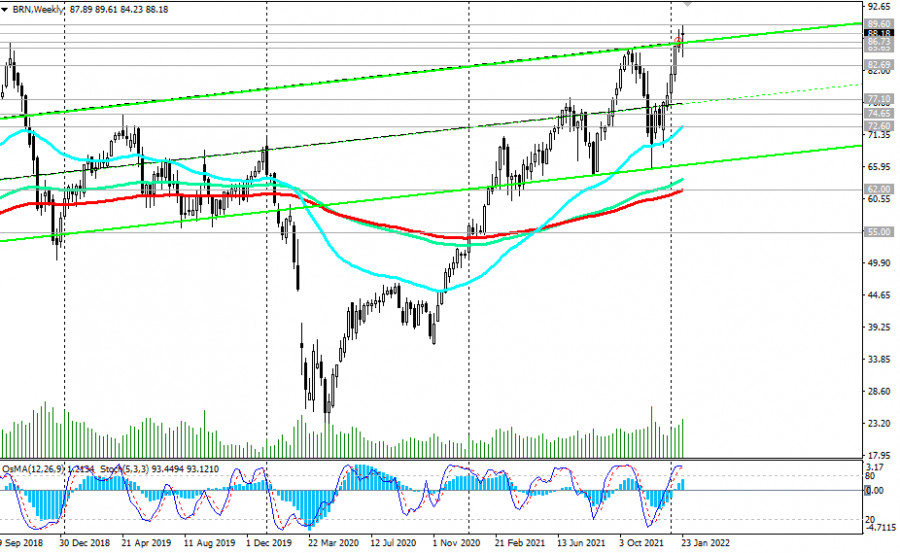
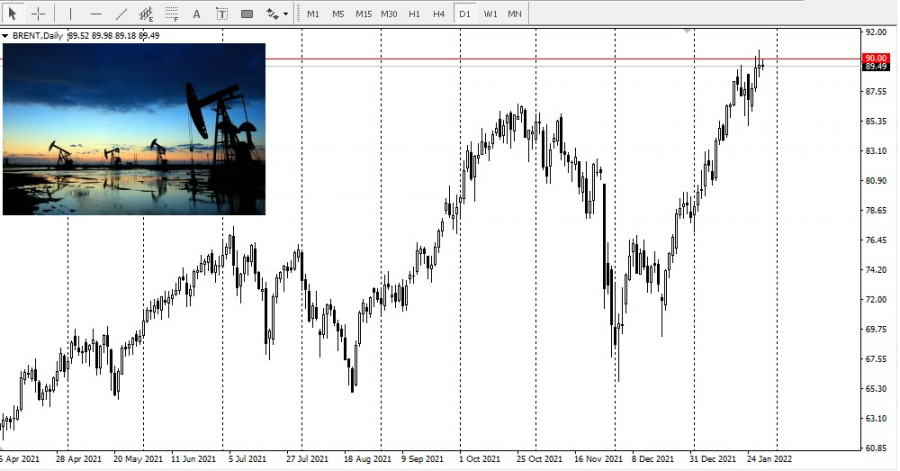
The trigger for profit-taking may be the publication of the indices of personal consumption expenditure at 10:30 UTC. In November, household spending increased by 0.5% after the same growth in October, and personal income increased by 0.4% compared to October. The core index of personal consumption expenditures (Core PCE) increased by 4.7% (in annual terms) in November, which is the highest since 1991. This index is the Fed's preferred indicator of inflation and excludes volatile food and energy prices. Consumer spending in the U.S., as well as the incomes of citizens, are growing, which contributes to the overall economic recovery, while companies are increasing investments. With accelerating inflation, which has reached a 30-year high, other macro data indicate the continuing momentum of the recovery of the American economy, while demand for labor is growing and the unemployment rate is falling. It is expected that the core index of personal consumption expenditures (Core PCE) increased again in December, by +4.8% (in annual terms). This is a positive factor for the dollar. However, if other articles of the report of the Commerce Department's Bureau of Economic Analysis are not as strong and disappoint market participants, then this may become, as we noted above, a trigger for profit-taking in long positions on the dollar, which may cause its quotes to fall. Nevertheless, it is probably not worth waiting for a deeper weakening of the dollar. In the current situation, a more correct trading strategy would be to bet on the strengthening of the dollar than on its weakening. The yield on U.S. government bonds remains high and is in the zone of 2-year highs. Last week, the yield on 10-year U.S. bonds exceeded 1.900%, and today it is 1.836%. The volume of sales of government bonds remains high, while the reduction in the volume of their purchases by the Fed is accelerating, causing an increase in their yield and, accordingly, demand for the dollar. At the same time, market participants are betting that the Fed may reach a 2% rate level this year, which will further increase the divergence in interest rate curves in the U.S. and other economically developed countries. Today, participants of the oil market have their attention to the publication of the report of the oil service company Baker Hughes on active oil platforms in the U.S. Previous data from Baker Hughes reflected an increase in the number of active drilling rigs to 491 units against previous reporting periods. It is obvious that the number of oil-producing companies in the United States is growing again, which is a negative factor for oil prices. Their next growth will also have a negative impact on oil quotes, however, it will only be of a short-term nature. At the time of writing, Brent crude is trading near $88.20 per barrel. Yesterday, its quotes came close to $90 per barrel for the first time since 2014, after the release of the report from the Energy Information Administration (EIA) of the U.S. Department of Energy on Wednesday. According to the Department of Energy, although commercial oil reserves increased by 2.377 million barrels in the reporting week (analysts expected them to decline by -0.728 million barrels), the total volume of oil and petroleum products reserves in the United States, including strategic reserves, fell to 1.78 billion barrels, the lowest since 2014. In general, oil market analysts believe that energy prices will remain positive, staying above current levels, and oil prices may rise for the sixth week in a row. OPEC oil production remains below quotas as tensions between Russia, a major gas and oil producer, and Ukraine, through which large volumes of natural gas are shipped, fuel energy prices. In the event of interruptions in their supply, oil prices can accelerate their growth, even if the dollar strengthens further. Technical analysis and trading recommendations As noted above, oil prices have risen significantly over the past few weeks, remaining in the bull market and trading above long-term support levels. At the time of writing, Brent oil futures are trading near the 88.20 mark, remaining in the zone of multi-year highs.
A breakdown of this local resistance level of 89.60 will lead to further price growth, despite the fact that oil market analysts predict that the positive dynamics of the oil market will continue against the backdrop of increased demand for energy and limited oil supplies by OPEC+ countries.
In an alternative scenario and in case of breakdown of the local support level 85.65, the price may fall first to the important support level 82.69 (200 EMA on the 4-hour chart), and then to long-term support levels 77.10 (144 EMA on the daily chart), 74.65 (200 EMA on the daily chart) ). A breakdown of the key long-term support level 62.00 (200 EMA on the weekly chart) will increase the negative dynamics and the likelihood of a return to the long-term downward trend. The first signal for the implementation of this scenario will be a breakdown of the important short-term support level 86.73 (200 EMA on the 1-hour chart).
Support levels: 86.73, 85.65, 82.69, 77.10, 74.65, 72.60, 62.00 Resistance levels: 89.60, 90.00 Trading recommendations Brent: Sell Stop 87.55 Stop-Loss 89.65. Take-Profit 87.00, 86.73, 85.65, 82.69, 77.10, 74.65, 72.60, 62.00 Buy Stop 89.65. Stop-Loss 87.55. Take-Profit 90.00, 91.00, 92.00, 93.00, 95.00, 99.00 The material has been provided by InstaForex Company - www.instaforex.com |
| Analysis of Gold for January 28,.2022 - Strong downside momentum Posted: 28 Jan 2022 05:38 AM PST Technical analysis:
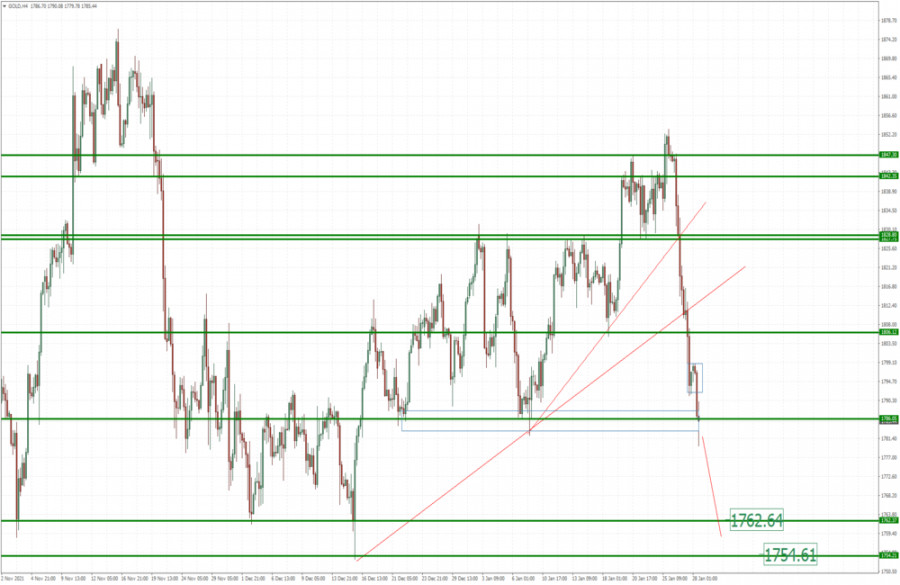
Gold has been trading downside as I expected. I see potential for further drop due to strong imbalanced regime and strong downside momentum. Trading recommendation: Due to strong downside momentum and imbalanced market regime today, I see further downside continuation. My advice is to watch for selling opportunities on the rallies with the downside objectives at $1,762 and $1,754 Additionally, there is the breakout of the key pivot trend line in the background. Key support resistance level is set at $1,792 The material has been provided by InstaForex Company - www.instaforex.com |
| Asia-Pacific indicators show gains Posted: 28 Jan 2022 04:56 AM PST
Asia-Pacific indicators are mostly on the upswing after a significant decline the day before. China's Shanghai Composite and Shenzhen Composite added 0.05% and 0.85% respectively, while Hong Kong's Hang Seng Index was down by 1.11%. Other Asian indicators showed stronger gains. The Korea Stock Exchange Composite KOSPI gained 1.88%, the Nikkei 225 rose by 1.87%, and the S&P/ASX 200 added 2.18%. Markets are trying to recoup yesterday's session's losses, when indicators showed sharp decline. Nevertheless, according to experts, market sentiment may remain rather cautious due to the outcome of the US Federal Reserve's meeting, which indicates a high probability of an interest rate hike soon. Investors are also awaiting the release of statistical data from the US. According to experts' forecasts, personal income increased by 0.5% in the last month of 2021 compared to the previous month, while expenses, on the contrary, decreased by 0.6%. Fuji Electric Co., Ltd., Shin-Etsu Chemical Co., Ltd. and Fujikura, Ltd. saw the biggest gains among the constituents of the Nikkei 225, with shares rising 10.6%, 7.3% and 6.99% respectively. Shares of SoftBank Group Corp. added 3.2%. Sony Group Corp. rose by 3.7%, while Advantest Corp. surged by 4,1%. The Hong Kong indicator's drop was driven by a decline in the value of its constituent companies' shares. Thus, share prices of BYD Co., Ltd. fell by 7.28%, Hong Kong Exchanges & Clearing, Ltd. lost 4% and Xinyi Solar Holdings, Ltd. was down by 3.85%. At the same time, Alibaba Group Holding, Ltd. gained 1.5%, while Meituan's shares dropped by 0.2%. Among the KOSPI components, Samsung Electronics Co. posted the biggest gains, adding 2.8%, as well as Kia Corp., Hyundai Motor Co. and LG Corp. which were up by 2.8%, 1.6% and 3.1%, respectively. Australian companies' shares also surged. Woodside Petroleum, Ltd. added 0.4%, Santos, Ltd. gained 1.1%, and Beach Energy, Ltd. rose by 0,4%. The material has been provided by InstaForex Company - www.instaforex.com |
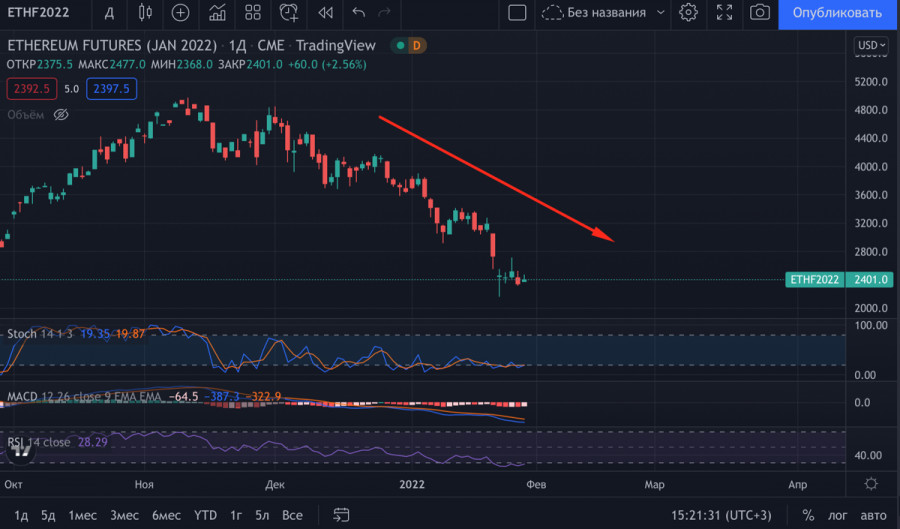
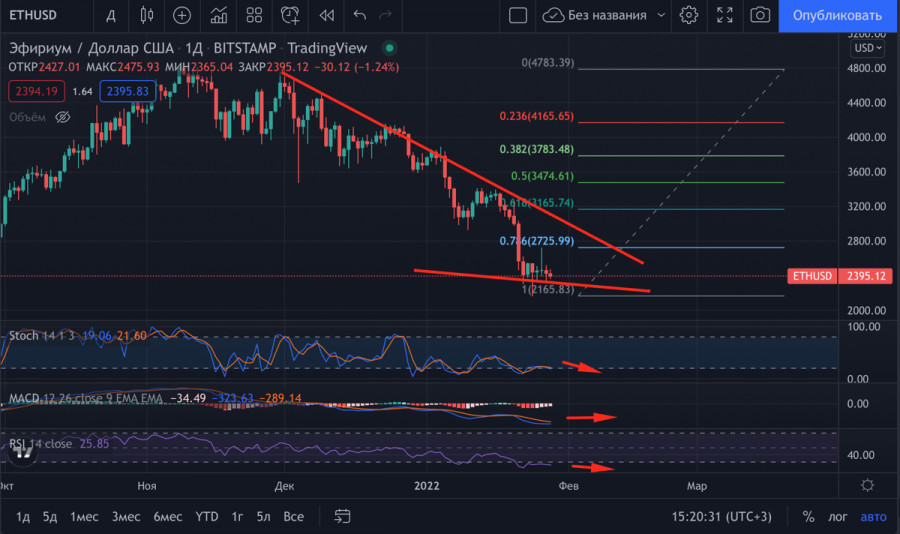
| Ethereum loses its bullish momentum amid decline of interest in futures: what's next? Posted: 28 Jan 2022 04:48 AM PST Ethereum has been dropping for the past two months due to both fundamental and intra network reasons. A massive correction in the stock and cryptocurrency market has triggered a decline in ETH to $2,100. Moreover, the digital asset is facing problems in the DeFi and NFT sectors. According to a JPMorgan study, a significant increase in fees is forcing users to look for more profitable blockchains. Despite failures, the asset tried to correct the situation. However, a bullish breakout ended in an unsuccessful retest attempt of $2,800. Moreover, sellers exerted pressure on bulls. Therefore, as of January 28, the altcoin is trading around $2,400. The cryptocurrency has declined by 16% on falling trading volumes over the last 7 days. The situation on the futures market has also had an impact on the price as open interest in ETH fell by 50% to $6.8 billion. The decline is dramatic even amid general outflow of funds from the cryptocurrency industry. All these factors indicate the complete dominance of bears in the major altcoin market. Retailers, selling crypto at a loss, exert the main pressure on the price. Long-term holders continue to accumulate altcoin. Santiment experts report that whales have bought more than 200,000 ETH in the past week, indicating the asset's prominent future. Ethereum is in the initial stage of consolidation as it failed to break the level of $2,800. Sellers' positions are more stable. Therefore, the price could not break this level immediately.
The main target of Ethereum for February will be the end of the consolidation period and further bullish breakdown of the level of $2,800. The Fibo level of 0.768, as well as a large number of sell orders is at this point. In the near future, the asset will make another attempt to break this level. The bulls are accumulating volumes and competing with sellers, as evidenced by the tentative candlesticks of the last 5 days. The cryptocurrency is settled at the strong support area around $2,300. However, the probability of its breakout increases with every failed retest of $2,800. I assume that the next two weeks the asset will make systematic and sharp movements in the range of $2,100-$2,800. At the same time, it will collect liquidity for a successful exit upwards. There are no volumes for the exit beyond this area at the moment. Technical indicators do not show any clear signals and keep sideways movement direction. It signals an accumulation and stabilization of the price in the current range. Despite the general uncertainty, the stochastic oscillator shows a bearish signal and forms a downward crossover. The RSI index has left the bullish zone and is declining towards the level of 30. These signals are characteristic of a flat price movement and indicate a constant shift in dominance from bulls to bears and back again.
Overall, the situation with Ethereum is similar to that of bitcoin. Investors are focused on stock markets.However, the results of the Fed meeting are already known, and therefore the redistribution of assets will soon begin again. Therefore, the range of $2,100-$2,800 will be common for Ethereum in the near future, and the main impulses to growth should be discovered in the stock market and bitcoin quotations. At the end of January, ETH has no chance to make an upward movement contrary to the general sentiment on the market.
|
| EU economy could be hit by sanctions against Russia Posted: 28 Jan 2022 03:32 AM PST
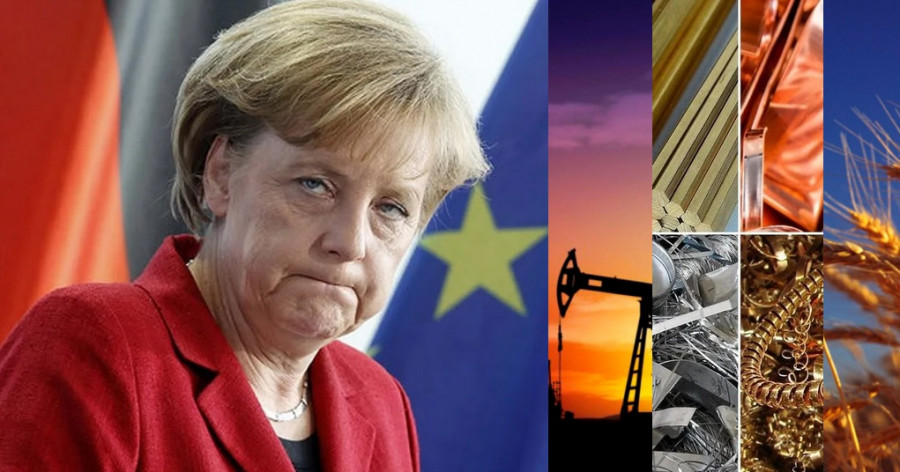
Escalating tensions between Russia and Ukraine could throw the commodity market into disarray, with the EU being hit the most, a report by ING said. Commodity prices would go up, and the market would be rattled if the US enacts tough sanctions against Russia. There is still uncertainty over how the situation will evolve. Sanctions would likely lead to a significant tightening in energy, metal, and agricultural markets, pushing up commodity prices. Natural gas would likely receive the most attention - any sanctions related to the energy sector would severely affect the EU during winter, as Russia remains its dominant supplier. At this moment, Europe's gas balance is extremely tight, making the region extremely vulnerable to supply disruptions. Currently, Russia constitutes 46% of EU's natural gas imports. Several gas pipelines are located in Ukrainian territory. The US has already made it clear that the Nord Stream 2 pipeline would be targeted in the event of sanctions. "It would be difficult for Europe to stomach sanctions which effectively cut off Russian gas supply, or at least a large portion of these flows, given the region's dependency on Russian gas and the ongoing energy crisis," the report said. Sanctions on Russia would also increase pressure on the crude oil market, which is already in a bull trend. The price of Brent crude oil has approached $90 per barrel. The aluminum market could also be impacted. US sanctions against Rusal in 2018 rattled the markets. Russia's aluminum production is second only to China. Currently, the market is in deficit and any disruptions to these flows would only push the market further into deficit, the report says. Sanctions on Russia could also send prices of nickel, copper, palladium and platinum up. Agriculture is another notable sector which is likely to be hit. Russia is the world's biggest exporter of wheat, with annual production around 85 million tons and yearly exports of 40 million tons. The country holds 20% of the world's wheat trade. Agriculture and food production were not named in the proposed sanction package. However, sanctions against financial institutions, potentially including a disconnection of Russia from SWIFT, would jeopardize trade. The material has been provided by InstaForex Company - www.instaforex.com |
| You are subscribed to email updates from Forex analysis review. To stop receiving these emails, you may unsubscribe now. | Email delivery powered by Google |
| Google, 1600 Amphitheatre Parkway, Mountain View, CA 94043, United States | |

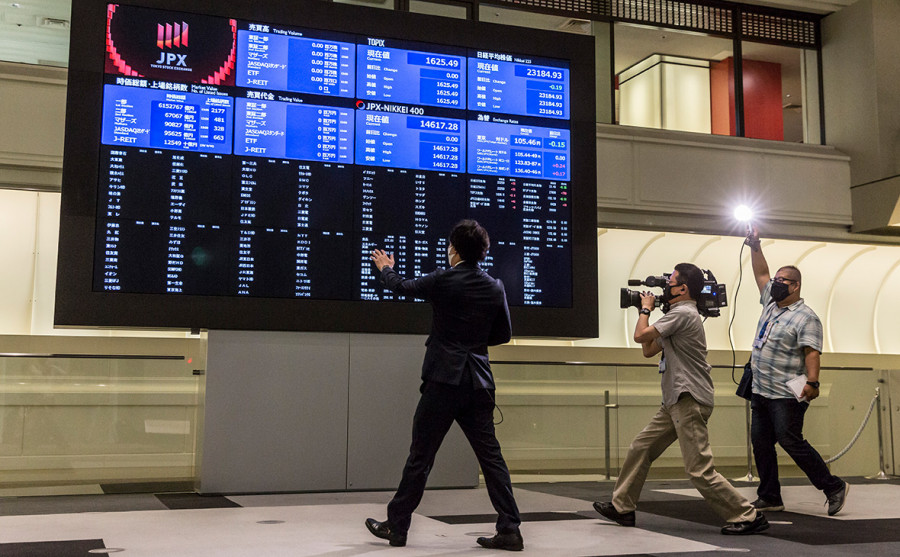
 Russia is the world's second largest producer of crude oil with production averaging around 10.5 million barrels per day in 2021. Most of the oil is refined at domestic refineries, but a significant amount of it is still exported, making Russia the second largest oil exporter after Saudi Arabia. Any actions affecting Russian crude oil exports would likely lead to a deficit in the market.
Comments