Forex analysis review
Forex analysis review |
- Forecast for EUR/USD on January 12, 2022
- Trading signals for GBP/USD on January 12 - 13, 2022: sell in case of pullback at 1.3671 (8/8)
- Forecast for AUD/USD on January 12, 2022
- Forecast for USD/JPY on January 12, 2022
- The Fed's super-aggressive policy is postponed
- Overview of the GBP/USD pair. January 12. The British economy will face new problems due to the "safe omicron".
- Overview of the EUR/USD pair. January 12. Jerome Powell promises to fight inflation.
- Forecast and trading signals for EUR/USD for January 12. Detailed analysis of the pair's movement and trade deals. The euro
- How to trade GBP/USD on January 12? Simple tips for beginners. The pound continues to creep up, no matter what
- USD/JPY. Optimal medium-term strategy - longs on downward pullbacks
- Paralyzed dollar gives euro false hopes
- EUR/USD. While the euro is wondering: heads or tails, the dollar begins to think about how justified the Fed's rush will
- Ethereum sell-off stopped by 3,000 psychological level
- GBP/USD heading towards fresh new highs
- Technical analysis of AUD/USD for January 11, 2022
- Technical analysis of GBP/USD for January 11, 2022
- How to trade EUR/USD on January 12. Simple trading tips and analysis for beginners. EUR attempts to break above sideways
- EUR/USD looks to trade higher ahead of US Inflation Data
- Gold challenges 1,815 upside obstacle
- Analysis of GBP/USD on January 11. Boris Johnson is walking on the edge of a precipice.
- EUR/USD analysis on January 11, 2022. Jerome Powell's speech fails to surprise markets
- January 11, 2021 : EUR/USD daily technical review and trading opportunities.
- Trading signals for BITCOIN (BTC/USD) on January 11 - 16, 2022: buy above $40,000 (strong support - uptrend line)
- January 11, 2021 : EUR/USD Intraday technical analysis and trading plan.
- January 11, 2021 : GBP/USD Intraday technical analysis and significant key-levels.
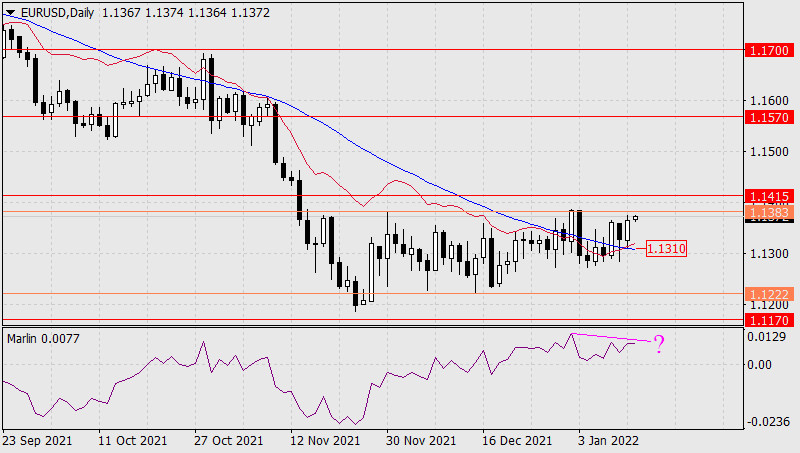
| Forecast for EUR/USD on January 12, 2022 Posted: 11 Jan 2022 08:29 PM PST On Tuesday, the following happened: from the opening of the day, the euro's price increased by 30 points, then it fell to the MACD line of the daily scale (-40 p) and, rebounding from it, closed the day with an increase of 43 points. The rebound from the MACD line indicates the desire to reach a target level, it can be either the nearest 1.1383 or just above 1.1415. The Marlin Oscillator is close to divergence with the price, and this moment indicates a probable overcoming of the signal level of 1.1383, and also a price reversal without reaching the target 1.1415.
But if the price can settle above 1.1415, then the divergence with the oscillator will not take place and the euro will continue to strengthen in the medium term (target 1.1570).
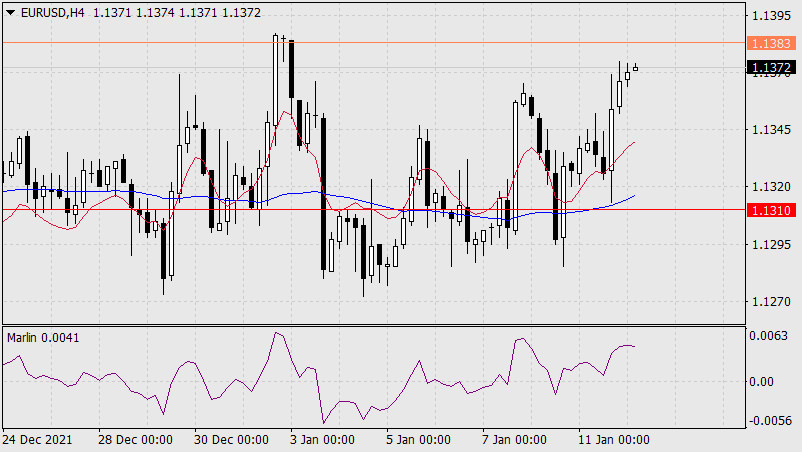
The price is rising across all indicators on the four-hour chart, but Marlin is growing at a slower pace. Probably, a technical basis is being prepared for a downward price reversal. This is the main scenario. The material has been provided by InstaForex Company - www.instaforex.com |
| Trading signals for GBP/USD on January 12 - 13, 2022: sell in case of pullback at 1.3671 (8/8) Posted: 11 Jan 2022 08:25 PM PST
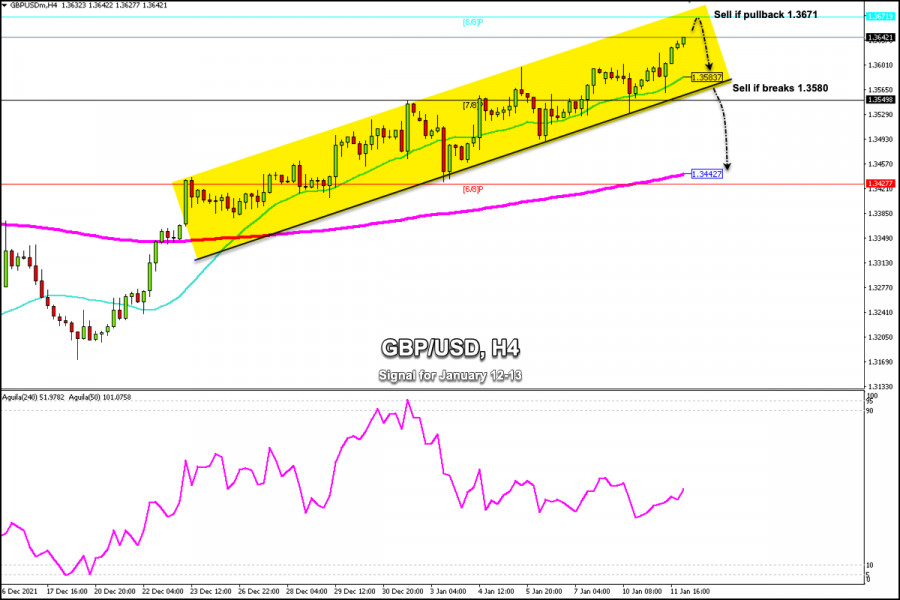
GBP / USD is climbing above the 1.36 level and is approaching the zone of resistance 8/8 Murray at 1.3671. At this time of writing, it is trading at 1.3642. The British pound remains in positive territory against the dollar, moving above the bullish channel. Since December 20, the British pound has been trading above a trend channel. Now it is showing signs of exhaustion and an overbought signal according to the daily chart. The resistance zone of 8/8 Murray located at 1.36 71 could be a strong top for the British pound and could provide a sell signal in the next few hours. The dollar index fell to its lowest level since November after Fed Chairman Jerome Powell said it may take several months to make a decision on reducing the balance of $ 9 trillion. These comments allowed the British pound to strengthen. Thus, all currency pairs against the dollar had a bullish performance and gold also rebounded to the levels of $1,820 again. In the American session, the US inflation data will be published, analysts expect it to remain around 0.4%. If the current data is above this level, it could favor the dollar and GBP / USD could make a correction towards the support of the SMA of 21 at 1.3583. Our trading plan for the next few hours is to expect a pullback to 8/8 Murray around 1.3671. If the pair fails to break this level, it will be a good opportunity to sell with targets towards the SMA of 21 at 1.3580. A break and a close below 1.3580 on the 4-hour chart could continue the bearish move and we would expect a decline towards the EMA 200 located at 1.3442. Support and Resistance Levels for January 12 - 13, 2022 Resistance (3) 1.3705 Resistance (2) 1.3687 Resistance (1) 1.3660 ---------------------------- Support (1) 1.3608 Support (2) 1.3581 Support (3) 1.3528 *********************************************************** Scenario Timeframe H4 Recommendation: Sell if pullback Entry Point 1.3671 Take Profit 1.3583 (21 SMA), 1.3549 (7/8), 1.3442 (200 EMA) Stop Loss 1.3710 Murray Levels 1.3671 (8/8) 1.3549 (7/8) 1.3427 (6/8) *********************************************************** Alternative scenario Recommendation: sell if breaks Entry Point 1.3580 Take Profit 1.3500, 1.3442 (200 EMA) Stop Loss 1.3625 Murray Levels 1.3427 (6/8) ********************************************************* The material has been provided by InstaForex Company - www.instaforex.com |
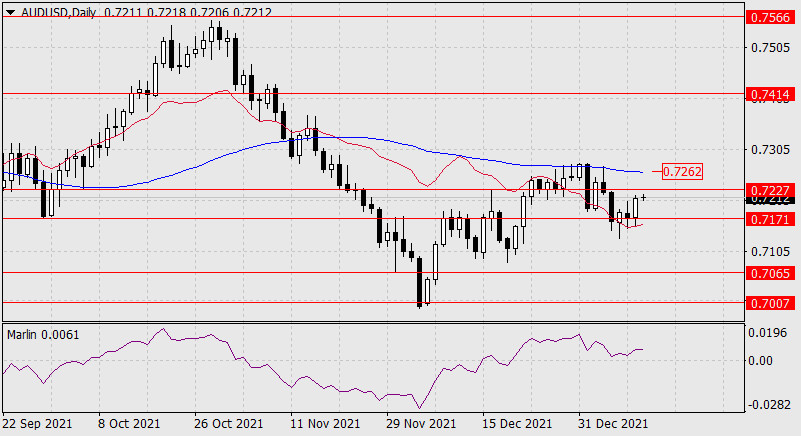
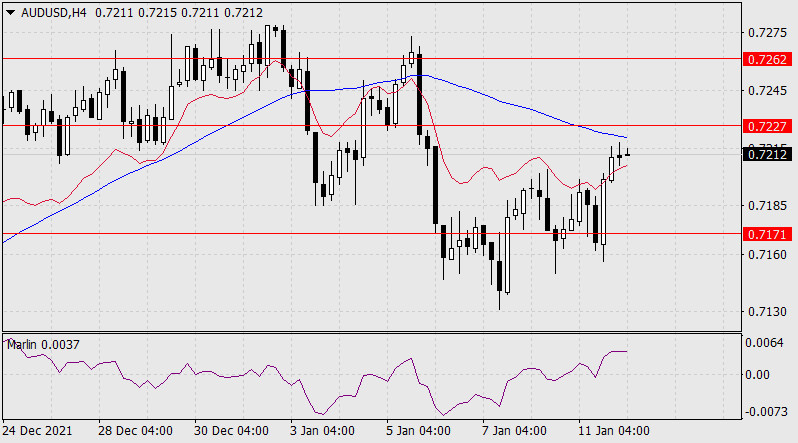
| Forecast for AUD/USD on January 12, 2022 Posted: 11 Jan 2022 08:24 PM PST Yesterday, the Australian dollar received support from the balance indicator line and crossed almost the entire range of target levels 0.7171 and 0.7227. Now the price has a more difficult task - to cross 0.7227 in order to then try to rise above the daily MACD indicator line in the area of 0.7262. If the price copes with this task, then later you can see the aussie rise to the target level of 0.7414 (the August 2020 high). If a reversal occurs from one of the indicated resistances, then a decline to 0.7065 (June 2020 high) may follow.
The price is approaching the MACD indicator line on the H4 chart, which is currently just below the target level of 0.7227. The resistance is strong, so we expect either a reversal from this area, or a decisive attack at 0.7262. Taking into account the reluctance of the Marlin Oscillator to develop growth on a daily scale, the probability of a reversal can be determined at 55%.
|
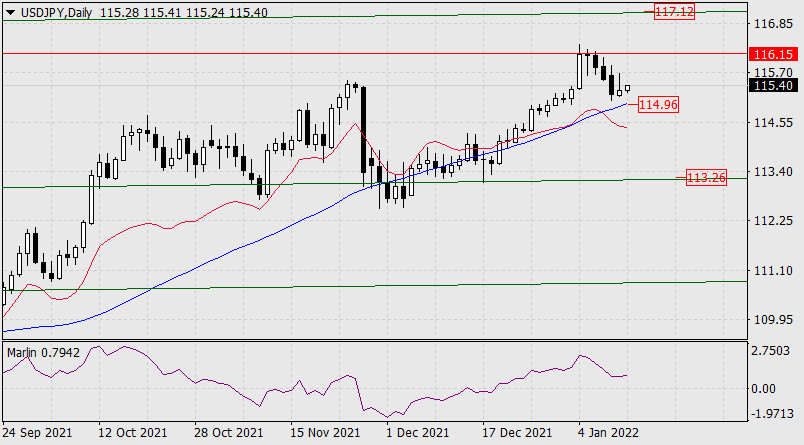
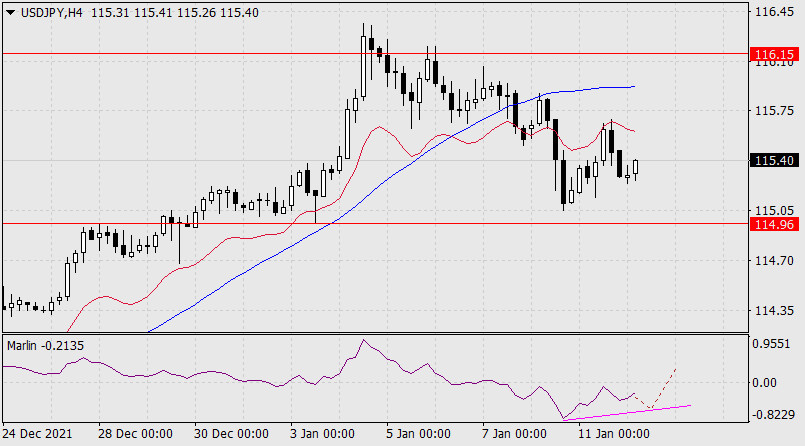
| Forecast for USD/JPY on January 12, 2022 Posted: 11 Jan 2022 08:17 PM PST The yen does not dare to attack the MACD line of the day scale (114.96). The Marlin Oscillator on the daily chart is tilted downward, which indicates a possible easy and accurate hit of this support and the subsequent price reversal from it. The growth target is 116.15. Consolidating above the level opens the 117.12 target - the resistance of the price channel line of the monthly timeframe. An alternative scenario looks like this: the price settles below the MACD line and then moves down to the support of the 113.26 price channel.
A hypothetical convergence of the price with the oscillator is formed on the four-hour chart, which supports the option of a price reversal upward from the level of 114.96.
|
| The Fed's super-aggressive policy is postponed Posted: 11 Jan 2022 07:35 PM PST Bitcoin and ether slightly regained their positions after Federal Reserve Chairman Jerome Powell made several statements, from which it became clear that "nothing is clear yet." The Fed's super-aggressive policy is postponed. The threat of four interest rate hikes in the US this year only remains a threat, as Jerome Powell, although he confirmed the information that the Fed will start raising rates and reducing the balance sheet this year, however, the central bank has not yet decided how aggressive this policy will be. It takes from two to six months to get the full picture. Today's US inflation data may have some impact on the cryptocurrency market, but it is unlikely that they will seriously diverge from economists' forecasts, so one fundamental problem for traders, even if only for a while, will become less.
Citadel Securities LLC From the good news, we can also note the fact that another major player has entered the market. There have been rumors that Citadel Securities LLC will seriously engage in financing several Silicon Valley companies that are developing in the crypto industry. This suggests that billionaire Ken Griffin's firm is finally mastering cryptocurrencies, which will add strength and stability to the market in the future. According to one of the Chicago market makers, Citadel Securities LLC announced investments of $ 1.15 billion from Sequoia Capital and Paradigm - two venture capital companies through which Citadel Securities can enter the cryptocurrency market. In November, San Francisco-based Paradigm announced it was launching a $ 2.5 billion fund dedicated to crypto companies and protocols. Its co-founder Matt Huang was previously a partner at Sequoia Capital. Paradigm said in a statement that the company looks forward to working with the Citadel Securities team as they plan to expand into new markets, including cryptocurrency. Sequoia Capital is also jumping into the crypto sphere, funding a variety of startups focused on its ecosystem and underlying technologies. More recently, Griffin has made several skeptical statements about the cryptocurrency asset class but said that his firm will trade cryptocurrencies if they are properly regulated, and praised the chairman of the Securities and Exchange Commission Gary Gensler for paying closer attention to this area. At the end of last year, Griffin also gave a positive assessment of the DAO and noted that Ethereum will replace bitcoin in the near future. El Salvador continues to increase Bitcoin mining capacity
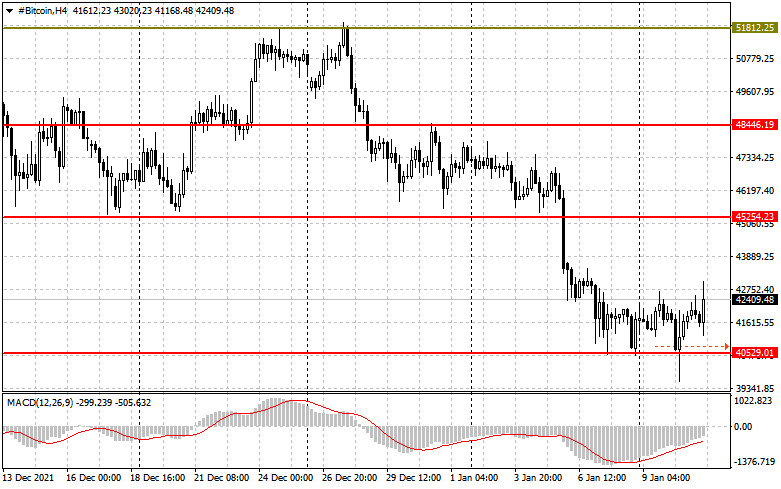
Yesterday, Salvadoran President Nayib Bukele confirmed that the country is investing in the development of a source of geothermal energy for the construction and operation of the future Bitcoin City. The financing of this project will be carried out at the expense of income from the so-called "volcanic bonds". Bukele explained that the energy coming from volcanoes, which is managed and maintained by the state company Lageo, annually produces more than 1,000 gigawatts for the country. "We have a 90% chance of finding a well with a capacity of at least 42 MW. This will be enough to provide energy to the entire Bitcoin City," the President of El Salvador noted. As for the technical picture of bitcoin
The bulls have managed to defend the new support of $ 40,520 and are likely to target the resistances of $ 43,200 and $ 45,524. If the pressure on the trading instrument returns in the near future and we see a breakdown of $ 40,520, in this case, it is better not to wait for anything good in the near future. I advise you to be patient, waiting for the update of the lows: $ 37,380 and $ 33,830. It will be possible to talk about a change in the market direction of the first cryptocurrency only after going beyond $ 43,200, which will open a direct road to $ 45,250, $ 48,400, and $ 51,800. As for the technical picture of the ether
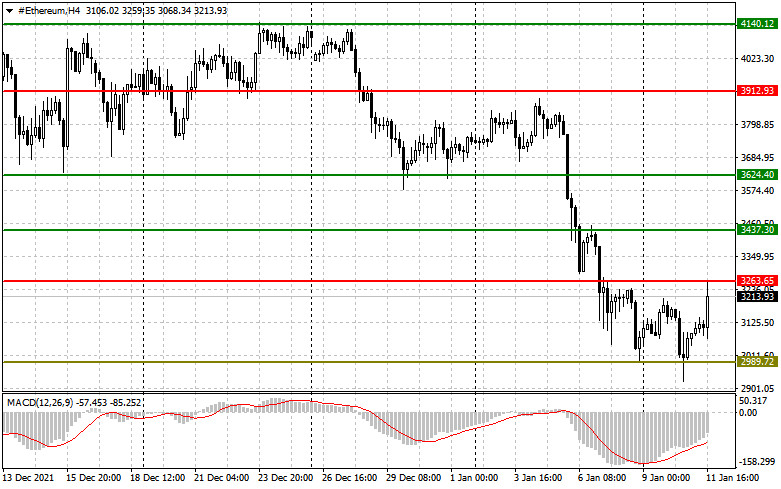
The ether has very big difficulties since the bears have fixed below the 200-day moving average, which is quite a serious problem. Trading below this level will continue to push the trading instrument lower, and a breakdown of the psychological mark of $ 3,000 will lead to a larger sale in the area of lows: $ 2,700 and $ 2,440. To return demand, a breakdown of $ 3,260 is needed, which will open a direct road to $ 3,430, where the 200-day average passes. A break in this range will resume the bullish trend, which will lead to highs of $ 3,600 and $ 3,900. The material has been provided by InstaForex Company - www.instaforex.com |
| Posted: 11 Jan 2022 07:35 PM PST
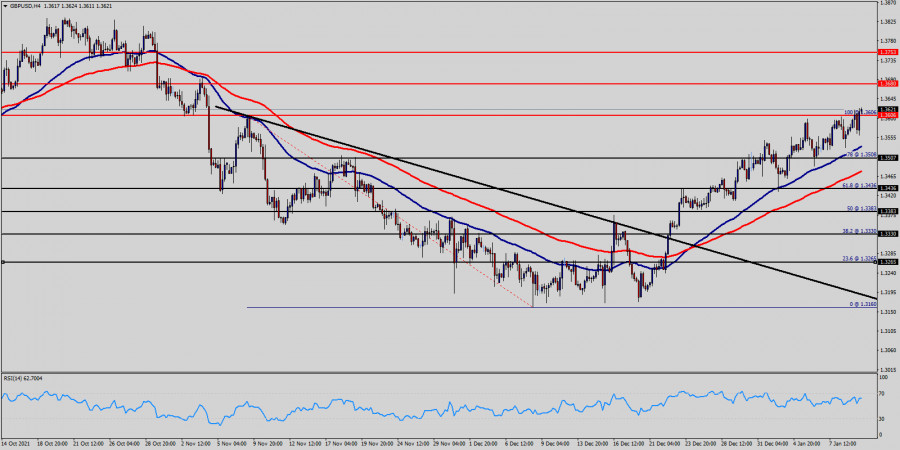
The GBP/USD currency pair on Tuesday again updated its local highs and, thus, maintains an upward trend. But at the same time, it can be seen with the naked eye that the upward movement is slowing down, which indicates the retreat of bulls from the market. However, at the same time, the pair cannot gain a foothold below the moving average line, which does not give reason to conclude that the local upward trend has ended. Thus, the pound sterling continues to rise in price almost unreasonably from a fundamental point of view. We have already said earlier that formally there are reasons. After all, at the end of 2021, the Bank of England raised the key rate. However, since then, the pound has been growing for more than three weeks, so we can say that this factor has been fully worked out by the market. It's time to adjust at least a little, but the bulls are not getting rid of the pound, so the correction does not begin. We draw attention to the fact that the two main currency pairs have been moving quite differently in the last 6-8 weeks. If the euro currency is in one place, then the pound sterling first tried to overcome the level of 1.3175, and then abruptly began an upward trend, which continues to this day. Thus, we continue to expect a downward correction and consolidation below the moving average. Losses from Omicron could amount to $ 50 billion. In the UK, meanwhile, the omicron strain continues to rage. Recall that the authorities refused at the end of last year to introduce a "lockdown", which could at least slightly reduce the incidence rate. Therefore, now the country has 150-200 thousand new cases every day. The military has already been sent to help the doctors, as many hospitals simply do not have enough medical personnel. In addition, many Britons who became infected with omicron were forced to go into self-isolation, that is, on sick leave. Given the number of patients currently in the UK, it is not difficult to conclude that many companies and enterprises are experiencing a shortage of staff these days. The Center for Economic and Business Research of Great Britain estimated that two months of 2022 could cost the country $ 50 billion. According to experts, this amount is commensurate with 20% of the losses from Brexit. The center estimated that at some point in time up to 25% of the UK population may be isolated at the same time, although the mortality rate will remain low, as well as the percentage of complications of the disease. However, because a huge number of people are infected with omicron, hospitals may face problems not only due to staff shortages but also due to a large influx of patients, because with a lower percentage of cases with complications, the number of patients is several times higher than before. With the most pessimistic forecast, the UK economy could lose up to 25% of the consequences of Brexit in the early years. It is also reported that the British government is familiar with these figures and some politicians are already ready to change their original point of view and support the introduction of "quarantine". Thus, although business activity in the services and manufacturing sectors of Britain did not decrease in December, this can be expected by the end of January. At the same time, Boris Johnson's political ratings may suffer even more if the British economy starts to slow down or shrink again. Recall that the latest social studies show that Boris Johnson's popularity is falling not only among voters but also among his fellow party members, many of whom believe that Rishi Sunak, who is now finance minister, would be a better Prime Minister than Johnson. A certain part of respondents even believes that Boris Johnson will leave his post before the end of 2022, that is, ahead of schedule. Therefore, now any wrong decision of a politician who recently became a father for the seventh time is under the microscope, and any deterioration in the epidemiological or economic situation can play a decisive role in Johnson's career.
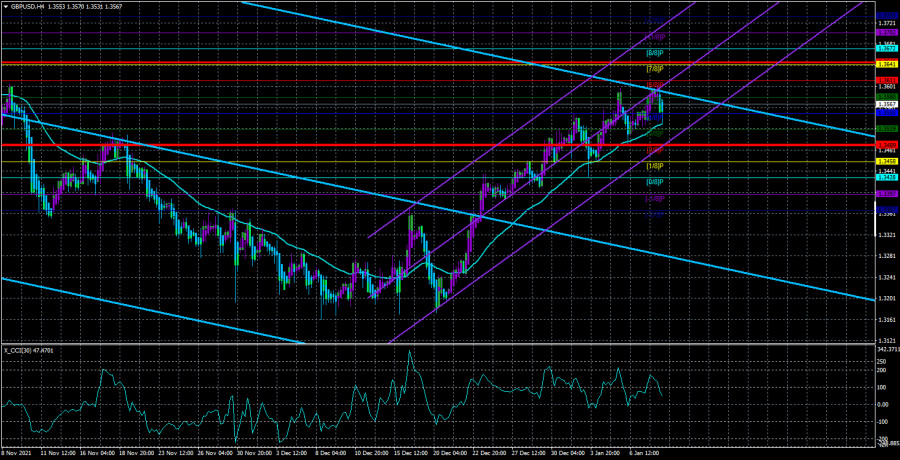
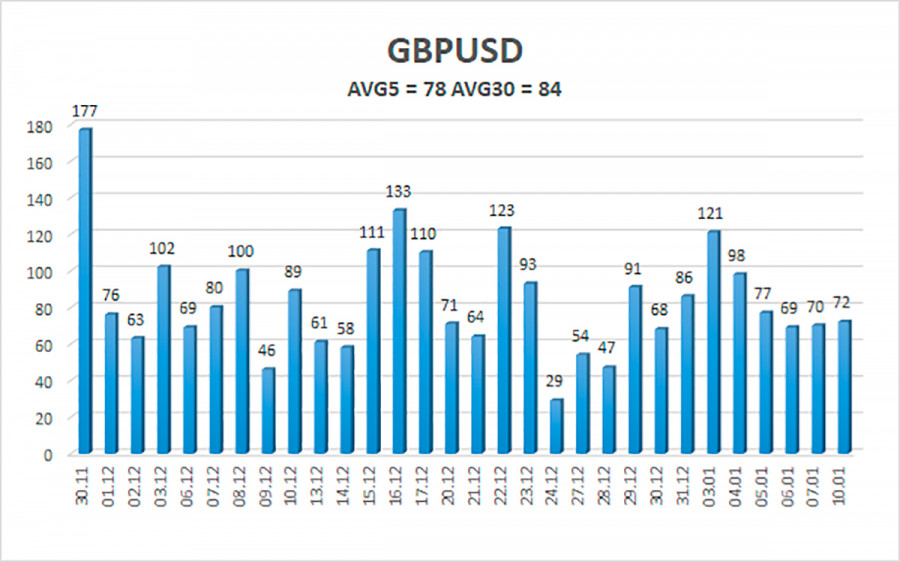
The average volatility of the GBP/USD pair is currently 70 points per day. For the pound/dollar pair, this value is "average". On Wednesday, January 12, thus, we expect movement inside the channel, limited by the levels of 1.3545 and 1.3685. The reversal of the Heiken Ashi indicator downwards signals a possible new round of downward correction. Nearest support levels: S1 – 1.3580 S2 – 1.3550 S3 – 1.3519 Nearest resistance levels: R1 – 1.3611 R2 – 1.3641 R3 – 1.3672 Trading recommendations: The GBP/USD pair continues a strong upward movement on the 4-hour timeframe. Thus, at this time, it is recommended to stay in the longs with targets of 1.3672 and 1.3685, since the price is still located above the moving average line. It is recommended to consider short positions if the pair is fixed below the moving average with targets of 1.3519 and 1.3489, and keep them open until the Heiken Ashi indicator turns upwards. Explanations to the illustrations: Linear regression channels - help determine the current trend. If both are directed in the same direction, then the trend is strong now. Moving average line (settings 20.0, smoothed) - determines the short-term trend and the direction in which trading should be conducted now. Murray levels - target levels for movements and corrections. Volatility levels (red lines) - the likely price channel in which the pair will spend the next day, based on current volatility indicators. CCI indicator - its entry into the oversold area (below -250) or into the overbought area (above +250) means that a trend reversal in the opposite direction is approaching. The material has been provided by InstaForex Company - www.instaforex.com |
| Overview of the EUR/USD pair. January 12. Jerome Powell promises to fight inflation. Posted: 11 Jan 2022 07:35 PM PST
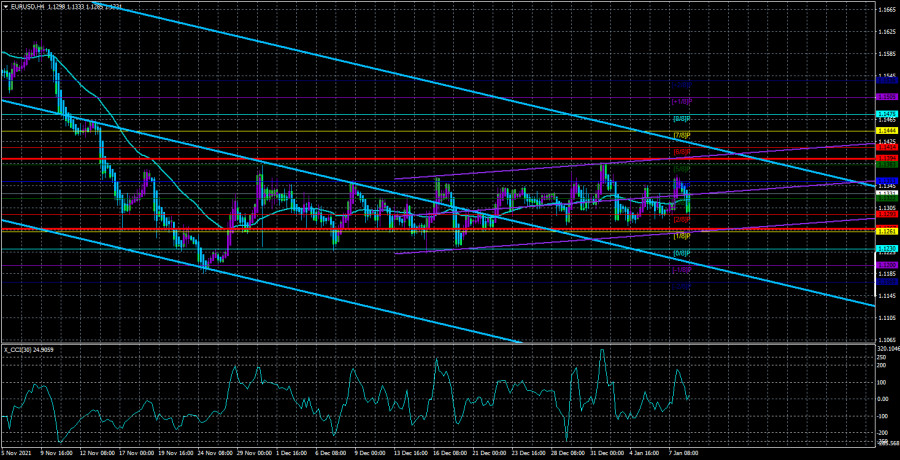
The EUR/USD currency pair continued to stay inside the side channel between the levels of 1.1230 and 1.1353 on Tuesday. In principle, the technical picture for the euro/dollar pair does not change from day to day. The flat is saved. Naturally, this state of affairs does not contribute to active trading on the currency pair. If the movements in the flat were "classic", that is, from the lower border of the channel to the upper and back, then at least it would be possible to trade "on the rebound". However, the pair can work out one border five times in a row and not move to another one. In general, the movement is most inconvenient for traders. In flat conditions, not only the Ichimoku indicator behaves strangely. The Heiken Ashi indicator also generates false signals, as it unfolds too often. As for the fundamental background, it affects the pair's movement from time to time, but it is not enough for the pair to leave the channel. A vivid example of this is last Friday when data on the labor market in the United States were published. After the publication of the Nonfarm Payrolls report, the US currency quite reasonably fell by 70 points, but there was only a little sense from this. First, the pair failed to gain a foothold above the channel. Second, on Monday, the US currency rose by the same 70 points, returning to its original position. Most other macroeconomic and fundamental events do not even have such an impact on the pair's movement. Jerome Powell spoke in the Senate on the occasion of his reappointment. Yesterday, by the way, could have been quite important in fundamental terms. ECB President Christine Lagarde (for the first time in several weeks) and Fed Chairman Jerome Powell made speeches. Both spoke about inflation and the importance of curbing its growth. The head of the ECB expressed confidence that the European regulator will be able to stop the strong price growth (inflation in the Eurozone rose to 5% y/y), as this is a matter of "confidence in the currency." Jerome Powell was more specific in his remarks and noted that "the Fed will use all available means to prevent high inflation from taking root and at the same time continue to support the American economy and the labor market." Powell also noted that he is well aware that high inflation primarily affects the least protected segments of the population, for whom the cost of essential goods and food matters. "We are determined to achieve our two main goals: price stability and a strong labor market," Jerome said on Tuesday. What conclusions can be drawn from these two statements? If we recall most of the speeches by Powell and Lagarde at the end of last year, it becomes clear: these words are intended to calm the markets and consumers. Although the Fed has begun the procedure of curtailing the quantitative stimulus program, this does not mean that inflation will begin to decline in January. On the contrary, most experts believe that the consumer price index will continue to grow for several more months, and a steady slowdown can be achieved no earlier than the end of 2022. It may even require waiting for two or three rate hikes, which should cool the economy. But at the same time, Powell spoke of "high rates of economic growth" and that these rates should be maintained. In general, something does not add up here, since any tightening of monetary policy will lead to a slowdown in the economy. Everything is quite complicated about the ECB since it does not show any signs of readiness to tighten monetary policy at all. On the contrary, the ECB openly declares that rates will not be raised in 2022, and we are talking at most about abandoning the emergency PEPP program, but at the same time, the volumes of the standard APP incentive program will be expanded immediately. Thus, the stimulus will continue at least until mid-2022, and rates will remain negative at least until the end of 2022. It is unclear how the ECB is going to deal with rising inflation.
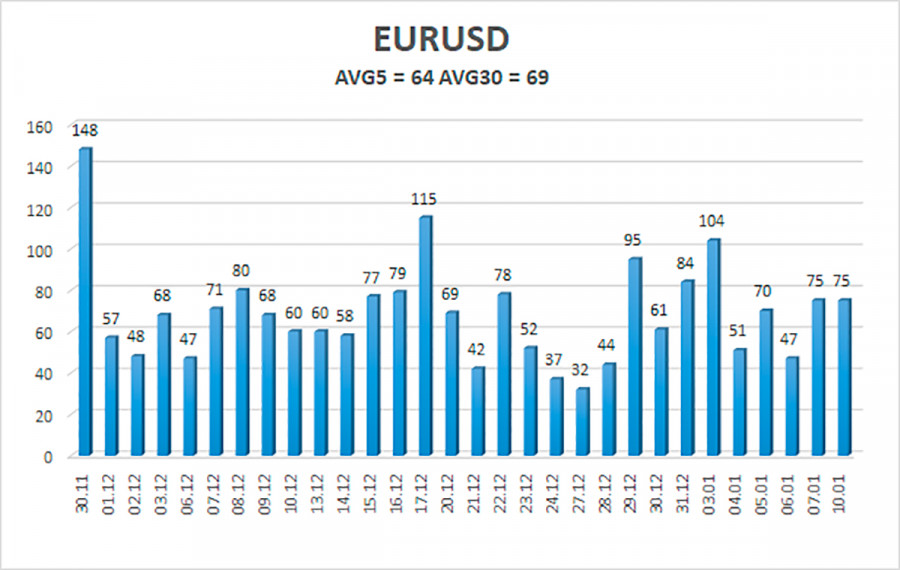
The volatility of the euro/dollar currency pair as of January 12 is 65 points and is characterized as "average". Thus, we expect the pair to move today between the levels of 1.1292 and 1.1422. The reversal of the Heiken Ashi indicator downwards signals a new round of downward movement in the limited range of 1.1230 - 1.1353. Nearest support levels: S1 – 1.1322 S2 – 1.1292 S3 – 1.1261 Nearest resistance levels: R1 – 1.1353 R2 – 1.1383 R3 – 1.1414 Trading recommendations: The EUR/USD pair continues to be located inside the 1.1230 - 1.1353 channel. Thus, the movement now remains as lateral as possible and inconvenient for trading. It was not possible to gain a foothold above this channel on Tuesday. Therefore, you can still trade only between the borders of the channel far from the most accurate signals. Explanations to the illustrations: Linear regression channels - help determine the current trend. If both are directed in the same direction, then the trend is strong now. Moving average line (settings 20.0, smoothed) - determines the short-term trend and the direction in which trading should be conducted now. Murray levels - target levels for movements and corrections. Volatility levels (red lines) - the likely price channel in which the pair will spend the next day, based on current volatility indicators. CCI indicator - its entry into the oversold area (below -250) or into the overbought area (above +250) means that a trend reversal in the opposite direction is approaching. The material has been provided by InstaForex Company - www.instaforex.com |
| Posted: 11 Jan 2022 06:28 PM PST EUR/USD 5M
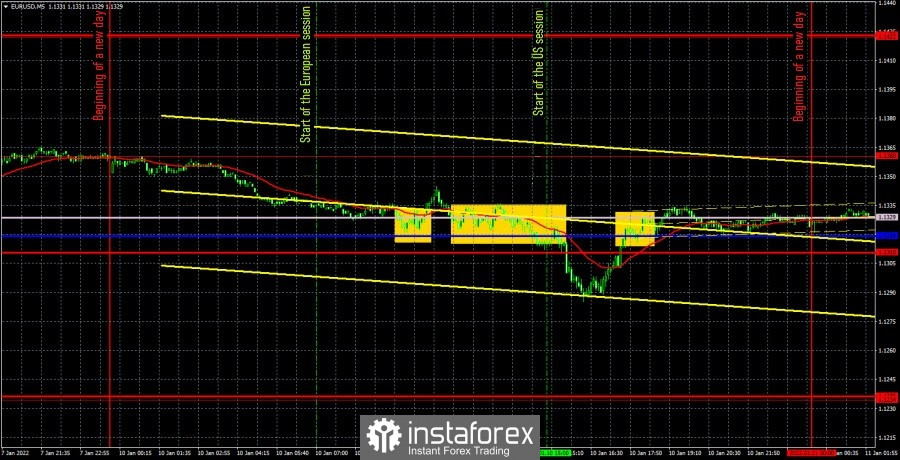
During the second trading day of the week, the EUR/USD pair traded very sluggishly. Despite the fact that the volatility was not the lowest – about 60 points - the movements were as modest as possible. The pair showed a trend movement only in the afternoon. And at the same time, it still remained within the 1.1234-1.1360 horizontal channel. Although in fact this channel has long since narrowed to 90-100 points with an upper limit at 1.1360. The minimum upward slope of the movement is also preserved, but at the same time no benefit can be extracted from this, since the angle of inclination is minimal. That is, in fact, the movement remains sideways. Over the past day, Federal Reserve Chairman Jerome Powell and European Central Bank President Christine Lagarde have given speeches. However, neither the first nor the second gave traders any fundamentally new information. Although the dollar began to fall after Powell's speech, so we can assume that the markets found something negative in his speech. But what can be negative there if the Fed is exclusively hawkish for the first time in a long time? Therefore, it remains only to deal with Tuesday's trading signals. The first buy signal was formed near the Senkou Span B line when the price bounced off it at the end of the European trading session. However, the pair could not continue to grow after this signal and formed another buy signal near the Senkou Span B and Kijun-sen lines, which should be considered collectively as a support area (they were too close to each other). This time, the European currency managed to rise in price by 30 points and even reach the nearest level - the extreme of 1.1360, and even settled below it. It was at this moment that long positions should be closed. The profit was about 17 points. No more deals should have been opened, as the trading day was ending. We recommend you to familiarize yourself: Overview of the EUR/USD pair. January 12. Jerome Powell promises to fight inflation. Overview of the GBP/USD pair. January 12. The British economy will face new challenges due to the "safe Omicron". Forecast and trading signals for GBP/USD for January 12. Detailed analysis of the movement of the pair and trade deals. EUR/USD 1H
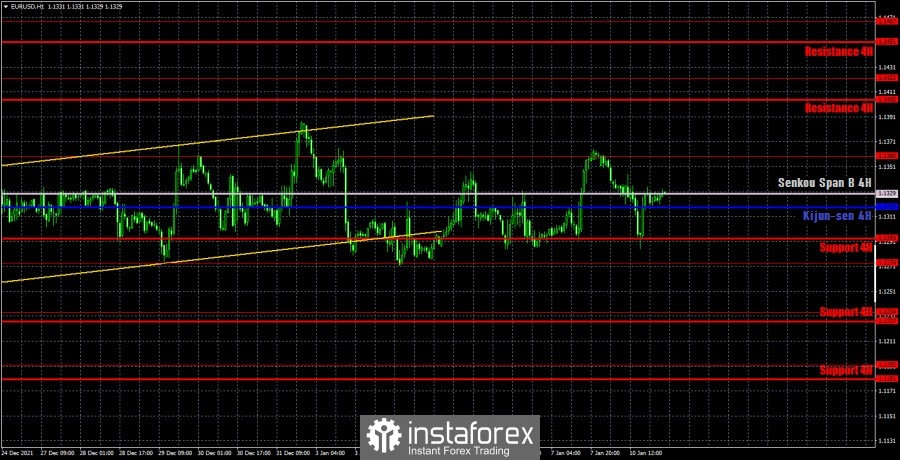
The technical picture on the hourly timeframe has not changed for a long time. In principle, the current nature of the movement is such that it is possible to build new horizontal channels almost every day. One was formed today, but it is available just to illustrate what is happening. The movement, no matter from which side you look, is still horizontal. On Wednesday, we allocate the following levels for trading - 1.1234, 1.1274, 1.1360, 1.1422, as well as the Senkou Span B (1.1329) and Kijun-sen (1.1323) lines. The lines of the Ichimoku indicator may change their position during the day, which should be taken into account when searching for trading signals. Signals can be "bounces" and "breakthroughs" of these levels and lines. Do not forget about placing a Stop Loss order at breakeven if the price went in the right direction of 15 points. This will protect against possible losses if the signal turns out to be false. It should also be taken into account the fact that the flat is being maintained now, so the lines of the Ichimoku indicator are weak. On January 12, the key event of the day is the publication of the US inflation report. We believe that it is this report that can provoke a reaction from traders, which will depend on whether this indicator continues to accelerate. A report on industrial production in the European Union will also be published, but it is secondary. Explanations for the chart: Support and Resistance Levels are the levels that serve as targets when buying or selling the pair. You can place Take Profit near these levels. Kijun-sen and Senkou Span B lines are lines of the Ichimoku indicator transferred to the hourly timeframe from the 4-hour one. Support and resistance areas are areas from which the price has repeatedly rebounded off. Yellow lines are trend lines, trend channels and any other technical patterns. Indicator 1 on the COT charts is the size of the net position of each category of traders. Indicator 2 on the COT charts is the size of the net position for the non-commercial group. The material has been provided by InstaForex Company - www.instaforex.com |
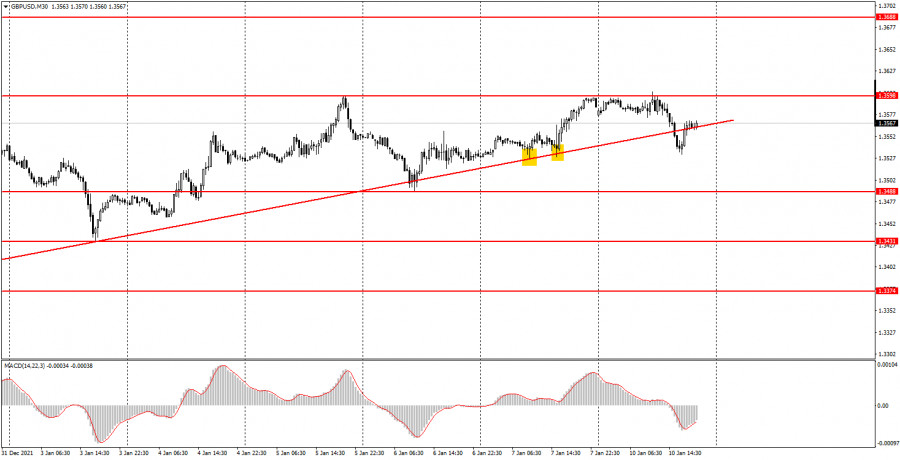
| Posted: 11 Jan 2022 01:47 PM PST Analysis of previous deals: 30M chart of the GBP/USD pair
The GBP/USD pair tried again to start a new downward trend on Tuesday, as a day earlier it once again crossed the upward trend line, but again unsuccessfully. This time, the upward movement resumed even faster than on Monday. And despite the fact that the trend line is no longer relevant, the pound is still creeping up. We believe that such a move is absolutely illogical, since at this time there are no special fundamental reasons for the rise in the price of the British currency. Yes, the pound has been getting more expensive for three consecutive weeks and at first it was possible to find purely technical reasons for such growth. But three weeks without a correction is too much! And yet, the price has already crossed the trend line twice, which should provoke at least a small correction. Today, the upward movement resumed after the speech of Federal Reserve Chairman Jerome Powell began. The text of his speech was known in the morning, but at the same time, the markets could find something for themselves that reduced the demand for the dollar. At the same time, it is definitely impossible to call Powell's rhetoric dovish now, so the fall of the dollar was hardly provoked by this event. 5M chart of the GBP/USD pair
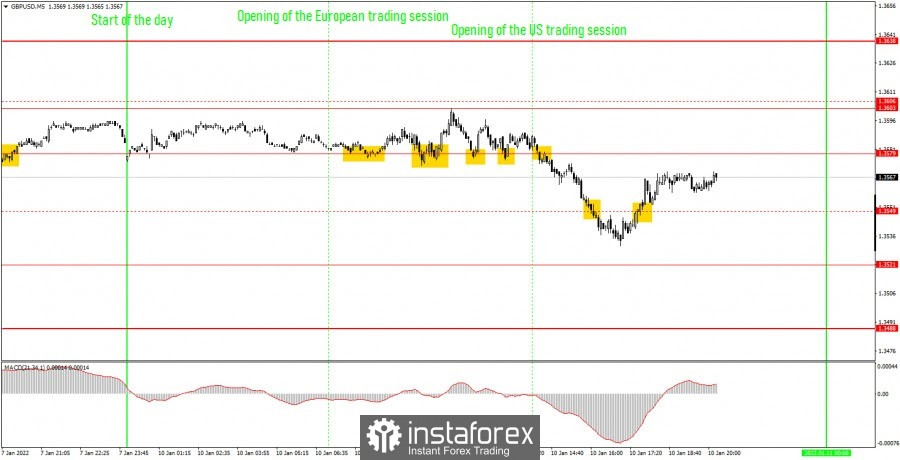
The movement of the pound/dollar pair on the 5-minute timeframe was quite difficult today, as there were at least three price reversals during the day. Frequent reversals are always bad, but let's look at the trading signals and figure out how to trade the pair today. Let's make a reservation right away that the level of 1.3561 is Tuesday's low, so it did not participate in today's trading. Thus, the first trading signal was formed after a rebound from the level of 1.3579, which, according to the results of today, has ceased to be relevant. However, after that, the price went up 31 points, which was not enough for Take Profit. The long position, therefore, should have been closed after the price was reversed below the level of 1.3603. The profit was 10 points. Consolidating below 1.3603 was also a sell signal, so novice traders could open short positions at this point. After the formation of this signal, the price went down 33 points, which again was not enough to trigger the Take Profit order. Therefore, this transaction had to be closed manually when the price went back above the level of 1.3579. The profit was also 10 points. At the signal of consolidation above the level of 1.3579, it was possible to open new long positions. The price subsequently went up 40 points, so this time Take Profit could work. But in any case, the deal should have been closed manually in the evening. In this case, the profit on it was about 35 points. Therefore, in any scenario, beginners could earn at least 50 points today according to our levels. How to trade on Wednesday: The upward trend is canceled on the 30 minute TF as the price has crossed the new upward trend line. Nevertheless, although the upward movement continues, we still expect it to end this week. The trendline itself is no longer relevant. It is recommended to trade at the levels of 1.3521-1.3531, 1.3561, 1.3603, 1.3638, 1.3688 at the 5-minute TF tomorrow. The price can bounce off these levels, or it can overcome them. As before, we set Take Profit at a distance of 40-50 points. At the 5M TF, you can use all the nearest levels as targets, but then you need to take profit, taking into account the strength of the movement. When passing 20 points in the right direction, we recommend setting Stop Loss to breakeven. No major report will be published in the UK tomorrow, no major event scheduled. Thus, on Wednesday, newcomers should focus on the US CPI. On the chart: Support and Resistance Levels are the Levels that serve as targets when buying or selling the pair. You can place Take Profit near these levels. Red lines are the channels or trend lines that display the current trend and show in which direction it is better to trade now. The MACD indicator (14,22,3) consists of a histogram and a signal line. When they cross, this is a signal to enter the market. It is recommended to use this indicator in combination with trend lines (channels and trend lines). Important speeches and reports (always contained in the news calendar) can greatly influence the movement of a currency pair. Therefore, during their exit, it is recommended to trade as carefully as possible or exit the market in order to avoid a sharp price reversal against the previous movement. Beginners on Forex should remember that not every single trade has to be profitable. The development of a clear strategy and money management are the key to success in trading over a long period of time. The material has been provided by InstaForex Company - www.instaforex.com |
| USD/JPY. Optimal medium-term strategy - longs on downward pullbacks Posted: 11 Jan 2022 01:47 PM PST The USD/JPY pair last week updated a 5-year high, reaching 116.36. The dollar in early 2022 was strengthening its positions everywhere, while the yen was getting cheaper against the background of the dovish position of the Bank of Japan. But despite the growth's momentum, the pair failed to settle within the 116th figure. Bulls were forced to retreat and take a defensive position at the base of the 115th price level. Today, USD/JPY bulls rushed into battle again, on the eve of Federal Reserve Chairman Jerome Powell's most important speech in the Senate and the equally important release of data on inflation growth in the United States. In the other dollar pairs of the "major group", the greenback behaves somewhat more modestly. In general, the pair has been within the framework of a pronounced northern trend since the beginning of December – in five weeks the price has gone up more than 300 points. But this is only the last cycle of the upward movement. If we look at a broader time period, we will see that the flywheel of the upward trend has been unwinding since January 2021. The pair gradually moved up throughout the year, even despite a multi-month wide-range flat. So, from April to July, USD/JPY fluctuated within the range of 109-111 against the background of the spread of the delta strain of coronavirus. The yen was in high demand as a protective asset, while the US currency was temporarily out of business. But as soon as the level of anti-risk sentiment in the market decreased, dollar bulls took the helm again.
Today, the US dollar is back on the horse. Downward pullbacks of USD/JPY are possible only due to a temporary weakening of the greenback. The Japanese currency does not have its own arguments for breaking the trend. The "coronavirus factor" is also not an ally of the yen. At the end of November last year, when Omicron had just appeared, USD/JPY bears were able to take advantage of the situation: literally in a day, the pair collapsed by more than 200 points. But then the uncertainty was more frightening: rumors around the new strain were very diverse, and almost all were pessimistic. Now the situation is different: the coronavirus continues to set new anti-records (thanks to the same Omicron), but the yen is not the beneficiary of the situation. Judge for yourself: literally today, the United States reported that 1,350,000 Covid cases were registered in the country during the day. This is a new world record for daily growth. The previous one was installed quite recently - on January 3 (1,030,000 cases) - and also in the US. Meanwhile, the head of the World Health Organization said today that over the next 6-8 weeks, more than half of Europeans will be infected with Omicron. The WHO recalled that the new strain has a high ability to spread, because the mutations it has allow it to be more easily fixed on human cells. However, against the background of such a news flow, the Japanese currency is not in high demand. Partly due to the fact that the authorities of key countries of the world have relied on strengthening the vaccination campaign (the introduction of a booster dose) and strengthening quarantine restrictions for unvaccinated citizens. Only some states (for example, the Netherlands or Austria) decided to introduce lockdowns following the example of 2020. In addition, Pfizer and Moderna announced the release of vaccines against Omicron yesterday. Representatives of the pharmaceutical giants note that the drugs will also be effective against other strains circulating in the world. The financial world has focused not on the coronavirus threat, but on strengthening hawkish expectations about the Fed's further actions. Even if we ignore Powell's speech in the Senate today, we can conclude that the rhetoric of the representatives of the Fed has noticeably tightened recently. In particular, the head of the Federal Reserve Bank of Atlanta, Rafael Bostic, said today that it would be "very reasonable" to go for the first interest rate increase already at the March meeting. In addition, he said that three rounds of rate hikes are expected within the current year, "and in case of further acceleration of inflation – four rounds." A similar statement was made today by the head of the Federal Reserve Bank of Cleveland, Loretta Mester. According to her, she will support a rate hike in March (this year she has the right to vote in the Committee) if the American economy at that time looks "at least the same as now." The hawkish position was also voiced by the head of the Federal Reserve Bank of Kansas City, Esther George. Although she did not talk about any specific time frame, she made it clear that she was ready to support the representatives of the "hawk wing". In particular, George said that the current accommodative policy of the regulator "does not correspond to the economic forecast." It is worth noting that if the release of data on the growth of US inflation tomorrow comes out at least at the forecast level (not to mention the green zone), the probability of the first rate hike at the March meeting will increase almost to one hundred percent. And although this scenario has already been partially taken into account in current prices, the dollar will receive some support in any case - especially when paired with the yen. In the medium term, the USD/JPY pair will be able not only to test the resistance level of 116.00 (the upper BB line on D1), but also to update the long-term price high, which is set at 116.36. In other words, longs are still a priority, and, therefore, it is advisable to use any downward pullbacks to open long positions. The material has been provided by InstaForex Company - www.instaforex.com |
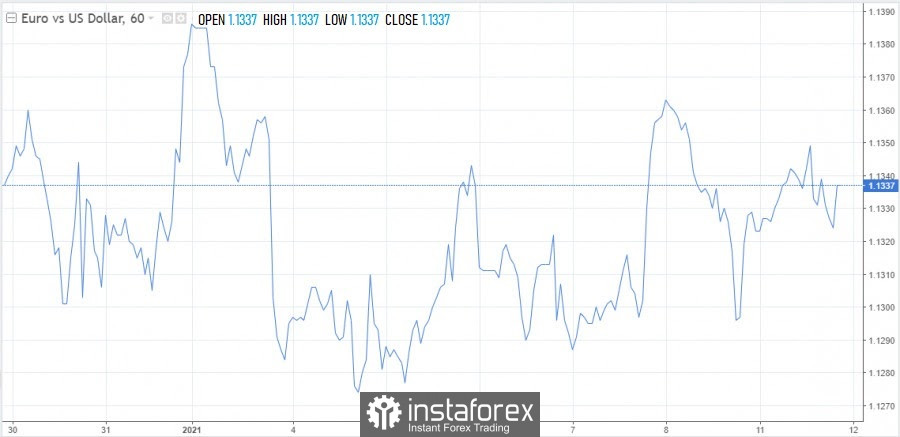
| Paralyzed dollar gives euro false hopes Posted: 11 Jan 2022 01:47 PM PST
The euro never managed to break out of the range, although there were plenty of reasons to move in the market. The EUR/USD pair has been standing in one place for too long, and considering that the New Year holidays are behind us, and there are many interesting events ahead, the long-awaited breakthrough is about to happen. The question is when and in which direction. The Federal Reserve is extremely hawkish, the futures market is set for almost a four-time rate hike this year. In theory, this should have strengthened the dollar, but it did not. The US stock market has felt the strongest pressure. The tightening of the Fed's policy automatically makes money more expensive, which is negative for funding investments in stocks. The bond market also got it – the refusal to buy bonds on the balance sheet indicates a decrease in demand for these securities, therefore, in order to balance the market, the yield had to increase. If at the end of last year the yield was at 1.50%, then at the beginning it jumped to 1.80%. Both stocks and US bonds are falling in price due to the tightening of monetary policy, and this development is not to the liking of the US dollar. However, so far it has not shown any obvious signs in this direction, and the EUR/USD pair is trading sideways. In the week from Tuesday to Thursday, the Treasury should place a new series of bonds. The demand for securities is falling, if, on top of everything else, the dollar starts - the demand for bonds will be under even greater pressure. With this development, yields may well jump to 2%. Does the US Treasury need this, especially now that the department has begun to actively build up debt after raising the national debt limit. The dollar had many reasons to move, and the fact that it is still standing cannot be called an accident. As you know, the longer the market stands still, the stronger the movement will be later. The tension is growing, the feet are accumulating, and on both sides, and then there is a sharp and very strong push in one of the sides. The main thing is not to be deceived, that is, not to run into a false exit from the range. Nonfarm could well serve to exit the EUR/USD pair range. Yes, there has been progress, but this is not the same at all. Theoretically, the next important event that can erase the boundaries of the range may be American inflation. There is no need to try to guess how investors will react to a new batch of data, because it is almost unrealistic. The most painless solution in this case is a wait–and-see attitude. As long as the EUR/USD pair is trading below the 1.1400 mark, the risk of a short-term decline in the quotation to the 1.1100–1.1000 marks will remain. At the moment, given the whole picture on the market, it is difficult to imagine the beginning of a trend for a decline in the dollar.
Resistance is noted at 1.1360, 1.1380 and 1.1400. Support is located at 1.1315, 1.1300 and 1.1280. Today's focus is on Fed Chairman Jerome Powell's speech. Investors will seize every word and look for any indication of the timing of the start of rate hikes and the likelihood of using quantitative tightening (QT) to ease price pressure. If the Fed chairman continues to adhere to a straight hawkish attitude, it will be possible to see the strengthening of the dollar again. A scenario in which Powell chooses to show caution will play against the greenback, and it will be difficult for him to attract bulls. The material has been provided by InstaForex Company - www.instaforex.com |
| Posted: 11 Jan 2022 01:47 PM PST
In December, the Federal Reserve announced plans to tighten policy, and leading banks began to revise their forecasts regarding the further steps of the regulator. In particular, The Goldman Sachs not only expects four rounds of rate hikes in 2022, but also the beginning of a reduction in the balance sheet in June. Many economists have also leaned in the hawkish direction and in recent days have strengthened their opinion that the Fed will act more decisively and at a faster pace to curb consumer price growth, which has not yet shown signs of slowing down. Analysts believe that in December, US inflation accelerated to 7% from 6.8% recorded a month earlier. Fed Chairman Jerome Powell, in prepared theses for today's speech in the Senate, which were published on Monday, promised to use the full set of central bank policy tools to prevent higher inflation from taking root. "The American economy is developing at the fastest pace in many years, and the national labor market is strong. But the strength of the recovery lies in the fact that there are constant supply and demand imbalances and bottlenecks, and, consequently, increased inflation. We know that high inflation leaves its mark, especially on those who are less able to cover the higher costs of basic necessities," said Powell. The latest "hawkish" comments by representatives of the Federal Reserve and the minutes of the December FOMC meeting give reason to believe that, despite the onset of the omicron strain, the US central bank may still be set to raise rates more quickly and reduce the size of the balance sheet, TD Securities strategists note. Such prospects are fueling the growth of US Treasury yields. The day before, the yield of 10-year treasuries updated the highs of two years ago, after which it rolled back.
If the forecasts for an increase in the federal funds rate in March come true, and this will be followed by an accelerated transition of the Fed to reduce the balance sheet, the greenback will receive an additional boost to growth. However, the likelihood of a more aggressive curtailment of monetary incentives in the context of the ongoing pandemic makes some investors think about the justification for the rush of the American Central Bank. In addition, after the release of ambiguous US employment data for December, there was a feeling that the market jumped over its head in its expectations, and if their revision begins soon, it will play against the dollar and ease the pressure on stocks, which fell sharply at the start of the new year. From last Monday to Friday, the S&P 500 index fell by almost 2%, which was the worst result for the first week of the year since 2016. Jeffrey Gundlach, the founder of DoubleLine Capital, is waiting for an increase in volatility, which will shake the US stock market considerably. "In March, the Fed will completely curtail quantitative easing, and investors should be concerned about this. The valuation of the shares also raises concerns," he said. "When the regulator started tightening monetary policy in 2018, a bear market immediately began," warns Jeffrey Gundlach. Chris Harvey, chief strategist at Wells Fargo Securities, shares a similar opinion. He believes that this year as a whole will be difficult for the stock market and predicts that the S&P 500 index will decline by about 10% before the summer. "Corrections will be observed more and more often against the background of increased volatility, and eventually the psychology of investors, which can be expressed by the phrase "the market bends, but does not break," will let them down," the expert said.
The S&P 500 index ended Monday's trading in the red zone, but was able to significantly recoup intraday losses and bounce back from session lows to close. Apparently, the players decided to buy out the securities that have fallen in price in recent days. As long as the integrity of the uptrend remains, purchases on downturns will remain relevant, with the prospect of updating record highs, despite the overheating of the market. The US stock market will need an increase in corporate profits to continue its recovery, since the key factor that supported stocks in 2020-2021 – interest rates close to zero - is likely to disappear this year, The Wall Street Journal reports. "Given the current price/earnings ratios, what we need to continue the rally in the stock market is a steady increase in profits. Even if there were no talk of raising rates, we think that the price/profit ratio for American companies is now close to the upper limit," BMO Wealth Management experts noted. As for the greenback, he has not yet managed to take full advantage of the new jump in the yield of treasuries. The day before, the USD index closed in the green zone, but could not regain the level of 96.00, which now acts as the nearest resistance. Today, the US currency has returned to a defensive position against its main competitors, although its losses so far do not exceed 0.2%. The greenback's inability to rally, despite the growing relative premium on US bond yields compared to other G10 economies, makes many wonder what needs to happen to lift the USD. However, it will not be easy to inspire dollar bulls to new exploits in the coming days, since the players have already taken into account the accelerated curtailment of asset purchases by the Fed and the increase in interest rates by the regulator. Thus, neither the hawkish statements of FOMC officials, nor the confirmation of rising inflation in the US, are likely to be able to lead to a steady rise in the greenback. At the same time, short-term spikes in USD purchases are quite possible, especially if the yield of treasuries, which conducts the markets with the onset of 2022, goes to new peaks.
If the UST yield goes into the correction phase, then the growth of the EUR/ USD pair has every chance to last up to 1.1360-1.1380, after which we should expect the resumption of sales. Fundamental factors continue to favor the dollar, but the strengthening of inflation concerns in the eurozone and the growth of German bund yields may limit the decline in EUR/USD. The yield of 10-year German bonds, which are considered the "benchmark" of European debt, reached minus 0.025% on the eve, which has not been possible since May 2019, after which it decreased slightly. European money markets are changing dramatically in tandem with the US money markets, which now estimate an 80% probability of a Fed rate hike in March. As for market expectations for the ECB, a 10 basis point rate hike is expected in October. In December, inflation in the eurozone reached 5%, and ECB Governing Council member Isabelle Schnabel warned that an energy policy aimed at solving climate change problems would spur inflation even more, provoking a response from the central bank. The European regulator still adheres to an ultra-soft monetary policy, which causes discontent among many investors. Admittedly, the story in the eurozone is more complicated than in the United States - along with financial problems due to the COVID-19 pandemic, the continent was hit by an energy crisis. As a result, the ECB was faced with a choice – either to curtail emergency assistance programs and gradually start raising the rate, or to leave everything as it is until the problems with electricity are overcome. However, after March, the vector should change here, which will have a positive effect on the euro exchange rate, including against the dollar. So far, the EUR/USD pair remains at the mercy of the greenback's market valuation. It regained its positions after falling below 1.1300 on Monday and seems to have entered a consolidation phase after touching a local high near 1.1350 on Tuesday. The nearest resistance is marked at 1.1360, followed by 1.1380 and 1.1400. The initial support is in the area of 1.1315-1.1320 (the area in which the 100-, 50- and 20-day moving averages are located), and then at 1.1300 and 1.1280. The material has been provided by InstaForex Company - www.instaforex.com |
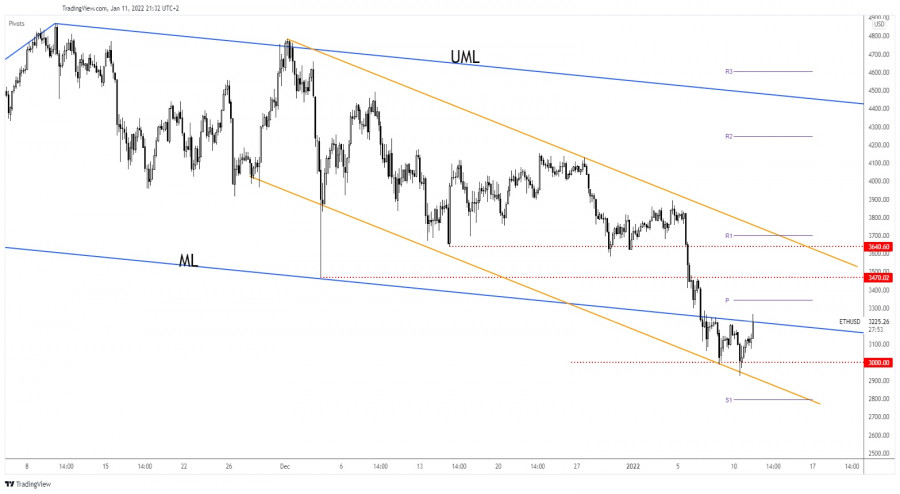
| Ethereum sell-off stopped by 3,000 psychological level Posted: 11 Jan 2022 12:18 PM PST Ethereum rallied in the last hours. At the moment of writing, it was traded at 3,236.78 level right below 3,267.67 today's high. ETH/USD registered an 11.68% growth from 2,926 yesterday's low to today's high. The cryptocurrency edged higher as the price of Bitcoin jumped higher. In the short term, the pressure remains high. ETH/USD could drop anytime again as the bias remains bearish. Technically, this could be only a temporary rebound after the most recent massive drop. In the last 24 hours, ETH/USD is up by 6.26% but it's down by 15.03% in the last 7 days. ETH/USD challenges dynamic resistance
ETH/USD registered a larger downside movement after retesting the Descending Pitchfork's upper median line (UML). It has found support on the 3,000 psychological level and now is fighting hard to close above the median line (ML). Stabilizing above the median line may signal strong buyers and potential growth at least towards the weekly pivot point (3,344.67). The levels of 3,470.02 and 3,640.60 are seen as potential upside targets as well. ETH/USD outlookEthereum bounced back after registering only a false breakdown below the 3,000 level and through the channel's downside line. A strong consolidation above the median line (ML) could bring new long opportunities towards the downtrend line. The material has been provided by InstaForex Company - www.instaforex.com |
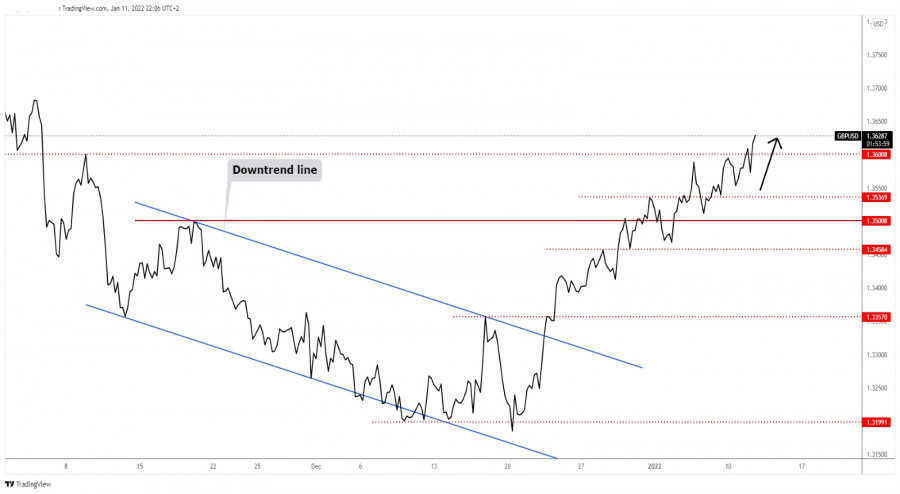
| GBP/USD heading towards fresh new highs Posted: 11 Jan 2022 12:17 PM PST
GBP/USD extends its growth as expectedGBP/USD was traded at 1.3627 level at the time of writing signaling strong buyers after its failure to stay below the 1.3600 psychological level. As you already know from my analysis, the currency pair was expected to resume its growth. I've also mentioned that jumping above the 1.3600 psychological level could confirm an upside continuation. In the short term, GBP/USD dropped a little after passing above the 1.3600 level, but the retreat was only a temporary one. GBP/USD trading conclusionThe current aggressive breakout above 1.3600 validates potential further growth and is seen as a buying opportunity. It could approach and reach fresh new highs as long as it stays above 1.36. The material has been provided by InstaForex Company - www.instaforex.com |
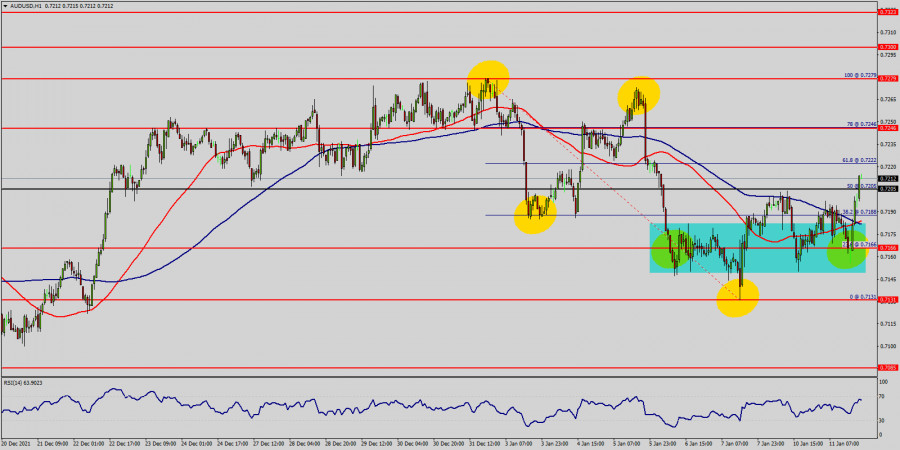
| Technical analysis of AUD/USD for January 11, 2022 Posted: 11 Jan 2022 11:43 AM PST
The AUD/USD pair will continue to rise from the level of 0.7131. The support is found at the level of 0.7131, which represents the double bottom - 00% Fibonacci retracement level in the H1 time frame. The price is likely to form a double bottom. Today, the major support is seen at 0.7131, while immediate resistance is seen at 0.7246. Accordingly, the AUD/USD pair is showing signs of strength following a breakout of a high at 0.7246. So, buy above the level of 0.7246 with the first target at 0.7279 in order to test the daily resistance 1 and move further to 0.7323. Also, the level of 0.7323 is a good place to take profit because it will form a new double top at the same time frame. Amid the previous events, the pair is still in an uptrend; for that we expect the AUD/USD pair to climb from 0.7205 to 0.7323 today. At the same time, in case a reversal takes place and the AUD/USD pair breaks through the support level of 0.7131, a further decline to 0.7085 can occur, which would indicate a bearish market. The material has been provided by InstaForex Company - www.instaforex.com |
| Technical analysis of GBP/USD for January 11, 2022 Posted: 11 Jan 2022 11:06 AM PST
Signal :
|
| Posted: 11 Jan 2022 10:37 AM PST Analyzing trades on Tuesday EUR/USD on 30M chart
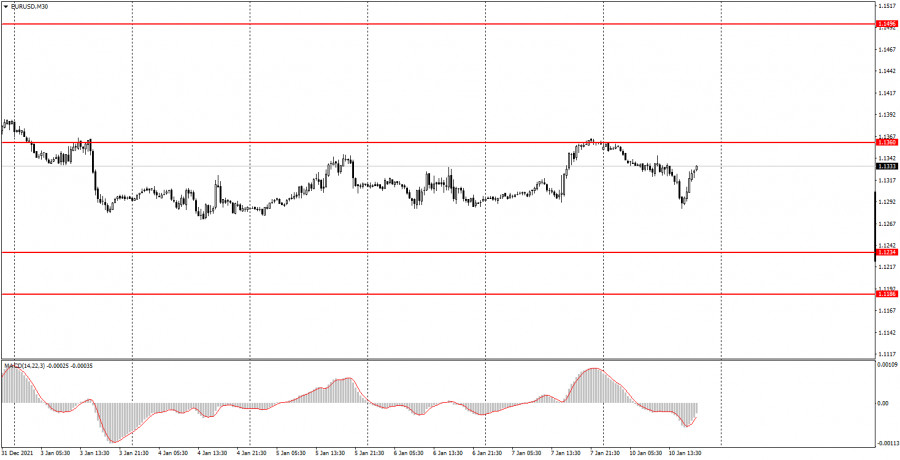
The EUR/USD pair was trading with low volatility on Tuesday. There was no macroeconomic news either in the US or in the EU. However, the heads of the central banks, Christine Lagarde and Jerome Powell, spoke yesterday. The ECB President did not give any new hints to the markets, saying that the regulator would closely monitor inflation and do everything possible to stop its growth. Jerome Powell was talking about the same thing in the evening. In the illustration below, the tick marks indicate the time when the statements were made. The US dollar decreased slightly after Powell's speech but the movement was not strong. It is hard to say for sure whether this was the market's reaction to the speech or not. In general, Tuesday's volatility was only within 55 pips, which is considered average. Despite growth in the second half of the day, the pair remained within the sideways channel of 1.1234 - 1.1360. EUR/USD on 5M chart
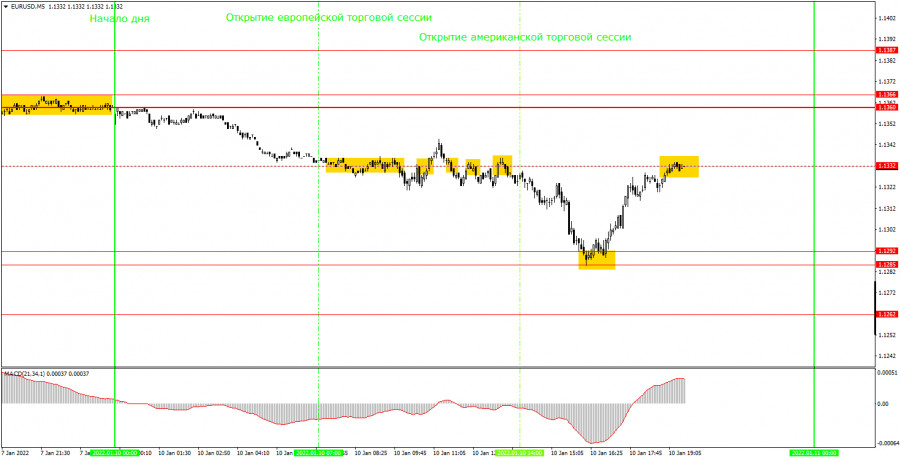
On the 5-minute time frame, the pair's movement was far from perfect on Tuesday. The quotes were fluctuating during the day, but at the same time, no valid signals were formed. The thing is that the price is still in a sideways channel. The levels inside it are either located too close to each other or are constantly changing and correcting because they do not provide adequate resistance or support to the price. As a result, the price tested the first level only in the evening when we should have closed all positions and left the market. The quote once again reached the level of 1.1360 and even settled above it, but after half an hour, it began to decline. Therefore, we are likely to see another false breakout or an unsuccessful attempt to exit the channel. Trading tips on Wednesday On the 30-minute time frame, you can clearly see that the price struggles to leave the specified flat channel. Another test of its upper boundary may lead to a new downward movement by 50-60 pips. Besides, a rebound from the level of 1.1360 is unlikely to trigger a movement to the lower boundary of the sideways channel at 1.1234. Eventually, the pair will leave this channel sooner or later but it may not develop a strong uptrend right away. On the 5-minute time frame, the levels for January 12 are as follows: 1.1285-1.1292, 1.1313, 1.1360-1.1366, 1.1387, and 1.1422. We would like to remind you that it is necessary to set a Take Profit at 30-40 pips and a Stop Loss to a breakeven point as soon as the price passes 15 pips in the right direction. Trades can also be closed manually near important levels or after the formation of an opposite signal. The macroeconomic statistics on Wednesday will be very important. The European Union will publish a report on industrial production for November, while the US will release the data on inflation for December. The second report may cause powerful buying or selling of the US dollar. Basic rules of the trading system 1) The strength of the signal is determined by the time it took the signal to form (a bounce or a breakout of the level). The quicker it is formed, the stronger the signal is. 2) If two or more positions were opened near a certain level based on a false signal (which did not trigger a Take Profit or test the nearest target level), then all subsequent signals at this level should be ignored. 3) When trading flat, a pair can form multiple false signals or not form them at all. In any case, it is better to stop trading at the first sign of a flat movement. 4) Trades should be opened in the period between the start of the European session and the middle of the US trading hours when all positions must be closed manually. 5) You can trade using signals from the MACD indicator on the 30-minute time frame only amid strong volatility and a clear trend that should be confirmed by a trendline or a trend channel. 6) If two levels are located too close to each other (from 5 to 15 pips), they should be considered support and resistance levels. On the chart Support and Resistance Levels are the levels that serve as targets when buying or selling the pair. You can place Take Profit near these levels. Red lines are channels or trend lines that display the current trend and show in which direction it is better to trade now. The MACD indicator (14, 22, and 3) consists of a histogram and a signal line. When they cross, this is a signal to enter the market. It is recommended to use this indicator in combination with trend patterns (channels and trend lines). Important announcements and economic reports that you can always find on the economic calendar can seriously influence the trajectory of a currency pair. Therefore, at the time of their release, we recommend trading as carefully as possible or exiting the market in order to avoid sharp price fluctuations. Beginners on Forex should remember that not every single trade has to be profitable. The development of a clear strategy and money management is the key to success in trading over a long period of time. The material has been provided by InstaForex Company - www.instaforex.com |
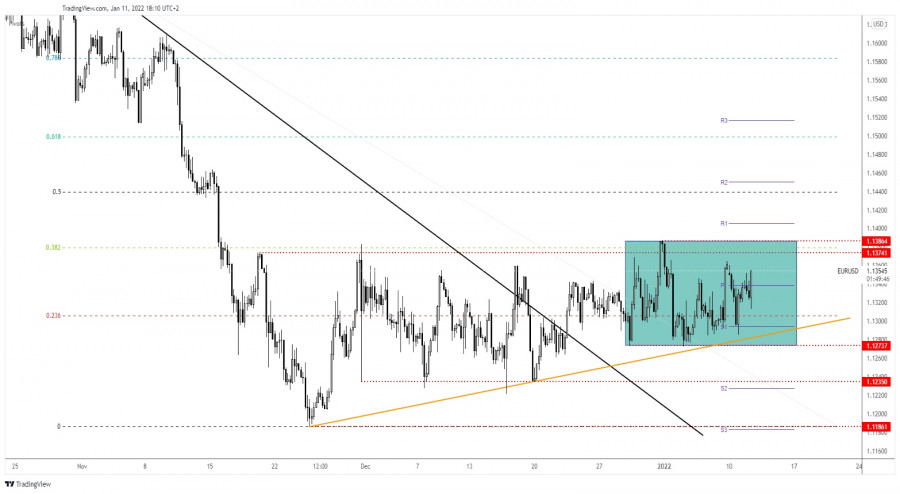
| EUR/USD looks to trade higher ahead of US Inflation Data Posted: 11 Jan 2022 10:29 AM PST The EUR/USD pair rallied at the time of writing as the Dollar Index plunged after Fed Chair Powell's statement. This was seen as a high-impact event, that's why the volatility is high. The euro drags the rate higher despite the fact that the Italian Retail Sales registered a 0.4% drop versus 0.3% growth expected. The USD dropped also because the IBD/TIPP Economic Optimism fell from 48.4 to 44.7 points while specialists expected potential growth to 50.2 points. The unexpected drop indicates pessimism. The EUR/USD pair rallied but it remains to see how it will react tomorrow around the US inflation data publication. EUR/USD strong upside pressure
EUR/USD continues to be trapped between 1.1386 and 1.1273 levels. It has failed to reach and retest the uptrend line and the 1.1235 signaling strong buyers and upside pressure. It remains to see how it will react after reaching 1.1374 and the 38.2% retracement level. Technically, only a valid upside breakout from the current range, above 1.1386 could confirm an upside continuation and a bullish reversal. Staying below the immediate upside obstacles, registering only false breakouts, or developing a bearish pattern could signal that EUR/USD could turn to the downside. EUR/USD outlookAs long as it stays under the 1.1374 - 1.1386 area, EUR/USD could still develop a larger downside movement. Escaping from the 1.1386 - 1.1273 range could bring great trading opportunities. Jumping, closing, and stabilizing above the 1.1386 could represent a buying opportunity. The material has been provided by InstaForex Company - www.instaforex.com |
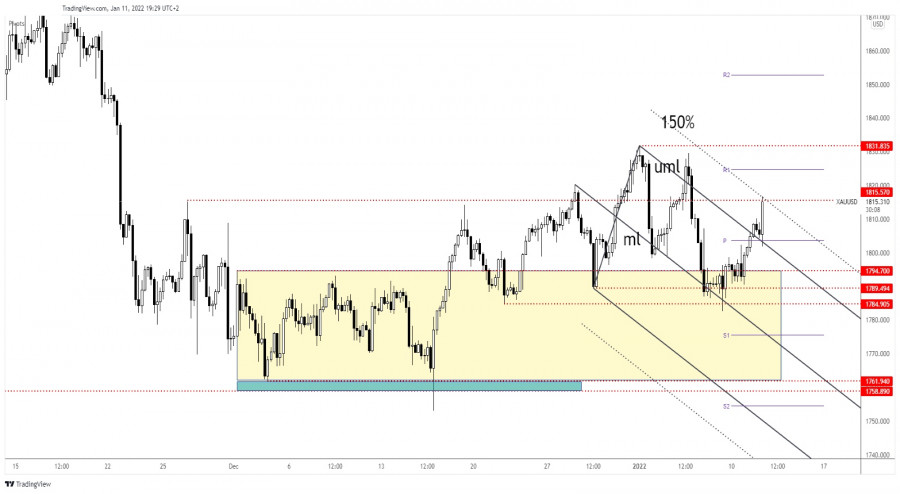
| Gold challenges 1,815 upside obstacle Posted: 11 Jan 2022 10:27 AM PST Gold rallied in the last few hours. At the moment of writing, it was traded at 1,814.81 level versus 1,800.19 today's low. XAU/USD registered a 0.92% growth from the daily low to 1,816.82 today's high. Technically, the yellow metal reached a strong resistance level, so it remains to see how it will react. XAU/USD edged higher only because the Dollar Index plunged after Fed Chair Powell's statement. He said that the Federal Reserve could increase rates more if needed. Gold rallies ahead of the US inflation data publication. As you already know, the CPI is expected to register a 0.4% growth in the last month, while the Core CPI could report a 0.5% growth. You should be careful at the time of these releases as the volatility is going to be huge. The price of gold could register sharp movements in both directions. XAU/USD rallies as DXY drops
XAU/USD reached the confluence area formed at the intersection between 1,815.57 with the 150% Fibonacci line. As you can see on the H4 chart, the price of gold has found support on the median line of the Descending Pitchfork and around the 1,784.90 level. Its temporary correction ended and now it seems determined to jump higher. Gold is used as a hedge against inflation. The current inflationary pressure could push the price higher. A valid breakout above the 1,815.57 and above the 150% line may signal an upside continuation. XAU/USD forecastGold extended its growth after retesting the weekly pivot point (1,803.71) and the Descending Pitchfork's upper median line (uml). A minor consolidation above the 1,815.57 broken resistance could signal an upside continuation. If the price of gold continues to grow, the weekly R1 (1,824.77) is seen as the next upside target. 1,831.83 high could be used as an upside target as well. The bias is bullish in the short term, so XAU/USD could extend its growth as long as it stays above the weekly pivot point (1,803.71). The material has been provided by InstaForex Company - www.instaforex.com |
| Analysis of GBP/USD on January 11. Boris Johnson is walking on the edge of a precipice. Posted: 11 Jan 2022 09:45 AM PST
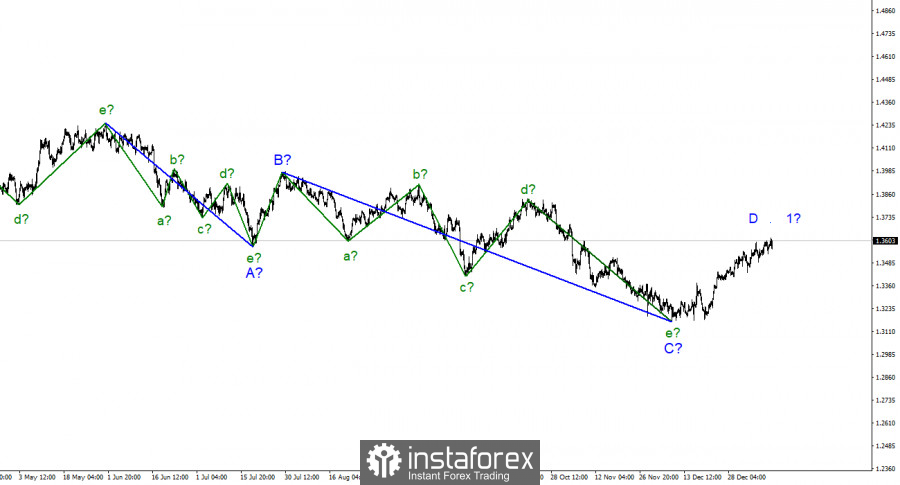
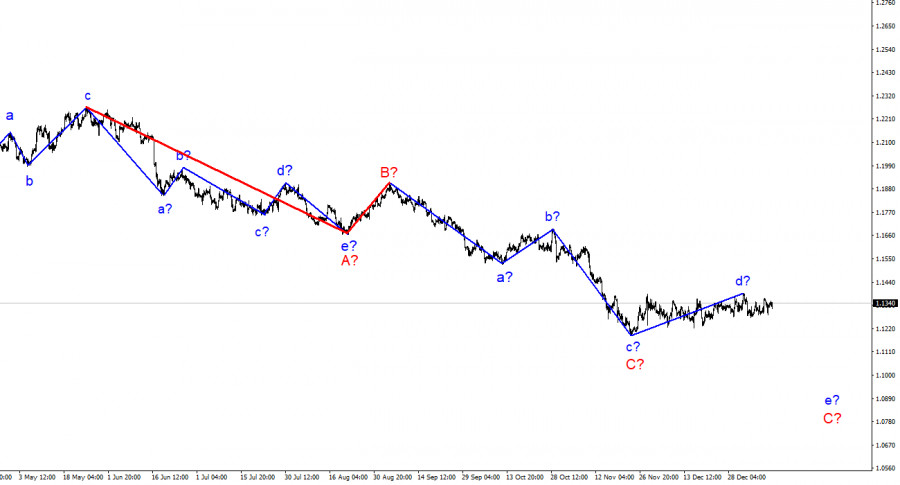
For the pound/dollar instrument, the wave markup continues to look quite convincing and is becoming more and more structured. In the last few weeks, the instrument has continued to build an upward wave, which is currently interpreted as wave D of the downward trend segment. If the current wave marking is correct, then the decline in quotes will resume after the completion of this wave, which may happen in the near future. Thus, the entire downward section of the trend may take on an even more extended form. However, if wave D takes a five-wave form, then it will need to be recognized as an impulse, and in this case, it will no longer be able to be a corrective wave D, and the entire wave pattern will require additions. At the moment, there are still three waves visible inside it, which can be the a-b-c series. In this case, an unsuccessful attempt to break the 1.3641 mark, which corresponds to 38.2% Fibonacci, may lead to its completion. I also note that the chances of building a new downward wave are also high for the euro/dollar instrument. That is, both instruments can start building a new downward wave. Boris Johnson's popularity is falling within the Conservative Party. The exchange rate of the pound/dollar instrument during January 11 managed to increase by 45 basis points, then decrease by 50 and grow by 50. The amplitude of the instrument was only 25 points. From my point of view, such movements on a day when there was no news background in the UK and the USA (except for Powell's speech, which began just an hour ago) indicate that the market is trying to maintain the construction of an upward wave, but it is doing it with the last of its strength. Market participants are no longer sure that the Briton can continue to grow stronger in a pair with the dollar. However, so far there is no sign of the completion of the rising wave and it may take a more complex and extended form. At the same time, the market's attention has shifted from economics to politics. In recent weeks, the UK has been showing huge numbers of coronavirus diseases. Omicron has long been the dominant strain in the country. Against the background of a new wave of the epidemic and Boris Johnson's refusal to introduce a "lockdown", he is subjected to harsh criticism among the population, and his political approval rating continues to decline. However, the worst thing for him is not this, but the fact that his rating is falling within his own Conservative Party. The results of a survey conducted by YouGov show that almost half of the Conservatives surveyed believe that the Prime Minister is not coping well with his duties. In politics, where the popularity of the leader plays a huge role, this factor can play a cruel joke with the prime minister. If Boris Johnson's ratings continue to fall, then the ratings of the Conservatives, who inflicted a crushing defeat on their main opponents, the Labor Party, in the last parliamentary elections, will also fall. However, already at the next election, these parties may switch places, which, of course, the conservatives want to avoid. It may even come to change the leader of the Conservative Party. General conclusions.The wave pattern of the pound/dollar instrument assumes the completion of the construction of the proposed wave D in the near future. Since this wave has not yet taken a five-wave form, I expect that a new descending wave E will be built. And it should begin in the very near future. Therefore, I advise you to sell the instrument with targets located near the calculated marks of 1.3271 and 1.3043, which corresponds to 61.8% and 76.4% by Fibonacci, if a successful attempt to break through the 1.3456 mark is made. Or an unsuccessful attempt to break through the 1.3641 mark, which corresponds to 38.2% Fibonacci.
|
| EUR/USD analysis on January 11, 2022. Jerome Powell's speech fails to surprise markets Posted: 11 Jan 2022 09:16 AM PST
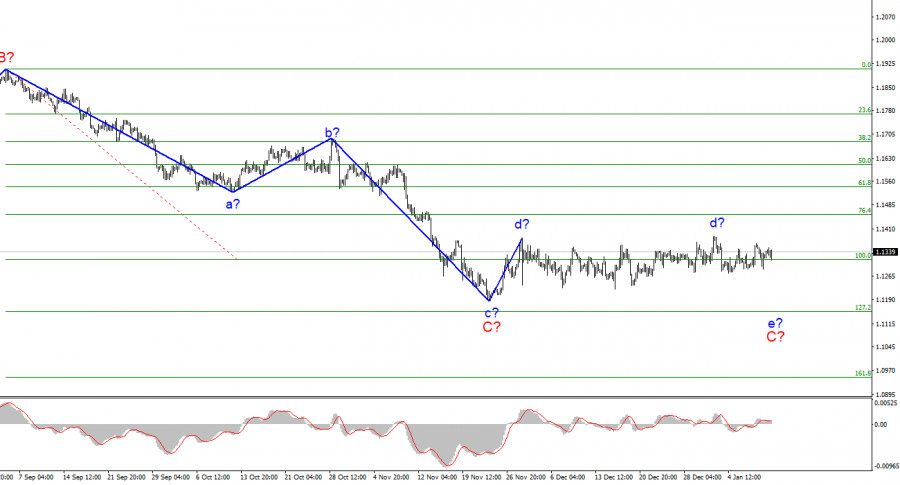
The wave layout for EUR/USD on the H4 timeframe remains unchanged. The flat movement has been in place for the whole time, and it is still difficult to say whether the supposed wave d has completed its formation. The entire wave that dates back to November 24 can turn out to be the wave d. Upon its completion, the e in C wave may start to build soon. The supposed wave may also be the first stage of a new ascending (or corrective) trend section that has taken a rather complicated form. At the moment, I tend to think that the descending section of the trend will continue as the rise in quotes has been too uncertain lately. The entire horizontal part of the trend looks like a corrective, rather than an impulse, wave. Therefore, I believe that we are talking about a corrective wave d. In any case, the supposed wave d may have a more extended and complicated form. Jerome Powell's speech fails to impress investors The EUR/USD pair was moving within the range of 17 basis points on Tuesday. This means that there was no distinctive trend during the day. The pair is still holding near the high of the supposed wave d but not much can be done with this. There is still a flat movement on the chart. According to the current wave layout, the demand for the US currency is set to increase. However, the market is struggling to find the driving factor that would push USD higher. Today, ECB President Christine Lagarde made a statement that did not give any new hints to the market. Also, Jerome Powell testified before the Senate almost an hour ago. He spoke about his possible reappointment for the second term as the head of the Fed. I did not expect much from the Fed this time. It has been displaying a clear hawkish stance lately, so there is hardly any uncertainty regarding the regulator's future monetary policy. Markets accepted the fact the Fed is planning to roll back its QE program in the coming months. Besides, investors are ready for two or even three rate hikes this year. What else could Powell add to this? He noted that inflation is staying at the highest levels, and the regulator is doing everything possible to tackle its rise. Jerome Powell also added that the target for labor market recovery is still relevant for the Fed and it will focus on it. Therefore, Powell's rhetoric has not changed much, and he is likely to be reappointed by the Senate as the head of the Fed. Voting will take place soon. Lael Brainard will be nominated as the Fed Vice Chair. Initially, Joe Biden considered her for the position of Fed Chair. Many experts approve of Biden's decision saying that this was a wise step to keep Powell at his current position. All this news, however, is unlikely to increase the attractiveness of the US dollar. Conclusion Based on the analysis above, I can conclude that the formation of the descending wave C is likely to be completed. However, the internal structure of this wave suggests that another descending wave may start to form soon. Thus, I advise selling the pair with the targets around 1.1152 until there is a successful breakout of the d wave's high. You can place a stop-loss order above the peak of the wave d. One position will be enough as the MACD indicator turns down quite often.
|
| January 11, 2021 : EUR/USD daily technical review and trading opportunities. Posted: 11 Jan 2022 08:03 AM PST
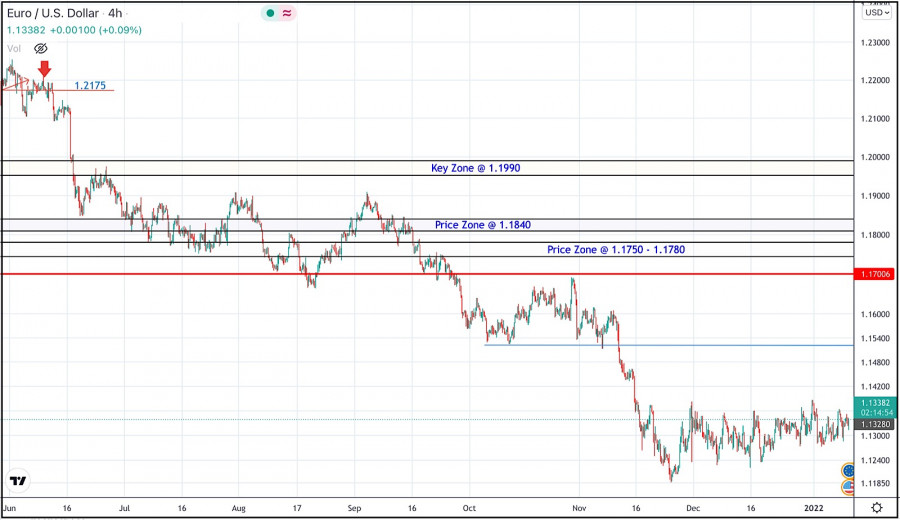
During the past few weeks, the EURUSD pair has been trapped within a consolidation range between the price levels of 1.1700 and 1.1900. In late September, Re-closure below the price level of 1.1700 has initiated another downside movement towards 1.1540. Price levels around 1.1700 managed to hold prices for a short period of time before another price decline towards 1.1200. Currently, the price zone around 1.1500 stands as a prominent supply-zone to be watched for SELLING pressure and a possible SELL Entry upon any upcoming ascending movement. Moreover, it is not advised to add new SELL Entries around the current price levels as the pair already looks oversold. The material has been provided by InstaForex Company - www.instaforex.com |
| Posted: 11 Jan 2022 08:02 AM PST
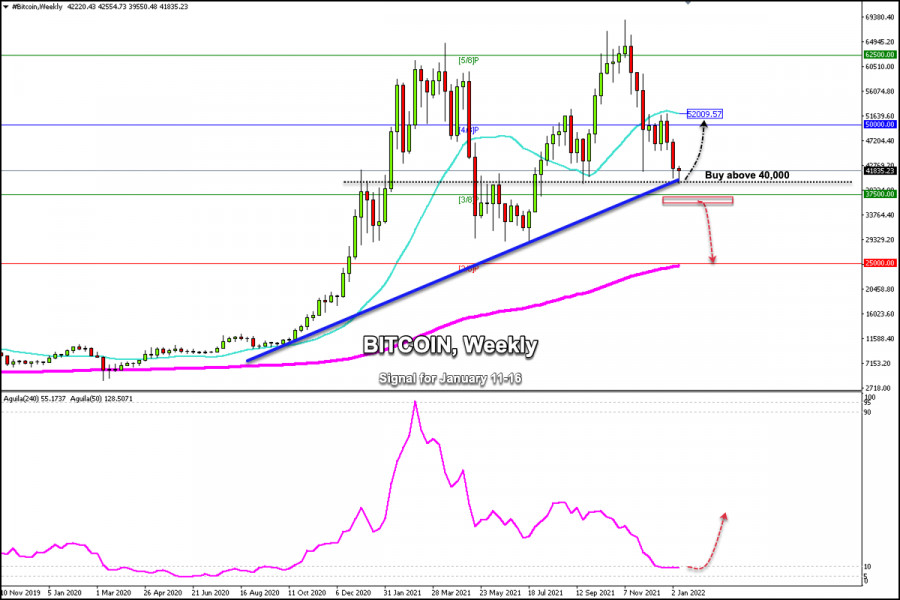
The weekly chart of Bitcoin shows that since August 16, 2020, it has maintained an upward trend. This is the second time it has touched the uptrend channel around $ 40,000. The psychological level of 40,000 represents strong support for BTC and it is expected that in the coming days it may bounce looking for the psychological level of 50,000 and towards the SMA of 21 located at 52,009. We can visualize on the weekly chart that Bitcoin is under downward pressure due to the 21 SMA hovering around 52,000. This means that any technical bounce like this area of the 21 SMA will be seen as an opportunity to sell Bitcoin in the next few days. A weekly close above the 21 SMA and above the level of 52,000 could give Bitcoin a chance to once again resume its bullish cycle and rally towards the psychological level $60,000 and up to 62,500 zone of 5/8 Murray. Institutional clients expect the price of Bitcoin to trade around $ 60,000 or to reach $ 100,000 by the end of the year 2022. However, according to our analysis, Bitcoin is likely to reach the 30,000 level by the end of the year, as the Fed will try to raise its interest rates more than four times, which could be a factor that puts pressure on Bitcoin. Another detail that can be seen in the weekly chart is that the 200 EMA is located around the support zone of 2/8 Murray at $ 25,000.This level will be the key in the future if Bitcoin falls towards this area. Around 25,000 there will be opportunities to buy Bitcoin. As long as it remains above this level, the outlook will remain positive for BTC. On the contrary, a weekly close below the zone of 25,000 and below the 200 EMA will be the start of a bearish scenario and we could expect that Bitcoin can continue downward movement towards $ 20,000 and could quickly accelerate towards the level of the $ 10,000. The material has been provided by InstaForex Company - www.instaforex.com |
| January 11, 2021 : EUR/USD Intraday technical analysis and trading plan. Posted: 11 Jan 2022 08:02 AM PST
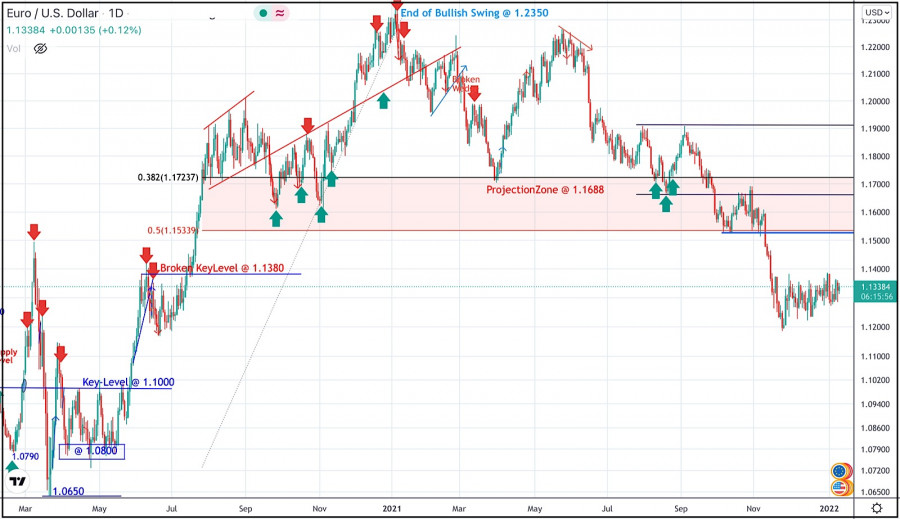
The bullish swing that originated around 1.1650 in August, failed to push higher than the price level of 1.1900. That's why, another bearish pullback towards 1.1650 was executed. However, extensive bearish decline has pushed the EURUSD pair towards 1.1600 and lower levels was reached. Shortly after, significant bullish recovery has originated upon testing the price level of 1.1570. The recent bullish pullback towards 1.1650-1.1680 was expected to offer bearish rejection and a valid SELL Entry. Significant bearish decline brought the EURUSD pair again towards 1.1550 levels which stood as an Intraday Support zone. Hence, sideway movement was demonstrated until quick bearish decline occurred towards 1.1200. Please note that any bullish movement above 1.1500 should be considered as an early exit signal to offset any SELL trades. The price levels around 1.1520 remain a reference zone that needs to be re-visited when the current bearish momentum ceases to dominate. The material has been provided by InstaForex Company - www.instaforex.com |
| January 11, 2021 : GBP/USD Intraday technical analysis and significant key-levels. Posted: 11 Jan 2022 08:00 AM PST
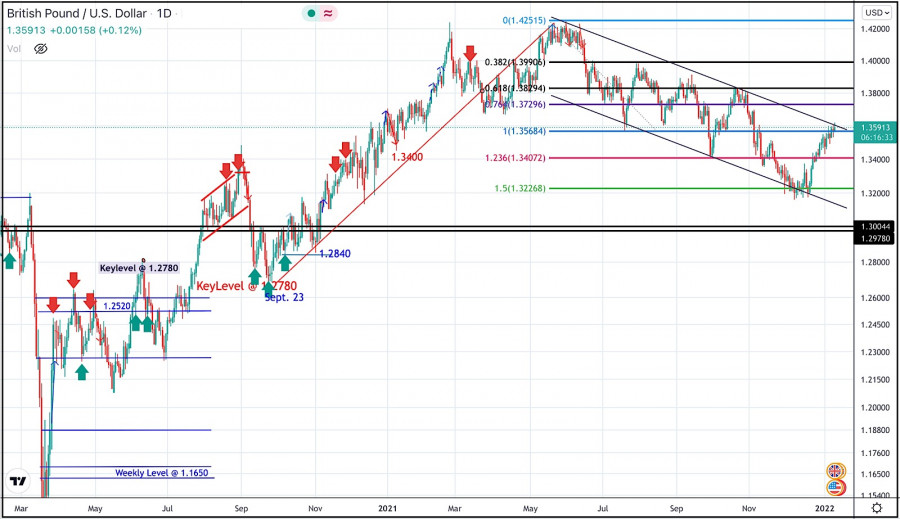
The GBPUSD pair has been moving sideways with some bearish tendency while bearish breakout below 1.3600 was needed to enhance further bearish decline. Bearish breakout below 1.3700 enabled quick bearish decline to occur towards 1.3400 which corresponded to 123% Fibonacci Level of the most recent bearish movement. This was a good entry level for a corrective bullish pullback towards 1.3650 and 1.3720 which was temporarily bypassed. Shortly after, the pair was testing the resistance zone around 1.3830 where bearish pressure originiated into the market. More bearish extension took place towards 1.3220 where the lower limit of the current movement channel came to meet with Fibonacci level. Conservative traders should have taken BUY trades around 1.3200 price levels as suggested in previous articles. BUYERS are watching the current price levels of 1.3570 and 1.3600 to have some profits off their trades. Moreover, the price level of 1.3570 stands as a key-resistance to be watched for bearish reversal if some bearish signs existed Today. On the other hand, the short-term outlook remains bullish as long as the pair maintains its movement within the depicted channel above 1.3400. The material has been provided by InstaForex Company - www.instaforex.com |

| You are subscribed to email updates from Forex analysis review. To stop receiving these emails, you may unsubscribe now. | Email delivery powered by Google |
| Google, 1600 Amphitheatre Parkway, Mountain View, CA 94043, United States | |


Comments