Forex analysis review
Forex analysis review |
- Forecast for EUR/USD on January 4. The first interesting event of the week: the Fed minutes
- Forecast for GBP/USD on January 4. UK manufacturing sector does not respond to omicron
- GBP/USD: Corrective growth continues
- Trading tips for CHF/JPY
- Why are Bitcoin bulls waiting for the level of $ 100,000?
- S&P 500 is near record prices
- Bitcoin could reach $ 100,000 in 2022
- Technical analysis recommendations of EUR/USD and GBP/USD on January 4, 2021
- Review on the US market as of January 4
- Will gold and silver become outcasts for investment in 2022?
- Technical analysis and recommendations for USD/JPY on January 4, 2022
- Daily Video Analysis: ETHUSD, D1 Strong Selling Opportunity On Channel Breakout
- Trading plan for Bitcoin for January 04, 2022
- EUR/USD analysis and forecast for January 4, 2022
- Daily stock market update. Omicron cases went down
- Trading plan for EURUSD for January 04, 2022
- New year, same dilemma: which to choose between gold or stocks?
- Technical Analysis of GBP/USD for January 4, 2022
- Technical Analysis of BTC/USD for January 4, 2022
- Technical Analysis of ETH/USD for January 4, 2022
- Technical Analysis of EUR/USD for January 4, 2022
- Forex forecast 01/04/2021 USD/JPY, GBP/JPY, USDX and Ethereum from Sebastian Seliga
- EUR/USD. Fed's minutes and Nonfarm data are in focus
- Indicator analysis: Daily review of GBP/USD for January 4, 2021
- USDCHF Potential Bearish Drop | 4th Jan 2022
| Forecast for EUR/USD on January 4. The first interesting event of the week: the Fed minutes Posted: 04 Jan 2022 04:45 AM PST
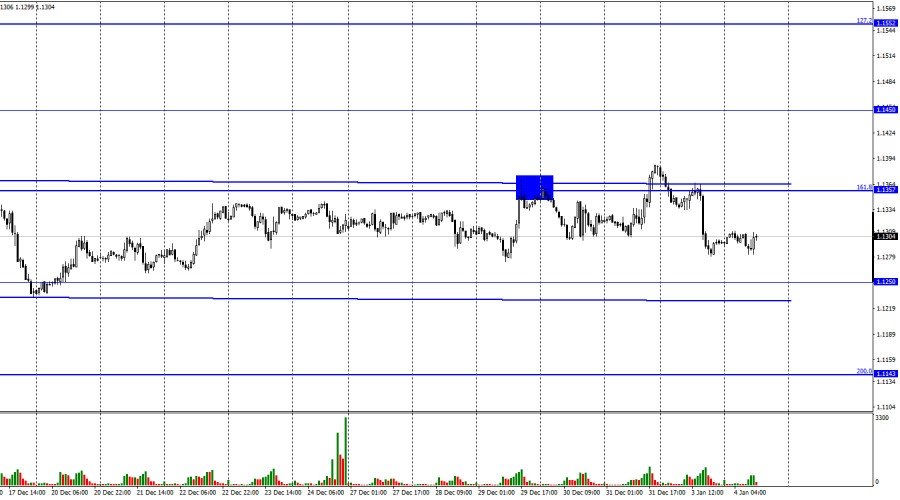
The EUR/USD pair performed a reversal in favor of the US currency on Monday from the very opening of trading and began a new process of falling towards the level of 1.1250. Thus, the pair spent at most 6 hours above the side corridor. Formally, we have a closure over the side corridor, which means a change in the mood of traders from "neutral" to "bullish". However, in reality, the pair is in the same place as during the last month - inside the side corridor. Therefore, I do not advise concluding the completion of the sidewall yet. Traders need to gain a more convincing foothold over the corridor so that they can conclude about the beginning of a new trend. On Monday, the entire information background was expressed by business activity indices in the manufacturing sectors of the United States and the European Union. The first report turned out to be only 0.1% weaker than expectations, and the second was completely in line with them. These minimal deviations could not affect the mood of traders in any way, so I am inclined to believe that the information background was simply absent yesterday. Today, the situation will not be much better, as we are waiting for all the same business activity indices. More precisely, one index is ISM. The first really interesting event of the week will only be the FOMC protocol, which will be released tomorrow evening. Let me remind you that in recent months there has been a huge amount of talk on the market about "when the Fed will start raising the rate and when it will fully complete the stimulus program." The minutes are rarely filled with information that is still unknown to traders after the meeting itself. Nevertheless, in our case, some information may still arrive. In particular, traders are interested in the mood of the Fed board members. Currently, the most popular version is the completion of the QE program in March and the first increase in the key rate over the next one or two months. The protocol is unlikely to answer the question of whether this will be the case. The protocol will only help to find out whether the "hawkish" mood among FOMC members has intensified. Therefore, the event itself is interesting, but it is unlikely to have a strong impact on the mood of traders.
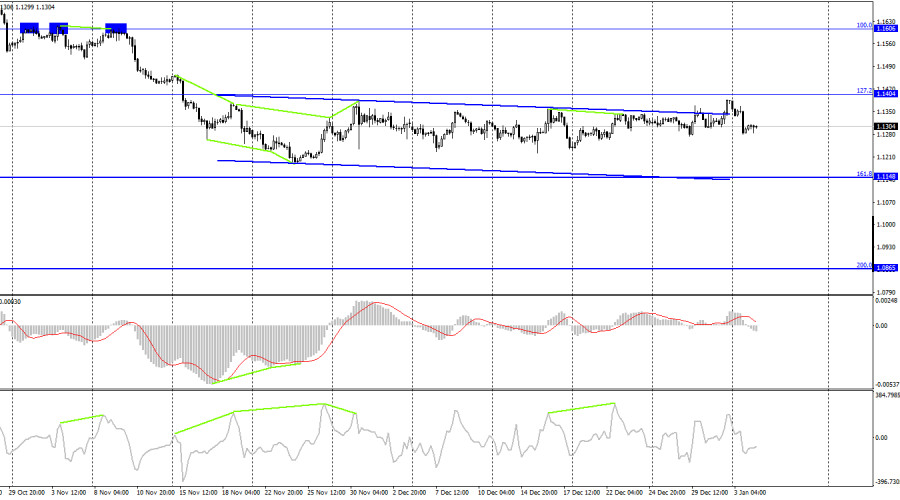
On the 4-hour chart, the pair performed a closure over a semi-descending-semi-lateral corridor, but just a few hours later returned. Thus, the situation is very similar to the one that has developed on the hourly chart. Now the process of the fall of the euro quotes can be resumed in the direction of the corrective level of 161.8% (1.1148). Emerging divergences are not observed in any indicator today. News calendar for the US and the European Union: US - ISM manufacturing index (15:00 UTC). On January 4, the calendars of economic events in the European Union and the United States are almost empty again. Traders can pay attention today only to the ISM index for the manufacturing sector in the United States. In itself, it is quite important, but the reaction of traders will depend on what its value will be. In general, I do not expect that the influence of the information background will be strong on the mood of traders today. EUR/USD forecast and recommendations to traders: After the pair closed below the corrective level of 1.1357, it was possible to sell with a target of 1.1250. Now, this deal can be kept open. I recommend buying a pair when rebounding from the level of 1.1250 or the lower border of the side corridor on the hourly chart with a target of 1.1357. The material has been provided by InstaForex Company - www.instaforex.com |
| Forecast for GBP/USD on January 4. UK manufacturing sector does not respond to omicron Posted: 04 Jan 2022 04:43 AM PST
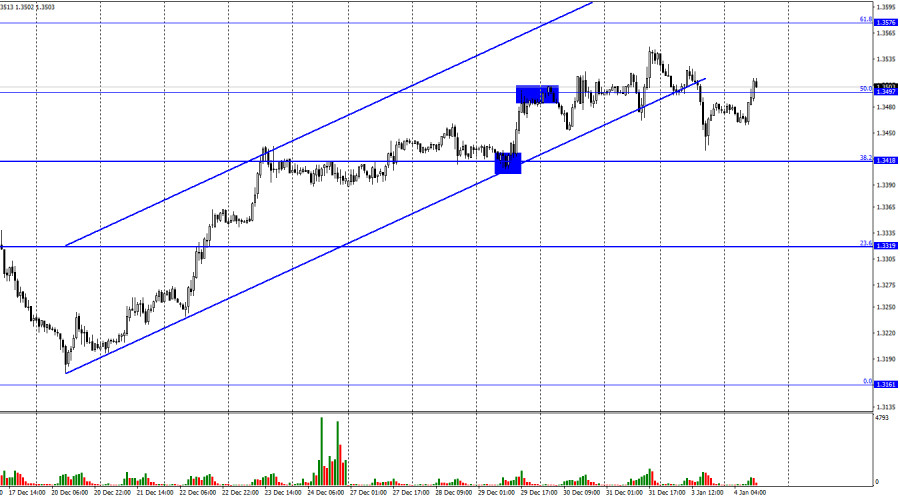
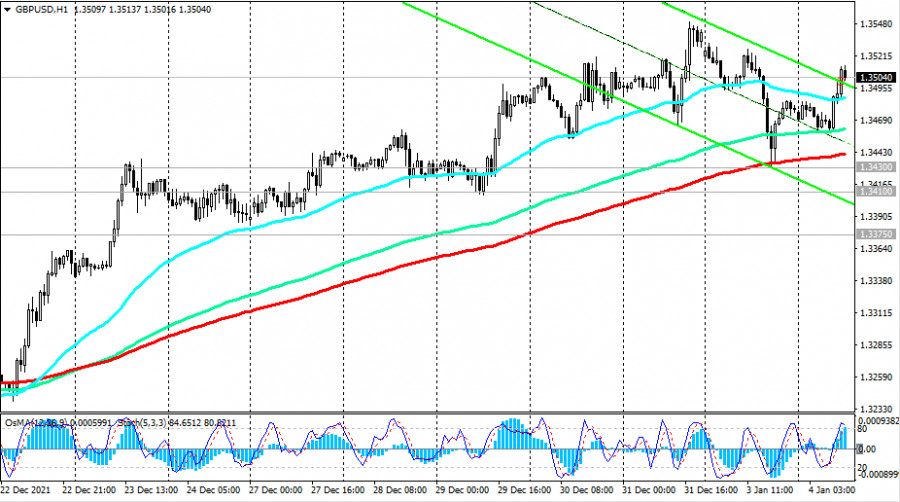
According to the hourly chart, the GBP/USD pair on Monday performed a fall in the direction of the corrective level of 38.2% (1.3418), simultaneously completing a close under an upward trend corridor. Thus, at the moment, the mood of traders is characterized as "bearish". And if so, the fall in quotes can be continued in the direction of the Fibo level of 38.2% (1.3418). The rebound of the pair's rate from the level of 50.0% (1.3497) will work in favor of the US currency and the resumption of the fall. Fixing the pair's rate above the level of 50.0% will allow traders to count on the resumption of growth in the direction of the corrective level of 61.8% (1.3576). The information background for the pair was very weak on Monday. Nothing but the index of business activity in the US manufacturing sector was published on this day. Today the situation remains the same. In the UK, the index of business activity in the manufacturing sector was released in the morning, which showed an increase in December to 57.9. Thus, business activity in manufacturing even grew in December, although this month accounts for the strongest increase in the number of omicron diseases in the country. However, at the time of the outbreak of the pandemic, the services sector suffered the most, which also has a serious share in the final GDP indicator, which, according to most experts, will seriously slow down in the fourth quarter in both the US and the UK. Thus, strong business activity in production should not be misleading. Also, the strong growth of the British dollar in recent weeks should not be misleading. I have already said that when looking at the older charts, it is visible that a correction is needed after a long fall of the pair. Perhaps the growth of the British is this correction, after which its decline will resume. Today, traders are still waiting for the ISM index in the USA, and tomorrow - the FOMC protocol in the USA.
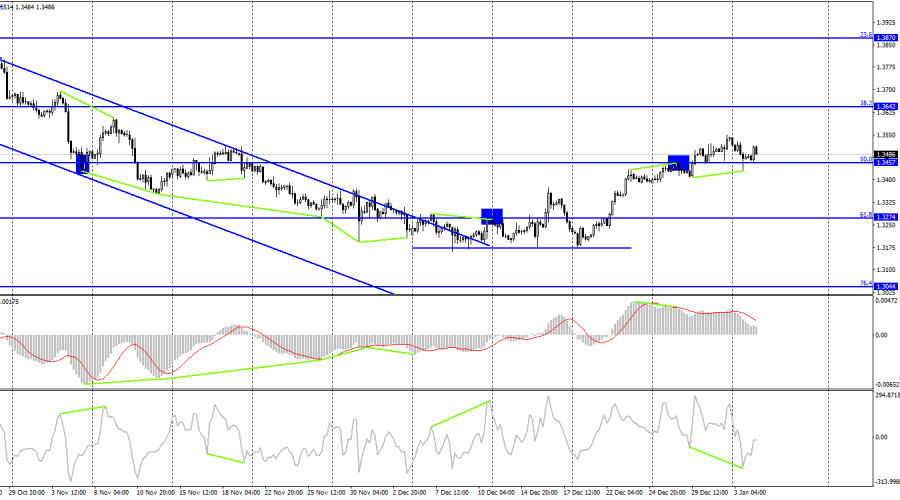
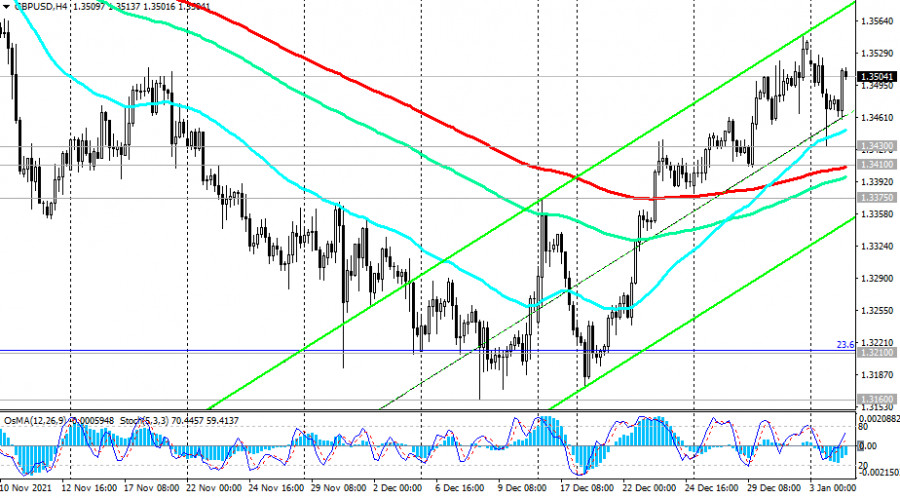
On the 4-hour chart, the pair closed above the Fibo level of 50.0% (1.3457). Thus, the growth of the British dollar can be continued in the direction of the next corrective level of 38.2% (1.3642). This is the difference with the hourly chart, where a drop is more preferable. But if there is a closure below the 50.0% level on this chart, then the probability of the British falling in the direction of the corrective level of 61.8% (1.3274) will increase. A bullish divergence has formed at the CCI indicator, but it will be canceled if there is a closure below the 50.0% level. News calendar for the USA and the UK: UK - PMI index for the manufacturing sector (09:30 UTC). US - ISM manufacturing index (15:00 UTC). On Tuesday in the UK and America, the calendars contain only one entry each that attracts attention. The British PMI index has already been released, only the American business activity index remains. However, the influence of the information background today is unlikely to be strong or at least tangible. GBP/USD forecast and recommendations to traders: I recommend selling the pound if there is closure under the upward trend corridor on the hourly chart with a target of 1.3418. At this time, you can sell the pair if there is a rebound from the level of 1.3497. I recommend buying the Brit if there is a rebound from the 1.3418 level on the hourly chart, with a target of 1.3497. The material has been provided by InstaForex Company - www.instaforex.com |
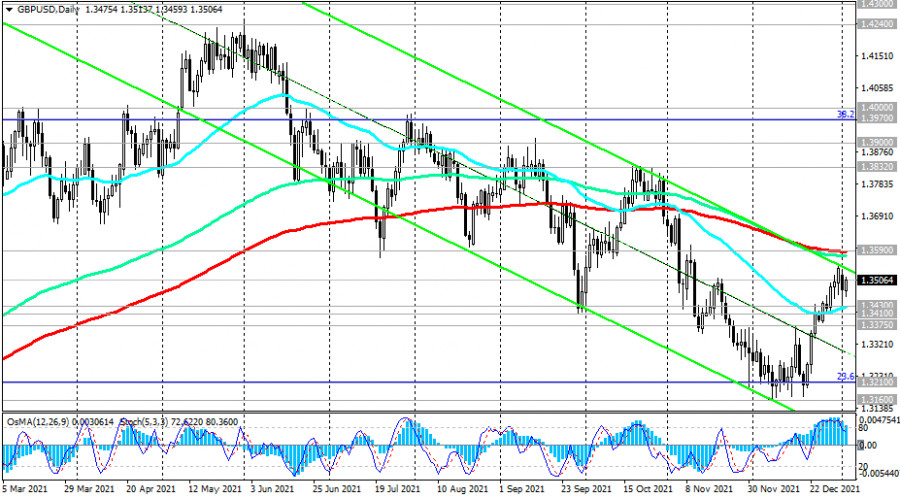
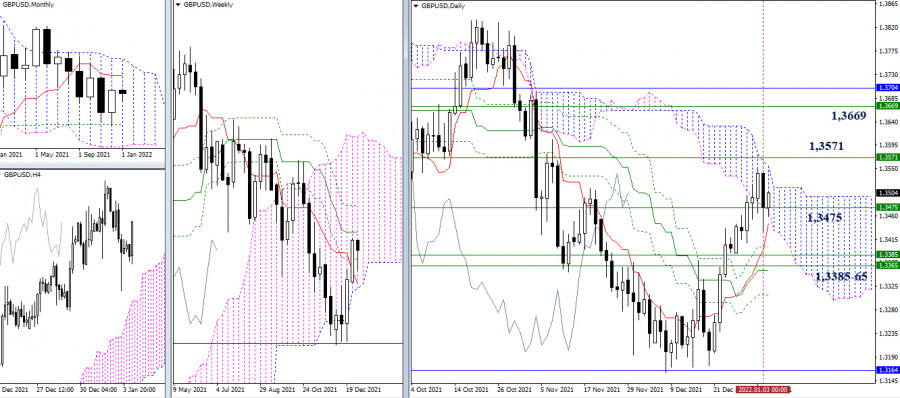
| GBP/USD: Corrective growth continues Posted: 04 Jan 2022 04:37 AM PST The IHS Markit/CIPS UK Manufacturing PMI released today, which measures the business climate and conditions in the UK manufacturing sector, indicated that activity was picking up. This sector forms a significant part of the total UK GDP, and its growth (up to 57.9 in December) is an important positive indicator of the business environment and the general state of the UK economy, and this, in turn, along with high inflation creates conditions when the Bank England may consider raising interest rates again. Economists believe that the pound has the potential to strengthen further amid easing concerns over COVID-19 and the prospect of new interest rate hikes by the Bank of England. GBP/USD may well break the resistance level of 1.3590 (200-period moving average on the daily chart). If the pair manages to gain a foothold in this zone of the bull market, then the next targets may be the resistance levels 1.3700, 1.3800, and 1.3900. Provided that the Bank of England really decides to raise the interest rate at the meeting on February 3, and the Fed does not at its meeting on January 25 and 26. Technical Analysis and Trading Recommendations Having tested an important support level (Fibonacci level 23.6% of the correction to the decline of the GBP/USD pair in the wave that began in July 2014 near the level of 1.3200), GBP/USD rebounded from it and rose by 2.3% to the current level of 1.3505, breaking through important resistance level 1.3430 (50 EMA on the daily chart).
Nevertheless, the current growth in GBP/USD should still be viewed as corrective, and the main scenario is still a long-term decline within the bearish trend.
However, to resume short positions, you should still wait for the price to return to the zone below the support level of 1.3410 (200 EMA on the 4-hour chart), and the breakdown of the support level 1.3440 (200 EMA on the 1-hour chart) will be the first signal for this. A breakdown of the local support level 1.3160 will open the way for a decline towards 1.3000, and 1.2700.
In an alternative scenario, the corrective growth of GBP/USD will continue, and its target may be resistance levels 1.3590 (200 EMA on the daily chart), and 1.3600. Their breakdown may signal the end of the downward trend. Support levels: 1.3440, 1.3430, 1.3410, 1.3375, 1.3300, 1.3210, 1.3160, 1.3000, 1.2865, 1.2685 Resistance levels: 1.3590, 1.3700, 1.3832, 1.3900, 1.3970, 1.4000 Trading recommendations Sell Stop 1.3450. Stop-Loss 1.3530. Take-Profit 1.3440, 1.3430, 1.3410, 1.3375, 1.3300, 1.3210, 1.3160, 1.3000, 1.2865, 1.2685 Buy Stop 1.3530. Stop-Loss 1.3450. Take-Profit 1.3590, 1.3700, 1.3832, 1.3900, 1.3970, 1.4000 The material has been provided by InstaForex Company - www.instaforex.com |
| Posted: 04 Jan 2022 03:34 AM PST
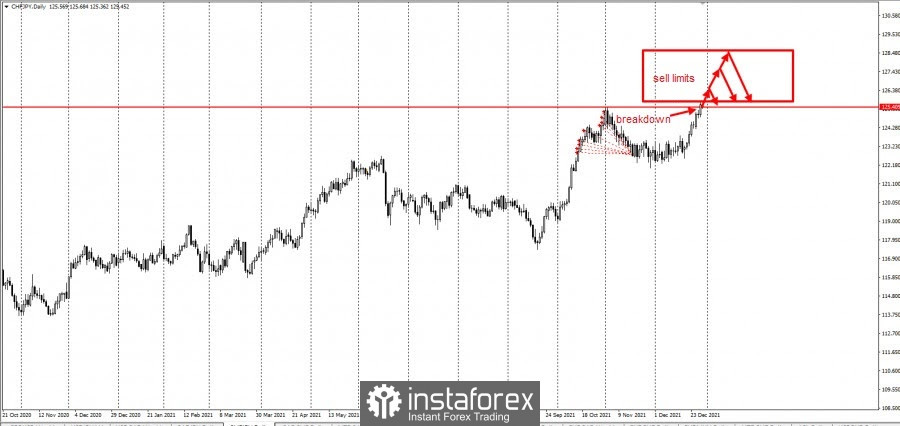
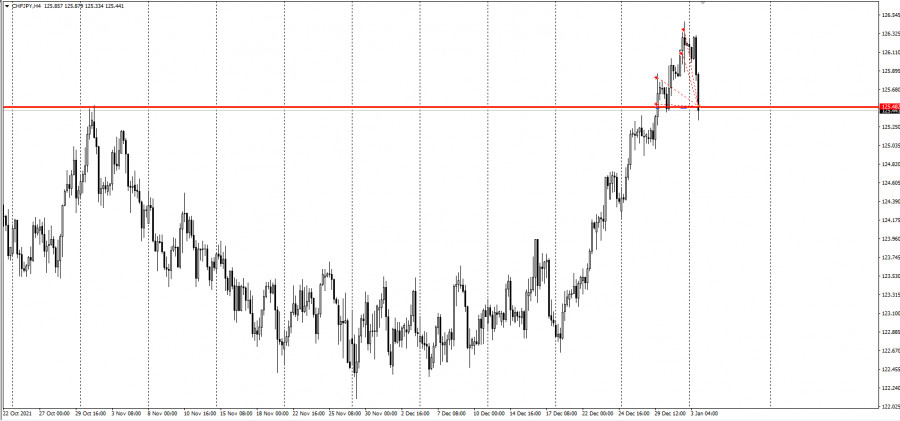
CHF/JPY bounced back to 125.5, completing the plan we presented last December 30. In it, we recommended setting limit orders after the breakdown of 125.5. Plan:
Development:
Congratulations to those who followed the idea! The pair moved as much as 500 pips. We can place another set of grids to gain new yearly highs. This strategy is called grid trading, which is usually used on cross rates. Good luck and have a nice day! The material has been provided by InstaForex Company - www.instaforex.com |
| Why are Bitcoin bulls waiting for the level of $ 100,000? Posted: 04 Jan 2022 03:30 AM PST
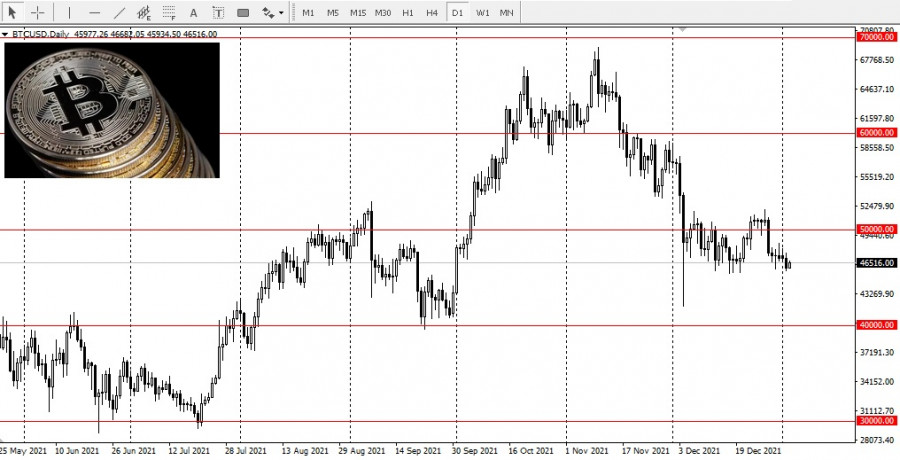
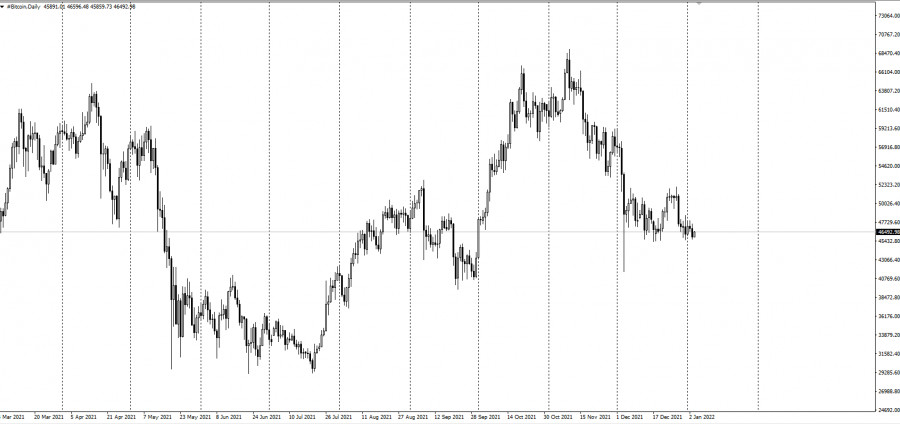
Cryptocurrencies boomed last year, but the reduction in Bitcoin (BTC-USD) spending at the end of the year left many investors unsure that they would make the same profit in the new year. Bitcoin, trading around $ 46,360, has fallen 8% since last week and is 31% below the all-time high reached in November when it traded around $69,000. So, while hopes for Bitcoin reaching $ 100,000 in the short term have not been fulfilled, bulls remain calm, and some are not afraid to double their forecasts.
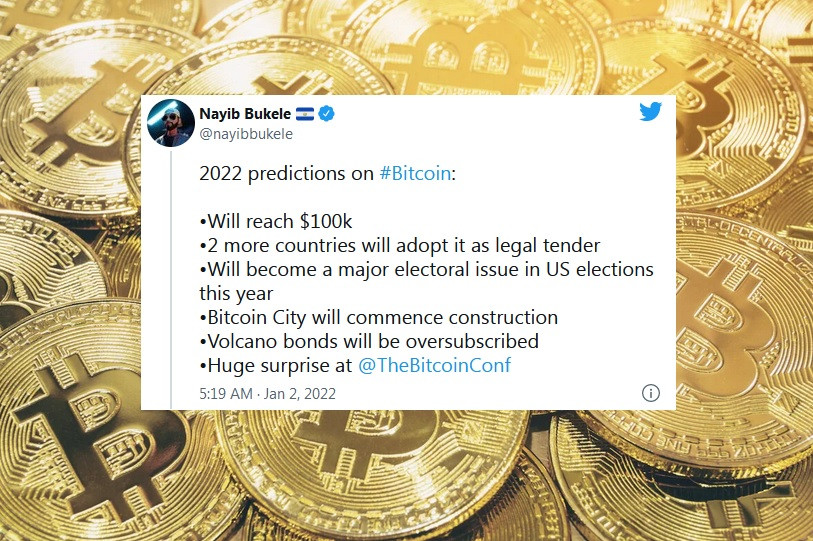
On Monday, George Tung of Yahoo Finance said that there is some correction in the short term for Bitcoin. He added that inflation will be a continuing problem in the long term, and Bitcoin is currently seen as the best hedge against inflation. The chief strategist at Bitcoin software company Blockstream, Samson Mow, was among those who predicted Bitcoin's move to six figures. He insists that a high mark is still possible. According to him, $ 100,000 will be hit in the first half of the year. He also acknowledged that Bitcoin will continue to operate as a risk-sensitive asset in the short term, fluctuating depending on the central bank and government policies and broader shifts in the stock market. His comments follow a similar prediction made by Salvadorian President Nayib Bukele, who made the same statement over the weekend.
According to Bukele, two more countries will accept Bitcoin as legal tender this year. Blockstream and El Salvador recently made headlines after Bukele and Mow announced a partnership offering so-called "volcanic bonds." But while the bond is not yet available, Mow said Blockstream is working with a number of brokers. The other half of this supply of 10-year US dollar-denominated bonds will be converted to bitcoins. The 10-year bond, which matures in 2032, has a 6.5% coupon. El Salvador's bond placement followed a warning from the International Monetary Fund (IMF) back in June. It was reported that the conversion of bitcoins into legal tender exposes the country to significant volatility risks. But like Bukele, Mow hinted at the possibility that other countries, especially those engaged in bitcoin mining, will follow El Salvador's move to make it legal tender this 2022. According to a study compiled by the Cambridge Bitcoin Electricity Consumption Index (CBECI), while the Chinese government banned cryptocurrency mining in June 2021, the industry has re-emerged in other countries including Canada, Iran, Germany, Malaysia, and the United States,). It is possible to track how Bitcoin is used and who mines it, but the process is imperfect. The asset's payment rails allow observers to track the movement of funds from different wallets. Here, determining who owns a particular wallet address – be it a sovereign nation, a corporation, or an individual, remains more an art than a science. A recent article published by the National Bureau of Economic Research (NBER) sheds light on who exactly owns Bitcoin tokens. The individual holdings were found to be "highly concentrated," with the largest 1,000 investors controlling 3 million, or about 20% of all bitcoins in circulation. However, some bitcoin investors dispute these findings, although analysis by market research firm Glassnode showed that the growing number of large traders indicates an institutional interest in the cryptocurrency. The material has been provided by InstaForex Company - www.instaforex.com |
| S&P 500 is near record prices Posted: 04 Jan 2022 03:27 AM PST
US stocks continued to rally on Monday, trading near all-time highs. Treasury bonds, on the other hand, moved down because traders braced for the start of a potentially volatile year and three anticipated Fed rate hikes. The S&P 500 was up 0.53%, while EU stocks climbed to a record high amid low market volume. The yield on 10-year US bonds also rose 11 basis points to 1.62%.
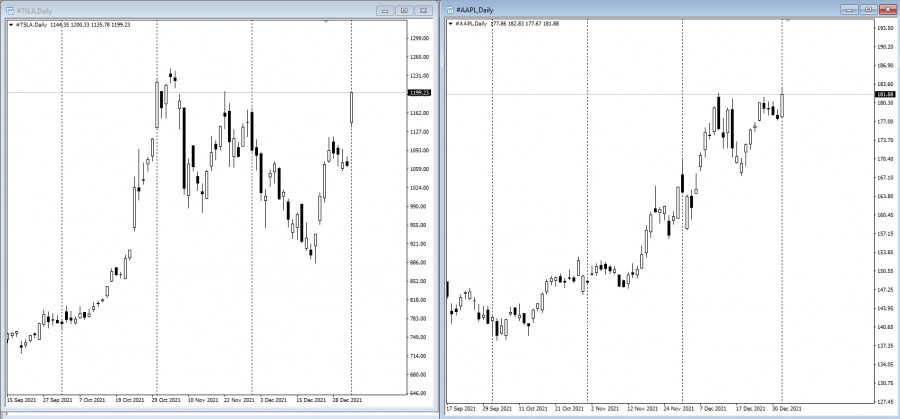
"The outlook is positive for stocks, but the removal of stimulus/accommodation from the global economy is a major theme to watch as we start 2022," said Tom Essaye, a former Merrill Lynch trader who founded "The Sevens Report" newsletter. "It'll be the first time since 2018 that the Fed is hiking rates, and that change will impact markets throughout the year." Among notable moves, Tesla shares climbed 12% as the company was able to overcome supply chain disruptions and reported significant fourth-quarter shipments. Apple also posted gains, raising its market value to $ 3 trillion. In Hong Kong, property shares fell, while China Evergrande Group halted trading.
"As we flip the calendar over, many of the current market concerns are well known and arguably well priced in at both the index and more prominently at the average stock level," said Art Hogan, chief markets strategist at National Securities. "We suggest markets have done an overly efficient job in selling the rumor, and will likely start buying the news." Other important events for this week are: - FOMC minutes (Wednesday); - James Bullard's discussion on US economy and monetary policy (Thursday); - Mary Daly's speech on monetary policy (Friday). The material has been provided by InstaForex Company - www.instaforex.com |
| Bitcoin could reach $ 100,000 in 2022 Posted: 04 Jan 2022 03:11 AM PST
Central bank policies play a key role on the outlook of cryptocurrencies in 2022. It will determine whether Bitcoin will follow its 60% growth in 2021 with another gain this year. Crypto proponents believe that the more companies and consumers delve deeper into the metaverse and NFTs, the more growth will occur regardless of macroeconomic forces. A good example of this is when an NFT artwork sold for $ 69.3 million last year, and when a group of loosely organized crypto investors battled billionaire Ken Griffin in an auction for a copy of the US Constitution. In any case, as of Monday, Bitcoin was trading 0.5% higher, at $ 47,250.
"We are bullish Bitcoin long-term, based on our long-term trend-following gauges," said Katie Stockton, founder and managing partner of Fairlead Strategies. "We assume the long-term uptrend will maintain itself and a more decisive breakout to new highs would allow for an impressive measured-move projection of approximately $90,000. For now, a corrective phase still has a hold, although there are potential signs of short-term downside exhaustion," she added. Meanwhile, Antoni Trenchev of Nexo noted: "The No. 1 influencing factor for Bitcoin and cryptocurrencies in 2022 is central bank policy. Cheap money is here to stay which has huge implications for crypto, as the Fed doesn't have the stomach or backbone to withstand a 10%-20% collapse in the stock market, along with an adverse reaction in the bond market." Trenchev sees a volatile 2022, but predicts that Bitcoin will hit $ 100,000 by the end of June. "Although I expect the speculative zeal to continue in the crypto space, it, like bloated technology valuations, faces a much more challenging environment in 2022. The primary reason is the start of interest-rate normalization by the Federal Reserve but with other major central banks likely to follow as well. That will challenge the raison d'etre that crypto is an alternative to fiat money," said Oanda analyst Jeffrey Halley. The material has been provided by InstaForex Company - www.instaforex.com |
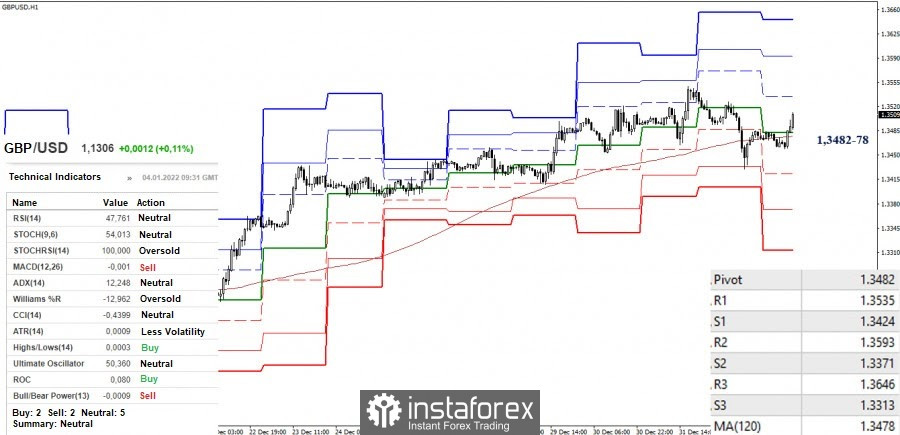
| Technical analysis recommendations of EUR/USD and GBP/USD on January 4, 2021 Posted: 04 Jan 2022 03:03 AM PST EUR/USD
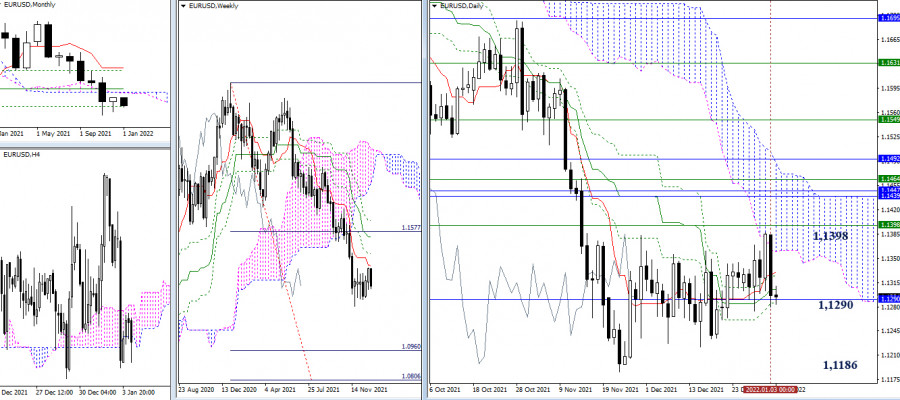
The bulls tried to develop corrective prerequisites in the last days of the past year. However, its rival returned the situation to the center of the current consolidation of 1.1290 (monthly Fibo Kijun + daily cross) on the very first trading day of the new year. As a result, it can be noted that the area of 1.1383-87-98 (highs + weekly short-term trend) now serves as the upward border of the long-term movement that has formed the uncertainty. The downward target is the minimum extremum of the movement at 1.1186.
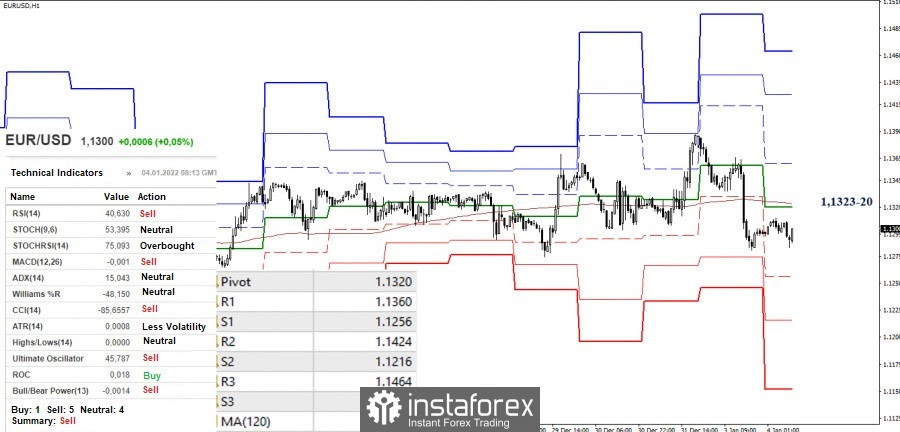
The advantage in the smaller timeframes is currently on the bearish side, as the pair is below the key levels, which are joining forces around 1.1323-20 (weekly long-term trend + central pivot level). The support for the classic pivot levels (1.1256 - 1.1216 - 1.1152) acts as pivot points for the continuation of the decline. In turn, a consolidation above the level of 1.1323-20 can change the current balance of forces in favor of the bulls. In this case, the pivot points will be the resistances of the classic pivot levels (1.1360 - 1.1424 - 1.1464). GBP/USD
The bulls managed to close December very optimistically indicating a rebound from the tested support level of 1.3164 (monthly Fibo Kijun). In addition, the pair confirmed the consolidation in the weekly cloud after an attempt to break through its lower border. It should also be noted that trading is now underway to test the resistance of the daily Ichimoku cloud. Its breakdown and reliable consolidation above will form an upward target. The implementation of the target will allow us to break through the weekly dead cross, whose levels are now the closest resistances and targets for bullish traders – 1.3571 (Kijun) and 1.3669 (Fibo Kijun). The main support levels here are formed by combinations of daily and weekly levels, among them the borders of 1.3475 and 1.3385-65 can be distinguished.
There is currently a struggle for the key levels of 1.3482-78 (central pivot level + weekly long-term trend) in the smaller timeframes, so the situation is still largely neutral. A reliable consolidation above the key levels will favor the bulls. The pivot points for further growth will be the resistance of the classic pivot levels (1.3535 - 1.3593 - 1.3646). On the contrary, the return of the bearish mood will allow us to consider the support of the classic pivot levels (1.3424 - 1.3371 - 1.3313). *** Ichimoku Kinko Hyo (9.26.52) and Kijun-sen levels in the higher time frames, as well as classic Pivot Points and Moving Average (120) on the H1 chart, are used in the technical analysis of the trading instruments. The material has been provided by InstaForex Company - www.instaforex.com |
| Review on the US market as of January 4 Posted: 04 Jan 2022 02:37 AM PST
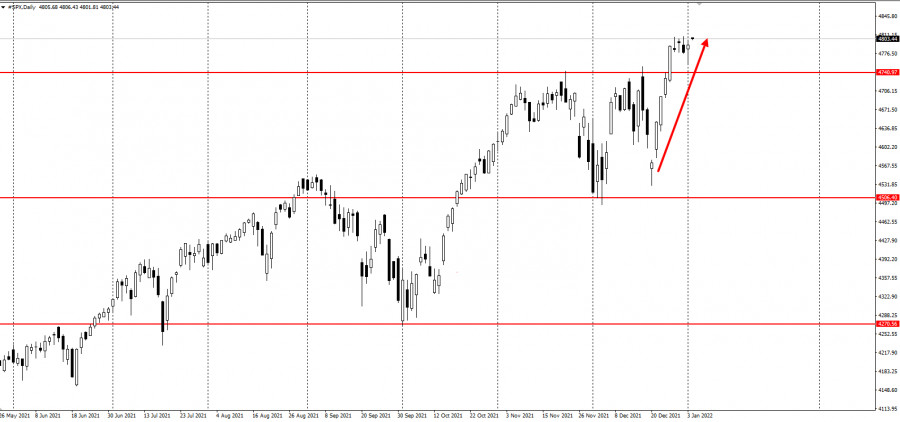
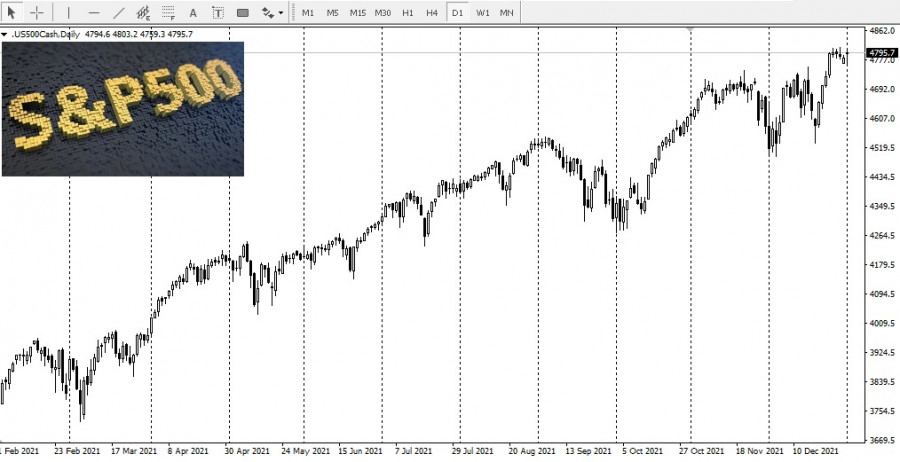
S&P 500 The US market continues to rally, which is a bit worrying. It edged higher at the end of 2021 and began this year with further growth. It clearly ignored the outbreak of omicron in the world, where just this week nearly 2 million cases were recorded each day. The US even accounted for more than 500,000 infections. Fortunately, mortality and hospitalizations are low compared to the previous variants. Even so, the Fed has turned towards tighter monetary policy, so a correction is only a matter of time. As of now though there will be growth, and this can be seen on the recent 10% increase in Tesla shares. US indices this week: Dow is up 250 p or + 0.6%, ranging from 36.330 to 36.580. NASDAQ is up 60 p or 0.4%, ranging from 15.770 to 15.830. S & P 500 is up 12 p or 0.3%, ranging from 4.784 to 4.796. Forecast: Dow will range from 36.200 - 36.700. NASDAQ will range from 15.600 - 16.000. S & P 500 will range from 4.720 - 4.850. Conclusion: A rebound may take place soon. The material has been provided by InstaForex Company - www.instaforex.com |
| Will gold and silver become outcasts for investment in 2022? Posted: 04 Jan 2022 02:31 AM PST
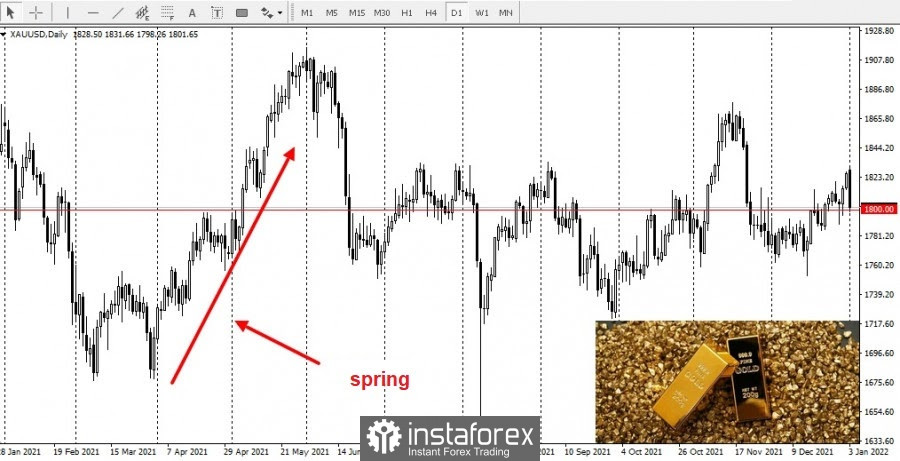
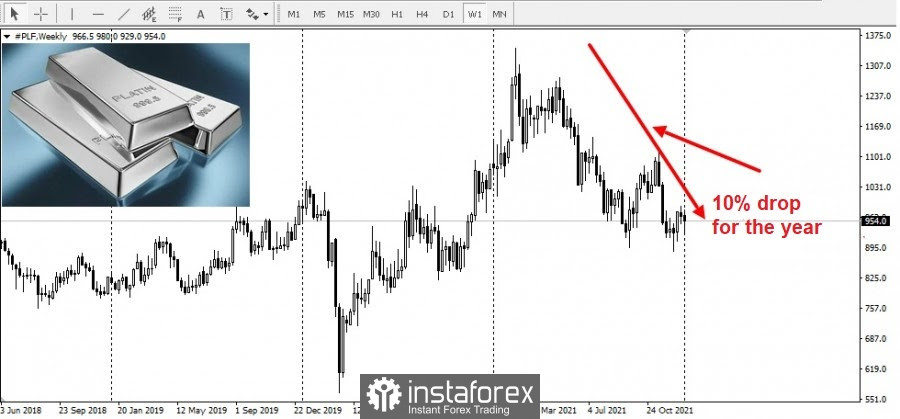
2021 has been a disappointing year for precious metals investors at least in terms of price characteristics. Gold and silver lagged behind the stock market and the general commodity indices. Gold showed signs of growth in the spring, but prices returned to almost the same range by the end of the year. The precious metal declined about 3% over the year.
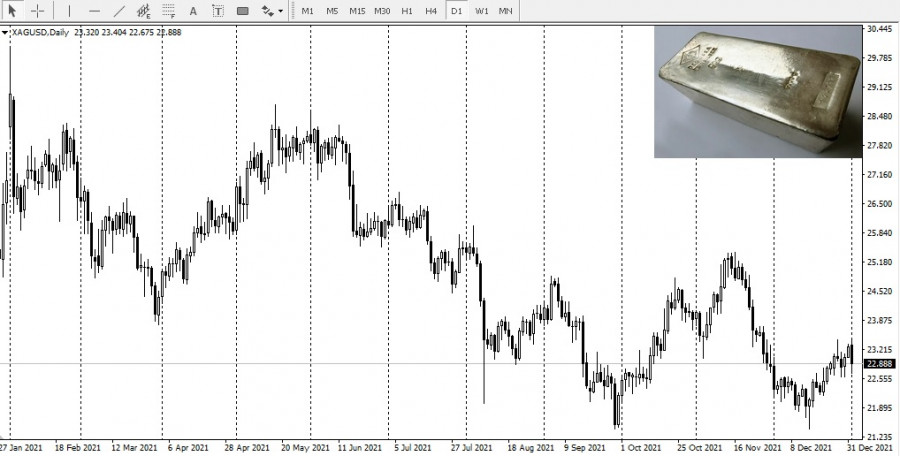
As for silver, its prices fell more than 9% in 2021.
Silver outperformed gold in the second half of the year as prices did not reflect rising industrial demand. Production volume has recovered from the pandemic lows of 2020. However, the Silver Institute predicts that there will be a supply shortage in 2022. Such bullish dynamics of supply and demand will result in some large upward price movements at some point. Now, the prices are good for investors in silver. Platinum is also attractive for investment. The platinum market has fallen by about 10% in a year.
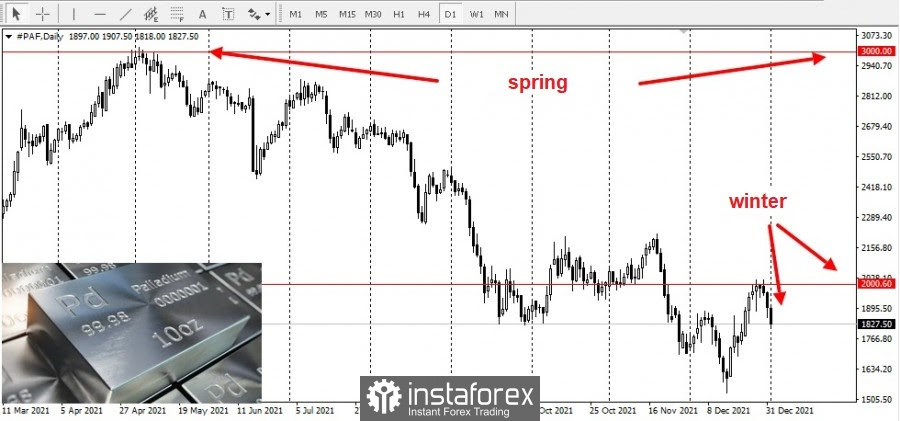
Finally, palladium suffered the biggest drawdown in the past year. It closed at just under $ 2,000 an ounce before the New Year after rising to a new all-time high of $ 3,000 in the spring. It was significantly below the lows a few weeks ago.
Despite the fact that inflation reached a multi-year high in 2021, Wall Street considered metals to be outcasts. The S&P 500 index is breaking new records after a new one, reducing gold's attractiveness.
Stocks thrive on optimism, while gold tends to increase pessimism. Apparently, investors believe that the economy will continue to recover, instead of entering a stagflation period. However, the so-called recovery is an illusion in many ways. Stagnation and inflation are prime economic realities for the millions of Americans who do not participate in Fed-fueled bull markets. In addition to rising inventories, the housing market rose by almost 20% in 2021. This is great news for homeowners and terrible news for anyone trying to save on a down payment. Their cost of living exceeds their earnings, but their economic woes are not fully reflected in the Consumer Price Index, which does consider actual house prices and uses various other statistical tricks to keep inflation low. However, the CPI rose to its highest level (6.8%) last year since 1982. Average hourly wages for the year increased by 4.8%. This represents a 2% loss in purchasing power when measured by the CPI. For ordinary Americans, the Fed's policy has contributed to an increase in the cost of living. They steadily reduce the value of savings held in bank accounts or invested in bonds. The decline in the purchasing power of the currency is not a temporary phenomenon. This is a constant feature of the monetary system. Precious metals have had a bad year. Nevertheless, the centuries-old track record of gold and silver in maintaining purchasing power is unmatched. Their record of price increases over the past two decades alone suggests that metals have the potential to recover and improve in the coming years, especially if stagflation becomes the dominant economic theme starting in 2022. The material has been provided by InstaForex Company - www.instaforex.com |
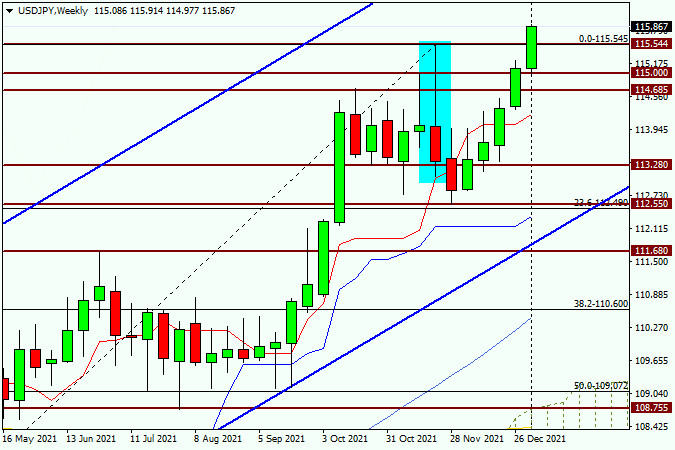
| Technical analysis and recommendations for USD/JPY on January 4, 2022 Posted: 04 Jan 2022 02:24 AM PST Taking advantage of the recent closure of monthly and weekly trading, today, we will conduct a technical analysis on another very interesting main dollar/yen currency pair. The main feature of this trading instrument can be considered the fact that both the Japanese yen and the US dollar, depending on the situation and market sentiment, act as protective assets. They are safe-haven currencies. So, let's start debriefing from the oldest time interval. Monthly
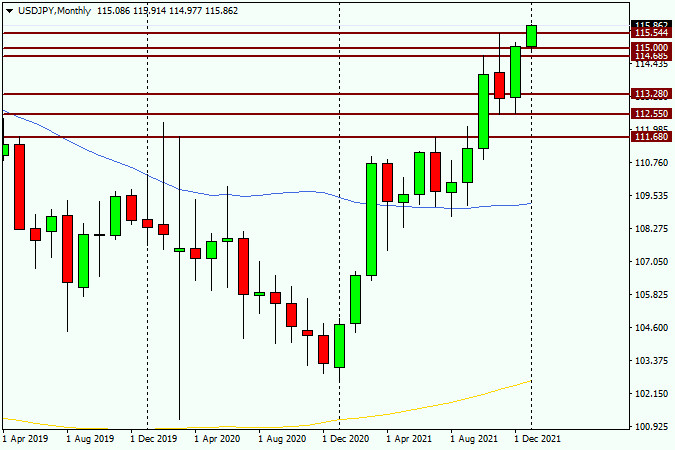
The USD/JPY currency pair completed the last month of the past 2021 with a confident and fairly strong growth. However, the bulls did not have enough time or strength to break through the key resistance level of 115.54 at that time. Nevertheless, the bullish mood of this trading instrument was confirmed already on the first trading day of the new year. At the time of writing this article, the pair is already trading above the sellers' resistance of 115.54, near the level of 115.85. In my personal opinion, this factor should be perceived as the willingness and ability of players to increase the rate and further move the quote up. Thus, at this stage of time, the bullish trend for USD/JPY is not completed and has every chance of being continued. On the other hand, the January auction has just started, and there is still a lot of time for the situation to change. We will observe, but so far there is a fairly strong bullish mood on the most senior timeframe. Weekly
On the weekly chart, in favor of continuing the bullish scenario, it was possible to perceive the fact of closing the last candle of last year above the most important historical psychological and technical level of 115.00. And indeed, the start of trading of the current five-day period so far confirms the bullish intentions of the market for USD/JPY. Nevertheless, despite this, I would refrain from unambiguous and conclusions for the time being. I think that a lot will depend on what data on the US labor market will be released on January 7. Let me remind you that this most important indicator will crown the current weekly trading, and can make significant adjustments to the price dynamics of the dollar/yen currency pair. In the meantime, at this stage of time, preference should be given to continuing growth and opening deals on the current bullish trend. If the breakdown of the resistance level of 115.54 turns out to be true, and the quote is fixed above this level, on a rollback to it, I recommend looking for options for opening long positions, the nearest goal of which we will consider another landmark level of 116.00. With a high degree of probability, this week we will return to the consideration of this currency pair, analyze smaller time intervals, where we will try to find more accurate prices for opening positions. And at this point, USD/JPY bulls are steering. The material has been provided by InstaForex Company - www.instaforex.com |
| Daily Video Analysis: ETHUSD, D1 Strong Selling Opportunity On Channel Breakout Posted: 04 Jan 2022 02:15 AM PST Today we take a look at ETHUSD. Combining advanced technical analysis methods such as Fibonacci confluence, correlation, market structure, oscillators and demand/supply zones, we identify high probability trading setups. The material has been provided by InstaForex Company - www.instaforex.com |
| Trading plan for Bitcoin for January 04, 2022 Posted: 04 Jan 2022 02:06 AM PST
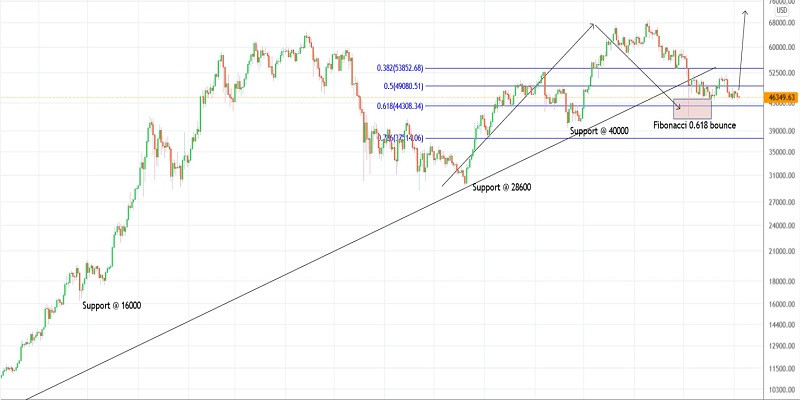
Technical outlook:Bitcoin continues to drift sideways within its December 2021 range between $45,500 and $52,000 levels. The crypto dropped through its support ($45,700) yet again on Monday and bounced off. It is trading back above $46,300 at this pint in writing and is expected to push through immediate resistance around $48,000 mark. That would open the door for the next interim resistance around $52,000. Bitcoin has spent the last four weeks within a triangle consolidation. The recent drop could be its final leg before termination and a break above $48,000 from here will confirm. On the flip side, if prices drop below $43,200 and subsequently $40,000 mark, it could test $28,600 support before pulling back higher again. At the moment, bias remains on the bullish outcome. Bitcoin had earlier dropped through $28,600 mark carving a meaningful support. The subsequent rally between $28,600 and $67,000 also got retraced to fibonacci 0.618 levels around $42,300 as shown on the chart here. High probability remains for a rally to resume higher towards $69,000 and higher from here. Trading plan:Potential rally through $70,000 against $40,000 Good luck! The material has been provided by InstaForex Company - www.instaforex.com |
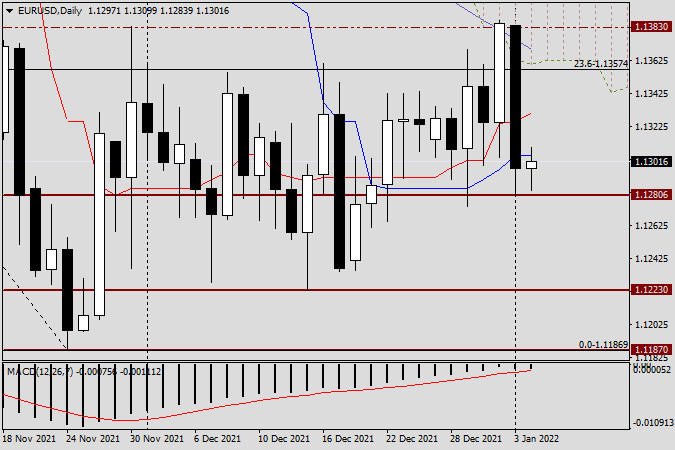
| EUR/USD analysis and forecast for January 4, 2022 Posted: 04 Jan 2022 02:05 AM PST Yesterday's trading on the main currency pair of the Forex market both began and ended with a decline, contrary to preliminary forecasts of a likely increase after pullbacks down. Well, in more detail, as promised yesterday, we will analyze smaller time intervals. However, for now, let's briefly talk about today's macroeconomic events. First of all, I would like to draw your attention again that the fundamental component is not always taken into account and recouped by the market. As another typical example of this factor, yesterday's data from the United States on the index of business activity in the manufacturing sector and construction costs can be cited. It is noteworthy that both indicators came out in the red zone, that is, worse than the forecast values. However, this did not prevent the US dollar from noticeably strengthening its position against the single European currency. Retail sales data in Germany have already been published today, both seasonally adjusted and without taking into account those. Both indicators exceeded economists' expectations and turned out to be stronger than forecasts. Nevertheless, at this stage of time, it did not bring the European currency much-needed and significant support. And this is another example when the "foundation" is not completely and far from always taken into account by the market. Later, at 15:00 London time, data from the States on the level of vacancies and labor turnover will be released, and the production index of the Institute of Supply Management (ISM) will also be published. I can't say that these are very important indicators, but they can't be attributed to being too weak either. Let's see if they will have an impact on the price dynamics of EUR/USD, but for now we turn to the technical picture. Daily
As already noted at the beginning of this article, on the first trading day of the new year, the pair showed a fairly strong bearish dynamic. Of course, you can always find some explanation for any price movement, whether it's the notorious COVID-19 strain called "Omicron" or a change in the yield of US treasuries, or some other supposedly significant reason. In my personal opinion, the main factor in yesterday's strengthening of the US dollar against the euro was (as most often happens) the technical component. And on the daily chart, at least three obstacles are clearly visible, which did not let the pair go higher and turned it in a southerly direction. First, this is the resistance level of 1.1383, over which the euro bulls failed to consolidate trading, which once again underlines the strength of this resistance of sellers. Second, the 50 simple moving average and the lower boundary of the daily cloud of the Ichimoku indicator played their role as resistance. Another bearish positive moment was the closing of yesterday's trading below the red Tenkan line and the blue Kijun line of the Ichimoku indicator, which had previously, and more than once, provided EUR/USD with strong support. So, as a result of yesterday's not weak decline, the pair ended trading below the most important technical level of 1.1300. At the end of this article, the euro/dollar is trying to adjust to yesterday's decline and is strengthening slightly. If today's session closes above the Kijun and Tenkan lines, their breakdown can be considered false and prepare for another test for the breakdown of a strong resistance zone of 1.1383/85. Task No. 1 for players to lower the exchange rate will be to update yesterday's lows at 1.1280 and close trading under this support level, if this condition is met, the road will open for the euro/dollar to the levels of 1.1230, 1.1200 and, possibly, to the key support level of 1.1187. H1
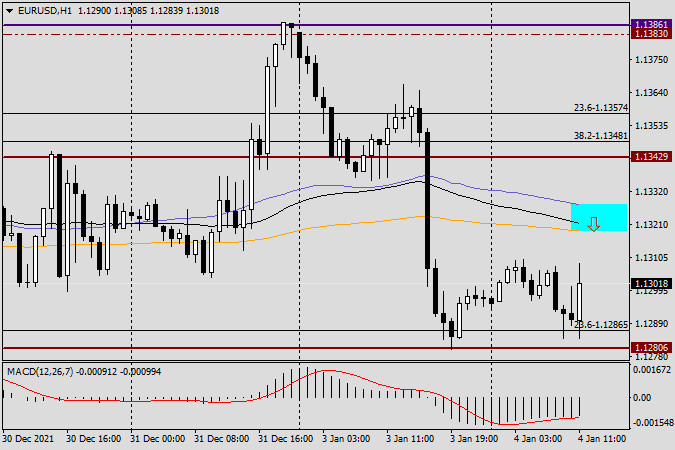
On the hourly chart, at the very end of the article, we observe a very active and quite strong growth. Most likely, the pair will rise to the moving averages used and broken the day before, which are in the circled zone 1.1319-1.1327. If a candle or a combination of bearish reversal candles appears in the selected zone on this or four-hour charts, it can be perceived as a signal to open sales. Given yesterday's strong decline and the closing of trading under the most important mark of 1.1300, in the current situation with purchases, it is better to wait and see how today's trading ends. I fully admit that taking into account the closing of today's session and the formed daily candle, we can get answers to our questions about the further direction of the quote. So far, somehow. The material has been provided by InstaForex Company - www.instaforex.com |
| Daily stock market update. Omicron cases went down Posted: 04 Jan 2022 02:02 AM PST
S&P 500 US indices rallied on Monday, with Dow gaining 0.7%, NASDAQ rising 1.2% and S&P 500 increasing by 0.6%. Asian markets, on the other hand, showed multidirectional dynamics this morning. Japan indices climbed 1.8%, while China indices fell 0.5%. As for oil, it remained near December highs, with Brent trading at $ 79. However, the gas crisis in Europe continues, and there was no update on supplies from Gazprom. With regards to the coronavirus, the total number of new cases all over the world hit 1.35 million. 460,000 of it came from the United States. Fortunately, the severity and mortality of omicron is much lower than that of the delta strain. Going back to the US market, the S&P 500 closed at 4.796 points, with a range of 4.760 - 4.820 points. Reportedly, Tesla's capitalization exceeded $ 300 billion, thanks to a strong sales report. Tesla stocks rose $ 143 to $ 1,200 yesterday. At the same time, Apple hit $ 3 trillion, the first American company to reach that level. But by the end of the day its stocks declined, and capitalization fell slightly below 3 trillion. On a different note, US President Biden was forced to personally tackle meat prices. He decided to impose stricter rules on meat wholesale campaigns, as inflation in the United States hurts consumers. Both farmers and consumers blame wholesalers for inflating the cost of meat. An important report will be released today, that is, the ISM industrial index, which is expected to fall to 60%. Talking about dollar, there was a slight rally yesterday, so USDX hit 96.20 points, with a range of 95.90 - 96.50. The upcoming Fed minutes will decide the direction of the currency. Accordingly, USD/CAD traded at 1.2730, with a range of 1.2650 - 1.2850. The pair will move depending on the news in both dollar and oil. Conclusion: Although the US market is up again, it is overheated, which means a correction is necessary. Purchases are obviously not profitable at the moment. The material has been provided by InstaForex Company - www.instaforex.com |
| Trading plan for EURUSD for January 04, 2022 Posted: 04 Jan 2022 01:42 AM PST
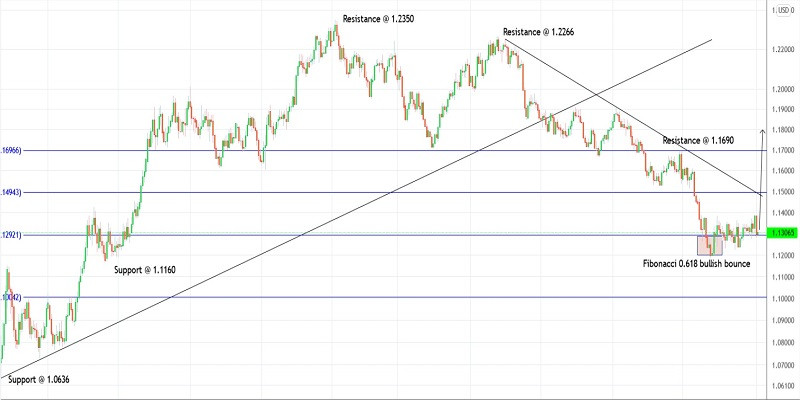
Technical outlook:EURUSD found support around 1.1280 level on Monday. The single currency pair dropped below 1.1300 levels hitting a Fibonacci 0.618 support of the recent upswing between 1.1222 and 1.1386 levels respectively (not shown on the daily chart here). The structure remains constructive for bulls against 1.1222 mark. A break above 1.1386 will accelerate further through 1.1500 and 1.1700 levels. EURUSD had earlier carved an upswing between 1.1186 and 1.1383 levels. After drifting sideways for the entire month of December 2021, the currency carved a higher low around 1.1235. Until prices remain above .1235 and 1.1222 levels, expect bulls to stay in control. Immediate interim resistance is seen around 1.1386, followed by 1.1690, while support is strong at 1.1186 levels respectively. The larger wave structure also remains constructive for bulls as discussed earlier. EURUSD has carved a meaningful upswing between 1.0636 and 1.2350 levels, which has been retraced to fibonacci 0.618 level just below 1.1200 levels. If the above holds well, the single currency pair is expected to produce a strong rally from current levels leading up to 1.2350. Trading plan:Potential rally through 1.1500 and 1.1700 against 1.1150 Good luck! The material has been provided by InstaForex Company - www.instaforex.com |
| New year, same dilemma: which to choose between gold or stocks? Posted: 04 Jan 2022 01:20 AM PST
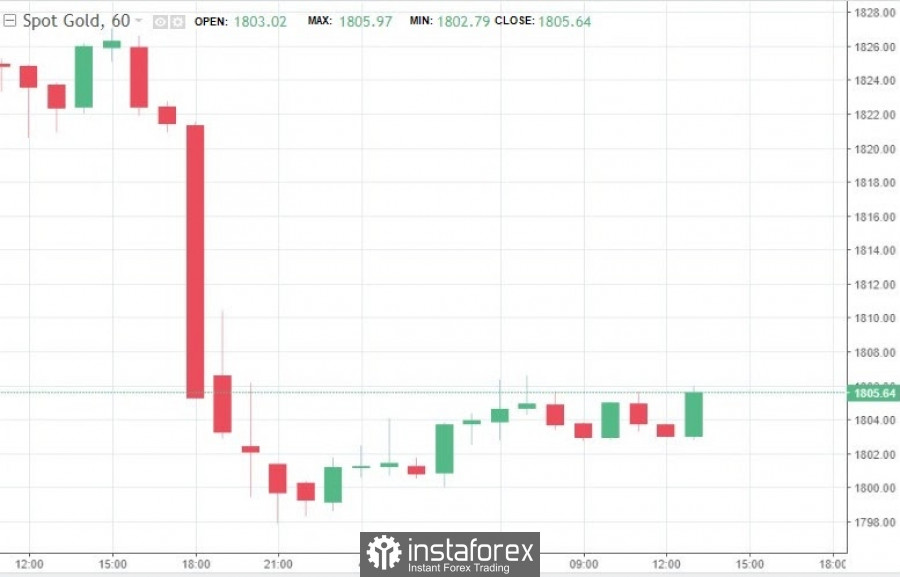
The beginning of the new year brought losses to the precious metal. Traders turned away from it, disappointed with how the year 2021 ended in the gold market. As a result, gold declined by 3.6%. Last week, gold rose by 0.9%, which led to a monthly increase of almost 3% and a quarterly increase of about 4%. However, the yellow asset ended the year with losses. It showed the sharpest annual drop in 6 years. It plunged by 3.6%, while it fell by more than 10% in 2015. The results of 2021 disappointed investors. On Monday, the gold market was dominated by a bearish mood. During trading, the precious metal fell 1.6%, or $ 28.50, and fell to a 2-week low of $ 1,800.10.
The fading fears about a new strain of coronavirus were also a strong negative factor for gold. The low mortality rate and hospitalization of patients with Omicron give hope that COVID-19 will not paralyze the world economy in the coming year. On the wave of optimism about the prospects for global economic growth in 2022, the US stock market was in an optimistic state on Monday. The main US indices rose – Dow Jones Industrial Average increased by 0.68%, and the S&P 500 also did so by 0.64%. A good start to the year for the US dollar also contributed to the rise of indicators. The US currency strengthened by 0.3% due to the significant dynamics of the yield of 10-year US bonds, which reached the highest level yesterday since November. Most likely, the US dollar and yields will continue their upward movement this week. They will be supported by the monthly report of the US Department of Labor for December. Economists expect an increase in hourly wages by 0.4% compared to November when the indicator rose by 0.3%. The number of jobs in the non-agricultural sector of the country is also forecasted to rise by 400 thousand. This is almost twice the value recorded in the previous month. According to strategist Chintan Karnani, it is imperative for gold to trade above the 200-day moving average of $ 1,806.40 right now in order to remain in the short-term bullish zone. Otherwise, we will see a sharper increase in market sales. Meanwhile, most traders are cautiously optimistic about the future prospects of gold, despite the fact that historically, January is considered a seasonally favorable period for the yellow asset. At this stage, investors prefer more risky financial instruments to the precious metal, i.e. stocks. However, experts warn that this year will be difficult for the stock market. It is threatened by rising inflation, continued soft monetary policy by central banks, and a coronavirus that will not go away in the next 12 months. Against this background, gold will feel as comfortable as possible. At the same time, geopolitical problems will help gold, which will become even more acute in 2022, analyst Jim Wyckoff believes. A bubble in the Chinese real estate market, which may burst, will facilitate this. The material has been provided by InstaForex Company - www.instaforex.com |
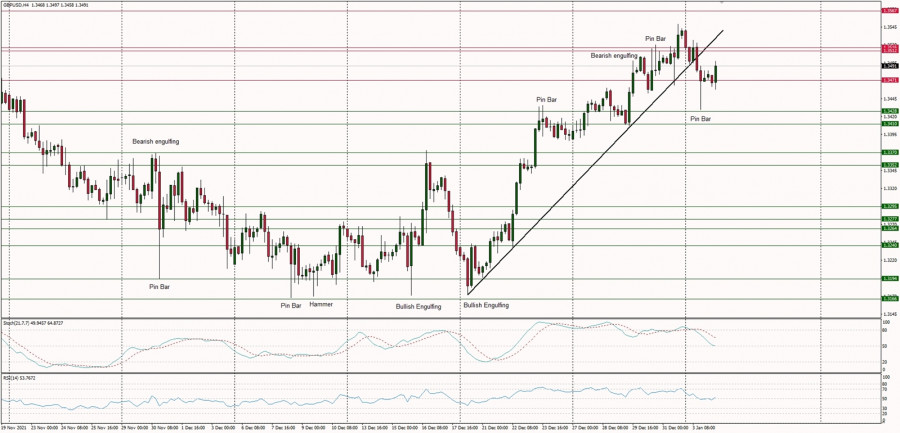
| Technical Analysis of GBP/USD for January 4, 2022 Posted: 04 Jan 2022 01:06 AM PST Technical Market Outlook The GBP/USD pair has broken above the Novembers high located at the level of 1.3516 and made a new swing high at the level of 1.3549. The immediate technical supports, seen at the level of 1.3471 and 1.3428, were broken and the market pulled-back towards the level of 1.3428, which means the short-term trend line support had been violated as well. The strong and positive momentum support the short-term bullish outlook for GBP, however, the market conditions are now extremely overbought on the H4 time frame chart, so a pull-back towards the level of 1.3410 is welcome. Weekly Pivot Points: WR3 - 1.3774 WR2 - 1.3658 WR1 - 1.3620 Weekly Pivot - 1.3485 WS1 - 1.3451 WS2 - 1.3393 WS3 - 1.3287 Trading Outlook: Despite the recent breakout above the level of 1.3514, the GBP/USD is still in the down trend as the 61% Fibonacci retracement of the last wave down hasn't been event tested yet. The market is in the down trend with a long-term target located at 1.2668 ( September 2020 lows) as long as the level of 1.3579 is not clearly broken.
|
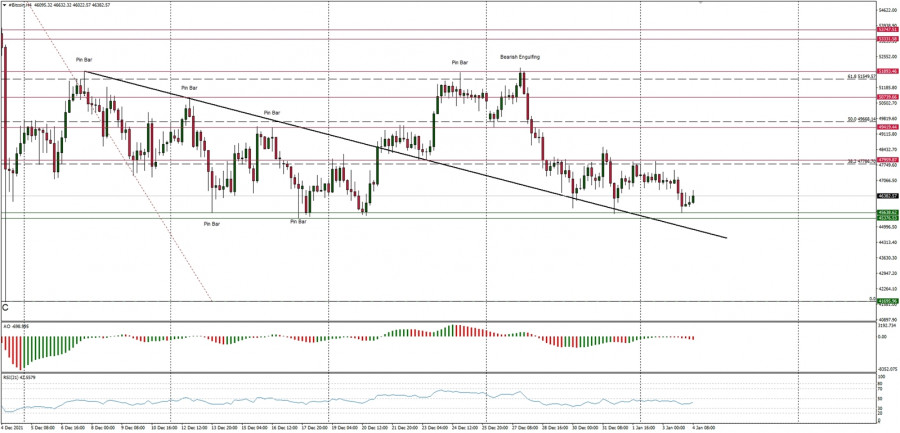
| Technical Analysis of BTC/USD for January 4, 2022 Posted: 04 Jan 2022 01:03 AM PST Crypto Industry News: Bitcoin, the world's most valued cryptocurrency, has replaced gold as a hedge against inflation for young investors, according to a Wharton School finance professor. The gold performance in 2021 was "disappointing," Wharton School finance professor Jeremy Siegel said in a televised interview. On the other hand, BTC is increasingly emerging as a hedge against inflation among younger investors, argued Siegel: "Let's face it, I think Bitcoin has replaced gold as a hedge against inflation in the minds of many younger investors. Digital coins are the new millennial gold. I think the history of gold is that the younger generation is treating Bitcoin as a substitute." Siegel also recalled that older generations witnessed gold soaring during inflation in the 1970s. "This time is not favorable," he added. Gold, which has traditionally emerged as an asset class to provide hedge against inflation, fell short of investor expectations in 2021, posting its worst year since 2015 and falling around 5% to close the year at $ 1,800. Despite huge price fluctuations during 2021, BTC grew by around 70% by the end of 2021. Technical Market Outlook The BTC/USD pair has bounced after a successful test of the trend line support around the level of $45,638, nevertheless, the bounce was very short-lived. The intraday technical resistance is seen at the level of $47,595, but the key short-term technical resistance is located at the level of $51,913 (Pin Bar high) and $53,333. Despite the recent complex and time consuming corrective decline in form of ABCxABCxABC pattern, the larger time frame trend remains up and only a clear and sustained breakout below the wave C low at $41,678 would change the outlook to bearish again. Weekly Pivot Points: WR3 - $56,509 WR2 - $54,179 WR1 - $49,960 Weekly Pivot - $47,650 WS1 - $43,745 WS2 - $41,329 WS3 - $36,987 Trading Outlook: The ABCxABCxABC complex corrective cycle might be terminated at the level of $41,678 and the market is ready to continue the up trend, however the timing is not great at all as the volatility is low at the beginning of the 2022. According to the long-term charts the bulls are still in control of the Bitcoin market and the next long term target for Bitcoin is seen at the level of $70,000. This scenario is valid as long as the level of $39,474 is clearly broken on the daily time frame chart (daily candle close below $39,000 would be considered as a long-term trend change due to the lower low placement).
|
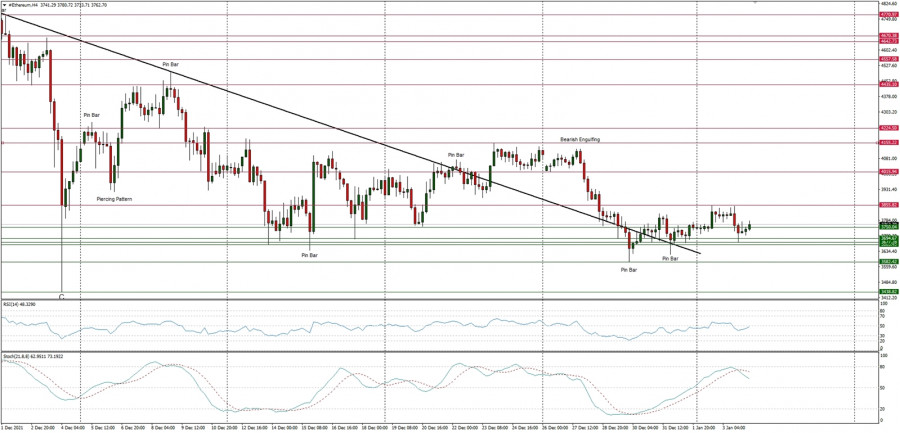
| Technical Analysis of ETH/USD for January 4, 2022 Posted: 04 Jan 2022 12:59 AM PST Crypto Industry News: Marshall Mathers III, better known as Eminem, has joined the "Bored Ape Yacht Club" (BAYC) by purchasing one of the NFT Bored Apes tokens for $ 462,000 on the NFT OpenSea marketplace. Eminem's Bored Ape presents a gold chain necklace and a khaki military hat that he wears in real life and which have been officially added to his portfolio by OpenSea. The NFT "EminApe" was created by GeeGazza in collaboration with Bored Ape. The transaction was finalized by the digital agency Six, which previously collaborated with other celebrities from the NFT sector, including Wu-Tang Clan, Tycho and Galantis. This is not the first time that Eminem has invested in an NFT. The Missouri-born rapper currently owns several NFT OpenSea called "Shady Holdings." Eminem's portfolio also includes several NFT "Lil Baby Doodles X". The NFT market is gaining popularity every day. Many celebrities have expressed an interest in the NFT and have already revealed their own designs. A $ AP Rocky, Snoop Dogg, Kings of Leon and The White Stripes are among the musicians who have already embraced the NFT movement. Technical Market Outlook: The ETH/USD bounce had been capped at the level of $3,855 and the market reversed back lower. Ethereum is currently trading close to the technical support seen at the level of $3,694 and the next target for bears is seen at the level of $3,438 and this is the key long-term technical support for bulls, so please keep an eye on price behavior around this level. Only a sustained breakout above the level of $3,855 would change to short-term outlook for bullish. Weekly Pivot Points: WR3 - $4,616 WR2 - $4,372 WR1 - $4,083 Weekly Pivot - $3,832 WS1 - $3,531 WS2 - $3,288 WS3 - $2,987 Trading Outlook: The WXYXZ complex corrective cycle might soon be terminated, so the next long-term target for ETH is seen at the level of $5,000. Nevertheless, in order to continue the long-term up trend, the price can not close below the technical support at the level of $2,906. The level of $1,728 (61% Fibonacci retracement of the last big impulsive wave up) is still the key long-term technical support for bulls. The level of $3,677 is the key mid-term technical support for bulls.
|
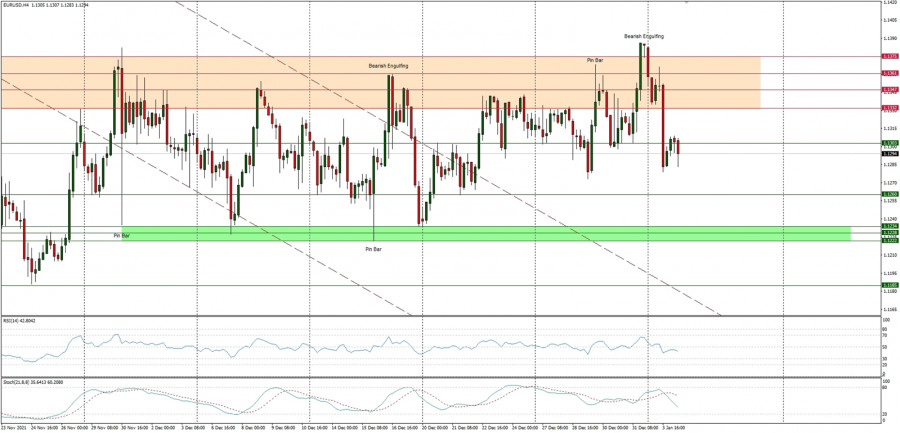
| Technical Analysis of EUR/USD for January 4, 2022 Posted: 04 Jan 2022 12:53 AM PST Technical Market Outlook The EUR/USD pair has come back inside the trading zone located between the levels of 1.1303 - 1.1332. Only a sustained breakout above the 1.1332 - 1.1375 would have change the outlook to more bullish in the nearest future. The momentum remains neutral to negative, so the sustained breakout above the zone is still on table, however, due to the low liquidity levels the volatility is high and the market keeps making whipsaw moves. On the other hand, the next target for bears is seen at the level of 1.1228 - 1.1222, but the game changing level is the technical support seen at 1.1185. Traders await the meaningful breakout in either direction. Weekly Pivot Points: WR3 - 1.1548 WR2 - 1.1461 WR1 - 1.1437 Weekly Pivot - 1.3050 WS1 - 1.1319 WS2 - 1.1241 WS3 - 1.1214 Trading Outlook: The market is in control by bears that pushed the price way below the level of 1.1501 and 1.1360, which was the lowest level since November 2020. The next important long-term target for bears is seen at the level of 1.1166. The up trend can be continued towards the next long-term target located at the level of 1.2350 (high from 06.01.2021) only if bullish cycle scenario is confirmed by breakout above the level of 1.1909 and 1.2000.
|
| Forex forecast 01/04/2021 USD/JPY, GBP/JPY, USDX and Ethereum from Sebastian Seliga Posted: 04 Jan 2022 12:50 AM PST Let's take a look at the technical picture of USD/JPY, GBP/JPY, USDX and Ethereum. The material has been provided by InstaForex Company - www.instaforex.com |
| EUR/USD. Fed's minutes and Nonfarm data are in focus Posted: 04 Jan 2022 12:38 AM PST Buyers of the EUR/USD pair tried to leave the price range of 1.1260-1.1360 on the last day of 2021, so the price surged to the level of 1.1387. The last trading day of the week, month, and year was on the bullish side, as many traders took profits without risking leaving open positions over the weekend. As a result, the pair updated its one-and-a-half-month price high. However, the first trading day in 2022 put everything in its place. The pair collapsed by more than 100 points in just a few hours on Monday: the high of the day was consolidated at 1.1384, then the daily low was at 1.1280. In fact, have market participants returned to their original positions. The pair has been moving around the level of 1.1300 since the end of November 2021, moving away from this target by 30-60 points, then fluctuating up and down. Now, traders are waiting for a strong information driver that will be able to push the price out of this range.
There are two releases this week – the first release is the minutes of the Fed's last meeting, and the second one is the Nonfarm data. It should be noted that yesterday's downward trend of the EUR/USD pair was mainly due to the strengthening of the US currency. The US dollar index sharply rose following the Treasury yield. In particular, the yield on 10-year securities rose from 1.512% to 1.637% within a few hours, that is, to a multi-week high. The last time the indicator was at this level was on November 24. This factor provided key support to the US dollar amid an almost empty economic calendar. We believe that Treasury yields are growing due to the strengthening of hawkish expectations regarding the Fed's further actions. USD bulls have big plans for the current year: the stimulus program will end in the spring, after which the Fed will begin tightening the parameters of monetary policy. However, it is still unknown how aggressive the pace of tightening will be. Major releases of the coming days will tip the scales in one direction or another. In this case, the Fed's minutes will allow us to assess the general mood of the members of the US regulator, in the context of the latest statements by Jerome Powell. The rhetoric of the Fed chairman at the end of the last meeting was too cautious and hesitant. First, he said that the November US labor market data was disappointing. It can be recalled that the number of people employed in the non-agricultural sector in November increased by only 210 thousand against the expected growth of 530 thousand. So, Powell says the working-age population is "disappointing." Second, he said that the Fed has not yet developed a common position on the length of the pause (or the need for it in principle) between the end of QE and the first increase in interest rates. On the other hand, the point forecast, which was updated at the December meeting, allows for a double (and even triple) increase this year. The minutes of this meeting will answer an important question: are the Fed members ready for an aggressive pace of rate hikes? The text of the minutes may take a "hawkish" attitude, or, on the contrary, the cautious attitude of the Fed officials. In general, this document that will be published on Wednesday may become a starting point in terms of strengthening the US currency. Friday's release is also important. The latest US labor market data left more questions than answers. On the one hand, the number of employed in November increased by only 210 thousand, while the forecast for growth was 530 thousand. On the other hand, the US unemployment rate declined to 4.2%, while the share of the economically active population increased to 61.8%. Meanwhile, salaries came out "at the level". In particular, the level of the average hourly wages rose by 4.8% in annual terms. According to preliminary forecasts, December labor market data will support the US currency. In particular, the unemployment rate should fall to 4.1%. The average hourly wage should increase by 0.5% on a monthly basis and by 4.6% on an annual basis. If the salary figures come out in the "green zone", investors' inflation expectations will increase again. The growth of the oil market, problems in supply chains, and the growth of average wages are factors that will also help the inflationary spiral to persist. The capital indicator, reflecting the increase in the number of people employed in the non-agricultural sector, should also reach a "decent" level, reflecting the creation of 410 thousand jobs. Indicators should similarly demonstrate positive dynamics in manufacturing and in the private sector.
Therefore, EUR/USD bears may take the lead this week, leaving the multi-week range of 1.1260-1.1360. If the Fed's minutes do not disappoint USD bulls, and Nonfarm data come out at least at the forecasted levels, the US dollar will continue to gain momentum. Technically, the pair on the D1 timeframe is traded between the middle and lower lines of the Bollinger Bands indicator, as well as under all the lines of the Ichimoku indicator. Any more or less massive upward surge can be used as an excuse to open short positions. The first target is the lower line of the Bollinger Bands, which corresponds to the level of 1.1240. The main target is 1.1186, which is a one-and-a-half-year price low reached last November. The material has been provided by InstaForex Company - www.instaforex.com |
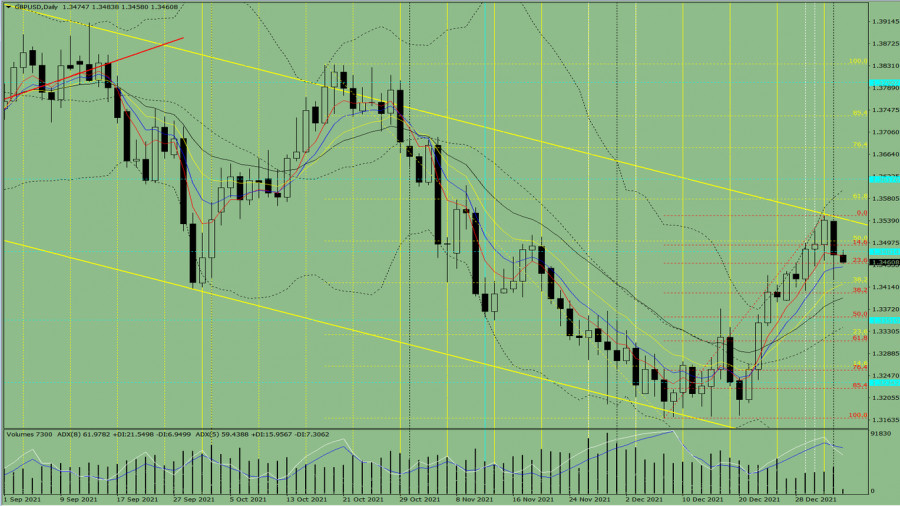
| Indicator analysis: Daily review of GBP/USD for January 4, 2021 Posted: 03 Jan 2022 11:49 PM PST Trend analysis (Fig. 1). The market may move down on Tuesday from the level of 1.3475 (closing of yesterday's daily candle) to the target level of 1.3403, the 38.2% retracement level (red dotted line). When testing this level, the price may move upward to the target level of 1.3501, the 50.0% retracement level (yellow dotted line).
Fig. 1 (daily chart) Comprehensive analysis: - Indicator analysis - down; - Fibonacci levels - down; - Volumes - down; - Candlestick analysis - down; - Trend analysis - down; - Bollinger lines - down; - Weekly chart - down. General conclusion: The price may move down from the level of 1.3475 (closing of yesterday's daily candle) to the target level of 1.3403, the 38.2% retracement level (red dotted line). When testing this level, the price may move upward to the target level of 1.3501, the 50.0% retracement level (yellow dotted line). Alternative scenario: from the level of 1.3475 (closing of yesterday's daily candle), the price may move down to the target level of 1.3430, the lower fractal (daily candle from 03/01/2022). When testing this level, the price may move upward. The material has been provided by InstaForex Company - www.instaforex.com |
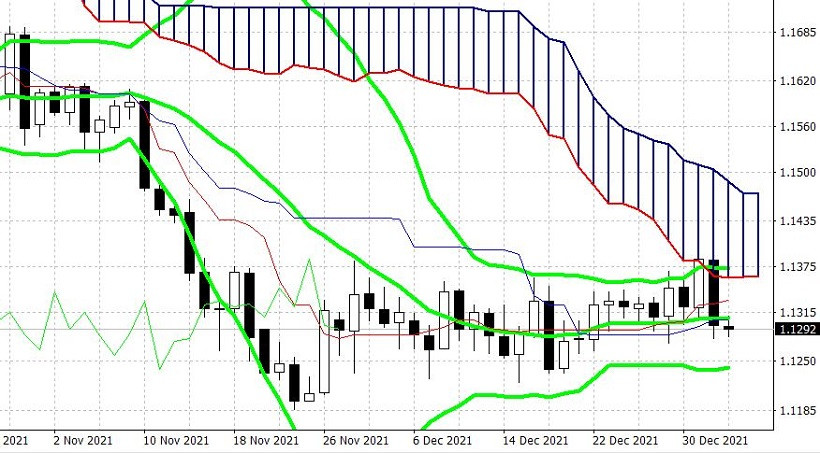
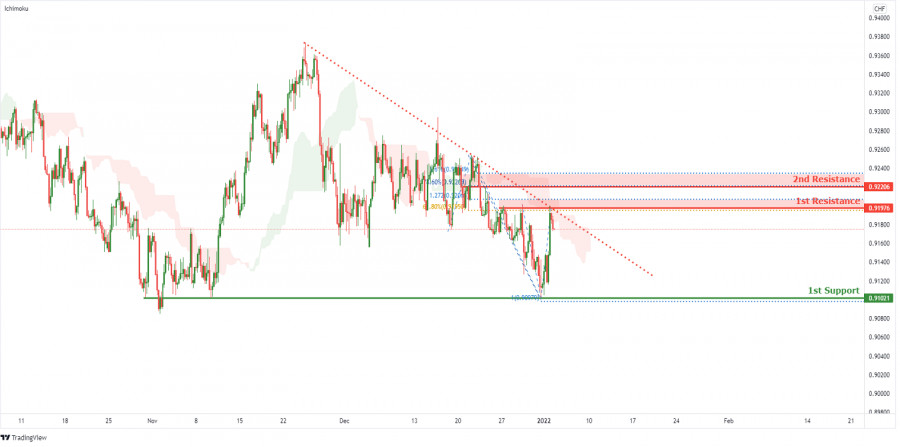
| USDCHF Potential Bearish Drop | 4th Jan 2022 Posted: 03 Jan 2022 11:47 PM PST
Price is abiding to the descending trendline resistance, signifying an overall bearish momentum. We can expect price to drop from the 1st Resistance level in line with 61.8% Fibonacci retracement and 127.2% Fibonacci projection towards 1st Support in line with 100% Fibonacci projection. Our bearish bias is further supported by the price holding below the Ichimoku Cloud. Trading Recommendation Entry: 0.91976 Reason for Entry: 61.8% Fibonacci retracement and 161.8% Fibonacci projection Take Profit: : 0.91021 Reason for Take Profit: 50% Fibonacci retracement Stop Loss: 0.92206 Reason for Stop Loss: 78.6% Fibonacci retracement The material has been provided by InstaForex Company - www.instaforex.com |


| You are subscribed to email updates from Forex analysis review. To stop receiving these emails, you may unsubscribe now. | Email delivery powered by Google |
| Google, 1600 Amphitheatre Parkway, Mountain View, CA 94043, United States | |


Comments