Forex analysis review
Forex analysis review |
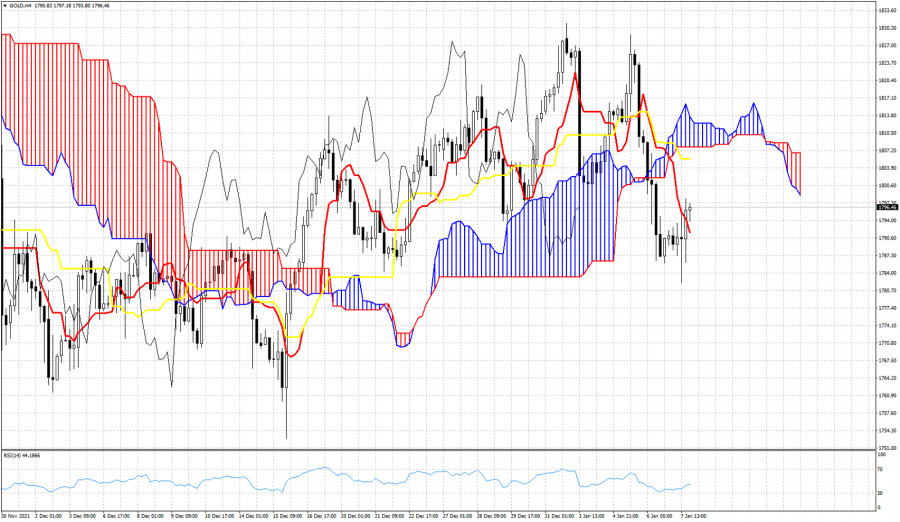
- Ichimoku cloud indicator analysis on Gold for January 7, 2022.
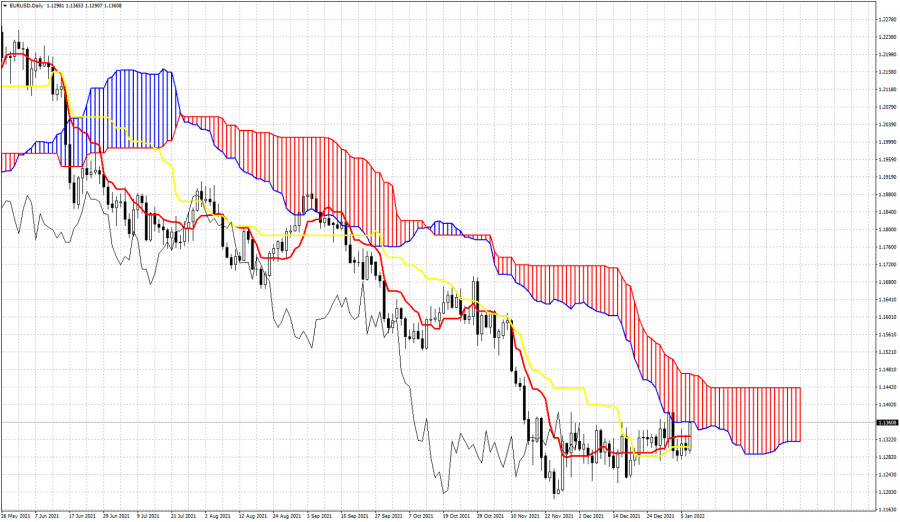
- Daily Ichimoku cloud indicator analysis on EURUSD for January 7, 2022.
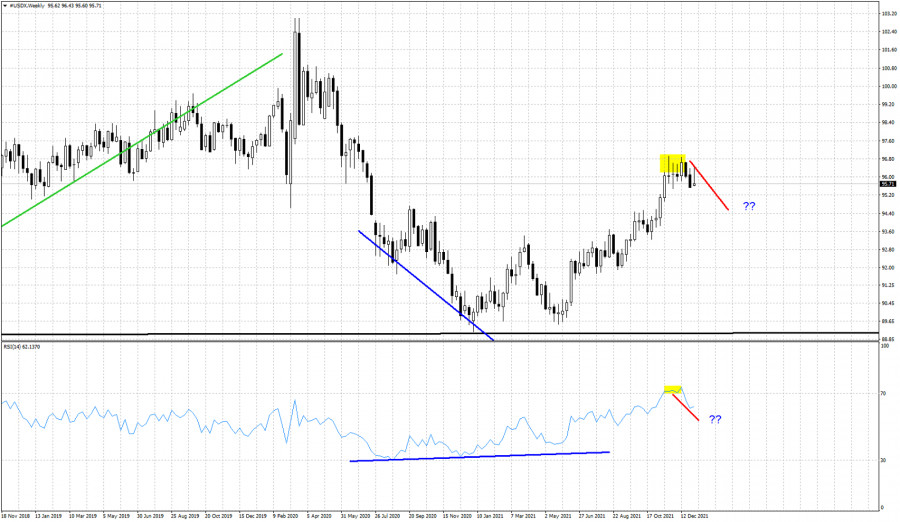
- The Dollar index forms a weekly bearish candlestick.
- Video market update for January 07,,2022
- EUR/USD: Record Growth of European Inflation, Contradictory Nonfarm Payrolls and ECB's Dovish Remarks
- January 7, 2021 : EUR/USD daily technical review and trading opportunities.
- January 7, 2021 : EUR/USD Intraday technical analysis and trading plan.
- January 7, 2021 : GBP/USD Intraday technical analysis and significant key-levels.
- Bitcoin is losing ground: BTC holders lost more than $50 billion in 4 days and are moving to the bond market
- Trading signals for Dow Jones 30 (#INDU) on January 07 - 10, 2022: sell below 36,418 points (21 SMA)
- Trading signals for GBP/USD on January 07 - 10, 2022: buy above 1.3533 (21 SMA)
- USD/CAD: U.S. and Canadian labor markets data
- Trading signals for Ethereum (ETH/USD) on January 07 - 10, 2022: buy above $3,125 (2/8)
- Bitcoin Drops To $41k Amid Rising Cryptocurrency Panic: Time To Buy?
- Bitcoin is rolling into the abyss: the cost of the first cryptocurrency collapsed to the lows of September
- USD/CAD analysis for January 07, 2022 - Inside day formation
- GBP/USD: the plan for the American session on January 7 (analysis of morning deals). Another signal to sell the pound from
- EUR/USD: the plan for the American session on January 7 (analysis of morning deals). Bears defend 1.1317 and form a sell
- BTC analysis for January 07,.2022 - First target reached and potential for another drop
- Analysis of Gold for January 07,.2022 - Watch for potential bigger downside breakout
- Technical analysis recommendations of EUR/USD and GBP/USD on January 7, 2021
- Fed's secrets
- Trading tips for Bitcoin
- Harry Dent: US stock market may collapse this year
- Stock market halts ahead of US non-farm report
| Ichimoku cloud indicator analysis on Gold for January 7, 2022. Posted: 07 Jan 2022 02:26 PM PST Gold price made a low today around $1,782 right on top of the horizontal support. The week ended at $1,795 having broken below the weekly Kumo (cloud). On a 4 hour basis trend remains bearish as price continues to trade below the Kumo (cloud).
|
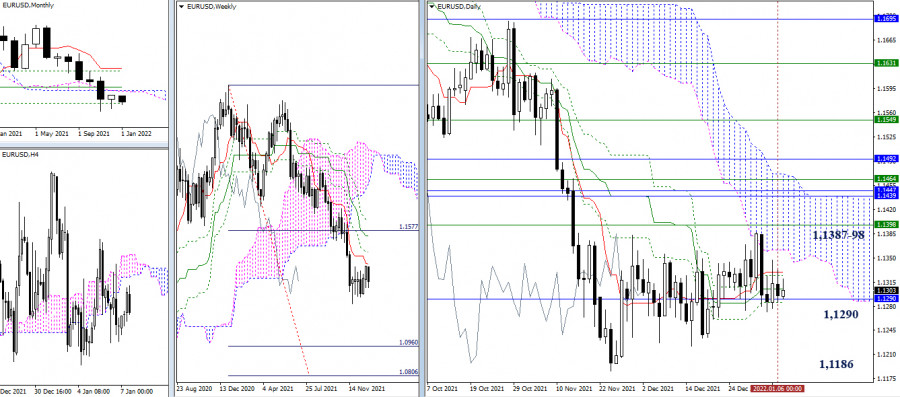
| Daily Ichimoku cloud indicator analysis on EURUSD for January 7, 2022. Posted: 07 Jan 2022 02:14 PM PST EURUSD is making higher highs in the short-term as price has moved above 1.1350 on Friday. Price remains below the key resistance of 1.1390-1.1415. EURUSD is still below the Daily Kumo (cloud) resistance. The week was closed right below the key resistance.
|
| The Dollar index forms a weekly bearish candlestick. Posted: 07 Jan 2022 02:06 PM PST Although the Dollar index closed this week higher than the previous one, price action was not very helpful to bulls. Price managed to make a higher high than last week, but the end of the week found the index closing near the weekly lows. This has lead to a bearish candlestick formation.
Blue lines- bullish divergence Red lines- Expected path In previous posts we noted that we expect the Dollar index to make a multi week pull back following the same pattern with 2017. This week's candlestick pattern formed a higher high but with a close near the weekly lows, has created a long upper shadow (tail). The inability from bulls to hold price near the weekly highs is a sign of weakness. The Rsi has broken below 70 providing us with the reversal we were expecting. The Dollar index is expected to continue lower as long as price is below 96.43. Breaking above this week's high, will increase chances of making a new higher high above 96.88. The material has been provided by InstaForex Company - www.instaforex.com |
| Video market update for January 07,,2022 Posted: 07 Jan 2022 11:18 AM PST Watch for breakout mode.... The material has been provided by InstaForex Company - www.instaforex.com |
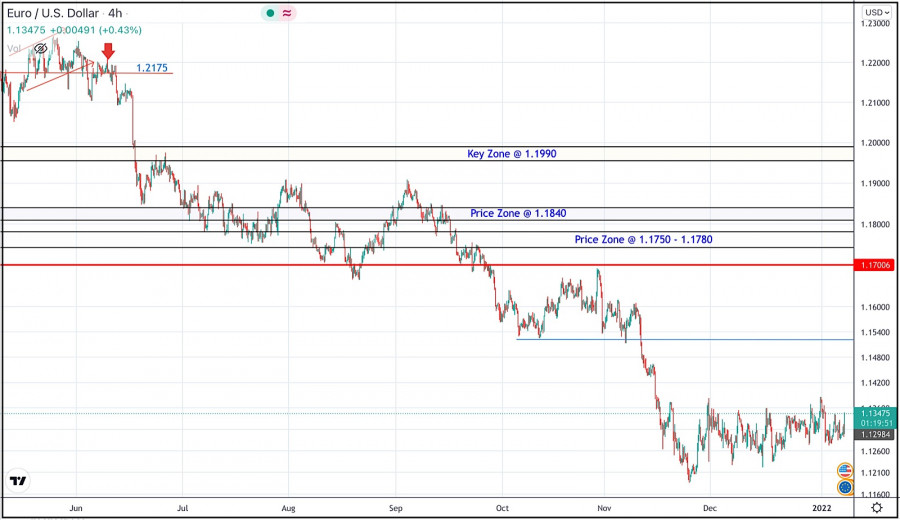
| Posted: 07 Jan 2022 09:26 AM PST Friday's releases left more questions than answers. The pair is still trading within the range of 1.1260-1.1360, despite the release of the most important macroeconomic reports.
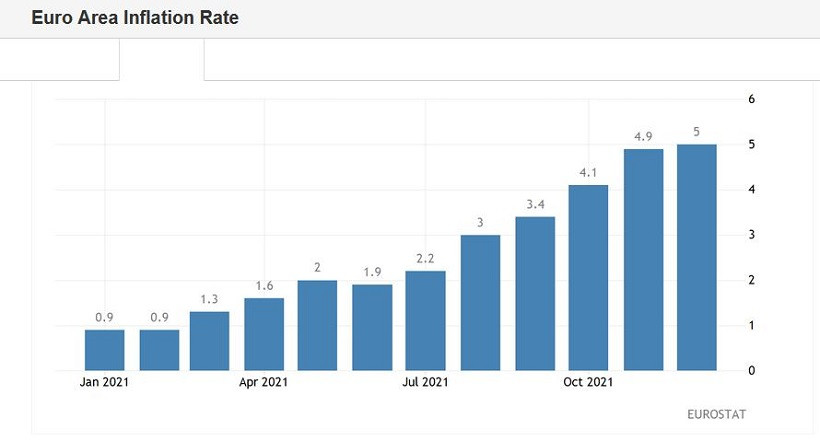
Buyers of EUR/USD were pleased with the European inflation. The consumer price index again found itself in the "green zone", and again distinguished itself with record growth. So, the overall CPI in December jerked up, reaching the level of 5.0%. This is a new historical record: the maximum value of the indicator in the entire history of observations (that is, since 1997). The result turned out to be higher than the forecasts of most experts: analysts polled by Reuters had expected it to come out at 4.7%. The pivot CPI (excluding volatile energy and food prices) also performed well, rising to 2.6%. Analyzing the structure of the release, we can conclude that energy prices have increased most in the eurozone countries. Last month they increased by 26% (year on year). Prices for food, alcohol and tobacco products increased by 3.2%, for industrial goods - by 2.9%, services - by 2.4%. In response to this publication, the EUR/USD pair updated the intraday high, but at the same time did not leave the above price range. Firstly, the market was ready for such results, especially after Thursday's data on the growth of German inflation. The consumer price index in Germany also showed a fairly strong growth - both in annual and monthly terms. Indicators also entered the green zone, signaling similar trends on a pan-European scale. The forecasts were justified. Second, as mentioned above, the rise in the CPI was mainly due to the rise in energy prices. Whereas most of the ECB representatives expect the stabilization of prices for energy and electricity in the eurozone in 2022. This was particularly announced at the end of December by ECB President Christine Lagarde. And although the head of the ECB noted that "a certain level of uncertainty" around this forecast remains, she at the same time, expressed confidence that the energy crisis will end in the first half of this year. Consequently, the indicators of European inflation will also turn down. A similar rhetoric was voiced the other day by Bank of France Governor Francois Villeroy de Galhau, as well as the chief economist of the ECB Philippe Lane. Lane said that the current surge in inflation is "part of a pandemic inflation cycle." At the same time, he once again repeated the "dovish" thesis. He said that in his opinion, the European Central Bank will not raise rates this year.
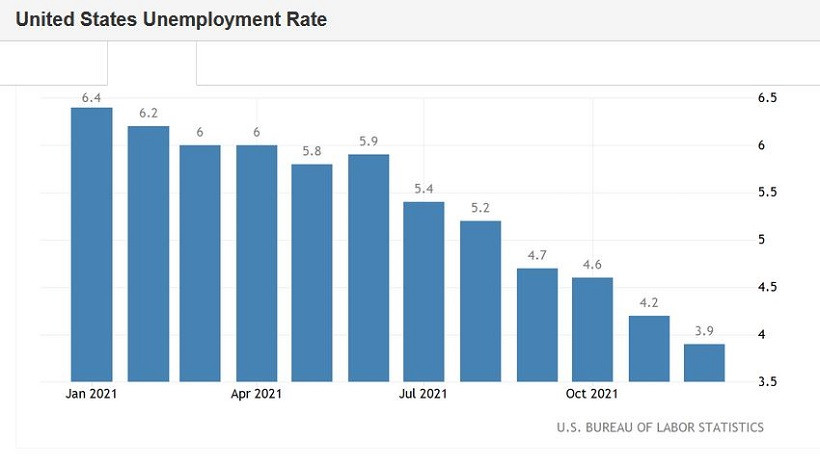
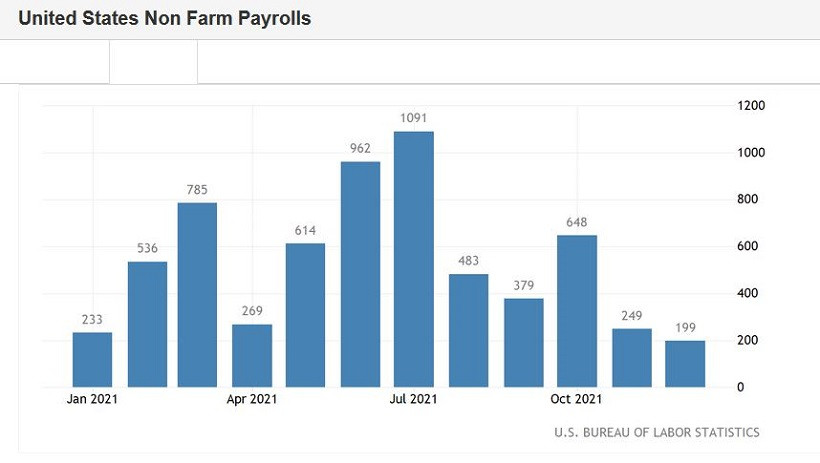
It is worth recalling that a month ago, the eurozone similarly surprised investors with a record rise in inflation (the previous record was at 4.9%), but the ECB members actually ignored this fact, demonstrating passive-wait-and-see behavior at the December meeting. Moreover, the regulator has "strengthened" the asset purchase program (APP), which will operate with an open end date. For this reason, EUR/USD buyers are in no hurry to "uncork the champagne" today. The single currency has noticeably strengthened its positions, but paired with the dollar, it is still trading in the range of 1.1260-1.1360. The data on the U.S. labor market did not help the EUR/USD bulls either, which left an extremely ambiguous impression. In general, the U.S. Nonfarm Payrolls report were able to surprise: as a rule, one of the components of a key release is knocked out of the general rut of forecast levels, demonstrating the ambiguity of the situation. But recent releases leave too many questions. On one side of the scale is a decrease in unemployment and an increase in the level of average wages. On the other side, there is a relatively weak increase in the number of people employed in the non-agricultural sector, in the manufacturing sector and in the private sector. This trend was observed a month ago, and the same trend was recorded Friday. Thus, the unemployment rate in the United States fell to 3.9% in December. This is the best result since March 2020. In April, unemployment rose to 4.4%, in May - to 13.5%. Before the coronavirus crisis, the indicator for several years (to be more precise, from November 2017 to March 2020) fluctuated in the range of 3.5%-4.1%. In other words, the key indicator has now de facto returned to the area of pre-crisis values. It is also worth noting that the unemployment rate has been consistently decreasing for 15 months. Dollar bulls and salaries were also pleased. The average hourly wage increased to 4.7% (in annual terms) and to 0.6% (on a monthly basis). Both components came out in the "green zone", exceeding the forecast values.
On the other side of the "coin" is a weak increase in the number of people employed in the non-agricultural sector. This figure increased by only 199k, while the forecast growth is up to 410k. In the private sector of the economy, 211k jobs were created (forecast - 365k), in the manufacturing sector 26k (forecast - 35k). Job growth rates were roughly in line with November, when 246k nonfarm jobs were created. At the same time, both in November and December, the unemployment rate was consistently decreasing.
Against the background of such contradictory Nonfarm Payrolls data and record growth of European inflation, the EUR/USD pair naturally moves to the upper border of the range of 1.1260-1.1360. But here two questions arise: will the buyers of the pair overcome the resistance level of 1.1360, and most importantly, will they be able to consolidate above this target? Recall that on the last trading day of last year, against the background of the general weakening of the dollar, traders were able to "pull" the pair to the level of 1.1387. However, this was the end of the upside campaign (barely starting). Buyers of EUR/USD did not dare to storm the 14th figure, and already on January 3, the bears seized the initiative. After all, if the representatives of the ECB, for the most part, retain their position, insisting on the temporary nature of the growth of inflation, and the Fed members focus their attention on unemployment (the level of which is steadily declining), buyers will again lose control over the EUR/USD pair. Thus, at the moment it is most advisable to take a wait-and-see attitude on the pair. A rise in price may be false, especially if the upside impulse begins to fade around the 1.1360 resistance level. Long positions are risky, short positions are not yet justified by anything. The material has been provided by InstaForex Company - www.instaforex.com |
| January 7, 2021 : EUR/USD daily technical review and trading opportunities. Posted: 07 Jan 2022 08:49 AM PST
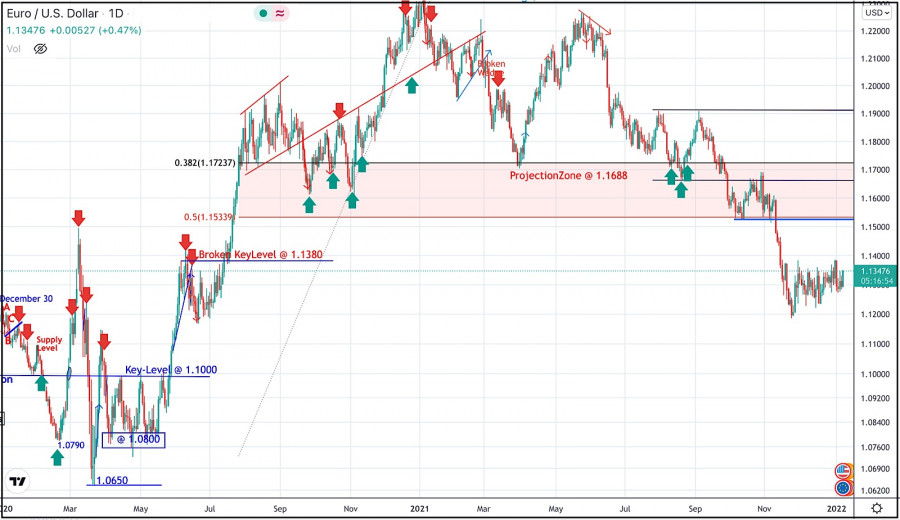
During the past few weeks, the EURUSD pair has been trapped within a consolidation range between the price levels of 1.1700 and 1.1900. In late September, Re-closure below the price level of 1.1700 has initiated another downside movement towards 1.1540. Price levels around 1.1700 managed to hold prices for a short period of time before another price decline towards 1.1200. Currently, the price zone around 1.1500 stands as a prominent supply-zone to be watched for SELLING pressure and a possible SELL Entry upon any upcoming ascending movement. Moreover, it is not advised to add new SELL Entries around the current price levels as the pair already looks oversold. The material has been provided by InstaForex Company - www.instaforex.com |
| January 7, 2021 : EUR/USD Intraday technical analysis and trading plan. Posted: 07 Jan 2022 08:48 AM PST
The bullish swing that originated around 1.1650 in August, failed to push higher than the price level of 1.1900. That's why, another bearish pullback towards 1.1650 was executed. However, extensive bearish decline has pushed the EURUSD pair towards 1.1600 and lower levels was reached. Shortly after, significant bullish recovery has originated upon testing the price level of 1.1570. The recent bullish pullback towards 1.1650-1.1680 was expected to offer bearish rejection and a valid SELL Entry. Significant bearish decline brought the EURUSD pair again towards 1.1550 levels which stood as an Intraday Support zone. Hence, sideway movement was demonstrated until quick bearish decline occurred towards 1.1200. Please note that any bullish movement above 1.1500 should be considered as an early exit signal to offset any SELL trades. The price levels around 1.1520 remain a reference zone that needs to be re-visited when the current bearish momentum ceases to dominate. The material has been provided by InstaForex Company - www.instaforex.com |
| January 7, 2021 : GBP/USD Intraday technical analysis and significant key-levels. Posted: 07 Jan 2022 08:47 AM PST
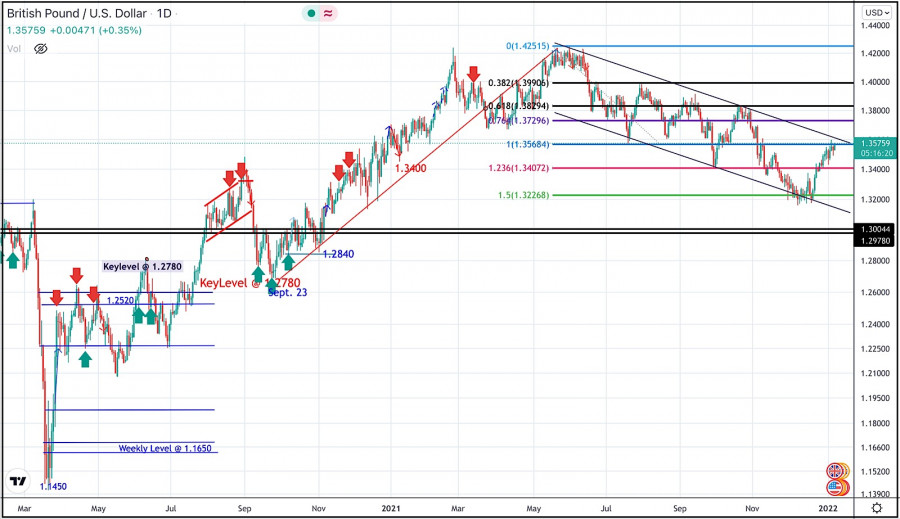
The GBPUSD pair has been moving sideways with some bearish tendency while bearish breakout below 1.3600 was needed to enhance further bearish decline. Bearish breakout below 1.3700 enabled quick bearish decline to occur towards 1.3400 which corresponded to 123% Fibonacci Level of the most recent bearish movement. This was a good entry level for a corrective bullish pullback towards 1.3650 and 1.3720 which was temporarily bypassed. Shortly after, the pair was testing the resistance zone around 1.3830 where bearish pressure originiated into the market. More bearish extension took place towards 1.3220 where the lower limit of the current movement channel came to meet with Fibonacci level. Conservative traders should have taken BUY trades around 1.3200 price levels as suggested in previous articles. Current BUYERS are looking towards 1.3570 and 1.3600 as the next target levels to have some profits off the trade. Moreover, the price level of 1.3570 stands as a key-resistance to be watched for bearish reversal if some bearish signs existed upon the current testing. The short-term outlook remains bullish as long as the pair maintains its movement within the depicted channel above 1.3400. The material has been provided by InstaForex Company - www.instaforex.com |
| Posted: 07 Jan 2022 08:47 AM PST
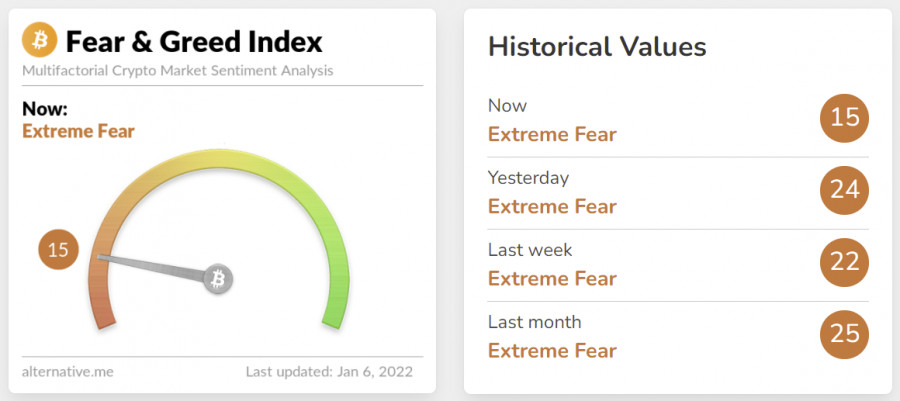
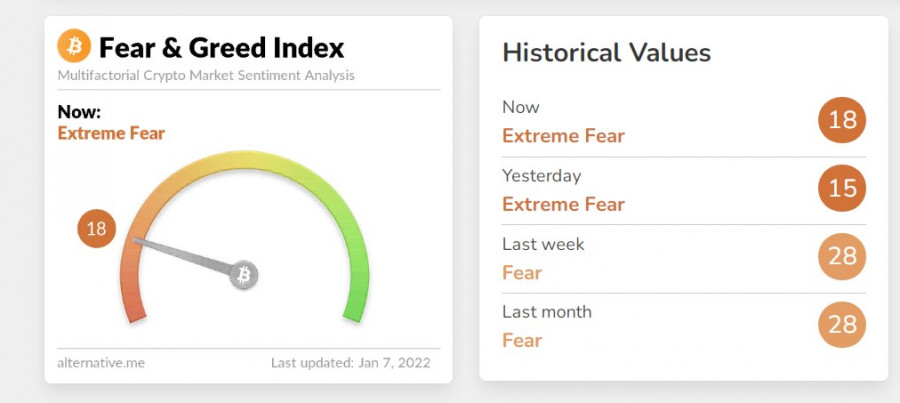
Bitcoin is losing ground and falling as low as $41,500. From Wednesday to Thursday, a record sale of bitcoin could be seen. The United States of America plans to reduce its fiat balance, and for this they will sell bonds. Bitcoin holders have lost over $50 billion in their wallets in 4 days. Market capitalization fell to $874 billion. The market is dominated by short positions, not long positions. The U.S. Federal Reserve has plans to reduce its bond holdings after this decision was made at its meeting in December. The U.S. government will continue to buy bonds as it plans to lower interest rates on bond purchases. In view of this massive bond buying, the Fed's hawkish policy, Bitcoin and other altcoins plunged sharply downward, and the year began with the complete dominance of bears in the crypto market. The selling price of bitcoin fell by more than 6%. Friday's $41,500 bitcoin price is an all-winter low. There is fear and panic on the market, speculators are trying to induce confusion in the crypto market and short. New investments in Bitcoin are not coming. Crypto investors are looking for a safe haven and are slowly leaving the crypto market or taking a wait and see attitude. The coefficient of fear and greed has fluctuated in the 15-18 percent range in recent days, which is a record high since July 2021.
Bitcoin holders are switching to bonds because they are confident that the U.S. government will provide them with better rates when buying bonds. On Thursday, the liquidation of their positions was carried out from the crypto market, where more than 200,000 traders carried out transactions worth more than $800 million. Only 6% of the total bitcoin circulation remains on crypto exchanges, the market is completely suppressed and the bear rally continues. This is not the start of the New Year that all analysts expected, but what is there is bound to happen. The material has been provided by InstaForex Company - www.instaforex.com |
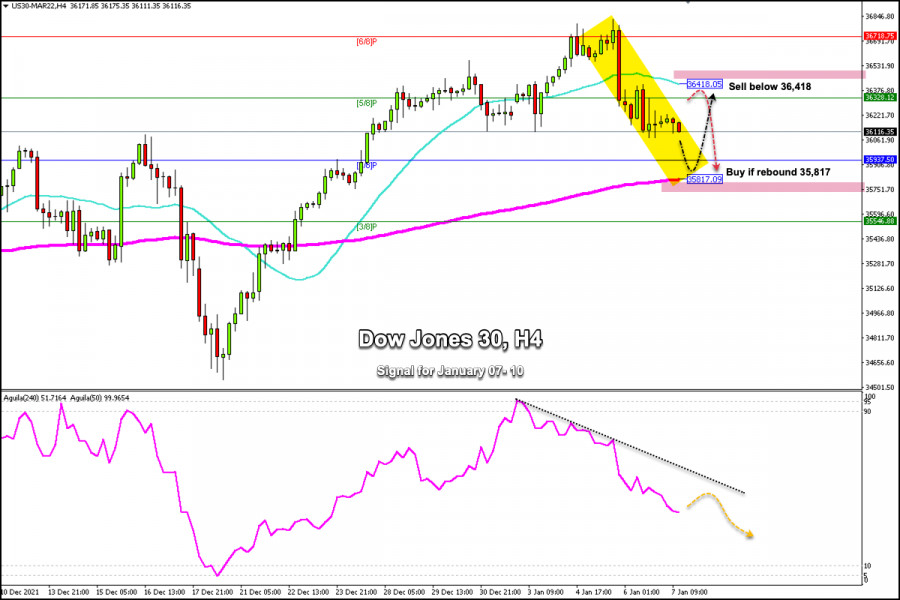
| Trading signals for Dow Jones 30 (#INDU) on January 07 - 10, 2022: sell below 36,418 points (21 SMA) Posted: 07 Jan 2022 08:01 AM PST
The Dow Jones 30 Industrial Index (#INDU) fell in the first week of trading this month, at this time it is trading below the SMA of 21 and below the 5/8 of Murray. Outlook remains bearish and we could expect it to continue in the next few days until it finds support at the EMA 200 located at 35,817. The Fed is currently on track to stop adding to its nearly $8.2 trillion worth of Treasuries and mortgage-backed securities by mid-March. Two to four interest rate hikes are also currently forecast for this year. All this could significantly affect Wall Street and we could see a fall in these indices towards the levels of the year 2019-2020. We can clearly observe the market reaction after the data that were published on Wednesday by the FOMC and today with Nonfarm Payroll data. Therefore, in the short term we can sell the Dow Jones as long as it remains below 36,718 (6/8) and 36,418 (21 SMA) awaiting a technical bounce at 35,817 (200 EMA). In this area, it will be an opportunity to buy again, targeting 6/8 of Murray at 36,718. A sharp break below the EMA 200 located at 35,817 will be the beginning of a bearish scenario and we could expect a drop in the Dow Jones to key levels of 34,656 (December 17 low). The eagle indicator is giving a negative signal and the decline is likely to continue towards the level of 10-point and until it may be oversold. Support and Resistance Levels for January 07 - 10, 2022 Resistance (3) 36,555 Resistance (2) 36,328 Resistance (1) 36,217 ---------------------------- Support (1) 36,019 Support (2) 35,818 Support (3) 35,681 *********************************************************** The material has been provided by InstaForex Company - www.instaforex.com |
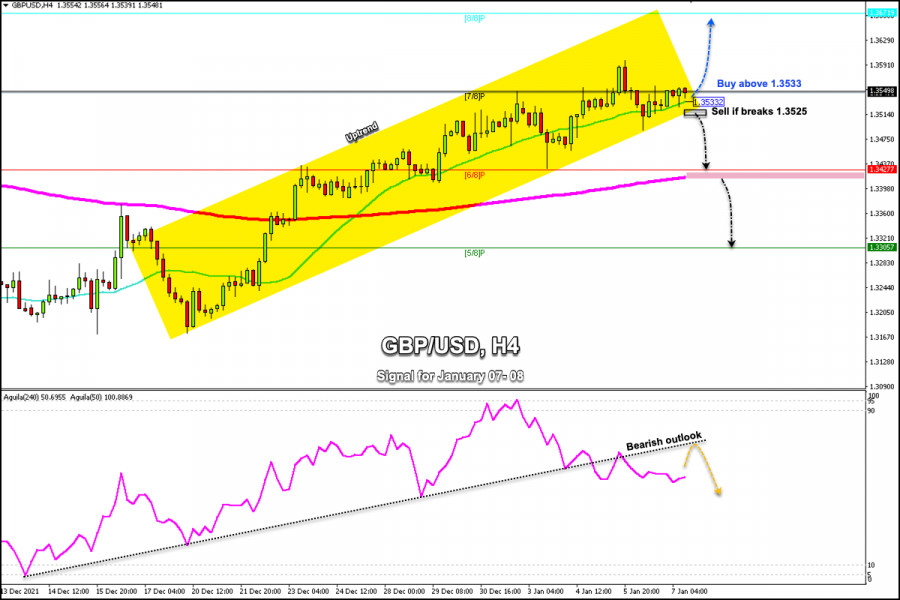
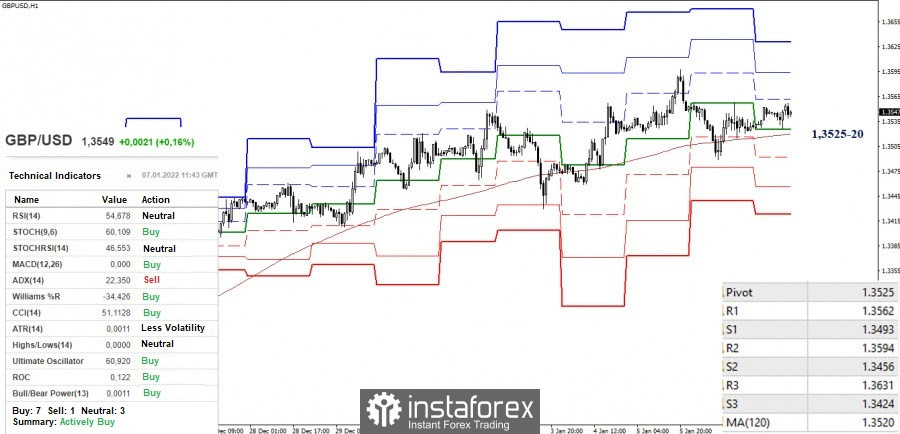
| Trading signals for GBP/USD on January 07 - 10, 2022: buy above 1.3533 (21 SMA) Posted: 07 Jan 2022 07:02 AM PST
Investors are waiting for data on the US non-farm payroll. This data could have a significant impact on how markets assimilate the monetary policy outlook of the Fed. In the medium term, it could be negative for the British pound. The FOMC Minutes revealed that current economic conditions such as the inflation outlook and the state of the labor market were considered factors that would allow a termination of the bond purchase program and 2 to 4 increases of the interest rate this year. Without a doubt, the currencies that operate against the dollar will be affected by this Fed's agenda. We could expect the US dollar to strengthen in the medium term which will allow traders to look for opportunities to sell the euro, the pound and other currencies. The British pound is trading above the 21 SMA located at 1.3533. The main trend formed since December 17 is still bullish and the pound is inside. There are no signs of a bearish signal, however a decline could occur if it breaks down and consolidates on the 4-hour chart below the 21 SMA around 1.3525. Since December 13, the eagle indicator has been giving a positive signal. However, now we can see in the chart that this trend channel has been broken. The outlook could be bearish as volume is low and market strength is waning. We can buy the pound as it remains above 1.35 30, targeting 1.36 and towards the strong resistance level at 8/8 Murray at 1.36 71. On the contrary, we can sell if the pound trades below 1.3525, with short-term targets at 1.3480. The eagle indicator supports our bearish strategy. Support and Resistance Levels for January 07 - 10, 2022 Resistance (3) 1.3631 Resistance (2) 1.3595 Resistance (1) 1.3564 ---------------------------- Support (1) 1.3527 Support (2) 1.3487 Support (3) 1.3458 *********************************************************** Scenario Timeframe 4-hours Recommendation: buy above Entry Point 1.3533 Take Profit 1.3595, 1.3671 (8/8) Stop Loss 1.3490 Murray Levels 1.3549 (7/8), 1.3671 (8/8) *********************************************************** Alternative scenario Recommendation: Sell if breaks Entry Point 1.3525 Take Profit 1.3427 (6/8), 1.3400 (200 EMA) Stop Loss 1.3562 Murray Levels 1.3427 (6/8) 1.3305 (5/8) ********************************************************* The material has been provided by InstaForex Company - www.instaforex.com |
| USD/CAD: U.S. and Canadian labor markets data Posted: 07 Jan 2022 06:53 AM PST Based on the ADP report on Wednesday, the number of jobs in the private sector in December in the United States increased by 807,000 (against the forecast of +400,000 and the previous value of +505,000). "The labor market continued to recover last month, despite all the difficulties," ADP commented. These are very strong indicators, indicating the continued improvement in the state of the labor market and the U.S. economy. They may strengthen the tendency of Fed leaders to raise interest rates earlier. According to the minutes of the Fed's December meeting released on Wednesday, Central Bank leaders may decide to raise rates as early as March. The strong ADP figures allow us to hope for an equally strong report from the U.S. Department of Labor: economists expect an increase in the number of jobs by 400,000 (against +210,000 in November and +531,000 in October) and a decrease in the unemployment rate to 4.1% (from 4.2% in November and 4.6% in October). The dollar may receive additional support by reacting to the publication of strong macroeconomic statistics, which may indicate in favor of the decision on a more rapid tightening of monetary policy by the Fed. The upward momentum of the dollar intensified in December after the speech of Fed Chairman Jerome Powell in Congress. Powell acknowledged that inflation in the U.S. should no longer be considered a temporary phenomenon, and more active actions by the Fed will probably be required to tame its further growth. Thus, he considers it necessary to accelerate QE tapering. If the Labor Department report is also as strong as the ADP report, it will further strengthen the market participants' opinion that a more aggressive cycle of interest rate hikes in the U.S. should be expected, which is a strong upward factor for the dollar. Meanwhile, unemployment has risen in Canada in recent months, including amid massive business closures due to coronavirus and layoffs. Unemployment rose from the usual 5.6% - 5.7% to 7.8% in March and already up to 13.7% in May 2020. If unemployment continues to rise, the Canadian dollar will decline. If the data is better than the previous value, the Canadian dollar will strengthen. A decrease in the unemployment rate is a positive factor for CAD, an increase in unemployment is a negative factor. In August, unemployment was at 7.1%, and in November at 6.0% (versus 7.5% in July, 7.8% in June, 8.2% in May, 8.1% in April). According to the forecast, it is expected that unemployment in Canada in December remained at the same level of 6.0%, and the number of employed increased by another 27.5k. This is moderately positive data for CAD, whose quotes may grow supported by renewed growth in oil prices. Canada is the largest exporter of oil, and the share of oil and oil products in the country's exports is approximately 22%. Despite some uncertainty in the oil market due to the coronavirus, many leading economists predict a further increase in energy prices (coal, gas, oil), including due to expectations of a cold winter and rush demand in the gas market. Thus, at 10:30 UTC, a sharp increase in volatility is expected in the financial markets, especially in the USD/CAD pair. If the official data of the U.S. Department of Labor turns out to be disappointing, then we should expect a weakening of the U.S. dollar and a decline in USD/CAD. Technical analysis and trading recommendations
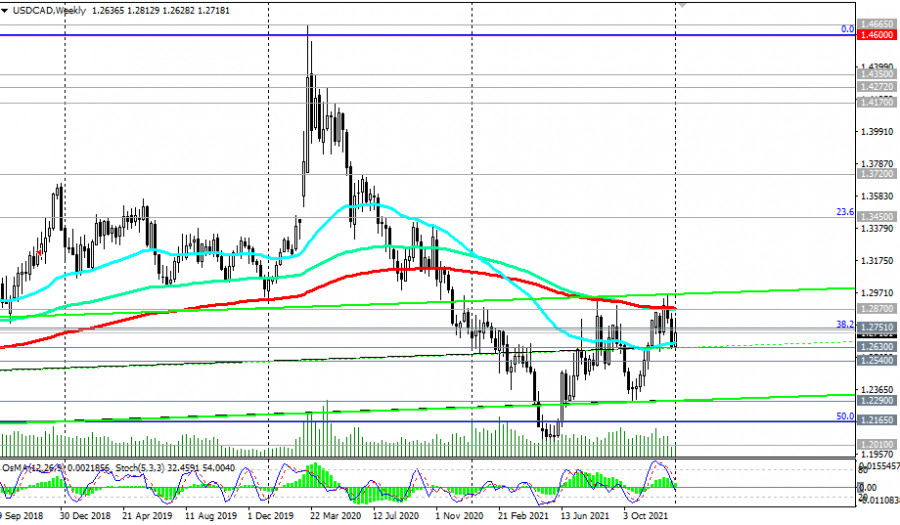
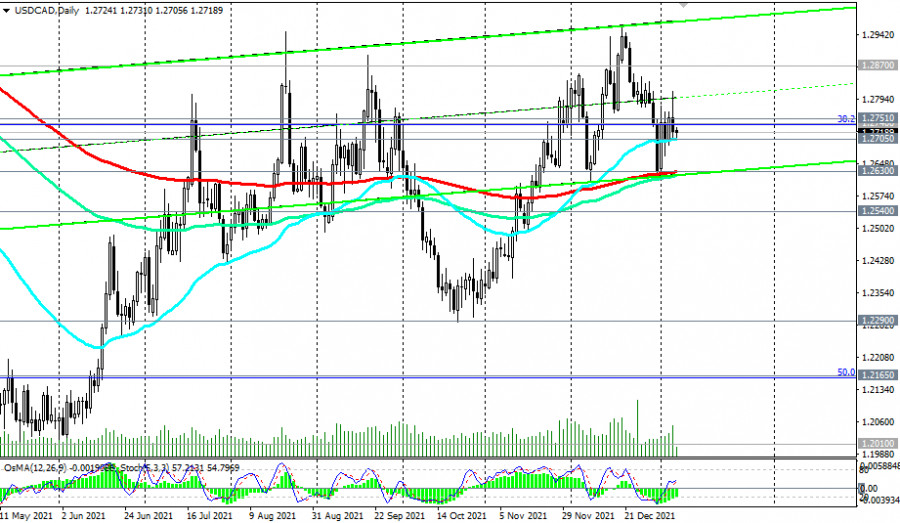
Since the beginning of November, USD/CAD has been developing upward dynamics against the background of the strengthening of the U.S. dollar due to the increased likelihood of an imminent increase in the Fed interest rate. The pair is trading above the important long-term support level 1.2630 (200 EMA on the daily chart). A breakdown of the key resistance level 1.2870 (200 EMA on the weekly chart) will mean the final completion of the downward correction and the return of USD/CAD to the zone of the long-term bull market.
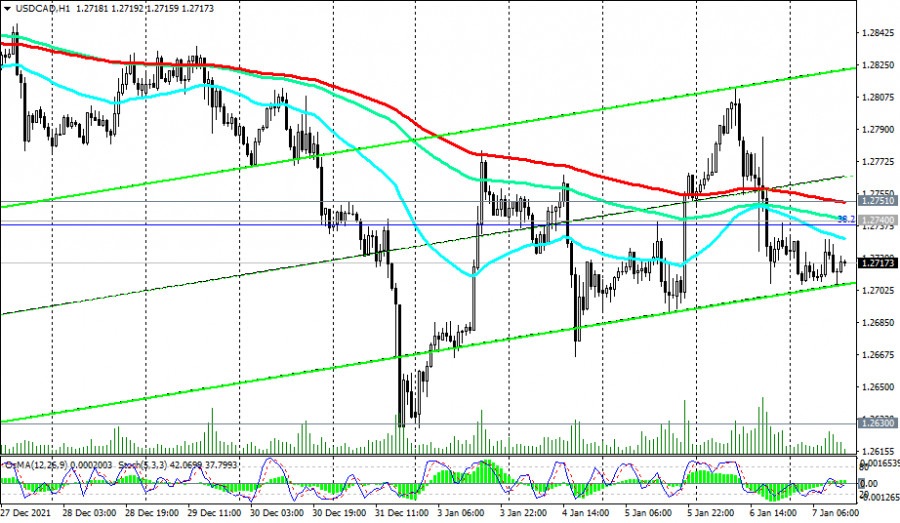
Alternatively, the USD/CAD will resume decline, and the first signals for the implementation of this scenario have already been received: the price broke through two important support levels - 1.2751 (200 EMA on the 1-hour chart), 1.2740 (200 EMA on the 4-hour chart and 38.2% Fibonacci level of the downward correction in the wave of USD/CAD growth from 0.9700 to 1.4600).
A breakdown of the key support level 1.2540 (200 EMA on the monthly chart) will mean a return of USD/CAD to the bear market zone. Support levels: 1. 2705 1.2630, 1.2540, 1.2290, 1.2165, 1.2010 Resistance levels: 1.2740, 1.2751, 1.2870, 1.2900 Trading scenarios Sell Stop 1.2685. Stop-Loss 1.2760. Take-Profit 1.2630, 1.2540, 1.2290, 1.2165, 1.2010 Buy Stop 1.2760. Stop-Loss 1.2685. Take-Profit 1.2870, 1.2900, 1.3000, 1.3200 The material has been provided by InstaForex Company - www.instaforex.com |
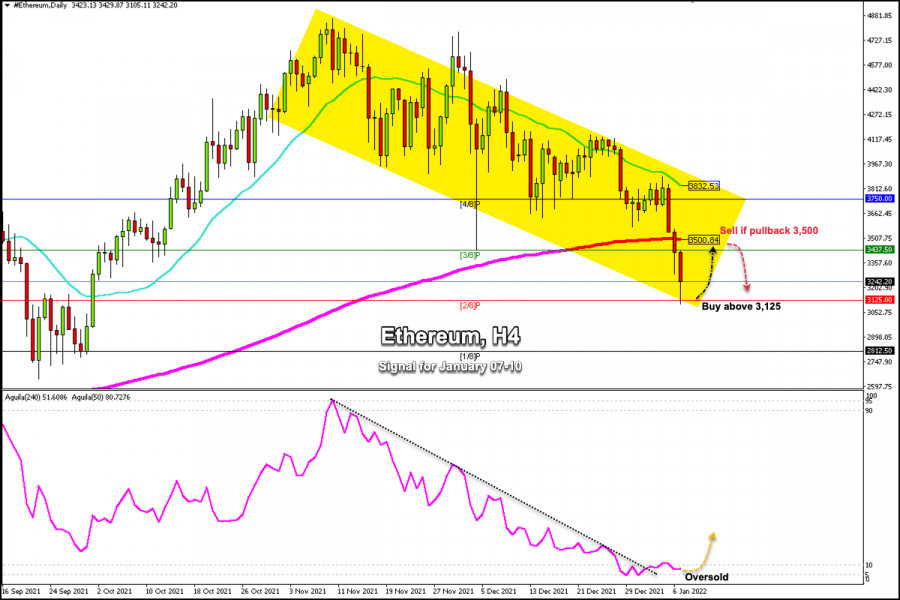
| Trading signals for Ethereum (ETH/USD) on January 07 - 10, 2022: buy above $3,125 (2/8) Posted: 07 Jan 2022 06:04 AM PST
The price of Ethereum (ETH) has continued its downtrend. In the European session, it reached the low of 3,105 retreating to the price of October 1, 2021. If the bearish outlook continues, ETH could soon retest the support of 1/8 Murray around 2,812. Regardless of the bearish outlook for the ETH price, a break above the support level of the 200 EMA will confirm the good mood among buyers and the price could rise to the 21 SMA located at 3,822 and up to the psychological level of 4,00. The eagle indicator is moving around the oversold zone between 5-10 points. A technical bounce above the 2/8 Murray (3,125) is likely in the coming days with targets towards the immediate resistance at 3,500 (200 EMA). The US Federal Reserve (FED) and its minutes released on Wednesday gave investors an impetus to take refuge in the US dollar. In fact, the US central bank hinted at a faster timetable to start raising interest rates this year. An increase in the interest rate in the United States and a strong dollar could be the factor that further weakens all cryptocurrencies. So, Bitcoin and Ethereum could fall in the long term to support levels of the year 2020. Our medium-term outlook remains bearish. However, any recovery in Ether towards the psychological level of $ 4,000 or towards $5,000 is likely to be seen by the bears as an opportunity to sell. We see that ETH is oversold in the short term. Ttherefore, it is likely that in the next few days there will be a technical rebound towards the levels 3,500 or 3,750 that will give us an opportunity to enter again with a bearish strategy. Support and Resistance Levels for January 07 - 10, 2022 Resistance (3) 3,549 Resistance (2) 3,437 Resistance (1) 3,291 ---------------------------- Support (1) 3,000 Support (2) 2,812 Support (3) 2,500 *********************************************************** Scenario Timeframe 4-hours Recommendation: buy above Entry Point 3,125 Take Profit 3,437 (3/8), 3,500 (200 EMA) Stop Loss 3,000 Murray Levels 3,437 (3/8), 3,750 (4/8) *********************************************************** The material has been provided by InstaForex Company - www.instaforex.com |
| Bitcoin Drops To $41k Amid Rising Cryptocurrency Panic: Time To Buy? Posted: 07 Jan 2022 05:57 AM PST Bitcoin finally fell into the final zone of the fluctuation area after the release of the Fed minutes and the tense situation with mining in Kazakhstan. As a result, traders lost $810 million, and the market finally lost faith in cryptocurrency. The dominance of bears has intensified, thanks to which Bitcoin has reached a new local bottom at $41k. The asset failed to consolidate below this area due to the rapid buying-off of buyers. As of 11:00 UTC, Bitcoin is trading in the $42.4k region, with trading volumes rising to $57 billion. I assumed that with a decline to the $41k–$42k area, a massive buyback would occur, and the price would break through the $45k mark in impulse movement. As a result, the situation remains bearish, and the coin remains in the local bottom range of $45k–$41k. The crypto asset managed to bounce off the local support zone at $40.9k, but in the near future, we will have a period of stabilization and consolidation in the $45k–$41k area. Having broken through the key and final support level at $42.2k, Bitcoin completed the formation of the head and shoulders technical analysis pattern. This pattern indicates a trend change. In a specific case, the trend will change from an upward to a downward one with a downside potential in the $25k region. The continuation of the downward trend is indicated by the absence of active purchases of the coin in the current range, which is an excellent place to enter. Technical indicators confirm the calmness in the market and the complete predominance of sellers. The MACD indicator has formed a bearish crossover and continued the downward movement, while the RSI has left the bullish zone and is moving into the oversold area. The Stochastic Oscillator also does not show upward signals.
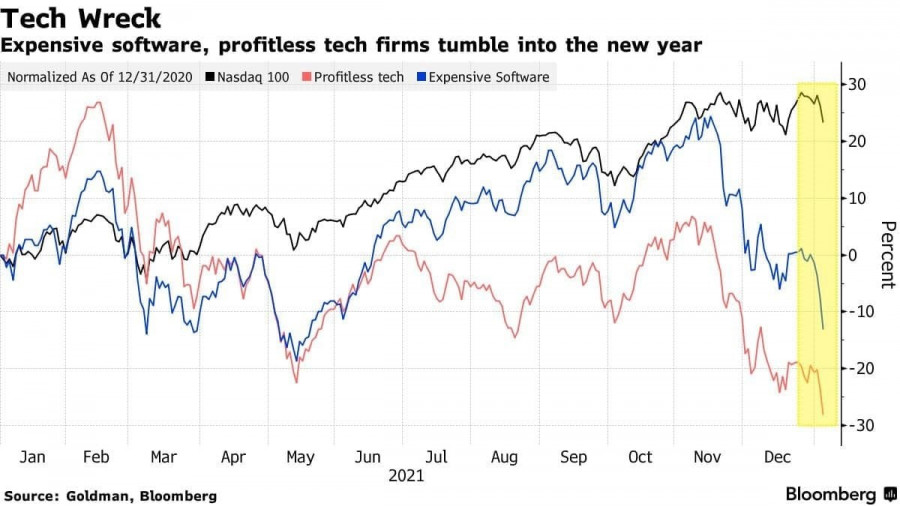
Despite the growth in retail purchases, the market still lacks the activity of large investors. According to Bloomberg and Goldman Sachs, this may be due to the global reorientation of institutional investors in the world's stock markets. Experts said late 2021 saw the largest tech sell-off in 10 years. According to a survey from Nickel Digital Asset Management, large companies are seriously concerned about the safety and security of funds. According to data for 2021, crypto scammers have stolen a record $14 billion in cryptocurrency. Therefore, big capital is in no hurry to enter the cryptocurrency market.
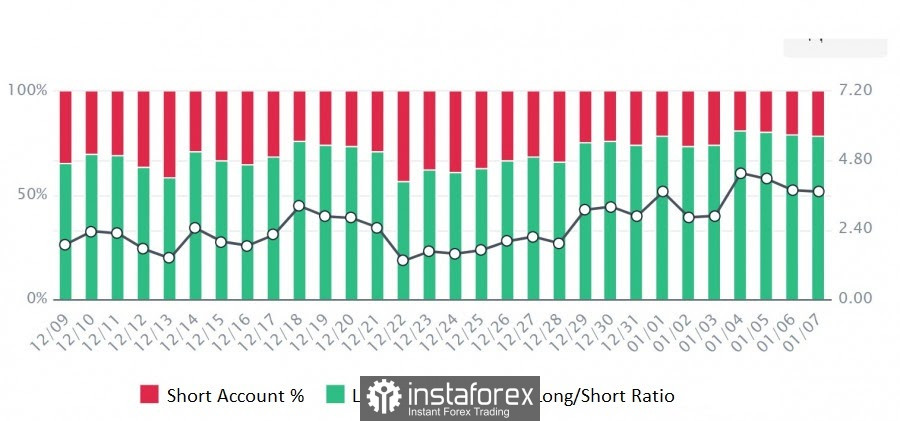
On the positive side, retail investors believe in Bitcoin. On the leading cryptocurrency exchanges, the number of longs significantly exceeds the number of shorts. On the one hand, we know that the market is playing with the expectations of the players and this situation is fraught with another strait. On the other hand, this means that the market is ready for growth and believes that BTC has reached a local bottom. I continue to hold the opinion that the cryptocurrency is moving in the May scenario. This means that the $41k mark became the first pivot point for the formation of the double bottom pattern. Unless a massive buyback and activation of large investors follows in the near future, Bitcoin will continue to consolidate, moving flat. Subsequently, I look forward to a retest of $41k and further upward movement.The Bitcoin market has suffered enough, the asset has reached a minimum point in this growth cycle and will soon resume its upward movement.
|
| Posted: 07 Jan 2022 05:47 AM PST At the opening of trading on Friday, the main digital coin broke a monthly low near the $ 41,600 mark. Further, the decline of Bitcoin began to intensify during the Asian session, when the cryptocurrency fell below $ 41,000 and was at the price level of September last year. The participants of the crypto market have been observing a permanent decline in BTC since Wednesday. Then the digital asset broke through the December support around $ 45,500. At the same time, Bitcoin has already lost 11.4% in value since Monday, and its market capitalization has dropped to $ 795 billion.
By the way, the leading altcoins hastened to adopt the trend of the main virtual asset and began to actively decline after it. So, during the week, the Ethereum cryptocurrency lost 31.2% and today is trading at around $ 3,200 per coin. Altcoin Solana sank by 18.2% and cost $ 138.8. The Shiba Inu coin fell by 14% to $ 0.00002903, and Elon Musk's pet Dogecoin fell by 10.3% to $ 0.1523. It's hard to say that the fall of the first cryptocurrency happened unexpectedly. The reason for the sharp collapse of BTC, market analysts call several factors at once. First, the release of the minutes of the last meeting of the US Federal Reserve System on Wednesday. According to data received from the Fed, rate hikes can be expected as early as March 2022. Traditionally, an increase in the cost of borrowed funds negatively affects the price of all risky assets, including cryptocurrencies. Second, the shutdown of the Internet, including mining centers, in Kazakhstan against the background of unrest in the country. As a result, the hashrate of the Bitcoin network instantly sank by 12%. Since Kazakhstan hosts about 18% of the global mining capacity of the first cryptocurrency, and the state itself ranks second in the world in coin mining, disconnecting the country from the global network instantly affected the price of BTC. At the same time, the ratio of long positions to short positions in the margin market of virtual assets remains high, which often causes tangible collapses of cryptocurrencies to eliminate collateral positions. The material has been provided by InstaForex Company - www.instaforex.com |
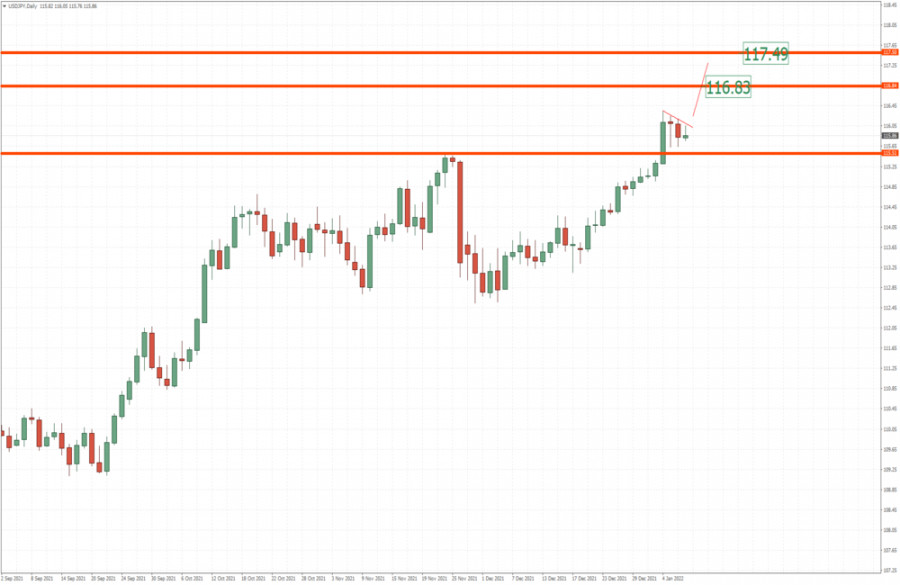
| USD/CAD analysis for January 07, 2022 - Inside day formation Posted: 07 Jan 2022 05:15 AM PST Technical analysis:
USD/JPY has been trading sideways at the price of 115,90 and I see potential for the breakout. Trading recommendation: Watch for the potential breakout of the resistance at the price of 116,35 to confirm further upside continuation. Upside objectives are set at the price of 116,83 and 117,50. Important support level is set at the price of 115,50. short-term upside trend is still active and that buying breakout are preferable.... The material has been provided by InstaForex Company - www.instaforex.com |
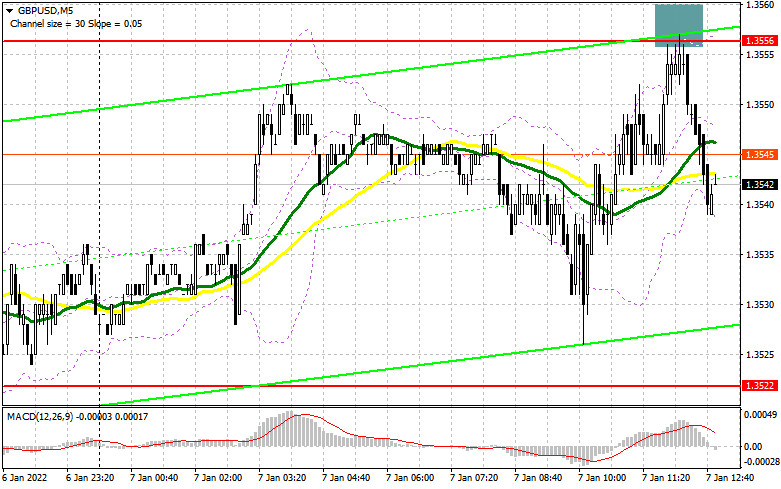
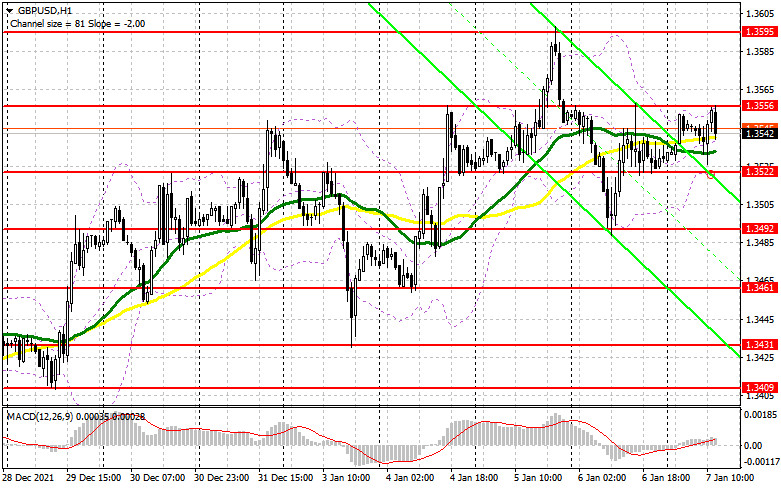
| Posted: 07 Jan 2022 05:03 AM PST To open long positions on GBP/USD, you need: In my morning forecast, I paid attention to the level of 1.3556 and recommended making decisions on entering the market. Let's take a look at the 5-minute chart and figure out the entry points. Today's attempts by bulls to gain a foothold at new highs have not been successful. The formation of a false breakdown at the level of 1.3556 led to the formation of a sell signal for the British pound, which is still valid at the time of writing. Most likely, traders will focus on today's data on the American labor market, so much will depend on them. The technical picture has not changed in any way for the second half of the day. And what were the entry points for the euro this morning? And what were the entry points for the euro this morning?
The primary task of buyers for today remains to protect the support of 1.3522, which was formed following the results of yesterday. This level is a kind of middle of the side channel in which the pound has been since the middle of this week. Weak data on changes in the number of people employed in the non-agricultural sector in the US will have a serious impact on the pair, which may return demand for the British pound. The formation of a false breakdown at 1.3522 forms a good buy signal with the prospect of the continued growth of GBP/USD, aimed at a breakthrough of 1.3556, which was not possible today. A breakdown and test of this level from top to bottom will give an additional entry point and strengthen the position of buyers to continue building a bullish trend and update the highs: 1.3595 and 1.3649. A more distant target will be the 1.3694 area, where I recommend fixing the profits. In the scenario of a decline in the pound during the US session and a lack of activity at 1.3522, it is best to postpone purchases to the level of 1.3492. Only the formation of a false breakdown there will give an entry point in the expectation of maintaining bullish momentum. You can buy GBP/USD immediately on a rebound from 1.3461 or even lower - from a minimum of 1.3431, counting on a correction of 20-25 points within a day. To open short positions on GBP/USD, you need: The bears again defended the level of 1.3556, and while trading will be conducted below this range, we can count on a larger drop in the pair. However, as noted above, much will be the envy of the data on the American economy. Protection of 1.3556 remains the primary task today, as a repeated exit above this range will create several technical problems. The formation of a false breakdown at this level forms another entry point into short positions, followed by a decline in the pair to the area of 1.3522, for which you will have to fight hard. A breakdown of 1.3522 and a reverse test from the bottom up will increase the pressure on the pound and dump it to the next support of 1.3492, formed by the results of yesterday. Only the consolidation and the reverse test of 1.3492 from the bottom up will give a new entry point into short positions with the prospect of a decline in GBP/USD already to 1.3461 and 1.3431, where I recommend fixing the profits. However, such a scenario is possible only in the case of very good data on changes in the number of people employed in the US non-agricultural sector. If the pair grows during the American session and sellers are weak at 1.3556, it is best to postpone sales to a larger resistance of 1.3595. I also advise you to open short positions there only in case of a false breakdown. It is possible to sell GBP/USD immediately for a rebound from a large resistance of 1.3649 or even higher - from a new maximum in the area of 1.3694, counting on the pair's rebound down by 20-25 points inside the day.
In the COT reports (Commitment of Traders) for December 28, a reduction in both short and long positions was recorded. Considering that long positions have shrunk much more, this has only increased the negative value of the delta. The data take into account the meeting of the Federal Reserve System and the Bank of England, however, we remember that the pound declined strongly after the rapid growth that occurred due to the increase in interest rates. If you look at the overall picture, the prospects for the British pound look pretty good. The Bank of England's decision to raise interest rates continues to fuel the markets with new buyers, and a more aggressive policy of the regulator next year will certainly strengthen the bullish trend for the GBPUSD pair. High inflation remains the main reason why the Bank of England will continue to raise interest rates. On the other hand, the US dollar also has support: The Federal Reserve system plans to raise interest rates in the spring of next year, which makes the US dollar more attractive. The COT report for December 21 indicated that long non-commercial positions fell from the level of 29,497 to the level of 20,824, while short non-commercial positions fell from the level of 80,245 to the level of 78,510. This led to an increase in the negative non-commercial net position from -50,748 to -57,686. The weekly closing price has hardly changed: 1.3209 versus 1.3213 a week earlier. Signals of indicators: Moving averages Trading is conducted around 30 and 50 daily moving averages, which indicates the lateral nature of the market before important data. Note: The period and prices of moving averages are considered by the author on the hourly chart H1 and differ from the general definition of the classic daily moving averages on the daily chart D1. Bollinger Bands In case of a decline in the pair, the average border of the indicator around 1.3522 will act as support. A breakthrough of the upper limit of the indicator in the area of 1.3556 will lead to a new wave of growth of the pound. Description of indicators
|
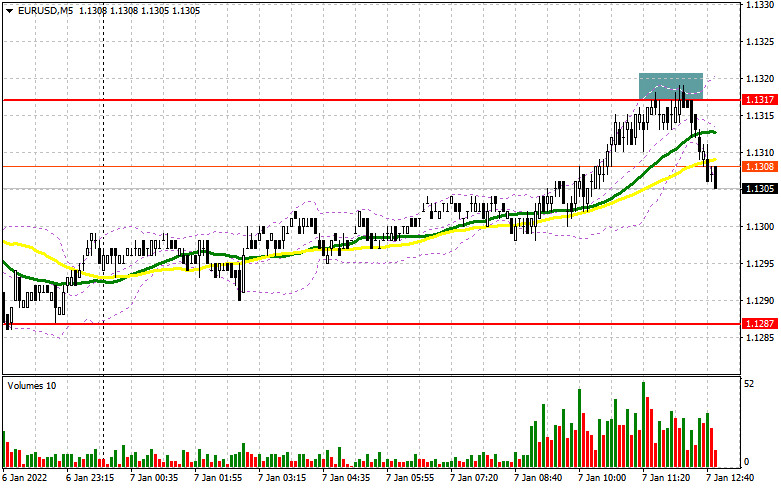
| Posted: 07 Jan 2022 05:03 AM PST To open long positions on EURUSD, you need: In my morning forecast, I paid attention to the 1.1317 level and advised making decisions on entering the market. Let's look at the 5-minute chart and figure out what happened. The released fundamental data on inflation in the eurozone returned demand for the euro, which led to an increase in the resistance area of 1.1317, from where I advised opening short positions. As a result of the formation of a false breakdown, a sell signal was formed, which is valid at the time of writing the article. The pair went down about 13 points, and it seems that traders decided not to force events and wait for data on the American labor market. The technical picture for the second half of the day has not changed in any way. And what were the entry points for the pound this morning?
It will be very important how during the American session traders will react to the report on the unemployment rate in the United States and the change in the number of people employed in the non-agricultural sector. Fairly steady growth of new jobs is predicted, which may lead to a strengthening of the dollar. For this reason, buyers need to focus their attention on the 1.1287 level, to which the pair can quickly collapse after the data. Only the formation of a false breakdown there, by analogy with yesterday, will lead to the formation of a signal to buy the euro in the expectation of a repeated recovery to the resistance of 1.1317, which could not be fixed above today again. An important task will be the breakdown of this range, and the reverse test from top to bottom will open up the possibility of a jump to the area of levels: 1.1344 and 1.1375, where I recommend fixing the profits. A more distant target will be the 1.1415 area, but such a scenario is possible only in the case of weak fundamental statistics for the United States. With the pair declining during the American session and the lack of bull activity at 1.1287, it is best to postpone purchases to larger support of 1.1265. However, I advise you to open long positions there when forming a false breakdown. From the 1.1248 level, you can buy EUR/USD immediately for a rebound with the aim of an upward correction of 20-25 points within a day. To open short positions on EURUSD, you need: Today, sellers have again done everything possible to keep the market under their control. While trading will be conducted below 1.1317, we can expect a larger drop in the pair in the short term. If EUR/USD rises again today during the US session, sellers need to try to protect this level in order not to miss the pair above 1.1317 again – this will lead to a change in direction of movement. Only the formation of a false breakdown at 1.1317 forms the first entry point into short positions in the expectation of a return of pressure on EUR/USD and a repeated decline to the area of 1.1287. A more active struggle will unfold for this level. A breakdown and a bottom-up test of this range, together with strong data on the US labor market and an increase in investor confidence in more active actions by the Federal Reserve System to tighten policy – all this will give an additional signal to open short positions with the prospect of a decline to a large minimum of 1.1265. Only going beyond this level will change the market direction to a downward one and demolish several buyers' stop orders, which will cause a larger drop in EUR/USD with the update of the lows: 1.1248 and 1.1224, where I recommend fixing the profits. In the case of the growth of the euro and the lack of activity of bears at 1.1317, it is best not to rush with sales. The optimal scenario will be short positions when forming a false breakdown in the area of 1.1344. You can sell EUR/USD immediately on a rebound from the maximum of 1.1375 or even higher - around 1.1415 with the aim of a downward correction of 15-20 points.
The COT report (Commitment of Traders) for December 28 recorded an increase in both short and long positions, but the latter decreased slightly more, which led to a reduction in the negative value of the delta. These data take into account recent meetings of the Federal Reserve System and the European Central Bank. However, judging by the balance of forces, nothing has changed much, which is generally confirmed by the schedule. Many problems in the economy of the eurozone and the United States remain due to the Omicron coronavirus strain, which does not allow representatives of central banks to live in peace. Most likely, the future monetary policy of the Fed and the ECB will depend on how the situation will develop with the coronavirus after the New Year. The report shows that buyers of risky assets, and we are talking about the euro now, are not in a hurry to build up long positions even after recent statements by the European Central Bank that it plans to fully complete its emergency bond purchase program in March next year. On the other hand, the US dollar also has support: The Federal Reserve system plans to raise interest rates in the spring of next year, which makes the US dollar more attractive. The COT report indicates that long non-commercial positions increased from the level of 189,530 to the level of 196,595, while short non-commercial positions increased from the level of 201,409 to the level of 206,757. This suggests that traders will continue to actively fight for the further direction of the market. At the end of the week, the total non-commercial net position decreased its negative value from -11,879 to -10,162. The weekly closing price, due to the side channel, almost did not change - 1.1277 against 1.1283 a week earlier. Signals of indicators: Moving averages Trading is conducted around 30 and 50 daily moving averages, which indicates market uncertainty. Note: The period and prices of moving averages are considered by the author on the hourly chart H1 and differ from the general definition of the classic daily moving averages on the daily chart D1. Bollinger Bands In the case of growth, the upper limit of the indicator around 1.1317 will act as resistance. In case of a decline, the lower limit of 1.1287 will be used as support. Description of indicators
|
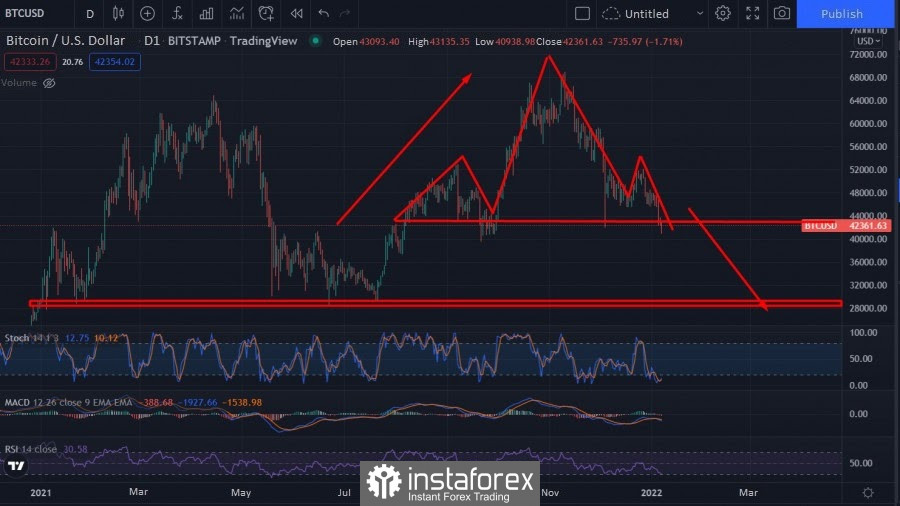
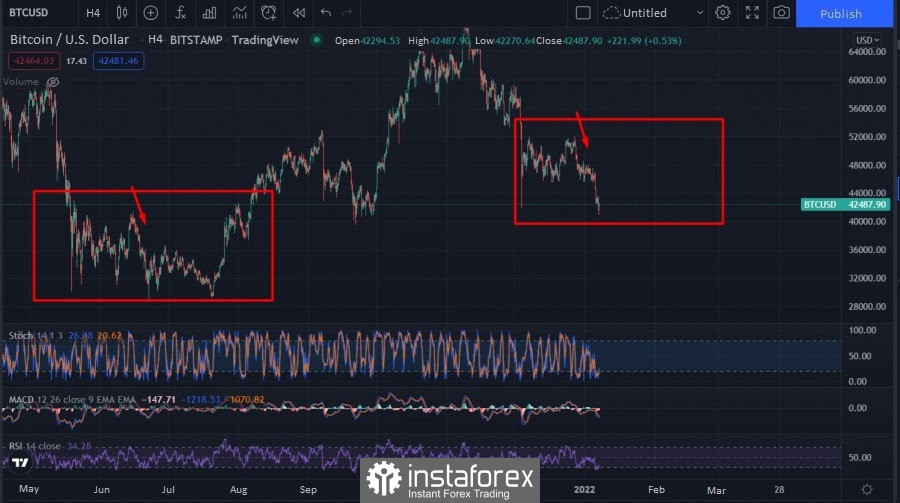
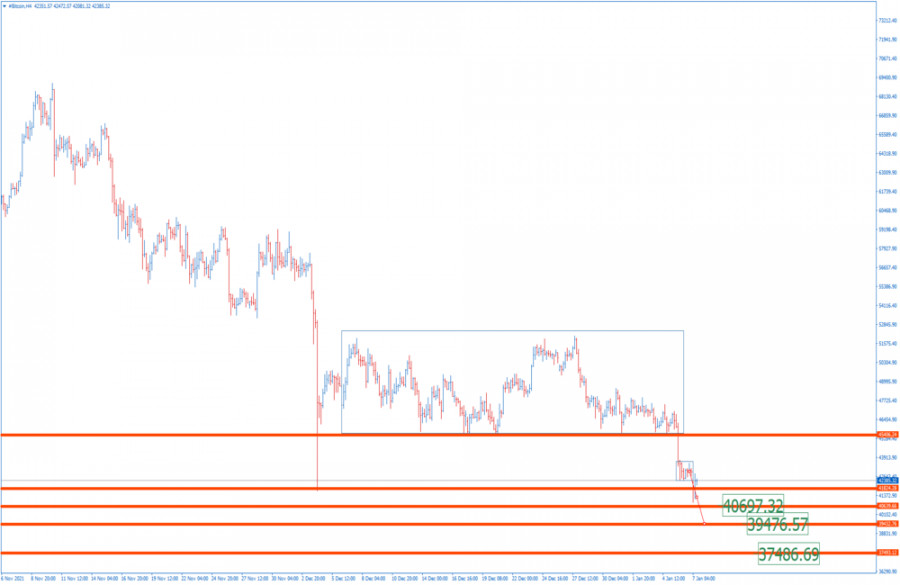
| BTC analysis for January 07,.2022 - First target reached and potential for another drop Posted: 07 Jan 2022 04:53 AM PST Technical analysis:
BTC has been trading downside as I expected. The BTC reached my first objective at $41,800. Anyway, I see potential for further downside and another drop. Trading recommendation: Watch for selling opportunities on the rallies or continuation al patterns. Downside objectives are set at the price of $39,475 and $37,485 Resistance level is set at thee price of $43,650 Short-term downside trend is still active since the bigger breakout to the downside that happened 2 days ago. The material has been provided by InstaForex Company - www.instaforex.com |
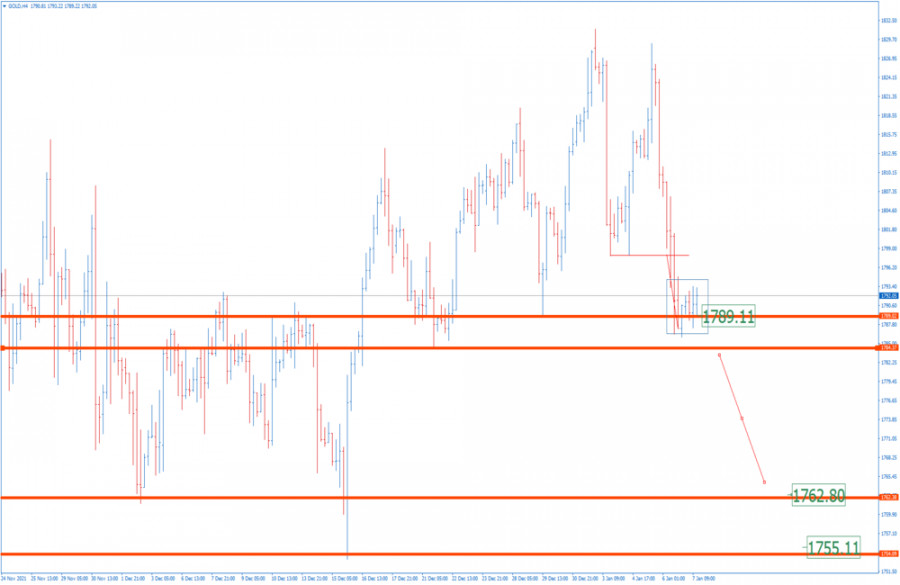
| Analysis of Gold for January 07,.2022 - Watch for potential bigger downside breakout Posted: 07 Jan 2022 04:47 AM PST Technical analysis:
Gold has been trading downside yesterday as I expected. The price tested the first objective at the price of $1,789. Anyway, there is potential for another downside breakout. Trading recommendation: Watch for the breakout of the important pivot support at $1,784 t confirm further downside movement. Downside objectives will be set at the price of $1,762 and $1,755 Resistance level is set at the price of $1,795 and $1,798 The material has been provided by InstaForex Company - www.instaforex.com |
| Technical analysis recommendations of EUR/USD and GBP/USD on January 7, 2021 Posted: 07 Jan 2022 04:33 AM PST EUR/USD
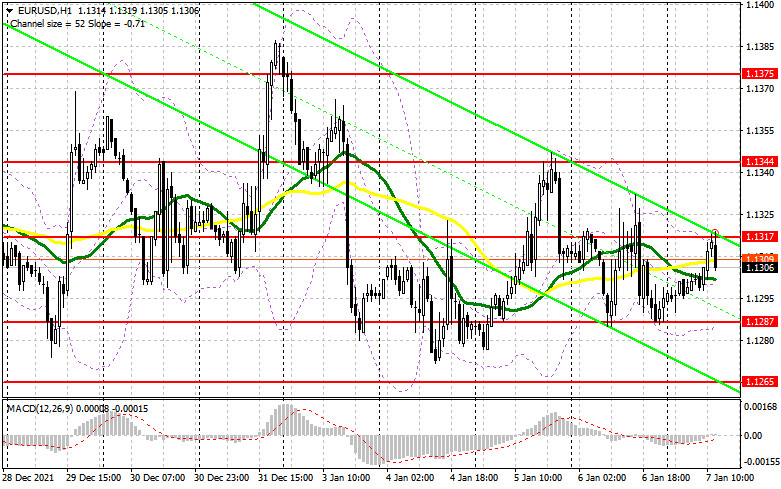
The situation did not go significant changes over the past day. The pair continues to remain in the attraction zone of the monthly level (1.1290), with which the daily Ichimoku cross has been combining its efforts for a long time. If there are intentions to leave the long-term consolidation zone, the opportunities of the bulls will rest against the resistance of 1.1383-87-98 (highs of consolidation + weekly short-term trend). In turn, the opportunities for the bears will open after consolidation under the minimum extreme of consolidation (1.1186).
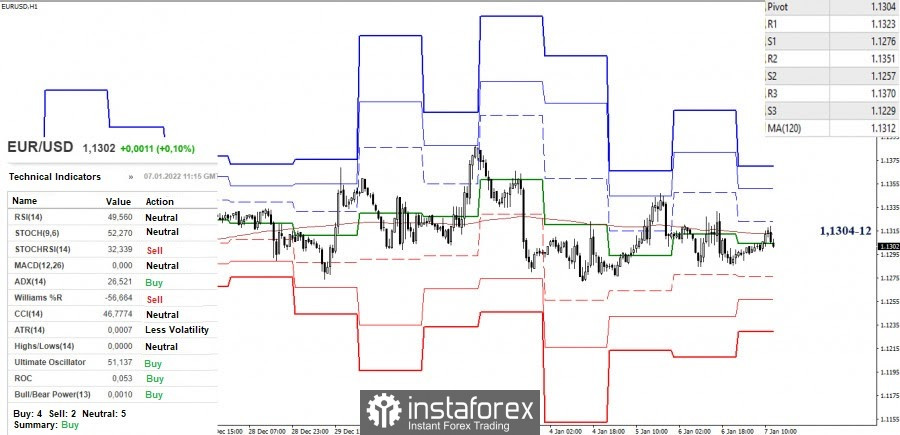
The pair in the smaller timeframes is in the attraction zone of key levels. At the moment, testing is taking place from below, which means that the bears have some advantage. The formation of a rebound from the key levels of 1,1304-12 (central pivot level + weekly long-term trend) will preserve the preconditions to strengthen the bearish mood. The intraday downward pivot points are the support of the classic pivot levels (1.1276 - 1.1257 - 1.1229 ). On the contrary, a consolidation above the area of 1.1304-12 will give an advantage to the opponent, indicating preferences to develop the bullish mood. Today's resistances of the classic pivot levels are at 1.1323 - 1.1351 - 1.1370. GBP/USD
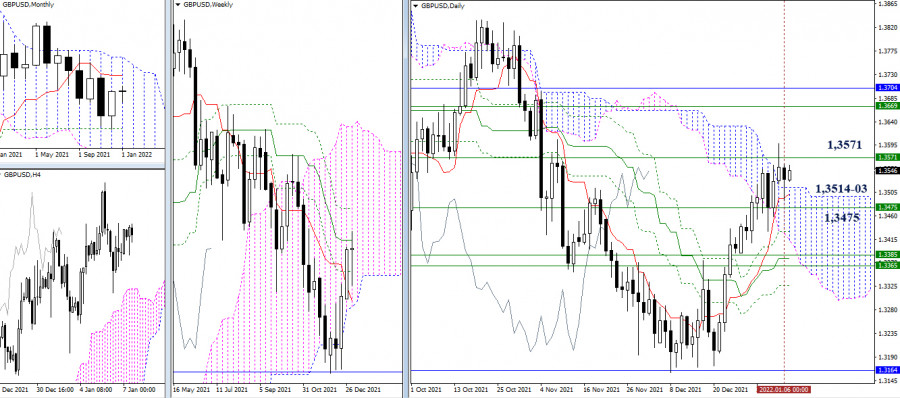
The bulls are making an attempt to consolidate in the upper zone relative to the daily cloud, using the broken resistances as supports 1.3514 (upper border of the daily cloud) - 1.3503 (daily short-term trend) - 1.3475 (weekly Fibo Kijun). The current obstacle hindering the bulls' further strengthening is the weekly medium-term trend (1.3571).
Despite being in the correction zone for quite a long time in the smaller timeframes, the preponderance of forces on the bullish side remains, which continue to trade above the key levels of 1.3525-20 (central pivot level + weekly long-term trend), maintaining their support. In this case, the resistance of the classic pivot levels (1.3562 - 1.3594 - 1.3631) serves as upward pivot points. In turn, downward targets today are located at 1.3493 - 1.3456 - 1.3224 (support for the classic pivot levels). *** Ichimoku Kinko Hyo (9.26.52) and Kijun-sen levels in the higher time frames, as well as classic Pivot Points and Moving Average (120) on the H1 chart, are used in the technical analysis of the trading instruments. The material has been provided by InstaForex Company - www.instaforex.com |
| Posted: 07 Jan 2022 04:30 AM PST
Transparency has different definitions to different people. This is what Jerome Powell said. At the end of each FOMC meeting, the Fed issues a written statement and the chairman holds a press conference. However, in the case of the December FOMC statement and the press conference, the definition of Fed's transparency does not seem very transparent. It is true that many components of monetary policy are being discussed. However, the fact that nothing has been said about the upcoming monetary policy changes leaves a lot of questions. There are also subtleties in the words used to describe forthcoming adjustments, such as reducing the asset balance sheet and beginning to normalize interest rates. The Fed's actions are data-driven, and as that data changes, so does the Fed's outlook. However, there was no mention in the statement or at the press conference of a withdrawal of assets accumulated on the balance sheet. The published minutes revealed a fuller picture, discussing the right time to start reducing the balance sheet. Before the recession, which was a direct result of the global pandemic, the Fed began an aggressive program of quantitative easing, buying $120 billion of US Treasuries and mortgage-backed securities every month. During a recent press conference, the chairman was asked about the gradual asset reduction process. He said that once the gradual reduction process is complete, the balance sheet will remain intact and provide the necessary liquidity to continue the economic recovery. However, a very different picture emerges from the published minutes, which explicitly stated the beginning of the reduction in total assets. The chart below, titled "Fed balance sheet by era," was created by Reuters News Service using data from the Fed.
|
| Posted: 07 Jan 2022 03:14 AM PST
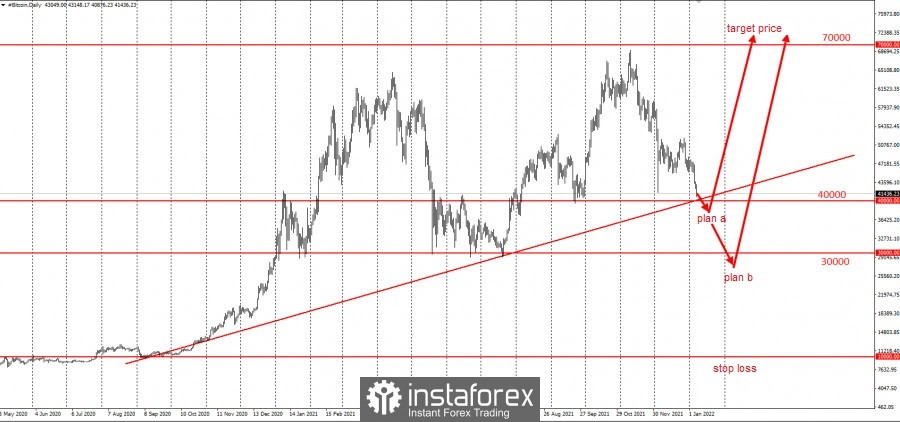
Bitcoin lost roughly $ 30,000 over the past 3 months, which is almost 40% of its highest price. That opens excellent opportunities to buy the cryptocurrency at a good price.
Considering that Bitcoin is approaching $ 40,000, which, on the one hand, is an important support-resistance level, and on the other, an important psychological level for players on both sides (bulls and bears), not to mention there is a support level (oblique red line on the chart), which is also well seen by players and from which purchases can proceed, investors can set buy limits without using leverage under $ 40,000. If the price does not reverse from $ 40,000, long positions can be taken from $ 30,000 to $ 35,000. That is half of Bitcoin's growth over the entire period of its existence. In other words, you buy Bitcoin at half price with zero risk Crypto is a long-term investment and is designed to be developed without leverage. Good luck and have a nice day! The material has been provided by InstaForex Company - www.instaforex.com |
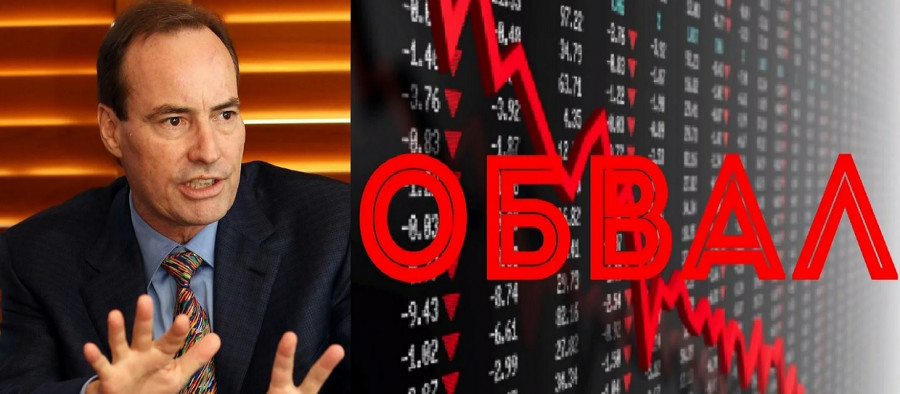
| Harry Dent: US stock market may collapse this year Posted: 07 Jan 2022 03:10 AM PST
Harry Dent predicts to see the biggest financial downturn in history this year, saying that investors will take the biggest risk if they don't start selling assets now. In his book "What To Do When The Bubble Pops", he bases his economic forecasts on demographic changes. According to Dent, risky assets will be sold off in waves, with the first wave leading to a 40% drop in US stock markets. At the same time, the entire bear market phase may lead to a 90% loss for the S&P 500, not unlike what happened to tech stocks during the 1999 Dot Com bubble crash.
He predicts a total collapse of 80% to 90%. This collapse will occur mainly due to the fact that financial assets are, as Dent called it, in the greatest bubble in history due to the Fed's excessive stimulus especially when the bubble is not natural, but organized by central banks. Dent's comments were made after the publication of the minutes of the FRS meeting. Stock markets have already reacted negatively to the news, while Treasury yields increased. According to Dent, this market correction in 2022 should be followed by a rebound with a longer boom cycle, which will be led by a generation of millennials. In his opinion, there will be an opportunity to buy for life at the end of 2023. He predicts the next boom will be for millennials from 2024 to 2039. All assets are at stake, including gold, although Dent added that Treasury bonds should benefit the most from asset price deflation. He also explained the difference between the hedging power of gold and Treasury bonds. The collapse of financial assets will not be triggered by an economic downturn; on the contrary, a market crash would trigger a recession, Dent said. He also noted that one of the assets to buy during the recovery phase in 2023 and beyond will be cryptocurrencies, although he believes that most of the altcoins are now in a bubble. Dent's own holdings currently include mainly cash and real estate. The material has been provided by InstaForex Company - www.instaforex.com |
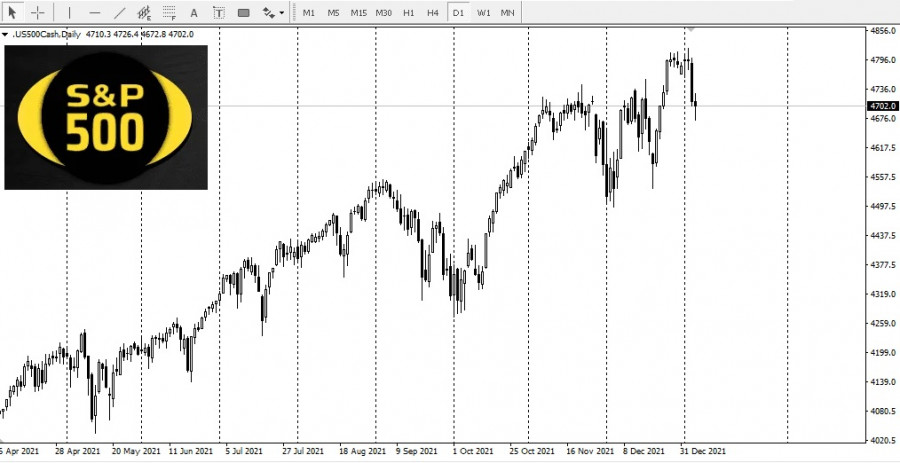
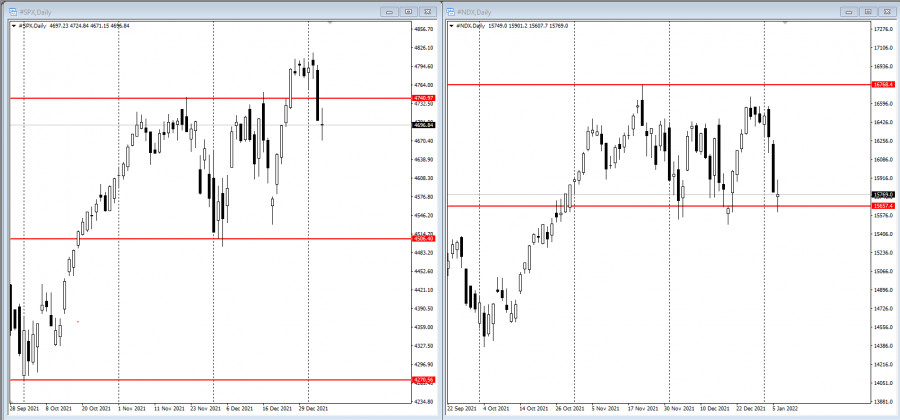
| Stock market halts ahead of US non-farm report Posted: 07 Jan 2022 03:03 AM PST
US stocks fluctuated between gains and losses on Thursday after investors found out they overestimated the Federal Reserve's plan towards inflation. The S&P 500 index was little changed by midday, trying to recover from the 1.9% fall caused by the Fed minutes, which suggested that the central bank was ready to raise rates earlier and higher than previously expected. The hawkish stance has hit the most risky assets, from high-value software stocks to newly publicly traded companies. Treasury bonds also continued to decline, albeit slower than the previous days. The yield on 10-year bonds was near 1.73%. Dollar was also little changed.
The overtly hawkish stance of the Fed shook the financial markets because it made investors redefine the value of assets amid expected strong economic growth and higher interest rates. This marks a shift that has not been seen for at least three years, a time when volatility also spiked and led to a major drop in stocks. "We knew coming into 2022 that the Fed was going to be a creator of volatility within the market and we're seeing that right out of the gate at the start of the year," said Lindsey Bell, chief strategist at Ally. "The good news is that today things seem to be stabilizing a little bit after yesterday's knee-jerk reaction," she added. Meanwhile, DataTrek Research co-founder Nicholas Colas advised that investors should be careful over the next few days because "we've never seen the Federal Reserve both raise interest rates from zero and shrink its balance sheet. There has been a two-year hiatus in the cycle, so this is cause for concern. We do not predict a crash, but we understand why the market has fainted." San Francisco Fed President Mary Daly also said on Thursday that the US economy can almost reach the Fed's goals. She explained that the US labor market "looks very strong," but lacks millions of workers compared to before the pandemic. She said the reduction in the Fed's balance sheet will occur after the normalization of the funds rate. Mike Loewengart, managing director of E * Trade Financial, noted that "inflation is in the spotlight when it comes to potential Fed action. While hiring has certainly been a challenge, the employment picture has been improving and edging toward what it was pre-pandemic. So with the labor market somewhat under control, jobless claims are likely going to fade into the background while the Fed is focused on their inflation mandate. " Other key events today are: - release of EU CPI; - non-farm employment report in the United States; - employment data in Canada. The material has been provided by InstaForex Company - www.instaforex.com |


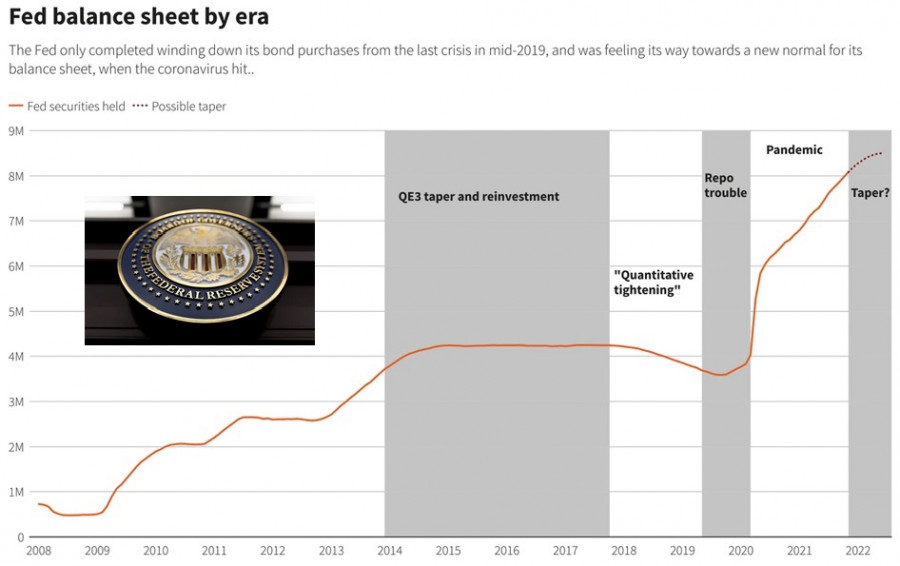 It shows that from 2008 to 2009, the Fed's assets were just under $1 trillion. In order to stimulate the economy, Chairman Ben Bernanke, who was appointed in 2006, used an orthodox method of stimulating and reviving the economy called quantitative easing. From November 2008 through June 2010, the Fed created money by buying financial assets from banks and the government. The quantitative easing program was implemented in four stages: QE1 - QE4. By 2014, the Federal Reserve had accumulated just under $4 trillion in assets. QE4 was the beginning of quantitative tightening, which was aimed at reducing the trillions of dollars held by the Fed. However, the tightening process was accompanied by problems and ended in 2019. The Fed eventually reduced their balance sheet to $3.7 trillion from $4.5 trillion. At that point, the Fed chairman believed that further cuts would create economic problems, so the asset reduction process was over. In mid-2019, the new Federal Reserve Chairman began aggressive use of quantitative easing, increasing the Federal Reserve's balance sheet to its current size of about $8.6 trillion from $3.7 trillion. The latest minutes showed that for the first time the Federal Reserve has publicly acknowledged that a timetable will be created to begin reducing assets. Judging by the history, the Fed's asset reduction has internal constraints and is a complex process that should be completed without negatively impacting the economic recovery. It was this additional component that caught market participants off guard, leading to a large drop in US stocks and gold. While Friday's jobs report could have a dramatic impact on various assets, it is this month that market participants will demand more clarity and transparency about the Federal Reserve's intentions to reduce their huge asset balance sheet.

| You are subscribed to email updates from Forex analysis review. To stop receiving these emails, you may unsubscribe now. | Email delivery powered by Google |
| Google, 1600 Amphitheatre Parkway, Mountain View, CA 94043, United States | |


Comments