Forex analysis review
Forex analysis review |
- Elliott wave analysis of EUR/USD for January 6, 2022
- Elliott wave analysis of GBP/JPY for January 6, 2022
- Crypto market update for January 6, 2021
- Trading signals for USD/JPY on January 06 - 07, 2022: sell below 116.00
- Adding to the list: Peru has submitted its bill on cryptocurrencies
- Forecast for EUR/USD on January 6, 2022
- Forecast for AUD/USD on January 6, 2022
- Forecast for USD/JPY on January 6, 2022
- Overview of the GBP/USD pair. January 6. Boris Johnson risks leaving his post before the end of this year.
- Overview of the EUR/USD pair. January 6. The market is waiting for Nonfarms on Friday. The euro is counting on a weak December
- Forecast and trading signals for GBP/USD for January 6. Detailed analysis of the pair's movement and trade deals. Pound's
- Forecast and trading signals for EUR/USD for January 6. Detailed analysis of the pair's movement and trade deals. Euro continues
- Gold's rejection and bearish Daily candle.
- GBPUSD:Is it time to sell?
- Ichimoku cloud indicator analysis on EURUSD for January 5th, 2022.
- Bitcoin provides another bearish signal.
- How to trade GBP/USD on January 6? Simple tips for beginners. The pound continues its strong growth
- President of El Salvador Nayib Bukele is confident that the world has not yet fully felt all that power and domination of
- Europe runs the risk of being left without gas in March
- Inflation pressure eases in France, eurobank promises quick victory
- December analytics showed mass migration of workers in the US
- USD/CHF exhausted sellers
- Bitcoin accelerates its sell-off
- Gold ahead of FOMC minutes
- USD/CAD: downside seems limited
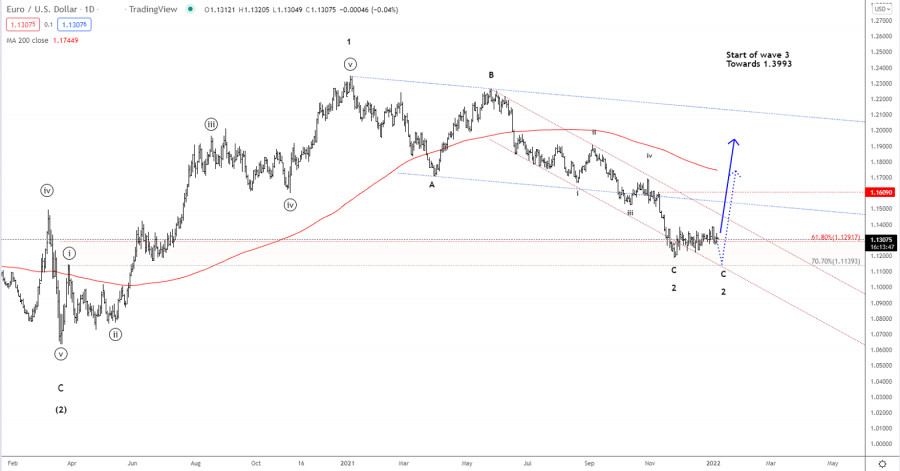
| Elliott wave analysis of EUR/USD for January 6, 2022 Posted: 05 Jan 2022 09:55 PM PST
EUR/USD remains locked inside the narrow trading-range between 1.1222 - 1.1383. This accumulation of energy will cause either a swift dip to test support at 1.1139 and then a quick return higher through short-term key-resistance at 1.1383 confirming that wave 2 has completed. Or we will see a direct break above short-term key-resistance at 1.1383 confirming that wave 3 towards 1.3993 already is in motion. For now it's a game of patience and waiting to see if a final dip is needed before wave 3 is ready to take over or wave 3 already is in motion. The material has been provided by InstaForex Company - www.instaforex.com |
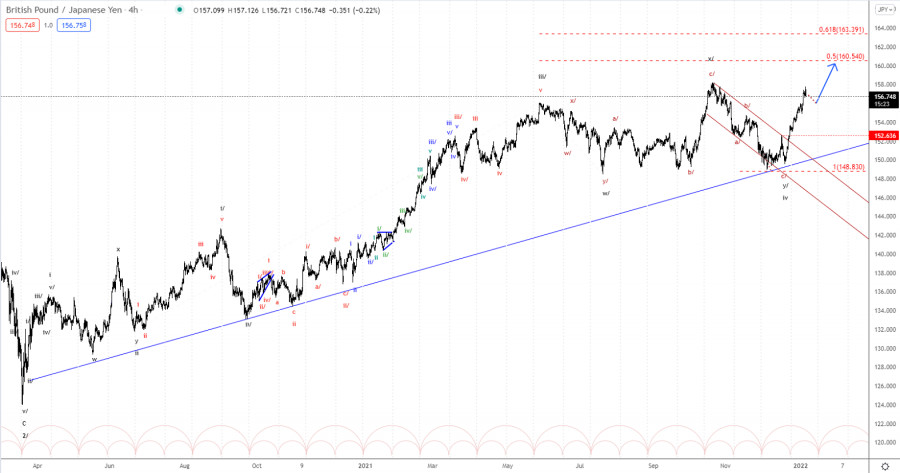
| Elliott wave analysis of GBP/JPY for January 6, 2022 Posted: 05 Jan 2022 09:50 PM PST
GBP/JPY is already testing the former top of wave iii/ at 158.21 and we could see a temporary set-back close to 156.00 before the next rally higher towards the 160.54 target and maybe even closer to our secondary target at 163.39 where we expect wave v/ of iii to complete and set the stage for another time consuming correction in wave iv. However, for now our focus should remain towards the upside and a test of our first target at 160.54. The material has been provided by InstaForex Company - www.instaforex.com |
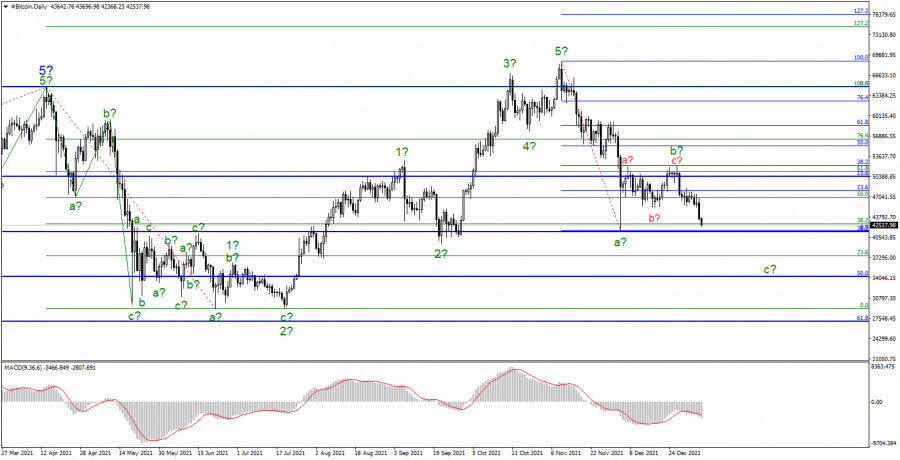
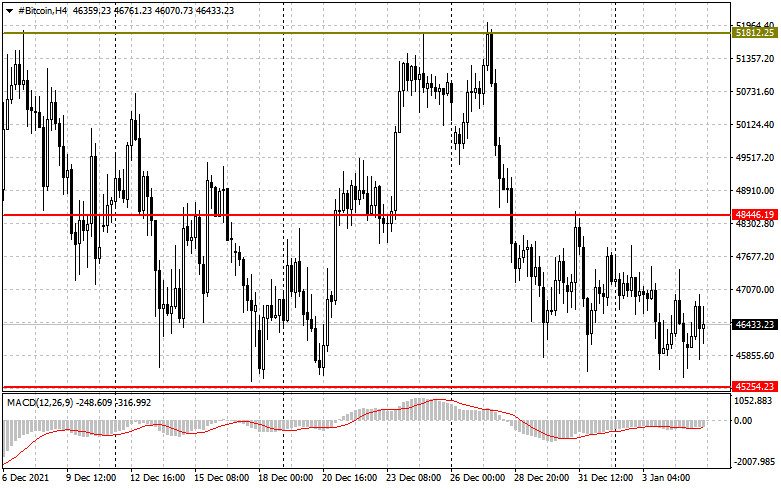
| Crypto market update for January 6, 2021 Posted: 05 Jan 2022 09:25 PM PST
Bitcoin hardly moved in the early days of 2022, but it still resumed its decline yesterday. In our opinion, the world's first cryptocurrency continues to be within the corrective section of the trend and now, the formation of its third wave continues. This wave may be the last, but quotes for this should fall at least below the previous low - from December 4. Based on these considerations, we expect Bitcoin to decline to a low of $40,000. Nevertheless, there are alternative scenarios. For example, the expected wave b of the correction section may take a more complex form than it is now. However, this will only delay Bitcoin's further decline. If the attempt to break through the level of $ 41642 is successful, then this cryptocurrency has every chance to decrease by another $ 7-8 thousand.
It was already mentioned during yesterday's review that most of the forecasts at the end of last year did not come true. Ironically, most of them spoke just about the $ 100,000 mark either until the end of 2021 or at the beginning of 2022. Today, it became known that analysts of the large investment bank Goldman Sachs made a new forecast, which includes the level of $ 100,000. But this time, they gave a time frame within which the first cryptocurrency is able to reach that mark, that is, within 5 years. According to the bank's analysts, Bitcoin currently accounts for about 20% of the entire savings market, which consists only of gold and Bitcoin. Over the next five years, they expect the share of bitcoin to rise to 50%, which will allow the cryptocurrency to surge to the level of $ 100,000. We believe that such a forecast has a much better chance of coming true. It is worth noting that 2022 can be a very difficult year for all risky assets, among which Bitcoin undoubtedly comes first. Central banks in many countries will raise interest rates and have already begun to stop monetary stimulus. In this case, risky assets are already under-invested in order to continue to rise. So far, this is not too much noticeable, but it will be when the Fed is going to completely do it in March this year. In addition, according to the assurances of Neel Kashkari, the rate will be raised at least twice this year. These factors can force investors to abandon new cryptocurrency investments.
A new downward section of the trend continues to form, no matter who says what. At the moment, only one downward wave can be seen, and there should be at least two of them and a correctional wave between them. Therefore, we expect the instrument to decline to the last low, around the level of $ 41,500. The downward trend may end around it, but such a shortened third wave is rare. The instrument can be expected below this mark. Moreover, the supposed wave b may take on a more extended form than it is now, i.e. it can turn out five-wave, which also cannot be excluded completely. After the formation of the assumed wave c is done, everything will depend on the news background. If they are negative, then the entire downward trend may try to acquire an impulsive form. This will hinder Bitcoin to update its highs for quite some time. The material has been provided by InstaForex Company - www.instaforex.com |
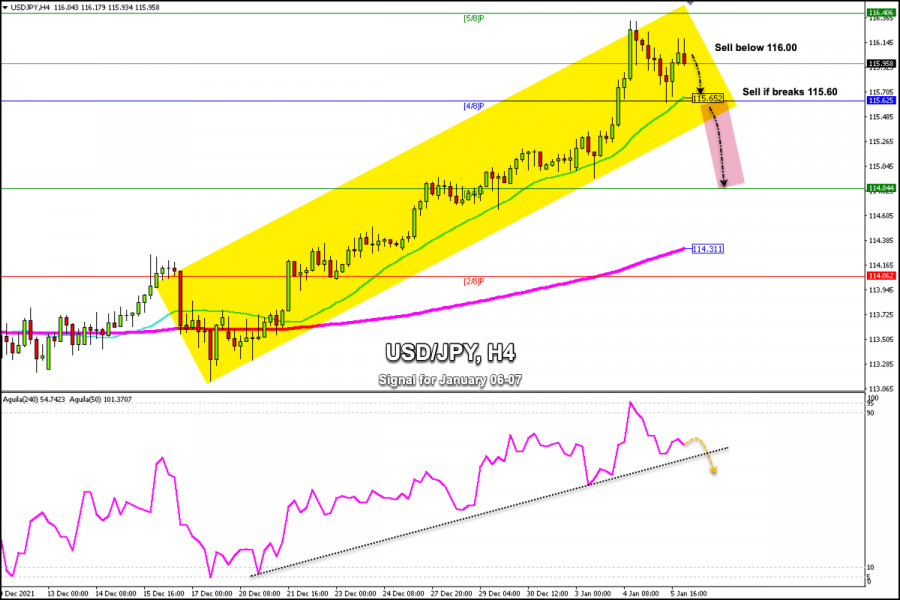
| Trading signals for USD/JPY on January 06 - 07, 2022: sell below 116.00 Posted: 05 Jan 2022 08:47 PM PST
On Tuesday, USD / JPY reached the highest level of January 2017 around the mark of 116.34. This weakness is due in part to the strength of the US dollar and to the rising yields of the US treasury bonds that reached a high of 1.63% as investors considered that the Fed would raise interest rates sooner rather than later. Yesterday, the Japanese yen was bouncing above the 21 SMA reaching the 116.15 area again. Now in the Asian session, we can see some selling below 116.00. A factor that could limit that USD / JPY continues to depreciate and could exert downward pressure is the cautious sentiment about the stock markets. Consequently, investors want to take refuge in the Japanese yen. USD/JPY is expected to consolidate below 116.00 in the next few hours. A technical correction could occur because on January 4, the eagle indicator reached the overbought zone at the critical point of 95-points. This technical rebound seen yesterday could be an opportunity to sell again, targeting the 21 SMA located at 115.62. The support of 4/8 Murray could stop the fall, since the moving average of 21 is located at this same level and the yen could bounce above this area. On the contrary, if the bearish pressure prevails and the pair breaks the key level of 115.65, the break of the uptrend channel is likely to be confirmed. Then, an acceleration of the downside move towards the level 3 / 8 Murray at 114.78 can be expected and the price could eventually fall towards the 200 EMA located at 114.31. Support and Resistance Levels for January 06 - 07, 2022 Resistance (3) 116.58 Resistance (2) 116.31 Resistance (1) 115.96 ---------------------------- Support (1) 115.69 Support (2) 115.34 Support (3) 115.07 *********************************************************** Scenario Timeframe 4-hours Recommendation: sell below Entry Point 116.00 Take Profit 115.60 (21 SMA), 114.84 (3/8) Stop Loss 116.40 Murray Levels 116.40 (5/8), 115.62 (4/8), 114.84 (3/8) *********************************************************** Alternative scenario Recommendation: buy in case of rebound off Entry Point 115.60 Take Profit 116.00, 116.40 (5/8) Stop Loss 115.25 Murray Levels 114.06 (2/8) 113.28 (1/8) ********************************************************* The material has been provided by InstaForex Company - www.instaforex.com |
| Adding to the list: Peru has submitted its bill on cryptocurrencies Posted: 05 Jan 2022 08:16 PM PST While traders of ether and bitcoin are diligently waiting after the New Year for the direction in which the movement will continue to develop and expect better, and there is something to count on, a draft of a new law on digital assets, which also includes cryptocurrencies, was presented in Peru. The bill, in addition to defining what a crypto asset is and establishing the responsibilities of virtual asset service providers (VASPs), also permits the use of this type of asset and its subsequent accumulation by companies. Peru launches first attempt to regulate cryptocurrencies A new bill was submitted to the Congress of Peru under the number No. 1042/2021-CR, which is the country's first attempt to regulate cryptocurrencies. Back on December 10 last year, a pilot project was presented for the first time, which defined several key concepts in the cryptocurrency world, including crypto assets, virtual asset service providers (VASP), blockchain, and cryptography.
The law also proposes to create a public registry for VASP, which users can access at any time to find out whether an exchange or a platform for doing business is registered. In addition, it sets out the conditions that each VASP must follow to work legally in the country. The project obliges these companies to inform that the Peruvian authorities do not consider cryptocurrencies to be legal tender and that the supervision of these assets by the government is not a guarantee against the risks that work with cryptocurrencies entails. It is also interesting that cryptocurrencies and tokens can be used to create and register companies, and give these companies a legal basis for storing cryptocurrencies in Peru. Most likely, this is done to attract developers of various software and blockchains. Last year, quite a lot of countries actively worked towards the regulation of cryptocurrency assets. Only El Salvador is worth something, where bitcoin was recognized as an official means of payment on a par with the national currency. There is also active work on crypto legislation in Brazil, Paraguay, and Venezuela. However, let me remind you that in Peru, the draft bill does not consider bitcoin a legal tender, as it is done in El Salvador. 1,044 bitcoins in December Mining also remains a fairly profitable field of activity, at least until bitcoin is trading above $20,000. Core Scientific, a digital asset development company, mined a total of 1,044 bitcoins in December, bringing their total number for the year to 5,769. At the end of the year, Core Scientific had 5,296 BTC. These figures are significantly higher than those of Bitfarms and Marathon Digital. In December, Bitfarms mined 363 bitcoins, and Marathon - 484.5. As for the technical picture of bitcoin
The bulls missed the support of $48,460 and now we need to think about how to return it. Without this level, it will be very problematic to build a new major trend, although there is still hope for the support of $ 45,250 – this is a very large level where a fairly large number of players are concentrated. In the case of a breakthrough– it is best to be patient and wait for the update of the levels: $41,600 and $37,380. It will be possible to talk about the continued growth of the first cryptocurrency only after going beyond $ 48,460, which will open a direct road to $ 51,800. Its breakdown will bring bitcoin to: $55,120 and $58,776. As for the technical picture of the ether
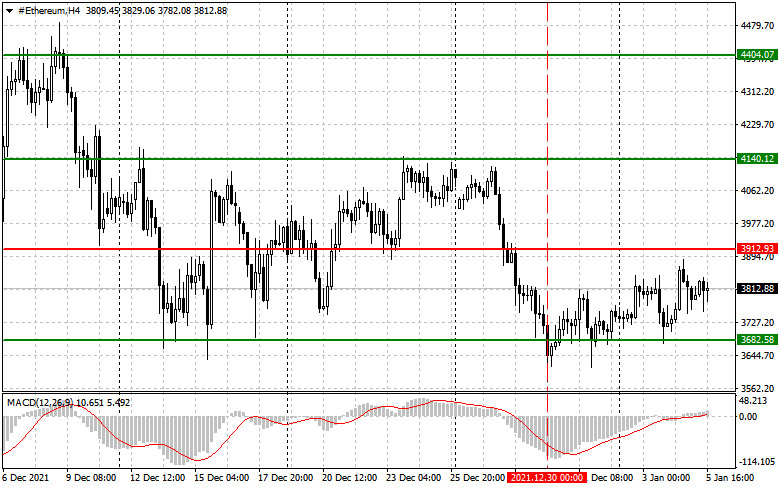
Ether buyers have lost control of $3,912 and have not been able to return it since the end of December last year. Now we need to try very hard to protect the lower level of $3,680. Its breakdown is a very bad call for buyers earlier this year. Therefore, I recommend being patient and opening long positions on the trading instrument only after updating the minimums: 3,448 and 3,046. To resume demand, a breakdown of 3,912 is needed again, which will open a direct road to $4,140. A break in this range will resume the bullish trend, which will lead to highs of $4,404 and $4,647. The material has been provided by InstaForex Company - www.instaforex.com |
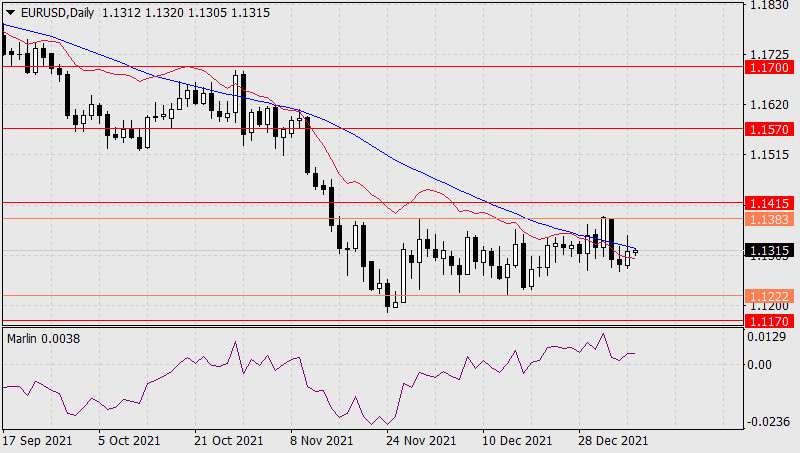
| Forecast for EUR/USD on January 6, 2022 Posted: 05 Jan 2022 08:16 PM PST Yesterday, the EUR/USD pair made a desperate attempt to overcome the resistance of the MACD indicator line on the daily chart. The attempt failed thanks to strong data on new jobs in the private sector from ADP, which showed an increase of 807,000 in December against the forecast of 405,000. Who have already shown their determination to defend their interests. The target for the euro remains the same - 1.1170.
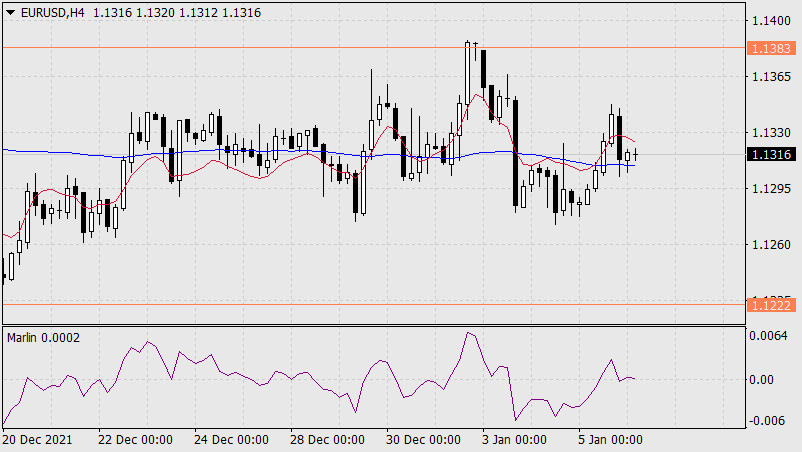
On the four-hour chart, the price went above the MACD line with consolidation, but now it is trying to return back under it, and then yesterday's price exit above this line will be interpreted as false, which in turn will create an independent and additional signal for a further price decline. Such a signal will be confirmed when the price moves below the nearest low of 1.1302. The Marlin Oscillator is already introducing itself into the negative area, helping the price return under the MACD line.
|
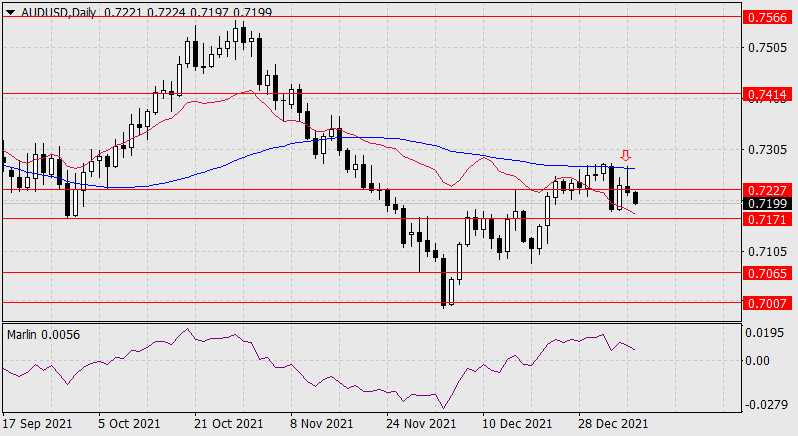
| Forecast for AUD/USD on January 6, 2022 Posted: 05 Jan 2022 08:16 PM PST Yesterday, the Australian dollar retested the daily MACD indicator line (arrow) and sharply fell below the target level of 0.7227. This retest became a confirmation of the strength of the MACD line and an additional sign of further price movement down to the target levels of 0.7065 and 0.7007. The final confirmation of the aussie's development under this scenario will be the price drift below the target level of 0.7171 (September 29, 2021 low). The price drift below this level will probably occur simultaneously with the transition of the Marlin Oscillator to the zone of negative numbers. This synchronicity will strengthen the bearish signal.
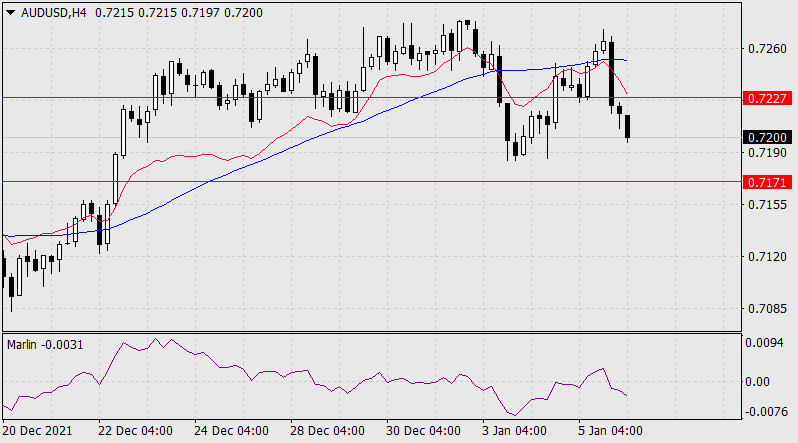
On a four-hour chart, the price is completely in a downward trend. Its development takes place under both indicator lines and the Marlin Oscillator goes down in the negative area. Yesterday the price made a false exit above the MACD indicator line and now the downward sentiment of AUD/USD is strengthening.
|
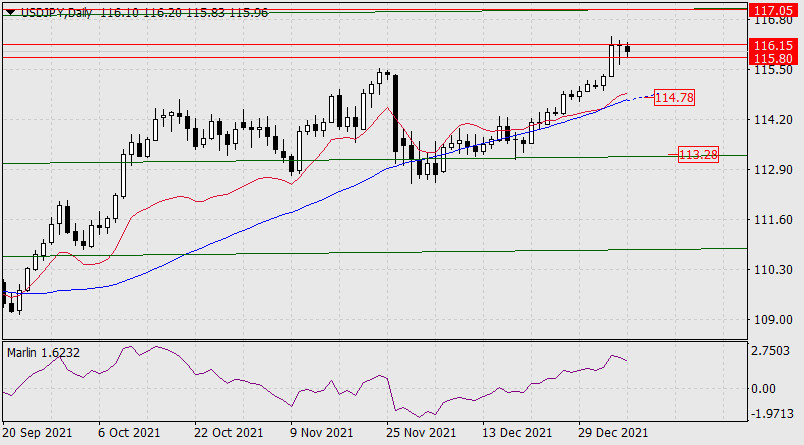
| Forecast for USD/JPY on January 6, 2022 Posted: 05 Jan 2022 08:16 PM PST Yesterday, the Japanese yen decided to stay in a narrow target range of 115.80-116.15 and this was due to objective circumstances: a decline in the dollar index by 0.11% and a fall in the US stock market by 1.94% (S&P 500). The stock market and the dollar still have a good chance of recovery - tomorrow there will be data on employment in the US for December and the forecast is very optimistic: 400,000 new jobs are expected in the non-agricultural sector, the unemployment rate will drop from 4.2% to 4.1 %.
Based on these optimistic expectations, the current consolidation in the target range can be taken as a respite for the price before further growth towards the target level of 117.05. The embedded line of the monthly timeframe price channel runs in the same area.
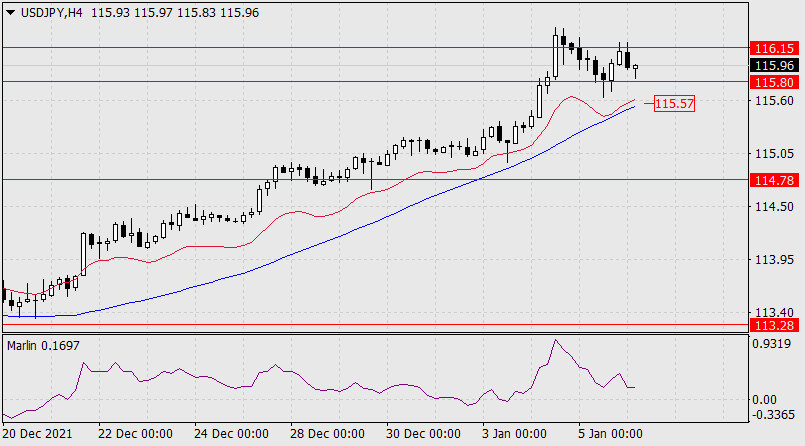
The situation remains the same on the four-hour scale - the price is in a growing position above both indicator lines, the Marlin Oscillator in the positive area begins to form a reversal towards continued growth. If the price moves below the MACD line (below 115.57), an attack on the daily MACD line (114.78) may develop. The material has been provided by InstaForex Company - www.instaforex.com |
| Posted: 05 Jan 2022 06:49 PM PST
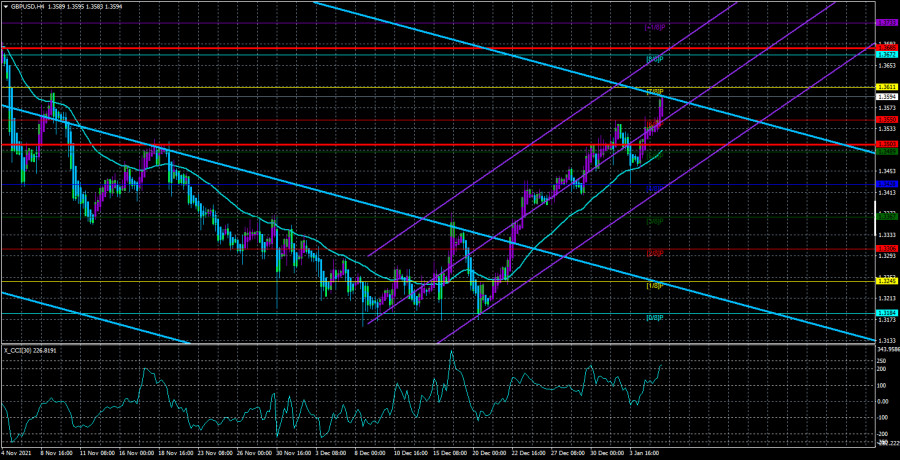
The GBP/USD currency pair continued to remain in an upward trend on Wednesday. For several weeks in a row, the British pound has been getting more expensive against the dollar, raising some questions about the fundamentals. However, we have already said that there are no fundamental reasons for the growth of the British currency now. There are only technical reasons, which are bounces from the Murray level of "0/8" - 1.3184 on the 4-hour timeframe, as well as from the 38.2% Fibonacci level on the 24-hour timeframe. Thus, at this time, the pound/dollar pair continues to be located above the moving average line, and the lower channel of linear regression has long been directed upwards. Based on this, we could conclude that the pair could continue to move up if it were not for the corrective status of the current movement. After all, the pair is now being adjusted against the previous drop by 700 points. Recall that a few weeks ago, we warned that we were waiting for an upward movement of 400-500 points. Why is perfectly visible on the 24-hour TF, because all the movement of the pair last year is constant and deep corrections against the main movement, which is also corrective against the trend of 2020. Thus, we believe that purchases remain appropriate now, but right now, there are few grounds for further growth of the pound. It can continue to grow only in one case: if the majority of market participants have already played the factor of tightening the Fed's monetary policy, thanks to which the dollar showed steady growth in the second half of 2021. However, it will not be possible to predict whether this is the case, for obvious reasons. Therefore, we need to continue paying increased attention to technical analysis. The political ratings of Boris Johnson and the Conservatives continue to fall into the abyss. Throughout the entire period of Boris Johnson's rule, we have repeatedly raised this topic. In principle, the British Prime Minister almost from the first day in the office began to give reasons to talk about his early resignation or a vote of no confidence. Recall that at the very beginning, Johnson simply blocked the work of Parliament so that it would not interfere with him to implement a "hard" Brexit, substituting the Queen of Great Britain along the way, who approved the shutdown of Parliament at Johnson's request. This was followed by several different dark stories, scandals involving Boris Johnson, as well as the government's failed actions at the beginning of the coronavirus pandemic. Johnson was publicly criticized by his retired chief adviser Dominic Cummings, and there is nothing to say about the opposition. In the past few months, it has become clear that one of the members of the government participated in various schemes to promote his financial interests, and Johnson publicly defended him. The story of the government Christmas parties the year before last also surfaced, when the whole country was in a "hard lockdown", and people were forbidden even to visit relatives. As a result, the Conservatives lost the by-election in the North Shropshire constituency. In the district where they have been winning for the last 200 years. Although this defeat does not change the balance of power in Parliament, where the Conservatives still have an advantage of about 80 votes, many consider this event a landmark. And the elections in North Shropshire just happened because of the resignation of Owen Patterson, who lobbied for his interests too zealously. According to British experts, the defeat in the district in the West of England suggests that Boris Johnson is losing the trust of voters, and with him, the Conservative Party is losing popularity. Many believe that such a drop in ratings may even force the Conservatives to try to replace their leader. In addition, just before the New Year, David Frost, who led the Brexit negotiations, resigned, finally stating that he did not agree with the policy that Boris Johnson oppresses. Polls among the British population are also not on the side of the Prime Minister. Most Britons don't approve of the way Brexit is going. Most Britons do not believe that Boris Johnson will remain in office even until the end of 2022.
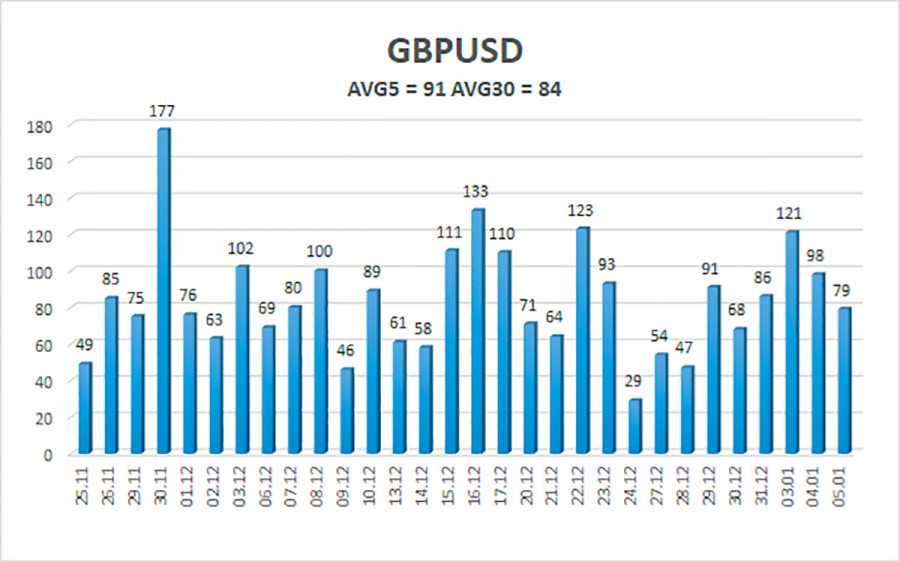
The average volatility of the GBP/USD pair is currently 91 points per day. For the pound/dollar pair, this value is "average". On Thursday, January 6, we expect movement inside the channel, limited by the levels of 1.3503 and 1.3685. The reversal of the Heiken Ashi indicator downwards signals a round of downward correction. Nearest support levels: S1 – 1.3550 S2 – 1.3489 S3 – 1.3428 Nearest resistance levels: R1 – 1.3611 R2 – 1.3672 R3 – 1.3733 Trading recommendations: The GBP/USD pair continues a strong upward movement on the 4-hour timeframe. Thus, at this time, stay in the longs with targets of 1.3611 and 1.3672 until the Heiken Ashi indicator turns down. It is recommended to consider short positions if the pair is fixed below the moving average with targets of 1.3428 and 1.3367, and keep them open until the Heiken Ashi indicator turns upwards. Explanations to the illustrations: Linear regression channels - help determine the current trend. If both are directed in the same direction, then the trend is strong now. Moving average line (settings 20.0, smoothed) - determines the short-term trend and the direction in which trading should be conducted now. Murray levels - target levels for movements and corrections. Volatility levels (red lines) - the likely price channel in which the pair will spend the next day, based on current volatility indicators. CCI indicator - its entry into the oversold area (below -250) or into the overbought area (above +250) means that a trend reversal in the opposite direction is approaching. The material has been provided by InstaForex Company - www.instaforex.com |
| Posted: 05 Jan 2022 06:49 PM PST
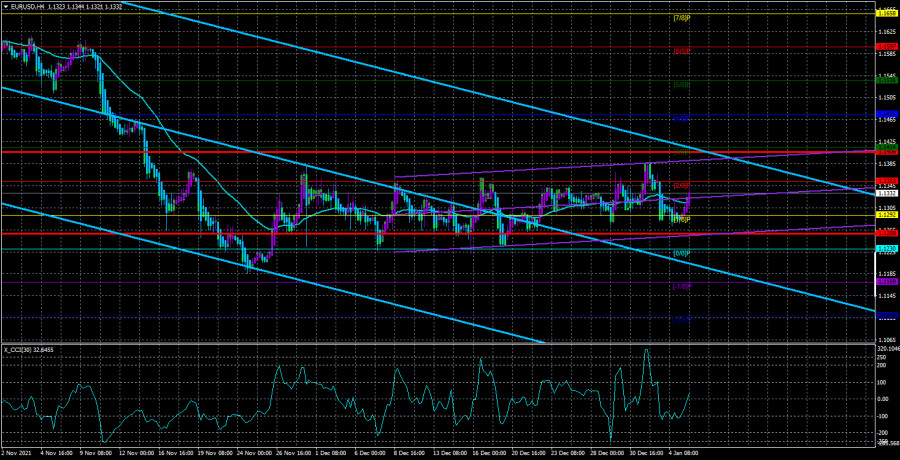
The EUR/USD currency pair continued to trade very calmly on Wednesday and inside the side channel, which we have been constantly talking about in recent weeks. The problem is that the pair cannot leave this channel in any way (1.1230 - 1.1353). Over the past month, there have been only two attempts to get out of it and both failed. Thus, although there is a minimal upward slope, the price remains flat. This flat is perfectly visible in the illustration above. Even without the lower linear regression channel, which just shows the lateral direction with a minimal, purely formal upward slope. Thus, from a technical point of view, nothing changes for the euro/dollar pair. Unfortunately, the flat can last as long as you want. Therefore, it is hardly possible to conclude that it will be completed in the next week or two. By the way, for it to end, it may not even require a strong fundamental or macroeconomic background. It often happens that at some certain moment the price comes out of the flat and this is not preceded by any important event. That is, even important events and publications are not very easy to focus on. This week, a Nonfarm Payrolls report will be published, which may contribute to the pair's exit from the side channel. However, this does not mean that it will be so. Pay attention to the movement of the pair at the very beginning of this channel, as well as in its middle. In the beginning, the last Nonfarm Payrolls report was published, and in the middle, the results of the ECB and Fed meetings were summed up. That is, even such important events could not affect the current flat. Thus, now we just have to wait for the price to leave the specified range. Omicron remains a key topic in the foreign exchange market. But at the same time, it does not affect the movement of the pair in any way. As we have already said more than once, the topic of the next "wave" of the pandemic itself cannot be insignificant. Moreover, it is during this "wave" that anti-records of morbidity are updated almost every day in many countries of the world. In the States, the day before yesterday, a fantastic figure of 1 million diseases was achieved in one day. Recall that during the first "waves" it was believed that 200-300 thousand diseases per day would lead to a complete collapse of the medical system. However, we are already seeing a million infections per day, but because the course of the disease with omicron is much easier than with other strains, no one (practically) sounds the alarm about this. In the States, the government takes only local measures to contain the "coronavirus". A similar situation is observed in the UK and many EU countries. Thus, the markets are waiting for macroeconomic statistics in January and February to see how negative the consequences for the economy from the next "wave" will be. Most likely, it is by these "consequences" that they will judge and make trading decisions based on them. Already, this Friday a report on Non-farms will be published, which will allow us to conclude how much the situation on the labor market in the United States has deteriorated by the end of December. Recall that at the end of November, Non-farm also disappointed traders, and meanwhile the dollar continues to trade in pairs with the euro near its annual highs. That is, the market now finds no reason to buy the euro and sell the dollar. Perhaps the situation will change if Nonfarms are weak again. Perhaps the situation will change after the next Fed meeting, which will be held at the end of this month. In any case, to conclude the possible end of the downward trend (formally, it has not yet been completed), we need something that will support the euro and put pressure on the dollar.
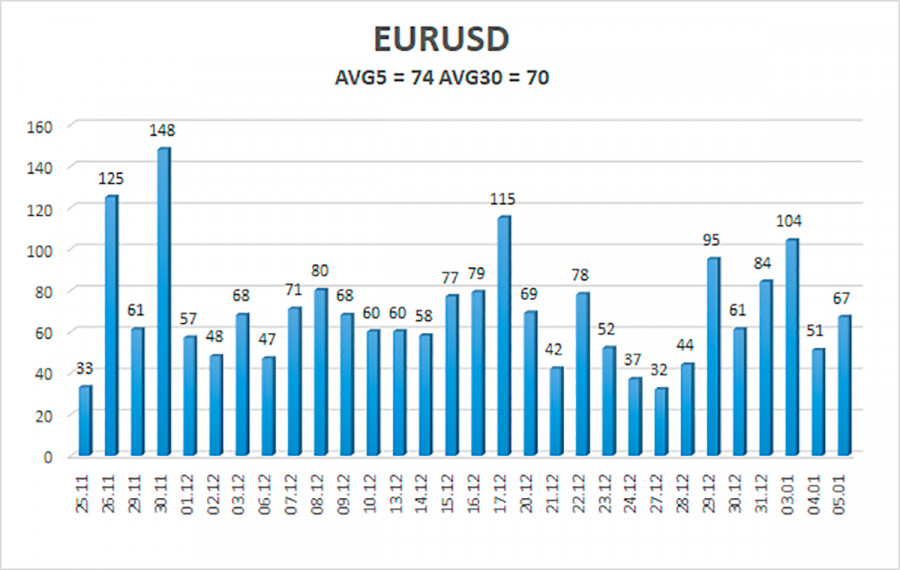
The volatility of the euro/dollar currency pair as of January 6 is 74 points and is characterized as "average". Thus, we expect the pair to move today between the levels of 1.1258 and 1.1406. The reversal of the Heiken Ashi indicator downwards signals a new round of downward movement in the limited range of 1.1230 - 1.1353. Nearest support levels: S1 – 1.1292 S2 – 1.1230 S3 – 1.1169 Nearest resistance levels: R1 – 1.1353 R2 – 1.1414 R3 – 1.1475 Trading recommendations: The EUR/USD pair continues to be located inside the 1.1230 - 1.1353 channel. Thus, the movement now remains as lateral as possible and inconvenient for trading. We expect that a downward reversal and a new round of downward movement may occur today. It is good if it will be preceded by a rebound from 1.1353. When overcoming the level of 1.1353, you can try small purchases, but there is no guarantee of a further hike up. The target is 1.1406. Explanations to the illustrations: Linear regression channels - help determine the current trend. If both are directed in the same direction, then the trend is strong now. Moving average line (settings 20.0, smoothed) - determines the short-term trend and the direction in which trading should be conducted now. Murray levels - target levels for movements and corrections. Volatility levels (red lines) - the likely price channel in which the pair will spend the next day, based on current volatility indicators. CCI indicator - its entry into the oversold area (below -250) or into the overbought area (above +250) means that a trend reversal in the opposite direction is approaching. The material has been provided by InstaForex Company - www.instaforex.com |
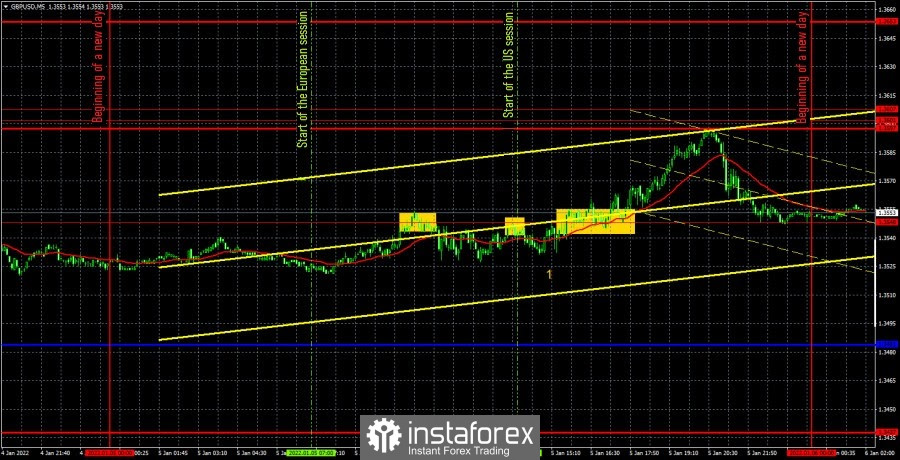
| Posted: 05 Jan 2022 06:36 PM PST GBP/USD 5M
The GBP/USD pair moved as sluggishly and incomprehensibly as possible on Wednesday. A more or less strong movement began only towards the end of the evening. The volatility of the day was about 70-80 points. Unfortunately, the normal movement began only in the evening, and all three signals were formed around the same level, indicating a flat during the day. Of the macroeconomic events, we can note the ADP report on the change in the number of employees in the US private sector, which had no effect on the dollar. Meanwhile, the calendar of macroeconomic events was completely empty in Great Britain. And to say that with such volatility, the pair was influenced by the "foundation", does not work in any case. All that remains is to analyze the trading signals. The first signal – for short positions - was formed when the price bounced from the extreme level of 1.3548 in the European trading session. The pair failed to go down even 20 points after its formation and returned to the level of 1.3548 twice. In the first case, there was a rebound from it, which enabled us to stay in short positions, in the second case, the pair surpassed it, so short positions had to be manually closed . The loss was about 20 points. The long position should not have been opened, since it became clear that the pair was moving with low volatility at the beginning of the US trading session, and there was no trend movement. We recommend you to familiarize yourself: Overview of the EUR/USD pair. January 6. The market awaits Nonfarms on Friday. The euro expects a weak December value. Overview of the GBP/USD pair. January 6. Boris Johnson risks leaving his post before the end of this year. Forecast and trading signals for EUR/USD for January 6. Detailed analysis of the movement of the pair and trade deals. GBP/USD 1H
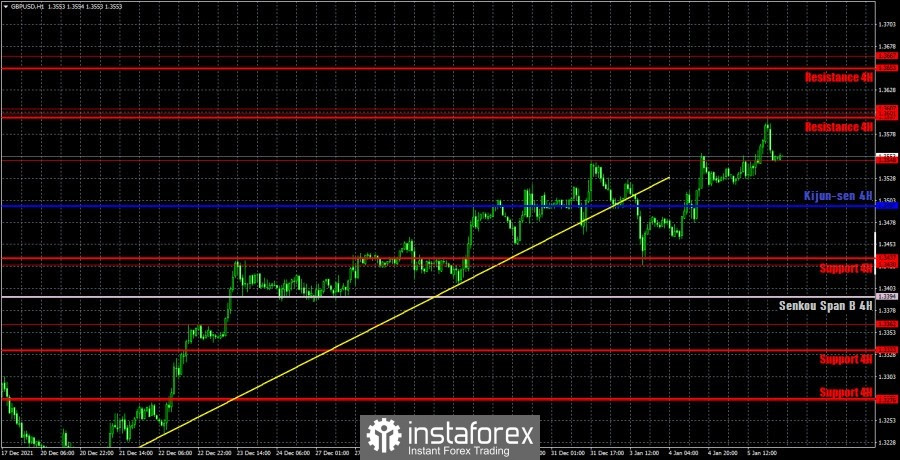
On the hourly timeframe, the pound/dollar pair resumed the upward trend despite the fact that it had previously overcome the upward trend line, and despite the fact that yesterday's movement was as vague as possible. Nevertheless, it surpassed the level of 1.3548, which opens the way for the British currency to new heights. Recall that in recent weeks, the pound has risen quite well, but at the same time it had no fundamental reasons for growth. Consequently, the fall can still start at almost any moment. We need to be ready for this. We have rebuilt the rising trend line so that it supports the upward movement again, but a new consolidation below it will significantly increase the probability of a sharp fall for the pair. We highlight the following important levels on January 6: 1.3430, 1.3548, 1.3601-1.3607, 1.3667. The Senkou Span B (1.3394) and Kijun-sen (1.3497) lines can also be signal sources. Signals can be "rebounds" and "breakthroughs" of these levels and lines. It is recommended to set the Stop Loss level to breakeven when the price passes in the right direction by 20 points. The lines of the Ichimoku indicator can move during the day, which should be taken into account when determining trading signals. The UK is set to publish the index of business activity in the service sector on Thursday, which has very little chance of influencing the pair's movement. In America, we can only note the ISM business activity index in the service sector. Explanations for the chart: Support and Resistance Levels are the levels that serve as targets when buying or selling the pair. You can place Take Profit near these levels. Kijun-sen and Senkou Span B lines are lines of the Ichimoku indicator transferred to the hourly timeframe from the 4-hour one. Support and resistance areas are areas from which the price has repeatedly rebounded off. Yellow lines are trend lines, trend channels and any other technical patterns. Indicator 1 on the COT charts is the size of the net position of each category of traders. Indicator 2 on the COT charts is the size of the net position for the non-commercial group. The material has been provided by InstaForex Company - www.instaforex.com |
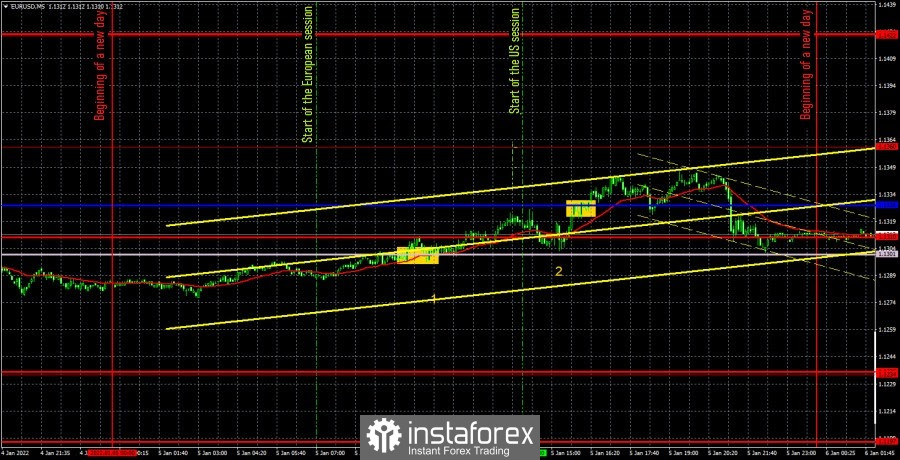
| Posted: 05 Jan 2022 06:28 PM PST EUR/USD 5M
The EUR/USD pair began a new round of upward movement within the same 1.1234-1.1360 horizontal channel on Wednesday. Thus, during the course of the environment, it moved to the upper region of this channel again. However, what will happen this time? Another rebound from the upper border or surpassing and forming a new upward trend? So far, we can only draw one conclusion: the pair continues to trade in a flat. Thus, trading on almost any timeframe is very difficult. The 5-minute chart clearly shows that the intraday movement was trending, but the overall volatility was about 70 points. Not much and not enough. Basically, in recent weeks, the pair has shown a fairly good movement, but still inside the horizontal channel. A more or less important ADP report on changes in the number of workers in the private sector was published in the US yesterday. But despite the fact that the actual value exceeded the forecast almost twice, the US dollar did not receive any support from the markets (figure "2" in the chart). The number "1" marks the time when the index of business activity in the service sector of the European Union was published, which had even less chance of being a proven market. Accordingly, none of the planned reports had any effect on the pair's movement. All that remains is to deal with trading signals. The first of them - to buy - was formed when the pair crossed the Senkou Span B line. Subsequently, the upward movement continued, and the price also crossed the critical line. A sell signal was never formed during the day, so the long position should have been manually closed in the late afternoon. By this time, the price was able to go up 28 points. Also, traders could have had Stop Loss triggered at breakeven for a single deal, since the price dropped back to the Senkou Span B line, but in this case, new longs should have been opened by rebounding from this line (the margin of error is only 1 point). We recommend you to familiarize yourself: Overview of the EUR/USD pair. January 6. The market awaits Nonfarms on Friday. The euro expects a weak December value. Overview of the GBP/USD pair. January 6. Boris Johnson risks leaving his post before the end of this year. Forecast and trading signals for GBP/USD for January 6. Detailed analysis of the movement of the pair and trade deals. EUR/USD 1H
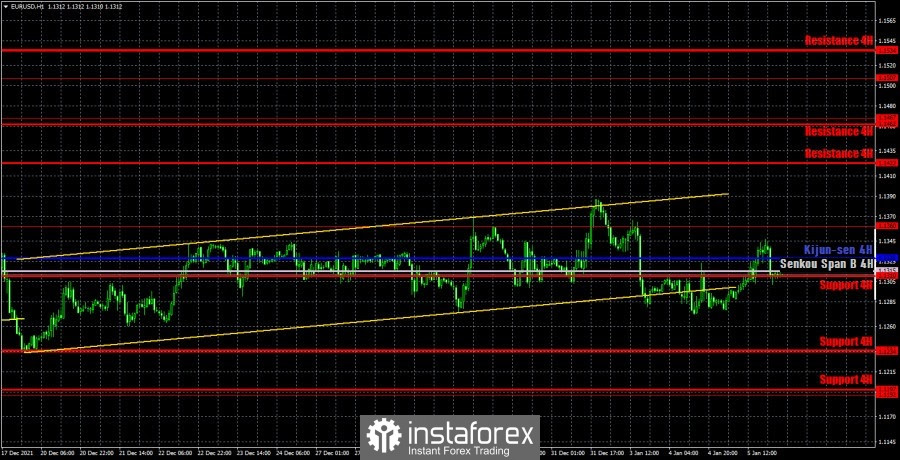
On the hourly timeframe, the pair dropped below the rising channel the day before yesterday, so it was immediately cancelled. But the pair continues to remain inside the horizontal channel, limited by the levels of 1.1234 and 1.1360. At this time, the price is not far from the upper limit of it, but even overcoming it does not guarantee that the euro will continue to rise. The movement is now as horizontal as possible, but with a slight upward slope. There is no clear trend or trend. We allocate the following levels for trading on Thursday - 1.1192, 1.1234, 1.1360, 1.1422, as well as the Senkou Span B (1.1315) and Kijun-sen (1.1328) lines. The lines of the Ichimoku indicator may change their position during the day, which should be taken into account when searching for trading signals. Signals can be "rebounds" and "breakthroughs" of these levels and lines. Do not forget about placing a Stop Loss order at breakeven if the price moves 15 points in the right direction. This will protect you against possible losses if the signal turns out to be false. You should also take into account the fact that flat is very likely now again, so the lines of the Ichimoku indicator are weak. No important report in the European Union on Thursday. Only an absolutely secondary report on applications for unemployment benefits will be released in the US, as well as a more or less important index of business activity in the ISM services sector. It is the only one who can provoke a reaction from traders. Explanations for the chart: Support and Resistance Levels are the levels that serve as targets when buying or selling the pair. You can place Take Profit near these levels. Kijun-sen and Senkou Span B lines are lines of the Ichimoku indicator transferred to the hourly timeframe from the 4-hour one. Support and resistance areas are areas from which the price has repeatedly rebounded off. Yellow lines are trend lines, trend channels and any other technical patterns. Indicator 1 on the COT charts is the size of the net position of each category of traders. Indicator 2 on the COT charts is the size of the net position for the non-commercial group. The material has been provided by InstaForex Company - www.instaforex.com |
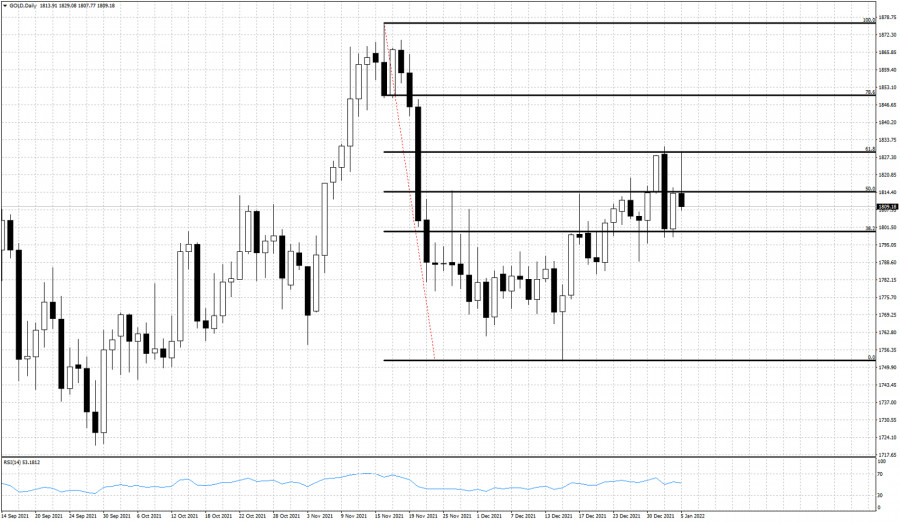
| Gold's rejection and bearish Daily candle. Posted: 05 Jan 2022 01:56 PM PST Gold price reached as high as $1,829 earlier today but bulls not only were unable to break the recent highs resistance, but price turned lower than yesterday's close, providing us with a bearish reversal candlestick.
Gold price got rejected for the second time at the 61.8% Fibonacci retracement. Today's price action confirms the importance of the $1,830 resistance level. Gold price formed a bearish reversal candle and if combined with a break below $1,797, then we will expect Gold to fall towards $1,750 and lower. Currently the chances favor Gold to continue lower. At current levels I prefer to be neutral Gold. The material has been provided by InstaForex Company - www.instaforex.com |
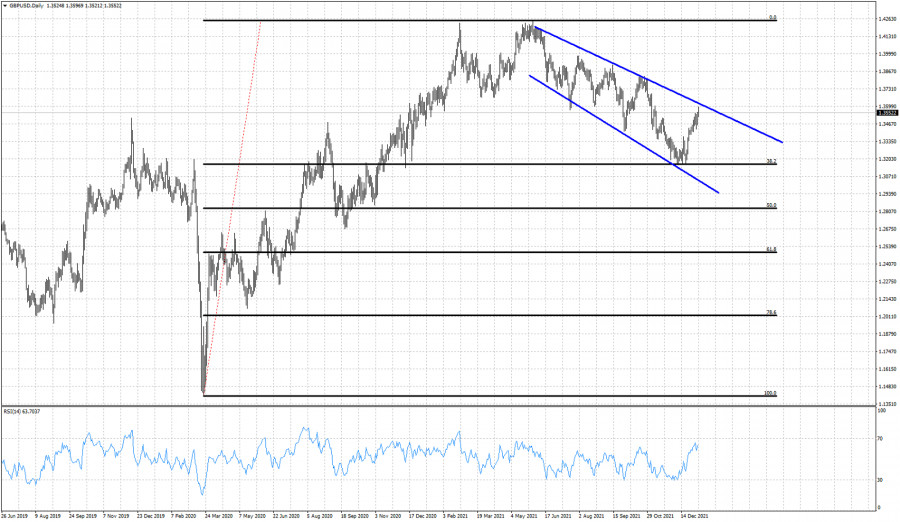
| Posted: 05 Jan 2022 01:49 PM PST GBPUSD has made an impressive bounce off the major 38% Fibonacci retracement at 1.3160 to 1.36. Price is making higher highs and higher lows and the near term. There is no sign of a reversal but bulls need to be cautious as price has reached important resistance area.
Blue lines- descending broadening wedge pattern GBPUSD is trapped inside the descending broadening wedge pattern and has now reached the upper wedge boundary resistance around 1.36. Will we see a rejection and a bearish reversal? As long as price is inside the wedge pattern we prefer to be sellers near the upper boundary and buyers near the lower boundary. This means that at 1.36 we prefer to be neutral if not bearish GBPUSD. The material has been provided by InstaForex Company - www.instaforex.com |
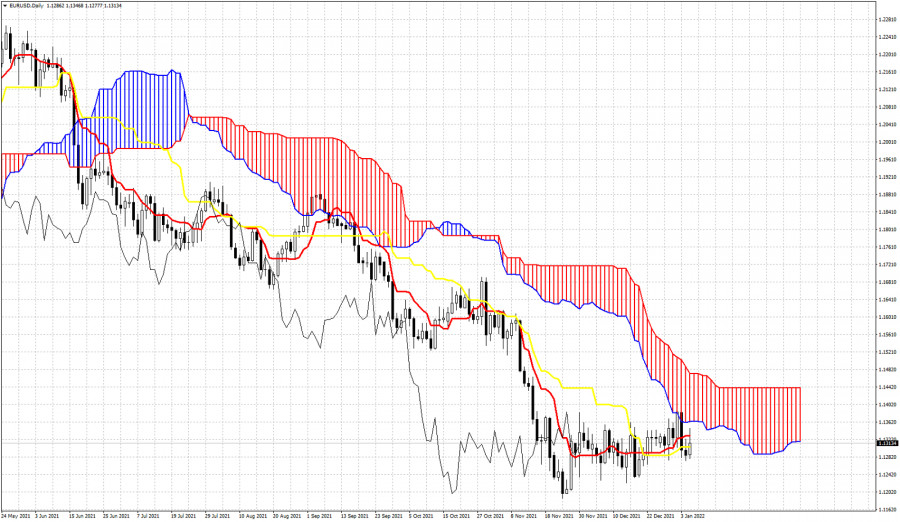
| Ichimoku cloud indicator analysis on EURUSD for January 5th, 2022. Posted: 05 Jan 2022 01:41 PM PST EURUSD is trading just above 1.13. Price continues to trade below the daily Kumo (cloud). This implies that the Daily trend remains bearish. Price recently got rejected at the Ichimoku cloud resistance at 1.1380-1.1390, where we find the lower cloud boundary. The inability to break into the cloud was a sign of weakness.
Price continues to trade sideways and bulls try to push price above the tenkan-sen and kijun-sen indicators. The Chikou span (black line indicator) is trying to stay above the candlestick pattern. In general there are signs of a pause in the down trend, but there is no sign of a reversal yet. Failure to stay above 1.13 will be a bearish sign and could lead EURUSD to new lows towards 1.1150. Bulls need to break above 1.1390 in order to at least change trend to neutral. The material has been provided by InstaForex Company - www.instaforex.com |
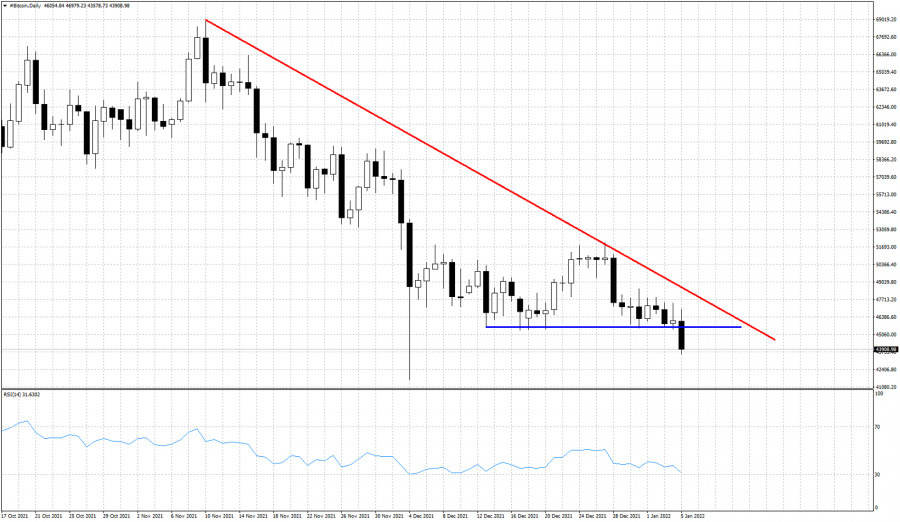
| Bitcoin provides another bearish signal. Posted: 05 Jan 2022 01:36 PM PST Bitcoin was vulnerable to a move towards $40,000 as we so many times mentioned in our analysis. The inability to break above $52,000 combined with the break of the horizontal support, leads price lower.
Blue line -support (broken) Bitcoin has broken the short-term support at $45,000 and is now challenging the December sell off lows at $41,640. As long as price is below the red downward sloping trend line, we remain pessimistic for Bitcoins future. Bulls need to break above the red resistance trend line in order to make at least a relieve bounce. Bitcoin currently has the potential of breaking below $40,000. Next key support level is at $38,000. The material has been provided by InstaForex Company - www.instaforex.com |
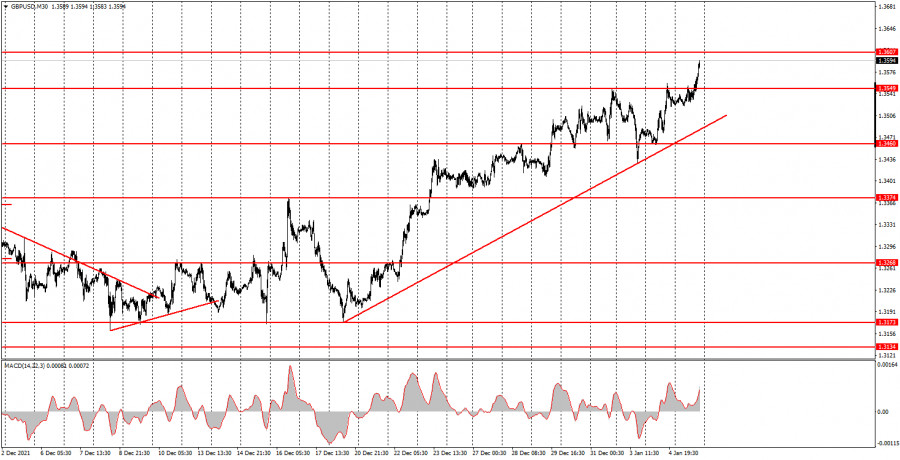
| How to trade GBP/USD on January 6? Simple tips for beginners. The pound continues its strong growth Posted: 05 Jan 2022 01:25 PM PST Analysis of previous deals: 30M chart of the GBP/USD pair
The GBP/USD pair continued its upward movement on Wednesday. Unfortunately, the pair showed an absolutely indistinct movement for most of the day and only resumed its growth by the end of the day. The upward trend line that the pair crossed a couple of days ago is now rebuilt as the upward trend has resumed. In principle, both major currency pairs showed growth during the day, but the pound stood in one place during the day, which is clearly seen in the chart below. Thus, trading today was not very successful, which we will discuss below. In the meantime, it should be noted that macroeconomic data has absolutely nothing to do with today's fall in the US currency. The single most important report of the day - the ADP report on the number of employed in the US private sector - turned out to be twice as strong as forecasted, so it should have provoked a rise in the dollar, not its fall. The publication of the Federal Reserve minutes - formally also a significant event - will take place only in half an hour. Thus, either the dollar fell "in advance," on negative market expectations, or it was a purely technical fall. 5M chart of the GBP/USD pair
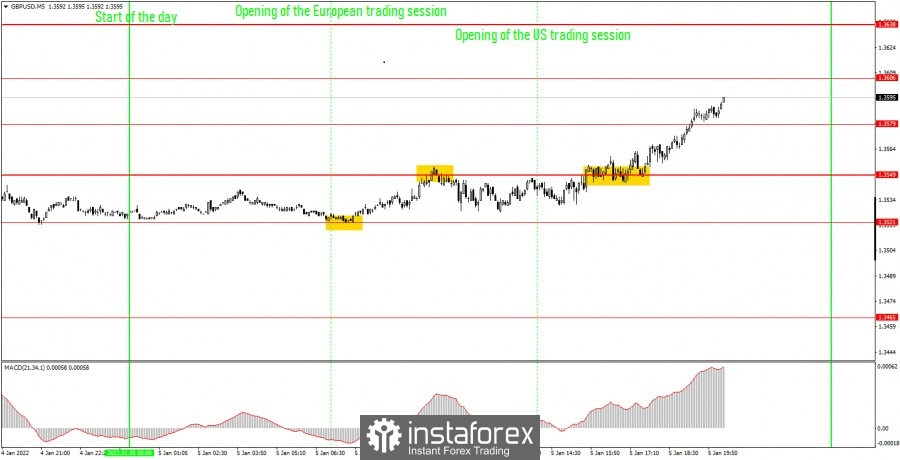
The movement of the pound/dollar pair on the 5-minute timeframe looks quite strange. The problem is that in the Asian, European and half of the US session, the movement was rather weakly volatile and as horizontal as possible. It was only in the second half of the US trading session that a fairly strong upward movement began, which was not provoked by any fundamental or macroeconomic events. Nevertheless, newcomers could get a certain profit today. The first buy signal was formed at the very beginning of the European session. The price rebounded from the level of 1.3521, so at this moment it was necessary to open long positions. However, a sell signal was already formed near the 1.3549 level, so longs should be closed on a rebound from this level and short positions should be opened. The profit was about 10-15 points. The short position did not bring proper profit to novice traders, as the price could not fall to the level of 1.3521. And in the US trading session, the price settled above the level of 1.3549, so we had to close the deal at a loss of 16 points. But new longs should have been opened immediately. The upward movement continued after that, the price overcame the level of 1.3579, so it was possible to earn about 30 points of profit on the last transaction by closing it manually in the late afternoon. How to trade on Thursday: The upward trend has recovered on the 30-minute TF, a new upward trend line has been formed. Therefore, longs on this TF are relevant again at this time. On the 5-minute TF tomorrow, it is recommended to trade by levels 1.3521, 1.3549, 1.3579, 1.3606, 1.3638. The price can rebound from these levels, or it can overcome them. As before, we set Take Profit at a distance of 40-50 points. On the 5M TF, you can use all the nearest levels as targets, but then you need to take profit, taking into account the strength of the movement. When passing 20 points in the right direction, we recommend setting the Stop Loss to breakeven. No interesting events and publications are expected in the UK during tomorrow. There will be only one important report in the US – the ISM business activity index in the service sector. It may be followed by a market reaction. On the chart: Support and Resistance Levels are the Levels that serve as targets when buying or selling the pair. You can place Take Profit near these levels. Red lines are the channels or trend lines that display the current trend and show in which direction it is better to trade now. The MACD indicator (14, 22, 3) consists of a histogram and a signal line. When they cross, this is a signal to enter the market. It is recommended to use this indicator in combination with trend lines (channels and trend lines). Important speeches and reports (always contained in the news calendar) can greatly influence the movement of a currency pair. Therefore, during their exit, it is recommended to trade as carefully as possible or exit the market in order to avoid a sharp price reversal against the previous movement. Beginners on Forex should remember that not every single trade has to be profitable. The development of a clear strategy and money management are the key to success in trading over a long period of time. The material has been provided by InstaForex Company - www.instaforex.com |
| Posted: 05 Jan 2022 01:25 PM PST
Bukele and Salvador have completely changed the face of their economy due to the introduction of bitcoin into their financial system. Bukele is sure that in the near future fiat will completely disappear from circulation, the dollar will completely devalue, and bitcoin will become a real spark that will ignite a real financial revolution around the world. Salvadoran President Nayib Bukele is confident that the world has not yet fully felt the full power and dominance of bitcoin, and as soon as this happens, it will be a test shot for fiat. El Salvador is the first country to adopt bitcoin as an official means of payment. At first, they received a lot of skeptical and spiteful responses from the International Monetary Fund. Many analysts called El Salvador a country with zero prospects. However, soon all criticism subsided. Despite the fact that the IMF has repeatedly reminded El Salvador of the legality of making a decision regarding bitcoin, as well as that the country's financial investments that are converted into bitcoin are an unthinkable waste of taxpayer money earned, El Salvador will not change its decision. Despite the criticism and warnings of the IMF, saying that this could cause irreparable damage to the country's economy, depositors and consumers of the country, El Salvador still continues to buy bitcoins. They also want to build their bitcoin city, make the country a real mecca of the number one cryptocurrency. The IMF recommends that the President of El Salvador review the law on the adoption of bitcoin as a legal means of payment, narrow its scope and make minor adjustments to it. The IMF also insistently suggests that El Salvador strengthen the regulation of the number one cryptocurrency. The IMF strongly wants to reproach El Salvador and convince the country that they made the wrong decision. The IMF sees bitcoin as a serious threat to the dollar, and they are trying in every way to whitewash fiat and drown bitcoin. The material has been provided by InstaForex Company - www.instaforex.com |
| Europe runs the risk of being left without gas in March Posted: 05 Jan 2022 01:25 PM PST
Gas reserves in the European Union are currently at an all-time low. According to the global energy research group Wood Mackenzie, the level of gas reserves in European storage facilities is at risk of falling to a historic low this spring. In other words, in the next two months, in the event of record frosts, European countries are likely to remain without gas. The cost of February gas futures on the ICE Futures platform slightly rises, namely by 3.4%, to $1,072 per 1 thousand cubic meters. Europe is currently in the stage of energy transition, when coal-fired power plants are being actively closed. However, the climate agenda and the pursuit of environmental friendliness increases the dependence of the euro region on renewable energy sources, which this region cannot satisfy in sufficient amounts of energy, especially on a permanent basis. For example, last year, the desire of European countries to follow the climate agenda and receive energy from wind and solar resulted in a sharp decline in electricity generation and further increased the dependence of the eurozone on oil-producing and "gas-supplying" countries. According to Bloomberg, gas storage facilities in Europe are currently only 56% full, which is 15% lower than the average over the past ten years. Wood Mackenzie experts predict that if Russia refuses to increase gas supplies by the end of March, the level of energy reserves in Europe will fall by another 15%. If this happens, the storage facilities of the eurozone in terms of the gas contained in it will be at the lowest level in history. Wood Mackenzie Vice President Massimo Di Odoardo admits that it will not be possible to avoid the predicted decline without Russia. The required level of gas reserves in Europe can be achieved only with the help of additional Russian supplies via the Nord Stream-2 pipeline or at least along the current routes. According to Di Odoardo, the coming year promises to be as unstable for European gas prices as the past one. In 2021, exchange prices for gas in Europe reached record levels several times. On December 21, the cost of fuel in European countries for the first time exceeded $2,000 per 1 cubic meter. Experts of the Fitch rating agency linked this price surge with a decrease in the pumping of Russian gas through the Yamal-Europe gas pipeline and with reports of a possible severe cold snap this winter in the eurozone. The reason for the increase in gas prices could also be the news about the launch of the Nord Stream-2 only in the second half of 2022. On December 30, the cost of gas dropped below $1,000 per 1 cubic meter. This was largely facilitated by the statements of the head of Gazprom Alexey Miller about the readiness of both branches of the Nord Stream-2 for operation. In addition, he added that the energy crisis in Europe is due to the fact that the European Commission abandoned long-term contracts at the time and gave preference to spot contracts. The drop in its own energy production against the background of the predicted cold winter, the current energy crisis is only aggravating. The material has been provided by InstaForex Company - www.instaforex.com |
| Inflation pressure eases in France, eurobank promises quick victory Posted: 05 Jan 2022 01:25 PM PST Francois Villeroy de Galhau, who is a current member of the Governing Council of the European Central Bank, expressed surprise at the strength of the surge in inflation in the euro area, and promised that prices are already close to their peak. Inflation pressure in France is decreasing, Eurobank promises an early victory Reports on consumer prices in France for December, published on Wednesday a little earlier, show the first signs of price stabilization. This served as the basis for the soothing rhetoric of the ECB. Recall that the New Year's address of the head of the French central bank, posted on the institution's website, contained promises that the "upward pressure" would disappear by 2022, the head of the French central bank promised in a New Year's address posted on the website of his institution. According to a separate study of confidence in the future among French households, the opinion of the latter is also optimistic and relies on a future decline in price growth in the coming months. "Inflation is now close to its peak in our country and in the euro area," Villeroy said on Tuesday. "While remaining vigilant, we believe that supply difficulties and pressure on energy carriers should gradually decrease over the course of the year." Of course, the urgency of inflation at the end of 2021 brought the Eurobank the long-awaited freedom of action in order to chart a course at the December meeting to abandon monetary stimulus of the economy. It is expected that the exit will begin with the expiration of the net asset purchase period under the central bank's emergency Covid-19 program. But experts are confident that price stabilization does not mean a change of policy and the course towards curtailing the "buns" regime will continue. In fact, Villeroy only repeated his forecast regarding the "new inflation regime", in which price growth will be closer to the ECB's target of 2% than in the years preceding the pandemic. According to him, on this basis, monetary policy will "gradually normalize". The chairman of the French central bank also ignored the threat of disruption of the omicron variant, saying that the economic effects would be "relatively limited." The Bank of France expects that even in an unfavorable scenario, worse than the current situation, by 2023 the economy will still return to the pre-crisis growth trajectory. "Over the past two years, we have learned that every wave of Covid, no matter how serious, has diminishing economic consequences," Villeroy said. It is difficult to disagree with him on this, as evidenced by the revival of air travel even after the news that the United States canceled more than 800 flights at the end of December. According to the monthly survey of purchasing managers published on Wednesday by IHS Markit, economic growth in the euro area slowed to a nine-month low in December. In addition, the price data showed significant inflationary pressure at the end of 2021. "Despite the slight easing of price pressures, we are still in an extremely hot zone - the increase in costs for both input and output goods was the second largest on record," said Joe Hayes, senior economist at IHS Markit. In fact, there are plenty of reasons to worry. Energy prices have reached highs. Italy reported on this effect today. And although gas prices in France are stabilizing, the harsh winter may force the southern regions to consume more gas and electricity. And price stabilization may be short-term. So far, the weather in the eurozone is pleasing, but energy prices remain five times higher than normal. In addition, in the new year, investors have clearly made Canada and Russia favorites for raw material opportunities, which pulls funds from the European zone. There is also a shortage of goods and services. And it risks rising due to a shortage of raw materials and workers if the economy continues to recover. Of course, this effect will be short-lived, but it is too early to say that inflation is behind us. Moreover, its indirect signs, such as the migration of workers, are growing. Against the background of the news, the FTSE 100 rose by 0.28%. FTSE 100 futures rose even more - by 0.32%, and EuroStoxx 50 futures added 0.75% at the end of the trading session. Probably, tomorrow's session will also be successful for the euro. The material has been provided by InstaForex Company - www.instaforex.com |
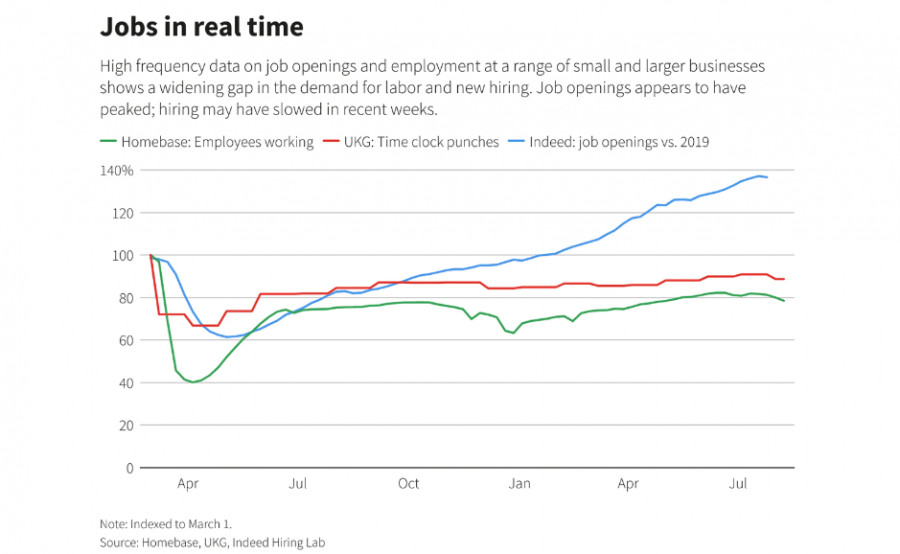
| December analytics showed mass migration of workers in the US Posted: 05 Jan 2022 01:25 PM PST The number of employees leaving their jobs, as well as the emerging trend towards a slowdown in hiring at large US enterprises in December may indicate that the current wave of coronavirus has still affected employers, experts say. December analytics showed a mass migration of workers to the United StatesAlthough the conclusions about the reasons are quite controversial, such a point of view on the labor market may prompt the Fed to conclude that lawmakers have squeezed the highest number of jobs out of the labor market. Further growth may slow down, especially against the background of the failure of the vote on the Biden infrastructure package, which promised about 200 thousand more jobs. However, back to the numbers. Hiring data tracked by hiring managers at Homebase and UKG showed a decline in the vacancy market over the last month of 2021. The reversal coincided with a record outbreak of coronavirus infection caused by the Omicron variant raging in most states. Data from both companies showed stronger seasonal declines last year, even compared to the difficult 2020. It is worth noting that employment in Homebase's sample of small businesses fell by about 15% in the last days of 2021, compared with about a 10% drop in 2021.
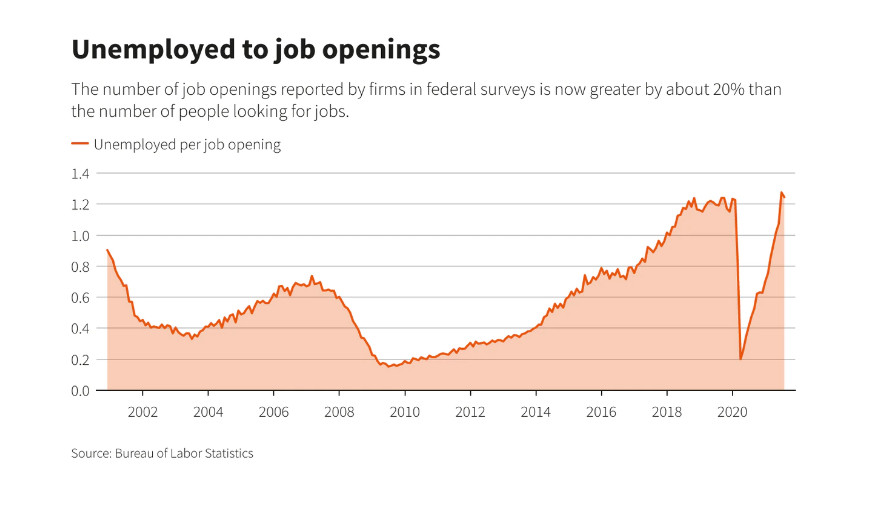
In UKG, the number of shift jobs in various industries decreased by 1.7% over the past month, compared with a drop of 0.3% over the same period last year and 0.8% in December 2019. "The data shows a strong downward shift that began in mid-December," wrote Dave Gilbertson, vice president of UKG. At the same time, new government data for November showed that workers are leaving positions on their own, especially low-paid ones. Also, the outflow is shown by positions related to contacts (administrative, representative, service) in the service sector, where health risks are considered more serious, and work options at home are less accessible. At the same time, the number of vacancies is still close to record levels, and consumer demand is breaking all records, despite, and perhaps even thanks to a wave of infections. Economists argue that this may reflect increased market pressure on companies to raise wages. And at the same time, it is a marker of increasing pressure on the Fed, in an attempt to ensure "the task of providing jobs to the population as close to completion as possible." Recall that the achievement of this goal is one of the factors that preceded the increase in interest rates by the US central bank. But in my opinion, it can rather be assumed that the Federal Reserve itself is putting pressure on the employment authorities in order to improve the indicators in all possible ways, so that it will make it possible to move to raising rates faster. So, at the Fed meeting on December 14-15, politicians indicated that, in their opinion, the key benchmark is already close. The minutes of this meeting are scheduled to be released today. It will contain more detailed information about the meeting at which the Fed began a targeted fight against inflation. Inflation is almost three times higher than the target rate of 2% per year, reaching an annual mark of 5.6%, so the legislators can understand. Even the president of the Minneapolis Fed, Neel Kashkari, who is known for his negative attitude to raising interest rates in the hope of stimulating job growth, admitted that at a meeting last month he outlined two rate hikes for 2022, partly because of doubts about how many people will want to return to work soon. "Wages are currently growing rapidly across different income categories," Kashkari wrote, explaining the dramatic change in his views on politics. "The labor market has not fully recovered from the COVID-19 shock... But it is unclear how long it will take for all previous workers to return. At least now it seems that the demand for workers exceeds the supply." Salaries are rising... whileBut not everything is so obvious. In 2020, it was the wave of coronavirus that forced the Fed to lower rates and create favorable conditions for business. Now the appeal to the new wave as the main reason for the migration of workers looks weak. It is more likely that workers leave their homes for higher salaries, which they are forced to do by the madness of inflation. And yet, the wave of Omicron infections is affecting the economy and the Fed, forcing manufacturers to reduce production volumes. For example, some analysts have cut their economic growth forecasts for 2022 as a result of the latest turn of the pandemic. However, not much has been cut, even considering the scale of infections, which now overshadow previous outbreaks. Probably, the reason is the increased demand for goods, noted at the end of November and since then only gaining momentum. The fact also plays a role that while the new option seems less dangerous - the number of deaths and hospitalizations does not increase as much as the number of cases. And, for example, data on air travel for December show that consumers are eager to get rid of restrictions and have more freedom. As a result, as of the end of November, there were more than 1.5 open jobs for every person who declared themselves unemployed - another record reflecting the labor market, where wage growth seems likely to continue, since workers are in short supply for various reasons. Either they quit because of better conditions, or because of higher wages, or due to illness, although there are sick days in case of illness.
"A large number of layoffs means a stronger bargaining position for workers, which is likely to lead to a significant increase in wages," said Nick Bunker, director of economic research at Indeed Hiring Lab, a division of the employment and recruitment website. "Wage growth was very strong in 2021... We may see even more in 2022." It probably is. At least because workers will want to compensate for the increase in inflation, which means that wages will nominally rise. However, this does not mean that real wages will also grow, especially since inflation is not uniform everywhere – it is higher in large cities. It is not necessary that American manufacturers will be more loyal to employees, especially against the background of the growth in the cost of raw materials and production costs. This is also indirectly indicated by the decline in real estate, which began in the United States in the second decade of December. As a result, we can conclude that most of the world's population will probably become poorer next year. And this means that sooner or later the labor market will reverse the trend, and competition for good jobs will intensify, and the workers' dictate regarding wages will disappear, which will further worsen the situation. However, this is a pessimistic scenario. It is also possible that the economy will traditionally recover in the spring and optimism will support the markets. In the meantime, we are monitoring the dynamics: on Friday, the US Department of Labor will publish a report on employment for December. The material has been provided by InstaForex Company - www.instaforex.com |
| Posted: 05 Jan 2022 12:54 PM PST
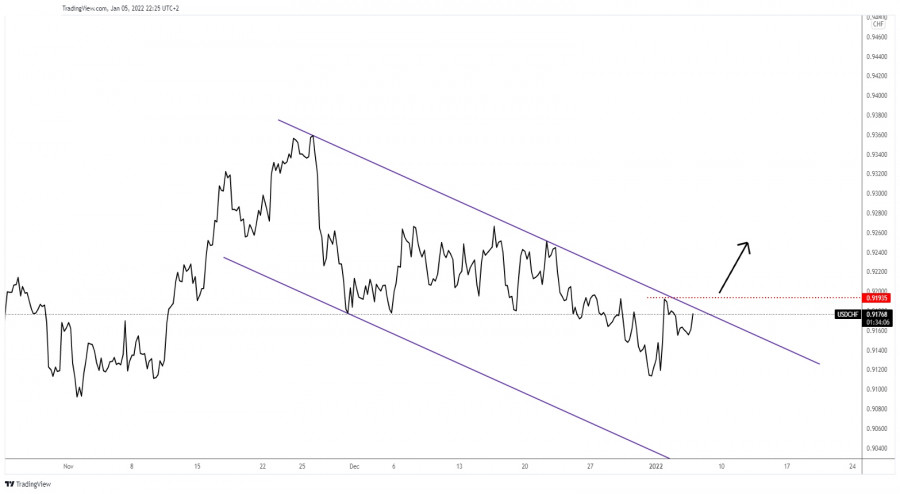
USD/CHF Upside Breakout?The USD/CHF pair continues to stay near the downtrend line, right below the down channel's upside line signaling that the buyers are very strong. Also, its failure to come back down towards the channel's downside line signaled that the sellers are exhausted. The pair is trading at 0.9176 level at the time of writing, way above 0.9155 today's low. Technically, the downtrend line and the 0.9193 former high are seen as upside obstacles. As long as the price stays under these levels, USD/CHF could drop again. USD/CHF Trading Conclusion!Staying near the downtrend line may annnounce and imminent breakout. Jumping and stabiilizing above the downtrend line and above the 0.9193 could activate an upside reversal. This scenario could also bring new buying opportunities. The material has been provided by InstaForex Company - www.instaforex.com |
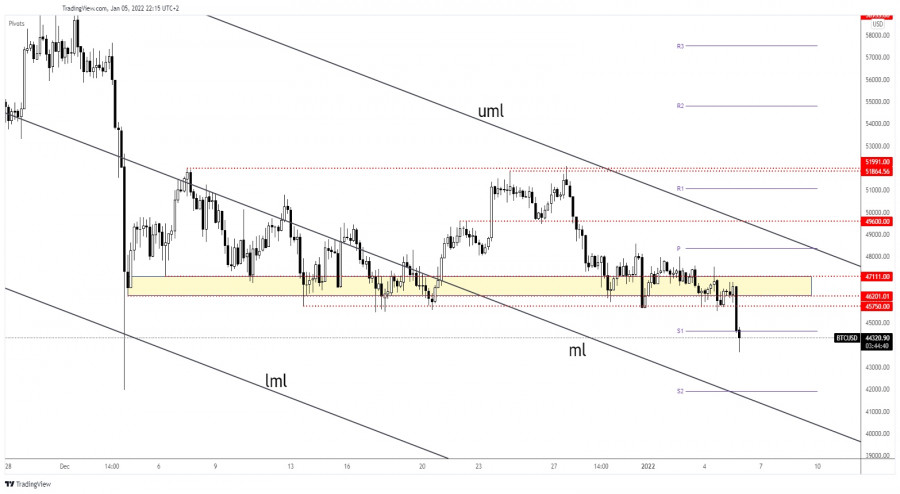
| Bitcoin accelerates its sell-off Posted: 05 Jan 2022 12:17 PM PST Bitcoin plunged in the last minutes reaching the 43,678.08 level. The crypto dropped by 6.79% from 46,855.06 today's high to 43,678.08 daily low. BTC/USD signaled strong sellers lately after the price failed to come back higher. The price of Bitcoin started to drop aggressively after the FOMC and after the Dollar Index has managed to erase some of today's losses. With the current sell-off, BTC/USD could open the door for a larger downside movement. Its massive drop could force the altcoins to drop as well. BTC/USD Sellers In Full Control!
As you already knew from my analyses, BTC/USD tested and retested the 47,111 - 46,201 support zone. Unfortunately, it has failed to print a bullish pattern signaling strong sellers. At the time of writing, BTC/USD dropped far below 45,750 critical support. The weekly S1 (44,636.72) was seen as a first downside obstacle. Bitcoin dropped below this static support, a valid breakdown below it may signal potential further drop. Afetr its failure to reach and retest the descending pitchfork's upper median line (uml), BTC/USD could be attracted by the median line (ml). BTC/USD Prediction!BTC/USD continued to pressure the 45,750 static support signaling an imminent downside breakout and a larger sell-off. After its current crash, we cannot exclude a temporary rebound. The price could come back to test and retest the broken support levels before resuming its downside movement. Stabilizing below the weekly S1 may announce that the sellers are in full control and that they could lead the rate towards fresh new lows. The material has been provided by InstaForex Company - www.instaforex.com |
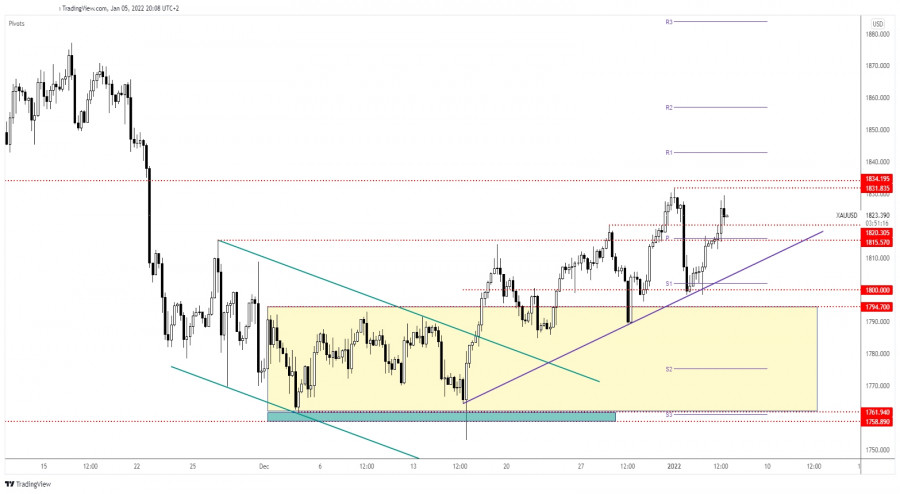
| Posted: 05 Jan 2022 10:38 AM PST The price of Gold rallied today as the Dollar Index has extended its sell-off. The yellow metal increased as much as 1829.63 level where it has found temporary resistance. The bias remains bullish after failing to invalidate a larger drop. XAU/USD registered a temporary correction and now it seems determined to climb towards new highs. Fundamentally, Gold accelerated its upwards movement after the US ISM Manufacturing PMI and the JOLTS job Openings reported worse than expected data yesterday. Today, the ADP Non-Farm Employment Change was reported at 807K far above 405K expected but Gold continues to stay higher as the DXY is still bearish. Later, the FOMC Meeting Minutes could really shake the markets and could bring sharp movements. This is seen as a high-impact event. A hawkish report could boost the USD, the Federal Reserve is expected to end its pandemic QE and to hike rates in the upcoming meeting. XAU/USD Strongly Bullish!
XAU/USD edged higher after registering a false breakdown with great separation below the 1800 psychological level and under the uptrend line. Now, it's located at 1,823.63 at the time of writing, above the 1,820.30 broken resistance. As long as it stays above this level and above the 1,815.57, XAU/USD could extend its upwards movement. 1,831.83 and 1,834.19 are seen as the next upside targets. After the amazing really, we cannot exclude a temporary decline or a consolidation. XAU/USD Forecast!A minor retreat on a sideways movement could announce a new bullish momentum and could bring new long opportunities. Anything could happen around the FOMC Minutes, so you have to be careful. A larger swing higher could be confirmed by a valid breakout above the 1,834.19 level. Personally, I would like to see a minor consolidation before resuming its upwards movement. The bias remains bullish as long as it stays above the uptrend line. The material has been provided by InstaForex Company - www.instaforex.com |
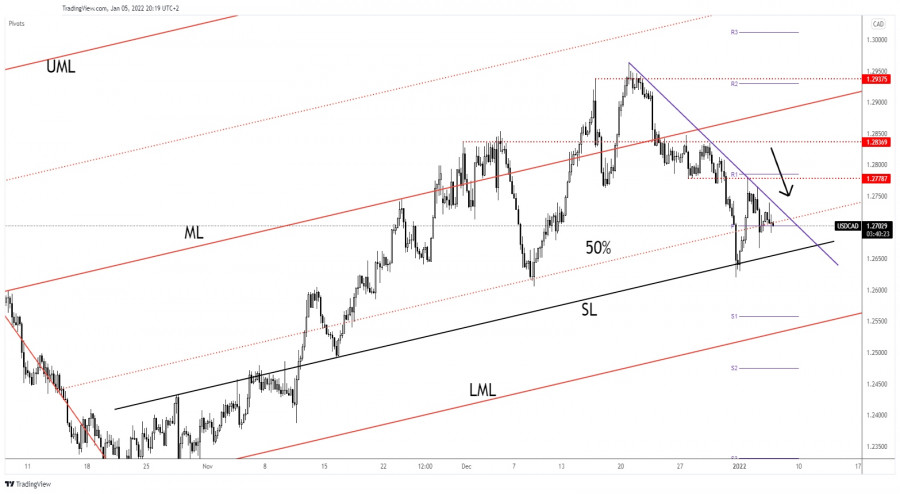
| USD/CAD: downside seems limited Posted: 05 Jan 2022 10:37 AM PST The USD/CAD pair is trading in the red at the 1.2702 level at the time of writing. The bias remains bearish as the Dollar Index has reached new lows today. As long as the DXY drops, the greenback could depreciate versus its rivals. Technically, the pair continues to stay below a downtrend line, so we cannot talk about an upwards movement at this moment. Surprisingly or not, the USD depreciated in the last hours even if the ADP Non-Farm Employment Change was reported at 807K in December versus 405K expected. On the other hand, the Canadian Building Permits and the NHPI came in better than expected. The FOMC Meeting Minutes could change the sentiment later. Maybe the USD drops a little ahead of this high-impact event only because the report could be bullish for the USD. The DXY maintains a bullish bias despite its current sell-off. USD/CAD Downtrend Still Intact!
USD/CAD tested and retested the downtrend line confirming it as a dynamic resistance. Now, it challenges the weekly pivot point of 1.2702 and the downside 50% Fibonacci line of the ascending pitchfork.As long as it stays under the downtrend line, USD/CAD could come back towards the inside sliding line (SL). Only a valid breakout above the downtrend line could signal that the downside movement is over. USD/CAD Prediction!The bias is bearish, so further drop is in cards. Still, don't forget that the FOMC Minutes could change the sentiment. DXY's rally could push USD/CAD above the downtrend line. As you can see on the H4 chart, the pair failed to come back down towards the 1.2620 low in the previous attempt announcing that the sellers could be exhausted. Only a valid breakout above the downtrend line could bring new buying opportunities and could announce a new leg higher. The material has been provided by InstaForex Company - www.instaforex.com |


| You are subscribed to email updates from Forex analysis review. To stop receiving these emails, you may unsubscribe now. | Email delivery powered by Google |
| Google, 1600 Amphitheatre Parkway, Mountain View, CA 94043, United States | |


Comments