Forex analysis review
Forex analysis review |
- USD/CAD major Head and Shoulders activated
- USD/JPY reached dynamic support, sell-off could be over
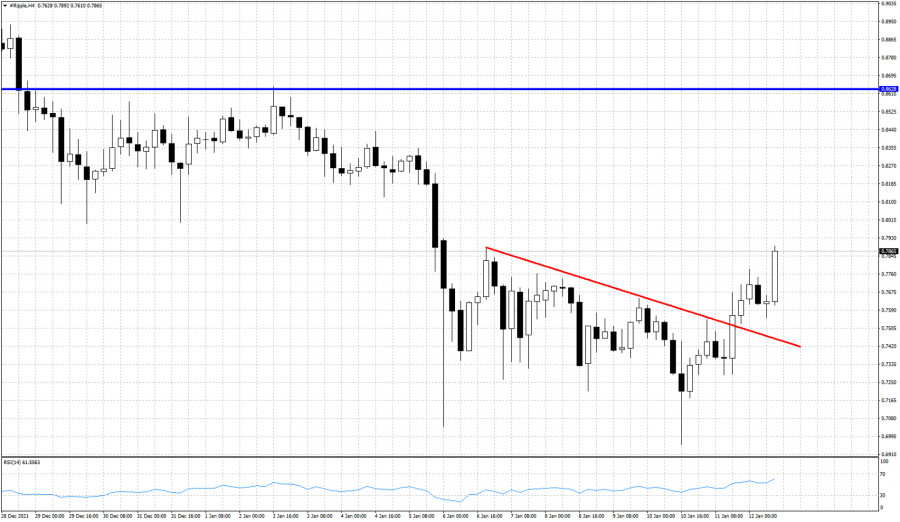
- How to trade GBP/USD on January 13? Simple tips for beginners. The upward trend for the pound continues
- EUR/USD. Alogy of the day: US inflation is rising, the dollar is falling
- How to trade EUR/USD on January 13? Simple tips for beginners. The euro has left its horizontal channel thanks to the US
- EUR/USD. While experts predict a bright future for the euro and equities, the dollar hopes the Fed will maintain its hawkish
- Technical analysis of GBP/USD for January 12, 2022
- EUR/USD upside reversal
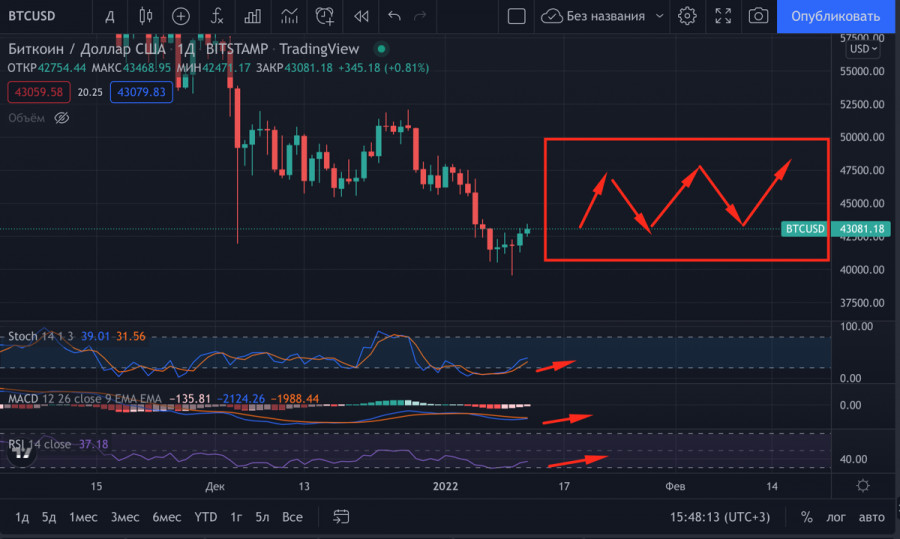
- Bitcoin breakout signals upside continuation
- January 12, 2021 : GBP/USD Intraday technical analysis and significant key-levels.
- January 12, 2021 : EUR/USD Intraday technical analysis and trading plan.
- January 12, 2021 : EUR/USD daily technical review and trading opportunities.
- Bitcoin rises as US inflation reaches 7%
- Oil overcomes Omicron fear and is trading above $80
- Trading signals for EUR/USD on January 12 - 13, 2022: sell in case of pullback at 1.1413 (3/8)
- BTC analysis for January 12,.2022 - Broken consolidation to the upside
- EUR/USD analysis for January 12, 2022 - Breakout of multi month consolidation to the upside
- Gold continues to trade above $1,800.
- XRPUSD could reach $0.85 soon.
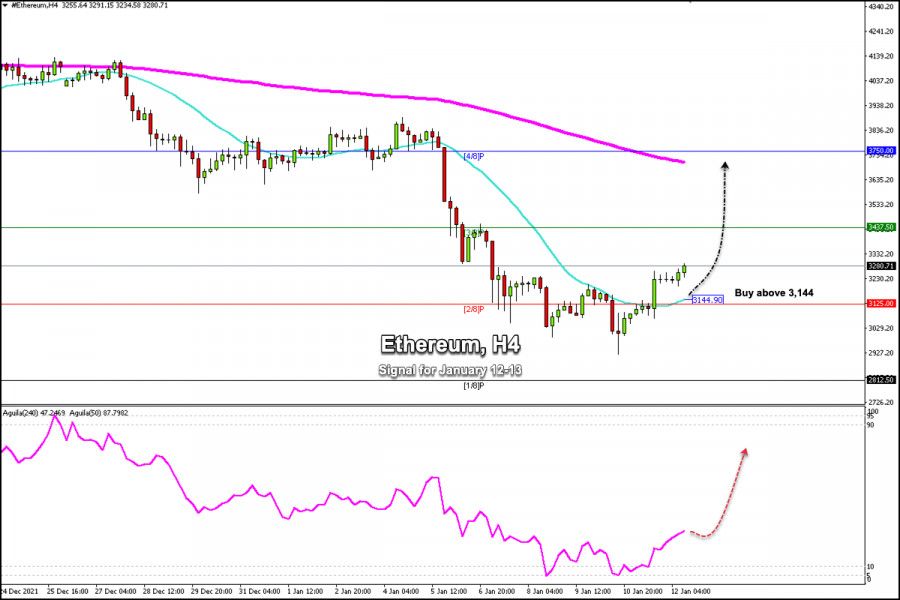
- Trading signals for Ethereum (ETH/USD) on January 12 - 13, 2022: buy above $3,144 (2/8 - 21 SMA)
- Video market update for January 12,,2022
- IMF believes bitcoin may trigger crisis in stock markets while Thailand is preparing bill to tax cryptocurrencies
- US premarket for January 12: December inflation in the US will not be a problem for the US stock market
- GBP/USD: the plan for the American session on January 12 (analysis of morning deals). The pound hovered in a narrow channel,
- EUR/USD: trading plan for North American session on January 12; analysis of morning trades. EUR looking for further direction
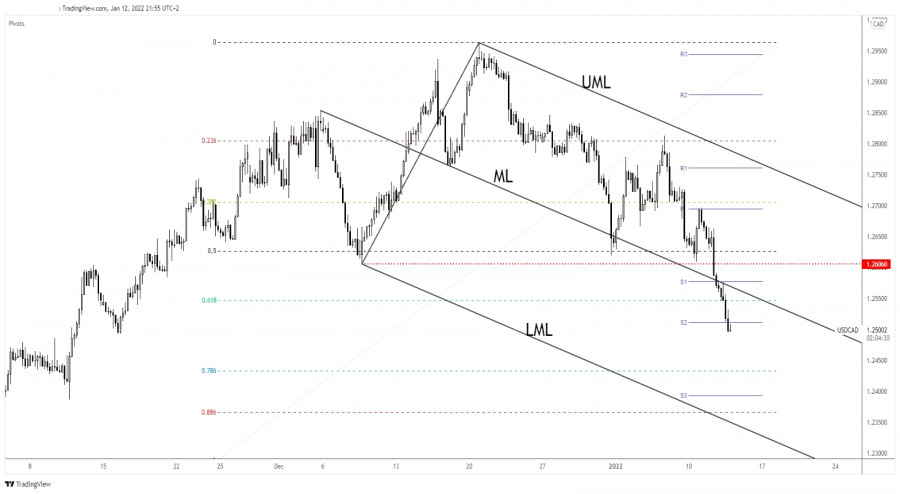
| USD/CAD major Head and Shoulders activated Posted: 12 Jan 2022 01:36 PM PST The USD/CAD pair plunged as the Dollar Index has registered a strong sell-off. The currency pair activated a major reversal pattern, a Head & Shoulders formation, so more declines are possible. In the short term, the pressure is high as the DXY failed to make new highs or to stay higher. The price extended its sell-off after the US inflation data publication. The CPI rose by 0.5% versus 0.4% expected, while the Core CPI registered a 0.6% growth versus 0.5% estimates. Higher than expected inflation reported by the US in December is not good for the currency. The inflationary pressure is bad for the economy. USD/CAD larger correction
The breakdown below the 1.2606 and through the Descending Pitchfork's median line (ML) activated a major Head & Shoulders pattern. The price retested the broken median line (ML) before taking out also the 61.8% retracement level. At the time of writing, it was traded at 1.2507 level right below the weekly S2 (1.2512) broken downside obstacle. As long as it's trapped below the Descending Pitchfork's median line (ML), the price could approach and reach fresh new lows. USD/CAD forecastThe major Head & Shoulder pattern indicates a larger downside movement. A temporary rebound could help the sellers to catch new short opportunities. After its amazing sell-off, a temporary bounce back is favored. The bias remains bearish as long as it stays under the median line (ML). The Descending Pitchfork's lower median line (LML) is seen as a major downside target. The material has been provided by InstaForex Company - www.instaforex.com |
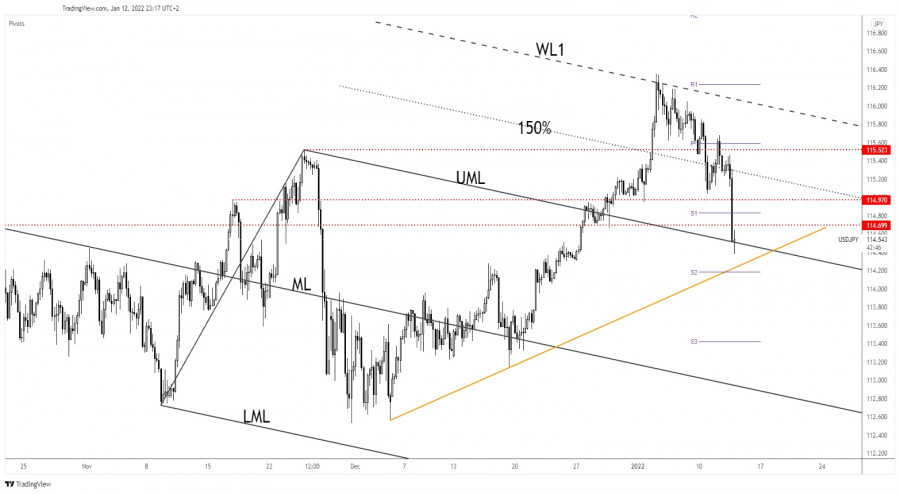
| USD/JPY reached dynamic support, sell-off could be over Posted: 12 Jan 2022 01:34 PM PST The USD/JPY pair dropped aggressively in the short term as the DXY plunged and the yen futures have managed to rebound. Technically, it has reached a downside target and now is fighting hard to rebound. Still, the pressure is high as the Dollar Index is strongly bearish after the US inflation data release. Fundamentally, the yen received a helping hand from the Japanese Current Account which was reported at 1.37T above 1.05T expected, while the Economy Watchers Sentiment increased from 56.3 to 56.4 points, whereas specialists expected a potential drop to 56.2. Tomorrow, the US is to release the PPI, Core PPI, and the Unemployment Claims. On Friday, the retail sales data could shake the price. USD/JPY massive drop
After reaching the first warning line (WL1), the pair was somehow expected to drop. USD/JPY is in a corrective phase which could be over here around the upper median line (UML). Also, the price is almost to reach the uptrend line which represents a dynamic support level. It remains to see how it will react around the upper median line (UML). Registering only a false breakdown or developing a strong bullish pattern above it may signal that the correction is over and that the bulls could take the lead again. USD/JPY predictionThe currency pair reached an important support level. A minor accumulation here and the uptrend line retest could bring new buying opportunities. In my opinion, only a valid breakdown below the uptrend line could invalidate the upside scenario and could announce a larger downside movement. The material has been provided by InstaForex Company - www.instaforex.com |
| Posted: 12 Jan 2022 01:25 PM PST Analysis of previous deals: 30M chart of the GBP/USD pair
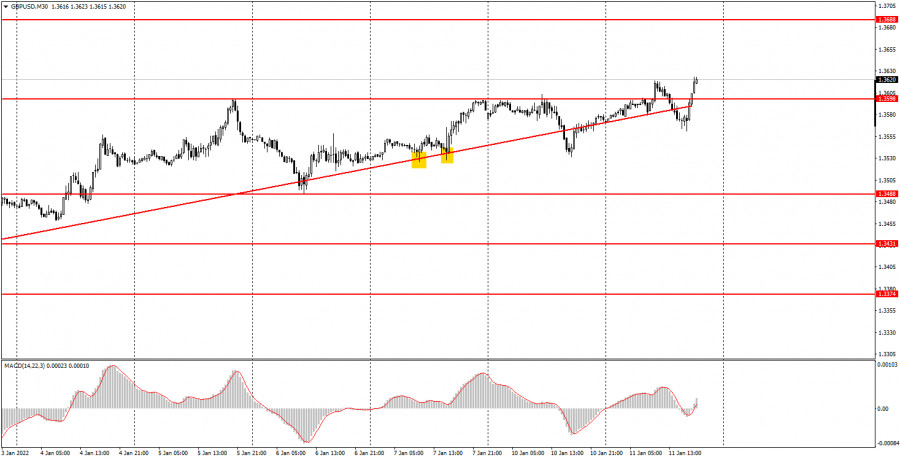
The GBP/USD pair, in spite of everything, continued its upward movement on Wednesday. Not a day earlier, not today, formally, it had no reason to grow. After all, the growth of the pair means the growth of the British pound and the fall of the US dollar. Federal Reserve Chairman Jerome Powell spoke yesterday in the Senate and was hawkish. And any hawkish information (aimed at tightening monetary policy) is a reason for the growth of the national currency, that is, the US dollar. However, yesterday the dollar was falling and the pound was rising. Today it became known that inflation in America continues to grow, which is also a bullish factor for the dollar, as it increases the likelihood of tightening the Federal Reserve's monetary policy. But today, too, the dollar was falling, and the pound was rising. Of course, we can conclude that the market simply does not accept any news related to the tightening of monetary policy, since there have already been a huge number of them in recent months. But still, the last two days, after the pair crossed the trend line twice, the pound still continues to grow. 5M chart of the GBP/USD pair
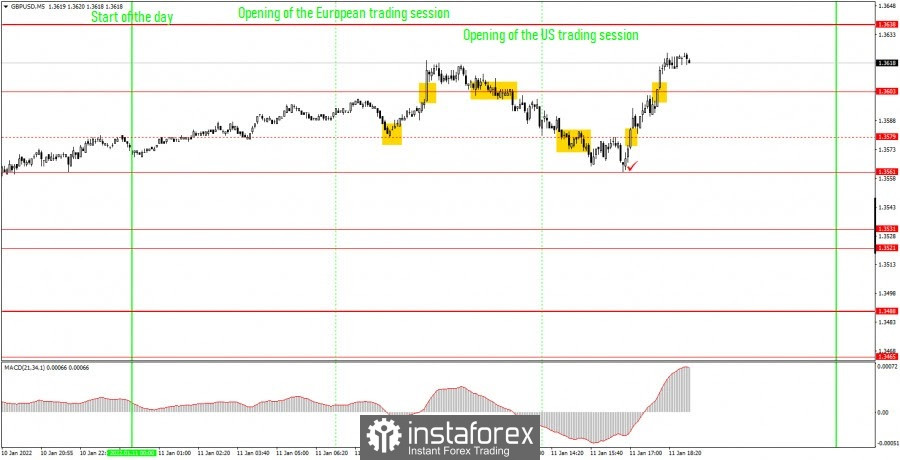
The movement of the pound/dollar pair on the 5-minute timeframe was quite interesting on Wednesday, but not devoid of false trading signals. The first two sell signals were formed in the morning, when the price first crossed the 1.3638 level and then bounced off it from below. At this point, novice traders could open short positions. However, the downward movement could not continue for a long time, and the price failed to go down by 15 points, so Stop Loss could not be set to breakeven. After that, the pair returned to the level of 1.3638 at the beginning of the US session, and then surpassed it, forming a buy signal. Strictly speaking, there was no need to open a long position at that moment, since the signal was formed literally half an hour before the release of the inflation report. But since there was already a buy signal, it was possible to take a risk and open a long position with Stop Loss below 1.3638 in case the traders' reaction was positive for the dollar. But in the end, the upward movement continued and those newcomers who opened a deal here could earn from 40 to 60 points, since the movement ended only around the level of 1.3708. A loss of 16 points was received on the first trade. How to trade on Thursday: In the 30-minute TF, the upward trend continues simply because the price continues to go up. Thus, although the upward trend line is no longer relevant, long positions remain preferable. It is recommended to trade at the levels of 1.3638, 1.3688, 1.3708, 1.3740 at the 5-minute TF tomorrow. The price can bounce off these levels, or it can overcome them. As before, we set Take Profit at a distance of 40-50 points. At the 5M TF, you can use all the nearest levels as targets, but then you need to take profit, taking into account the strength of the movement. When passing 20 points in the right direction, we recommend setting Stop Loss to breakeven. No important report from the UK tomorrow, and only secondary data will be released in the US, which is unlikely to seriously interest market participants. Basic rules of the trading system: 1) The signal strength is calculated by the time it took to form the signal (bounce or overcome the level). The less time it took, the stronger the signal. 2) If two or more deals were opened near a certain level based on false signals (which did not trigger Take Profit or the nearest target level), then all subsequent signals from this level should be ignored. 3) In a flat, any pair can form a lot of false signals or not form them at all. But in any case, at the first signs of a flat, it is better to stop trading. 4) Trade deals are opened in the time period between the beginning of the European session and until the middle of the US one, when all deals must be closed manually. 5) On the 30-minute TF, using signals from the MACD indicator, you can trade only if there is good volatility and a trend, which is confirmed by a trend line or a trend channel. 6) If two levels are located too close to each other (from 5 to 15 points), then they should be considered as an area of support or resistance. On the chart: Support and Resistance Levels are the Levels that serve as targets when buying or selling the pair. You can place Take Profit near these levels. Red lines are the channels or trend lines that display the current trend and show in which direction it is better to trade now. The MACD indicator (14,22,3) consists of a histogram and a signal line. When they cross, this is a signal to enter the market. It is recommended to use this indicator in combination with trend lines (channels and trend lines). Important speeches and reports (always contained in the news calendar) can greatly influence the movement of a currency pair. Therefore, during their exit, it is recommended to trade as carefully as possible or exit the market in order to avoid a sharp price reversal against the previous movement. Beginners on Forex should remember that not every single trade has to be profitable. The development of a clear strategy and money management are the key to success in trading over a long period of time. The material has been provided by InstaForex Company - www.instaforex.com |
| EUR/USD. Alogy of the day: US inflation is rising, the dollar is falling Posted: 12 Jan 2022 01:25 PM PST US inflation is breaking records again. All components of the macroeconomic report were released today either in the green zone or in accordance with the forecast. The market, in turn, reacted in a rather peculiar way to the release by organizing a sale of the dollar. And yet today's report plays a crucial role in determining the future prospects of the greenback. Inflation in the United States is still at a record high level, and this fact suggests that the Federal Reserve will decide on the first increase in the interest rate already at the March meeting. In addition, now we can say that the central bank will take a tougher position on this issue in the context of future prospects. At the moment, we can say that the Fed will probably raise the rate three times before the end of 2022, and will also start reducing its balance sheet approximately in July-September. Such a fundamental background, to put it mildly, is not conducive to a reversal of the EUR/USD trend. Therefore, at the moment we are dealing with a fairly large-scale correction, which a priori is temporary.
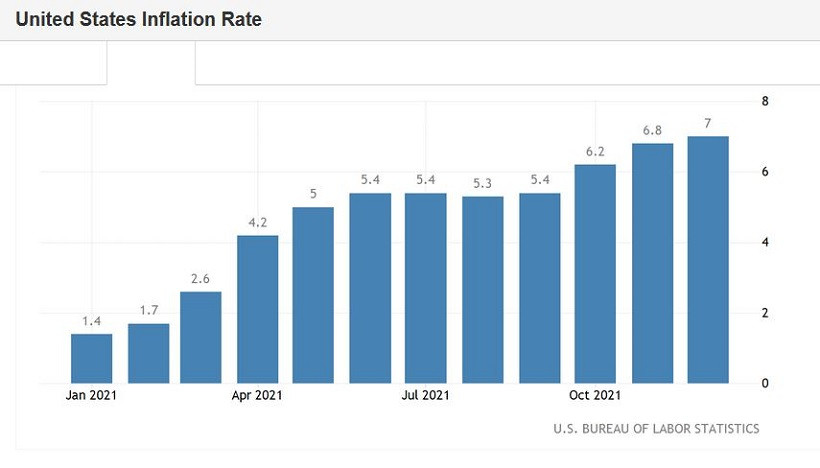
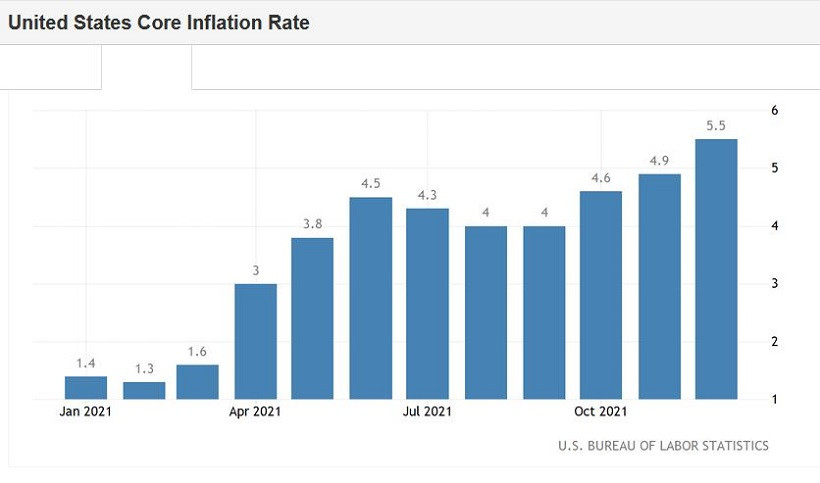
But back to today's report. It really exceeded the expectations of most experts in almost all respects. The consumer price index remains at the level of multi-year highs. Thus, according to published data, the overall CPI accelerated to 7.0% y/y in December. This is the highest value of the indicator for the last 40 years. The last time this indicator was at this level was in 1982. On a monthly basis, the index also showed positive dynamics, rising to 0.5% (with a slight decline forecast to 0.3%). The core consumer price index, excluding volatile food and energy prices, similarly remained at a high level. In monthly terms, an increase of up to 0.6% was recorded, in annual terms - up to 5.5%. And here again is a long-term record: the index last "gave out" such results in annual terms in February 1991. The structure of the release suggests that the CPI increased in December primarily due to the rise in prices of housing, used cars and trucks. Thus, housing costs, which account for about one-third of the total amount, jumped by 4.1% year-on-year. This is the fastest pace in almost 15 years (since February 2007). Prices for used cars, which became the main component of inflationary growth during the coronavirus crisis (due to problems with supply chains), increased in December by another 3.5% in December: as a result, the overall increase compared to last year was 37% (!).
Here again, it is necessary to recall that at the very end of last year, an indicator of the price pressure of consumer spending was published, which is the "most preferred" for Fed members in the context of the analysis of inflationary processes. This indicator also showed record growth. The core PCE index for November, which does not take into account volatile food and energy prices, jumped to 4.7% in annual terms. This is the strongest growth rate in the last 32 years. Against the background of such trends, Fed Chairman Jerome Powell yesterday made it clear that the Fed will begin tightening monetary policy in the near future. His colleagues - Barkin, Mester, George - actually announced the first rate hike in March. Another representative of the hawk wing (Rafael Bostic) said that the central bank could raise the rate three or four times by the end of the year. At the same time, none of the Fed members who spoke focused their attention on the relatively weak increase in the number of people employed in the non-agricultural sector. On the contrary, the unemployment rate (which fell to 3.9% in December) and the average hourly wage (+4.7% in December) came to the fore. In other words, almost all fundamental factors play in favor of the greenback. However, contrary to this fact and common sense, the dollar came under a wave of sales - both yesterday (after Powell's speech in the Senate) and today (immediately after the inflation release). This is an atypical, but far from unique situation. It is worth noting that there is no consensus on the market about the reasons for this behavior of the greenback. According to some analysts, in this case, the rule "buy on rumors, sell on facts" applies. On the eve of Powell's speech, the pair declined to the lower limit of the established 6-week price range of 1.1260-1.1360. However, as soon as the head of the Fed confirmed the assumptions of most traders, the dollar ceased to be in high demand. According to other analysts, the market was disappointed by Powell's speech, which was not "decisive enough." On the one hand, he "gave the go-ahead" to tighten monetary policy this year. But at the same time, Powell refused to give any specifics. Answering the senators' questions, the head of the Fed said that if inflation rates continue to grow at the current pace ("for a longer period than expected"), the Fed "will have to raise the rate even higher over time." According to some experts, such "cautious verbal maneuvers" put pressure on the greenback. In addition, over the past two days, the yield of treasuries – in particular, 10-year securities - has been declining. This factor also puts pressure on the US currency. However, if we ignore the reasons for the illogical behavior of EUR/USD (and other dollar pairs), we can say with some confidence that we are dealing with a correction. The European currency does not have any weighty arguments for breaking the trend, whereas the US currency has not only key macroeconomic reports in its "allies", but also the Fed. Therefore, in my opinion, the current price increase is temporary.
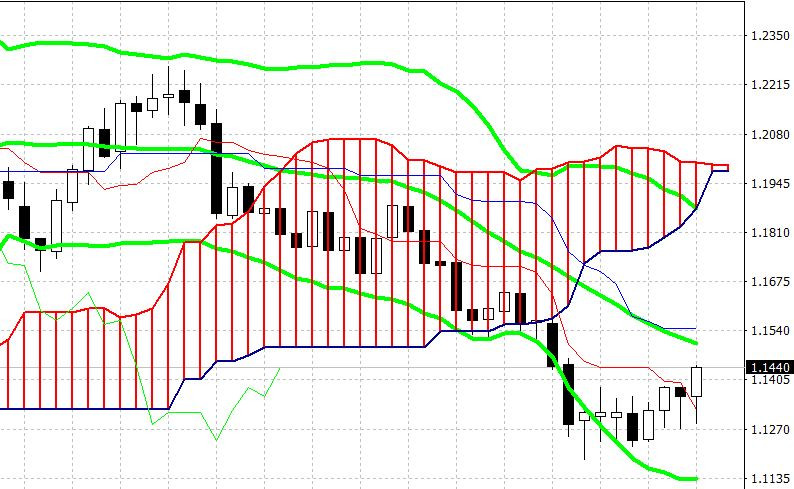
From a technical point of view, the situation for the EUR/USD pair is as follows. On the weekly chart, the pair continues to be between the middle and lower lines of the Bollinger Bands indicator, under the Kumo cloud, but on the Tenkan-sen line. To talk about a trend reversal, the pair's bulls need to break the middle line of the Bollinger Bands - that is, to settle above the 1.1500 mark. Up to this point, the current price growth can be viewed through the prism of a "forced" corrective pullback. The correction can be of a larger scale (up to the 15th figure), but it is still a correction, not a trend reversal. The resumption of the downward trend will be evidenced by a decline below 1.1360 (Tenkan-sen line). In this case, the Ichimoku indicator will form a bearish "Parade of Lines" signal, which will declare the priority of selling. At the moment, it is advisable to take a wait-and-see attitude for the pair. As soon as the upward corrective momentum begins to fade (especially if it happens near the boundaries of the 15th figure), the short positions will be "in trend" again. In my opinion, the EUR/USD bears will seize the initiative on the pair by the end of this week. The material has been provided by InstaForex Company - www.instaforex.com |
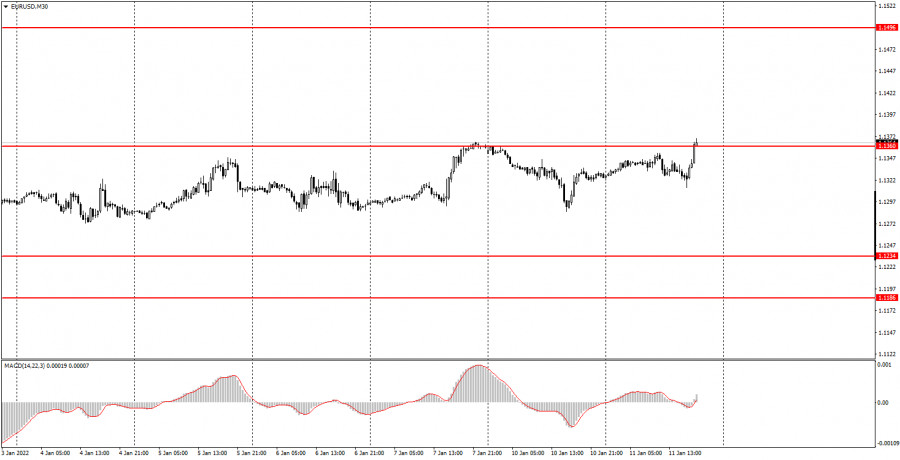
| Posted: 12 Jan 2022 01:25 PM PST Analysis of previous deals: 30M chart of the EUR/USD pair
The EUR/USD pair was trading in an upward direction on Wednesday. Finally, after a month and a half of absolute flat, traders managed to get the pair out of the horizontal channel, so now there is every reason to assume the beginning of a new upward trend. We have formed a new ascending channel on the 30-minute TF, which confirms the upward trend at this time. If we talk about fundamental factors, then the euro currency has little reason for growth now. However, the dollar sharply strengthened in the second half of 2021, so for technical reasons, growth is now more preferable. As for today's report on US inflation, it showed that it continues to rise and accelerate. This figure rose to 7.0% at the end of December, which is an anti-record for the last 40 years. Federal Reserve Chairman Jerome Powell announced a day earlier that his department would fight against the rise in consumer prices, but so far we see only inflation growth. 5M chart of the EUR/USD pair
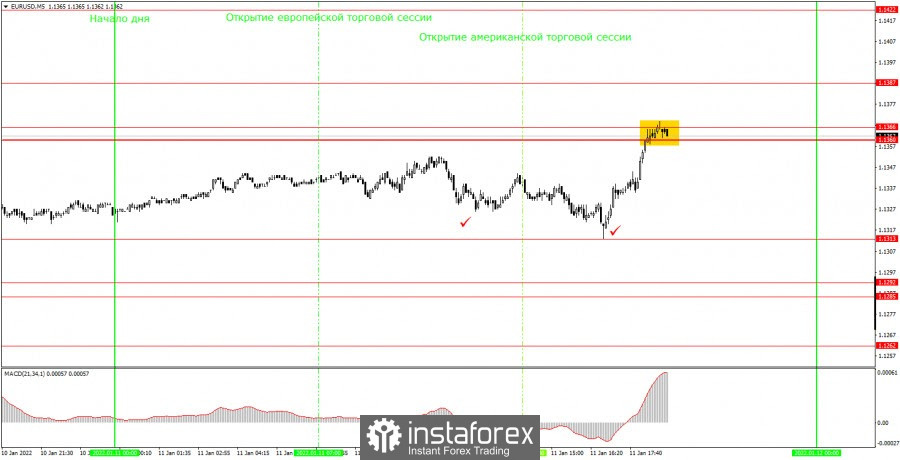
Today's movement was almost perfect on the 5 minute timeframe. Despite the fact that there was a total flat in the first half of the day. Markets have been waiting for the inflation report since the morning and, when it was published, reacted violently to it. The time when the report was published is marked with a tick. Thus, only one trading signal was formed during the day. The pair was near the support area of 1.1360-1.1366 for a long time, after which it nevertheless pushed off from it. Moreover, there were actually two rebounds (the first was in the middle of the European trading session) and novice traders could already open long positions during the first. It was necessary to place a Stop Loss order below the level of 1.1360 when US data were published, but the movement turned out to be in the right direction. The price broke through the levels of 1.1387 and 1.1422 without any problems, and the long position could be manually closed in the late afternoon. The profit on it was about 60 points. If beginners used Take Profit, then the profit ranged from 30 to 40 points. How to trade on Thursday: On the 30-minute timeframe, you can clearly see that the price has finally left the horizontal channel, so now preference is given to trades for growth. For example, you can work out signals for a rebound from the lower boundary of a new ascending channel. In general, we believe that the euro will continue to rise in the coming weeks. On the 5-minute timeframe, the levels for January 13 are as follows: 1.1360-1.1366, 1.1387, 1.1422, 1.14696. Recall that for any trade, you should set Take Profit 30-40 points and Stop Loss at breakeven after passing 15 points in the right direction. The deal can also be closed manually near important levels or after the formation of an opposite signal. There will be little macroeconomic statistics on Thursday, and no important statistics at all. Secondary reports will be published in America, which the market is unlikely to pay attention to and work them out. Therefore, tomorrow the volatility of the pair may decrease. Basic rules of the trading system: 1) The signal strength is calculated by the time it took to form the signal (bounce or overcome the level). The less time it took, the stronger the signal. 2) If two or more deals were opened near a certain level based on false signals (which did not trigger Take Profit or the nearest target level), then all subsequent signals from this level should be ignored. 3) In a flat, any pair can form a lot of false signals or not form them at all. But in any case, at the first signs of a flat, it is better to stop trading. 4) Trade deals are opened in the time period between the beginning of the European session and until the middle of the American one, when all deals must be closed manually. 5) On the 30-minute TF, using signals from the MACD indicator, you can trade only if there is good volatility and a trend, which is confirmed by a trend line or a trend channel. 6) If two levels are located too close to each other (from 5 to 15 points), then they should be considered as an area of support or resistance. On the chart: Support and Resistance Levels are the Levels that serve as targets when buying or selling the pair. You can place Take Profit near these levels. Red lines are the channels or trend lines that display the current trend and show in which direction it is better to trade now. The MACD indicator (14,22,3) consists of a histogram and a signal line. When they cross, this is a signal to enter the market. It is recommended to use this indicator in combination with trend lines (channels and trend lines). Important speeches and reports (always contained in the news calendar) can greatly influence the movement of a currency pair. Therefore, during their exit, it is recommended to trade as carefully as possible or exit the market in order to avoid a sharp price reversal against the previous movement. Beginners on Forex should remember that not every single trade has to be profitable. The development of a clear strategy and money management are the key to success in trading over a long period of time. The material has been provided by InstaForex Company - www.instaforex.com |
| Posted: 12 Jan 2022 01:25 PM PST
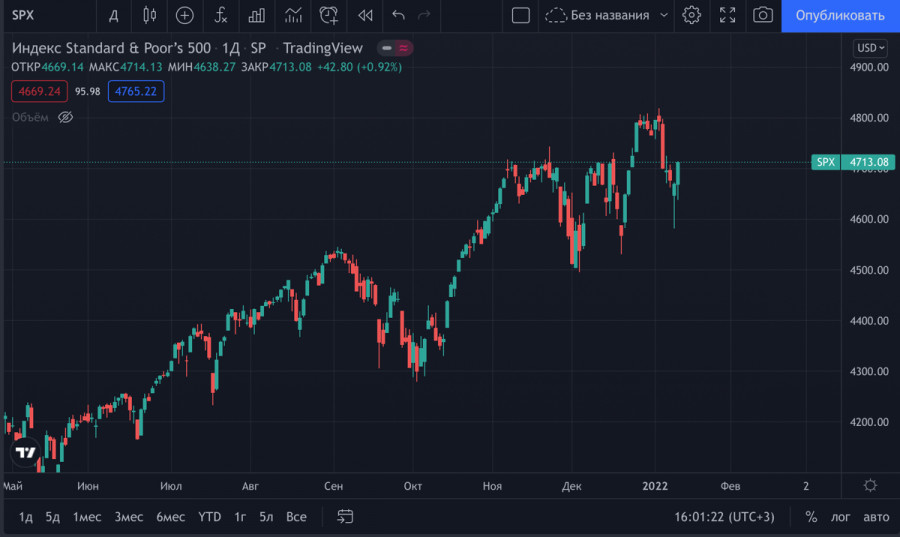
The main Wall Street indices, which began trading on Tuesday with a decline, ended the session with a steady increase. At the same time, the greenback, which tried to return beyond the 96.00 level, failed and slipped into the 95.60 area. Against this background, the euro rose against the US dollar by more than 0.3%, to 1.1367. The main engine of the markets yesterday was the speech of Federal Reserve Chairman Jerome Powell in the Senate. Less hawkish than expected, Powell's comments caused the rally of the US stock market and disappointed dollar bulls. After the release of strong data on wages and unemployment in the United States in December, investors began betting on a more aggressive tightening of monetary policy in the country in the coming year. Against this background, US stock indexes pulled back from the area of record highs, and the yield of treasuries soared to two-year peaks. The minutes released last week from the December FOMC meeting added fuel to the fire, which led to a wave of fears that swept not only Wall Street, but also other equity markets. However, in anticipation of Powell's speech, the bears on the stock exchanges moderated their ardor and turned out to be right. The Fed chairman said that the American economy no longer needs an accommodative policy, but added that they need several meetings to draw up a plan to reduce the balance sheet. Powell also expressed optimism that the problems in global supply chains will ease, and this will slow down inflation in the United States. At the same time, the head of the Fed allowed a gradual increase in the base interest rate by the central bank if inflation in the country remains at a level higher than predicted. Powell believes that an increase in the federal funds rate will not lead to a sharp slowdown in economic growth and a deterioration in the situation on the US labor market.
The comments made the day before by Powell's research shows that the central bank reserves maximum flexibility in constantly changing conditions and will not necessarily follow a predetermined path. Thus, the head of the Fed not only did not provoke new sales, but also supported the rise in the segment of risky assets. As a result, the S&P index rose by almost 1%, and the EUR/USD pair approached the upper limit of the range in which it has been trading since the end of December. A sharp improvement in investors' appetite for risk has left a protective dollar in the outsiders. Although the S&P 500 index showed the worst start to the year in the last 6 years, JPMorgan Chase analysts believe that the stocks that have sunk in value look attractive to buy. "The collapse of risky assets after the publication of the minutes from the December FOMC meeting may have been excessive. The tightening of monetary policy in the US is likely to occur gradually, at such a pace that risky assets should cope," they said. The prospect of an interest rate hike puts pressure on expensive stocks, but will not undermine the bull market as the US economy continues to grow, JPMorgan Chase notes. A similar opinion is shared by Goldman Sachs strategists, who confirm their optimistic forecasts that stocks will be able to withstand an increase in interest rates and rising bond yields. "The sale of a number of high-quality stocks with a long duration may soon turn out to be excessive. Since real returns are not expected to be much higher, valuations are unlikely to be a limiting factor for stocks," they said. Goldman Sachs analysts predict a bright future not only for the US stock market, but also for the eurozone economy, which should surpass the US economy in terms of growth rates in the next two years.
According to the bank's forecast, this year the GDP of the currency bloc will increase by 4.4%, while the US counterpart will grow by 3.5%. In 2023, eurozone GDP growth is expected at 2.5%, the US - 2.2%. Europe's fiscal policy is likely to remain soft this year, in contrast to what some economists predict for the United States, Goldman Sachs analysts say. "The governments of the eurozone countries will invest large sums of money in various projects in the coming years, as the process of distributing the funds of the EU's 750 billion euro joint recovery fund will continue. Meanwhile, there are certain doubts that the $1.8 trillion Build Back Better program proposed by White House Chief Joe Biden will come to fruition. Disagreements about it among American lawmakers could jeopardize the entire plan," they noted. "In addition, monetary conditions in the eurozone are expected to remain more favorable than in the United States," said Goldman Sachs strategists. Although inflation has also increased in the eurozone, but not as much as in America. Consequently, politicians in Europe feel more comfortable with the continuation of monetary stimulus, they explained. On the one hand, brighter prospects for economic growth in the eurozone than in the United States are good news for the euro. On the other hand, a more aggressive monetary policy of the Fed will lead to a strengthening of the dollar in the long run. If the US central bank raises the interest rate in March, its European counterpart will be in the role of catching up, which will provoke a decline in the EUR/USD pair. The main currency pair approached the upper limit of the six-week range, but quickly lost its bullish momentum as investors turned their attention to December inflation data in the United States. The consumer price index is expected to rise to 7% year-on-year from 6.8% recorded in November. Stronger results will help the dollar recover, as Powell acknowledged that the central bank needs to focus on the inflation target rather than the maximum employment target. On the other hand, a weaker inflation indicator may lead to investors continuing to put in quotes a delay in reducing the Fed's balance sheet and provoke another jump in EUR/USD.
"Our estimates are in line with the market consensus forecast. At the same time, we believe that the market reaction to the December CPI release may be asymmetric. If the hawkish results are already priced in, then unexpectedly weak inflation could more tangibly undermine the US dollar and support risk appetite, "analysts at TD Securities said. The USD index found decent support around 95.50. The loss of this level could send the index further down in the short term. The next significant support is seen at 94.94. As long as the greenback stays above the 4-month support line (from September low) at 95.10, it will maintain the potential for further gains. Danske Bank analysts believe that even a decline in US inflation is unlikely to change the Fed's forecast for rate hikes and quantitative tightening (QT). "The focus of attention today is the US inflation data for December. Headline inflation is expected to reach 7% y/y, while core inflation is expected to hit 5.4%. At the same time, overall inflation will decrease from 0.8% to 0.4% in monthly terms. However, a lower monthly reading should not greatly affect the sentiment of Fed officials, as they need more than one month to change their position on QT and rate hikes, "said the bank's strategists. Immediate support for the EUR/USD pair is located at 1.1340. If it closes below this level, the bearish sentiment will strengthen. The next support is at 1.1320 (100-day moving average) and 1.1300 (200-day moving average). On the other hand, the initial resistance is at 1.1380, and then at 1.1400 and 1.1450. The material has been provided by InstaForex Company - www.instaforex.com |
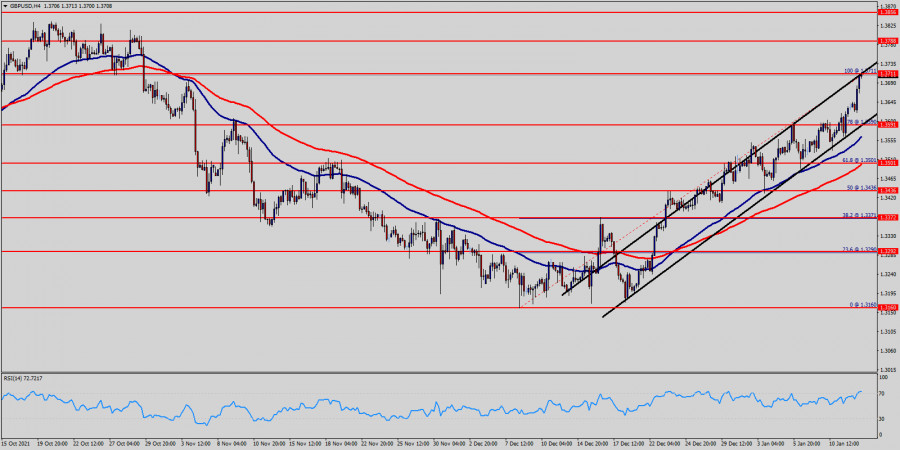
| Technical analysis of GBP/USD for January 12, 2022 Posted: 12 Jan 2022 01:14 PM PST
GBPUSD : Price is testing major resistance at 1.3711. RSI (14) sees a bullish exit of our descending resistance-turned-support line signalling that we'll likely be seeing some bearish momentum from the level of 1.3590. Price is testing major resistance at 1.3711 (Fibonacci retracement, bearish bar harmonic formation) and we expect to see a strong reaction off this level to push price down towards 1.3711 before 1.3591 support (78% - Fibonacci retracement, horizontal swing low support). We expect to see a strong reaction off this level to push price down towards 1.3501 (61.8% Fibonacci retracement, horizontal swing low support). The pair is trading below its pivot point. It is likely to trade in a lower range as long as it remains below the pivot point. Short positions are recommended belwo the area of 1.3788-1.3711 with the first target at 1.3590. A break of that target will move the pair further downwards to 1.3590. The bias remains bearish in nearest term testing 1.3501 – 1.3436. Immediate resistance is seen around 1.3711. Briefly, if the pair fails to pass through the level of 1.3711, the market will indicate a bearish opportunity below the strong resistance level of 1.3788. In this regard, sell deals are recommended lower than the 1.3788 or/znd 1.3711 level with the first target at 1.3591. It is possible that the pair will turn downwards continuing the development of the bearish trend to the level 1.3501. However, stop loss has always been in consideration thus it will be useful to set it above the last double top at the level of 1.3711 (notice that the major resistance today has set at 1.3788). The material has been provided by InstaForex Company - www.instaforex.com |
| Posted: 12 Jan 2022 11:54 AM PST
EUR/USD aggressive breakoutThe EUR/USD pair registered a strong growth after the US reported higher than expected inflation. As you already know from my previous analysis, EUR/USD could develop a strong upwards movement if it makes an upside breakout from the extended range between 1.1366 and 1.1238 levels. As you can see on the H4 chart, the pair dropped a little after its previous breakout above 1.1366 but it has found strong demand around 1.1280 failing to come back down towards 1.1238 signaling strong buyers. EUR/USD trading conclusionThe aggressive breakout above 1.1388 former high announced an upside continuation. You already knew from my previous analysis that escaping from an extended range pattern could bring great trading opportunities. After its amazing growth, we cannot exclude a temporary decline before reaching new highs. 1.1500 psychological level and the 1.1526 former low are seen as potential upside targets. The material has been provided by InstaForex Company - www.instaforex.com |
| Bitcoin breakout signals upside continuation Posted: 12 Jan 2022 11:53 AM PST The price of Bitcoin resumed its short-term rebound. At the time of writing, it was traded at 43,673.75. Today, it has climbed to as high as 44,099.05 where it has found temporary resistance. Technically, it has ignored strong immediate resistance levels announcing strong buyers and potential strong growth. BTC/USD registered 11.48% growth from Monday's low to today's high. Its rally helped the altcoins to grow as well. The price escaped from a bullish pattern, so further growth is favored despite minor retreats. BTC/USD in buyers' territory
As you can see on the H4 chart, the price of Bitcoin found support on the Descending Pitchfork's median line (ml). The false breakdown with great separation below this downside obstacle signaled that sellers are too exhausted. Now, the rate jumped above the downtrend line, through the channel's upside line and resistance announcing an upside reversal in the short term. It's traded above the weekly pivot point of 43,339 level. Stabilizing above it may signal potential growth towards the Descending Pitchfork's upper median line (uml). BTC/USD outlookThe breakout through the downtrend line and above the weekly pivot point signals potential further growth. Testing and retesting the broken levels could bring long opportunities with a first upside target and obstacle at 45,750 level. Also, the rejection by the median line (ml) indicates that it could be attracted by the upper median line (uml). The material has been provided by InstaForex Company - www.instaforex.com |
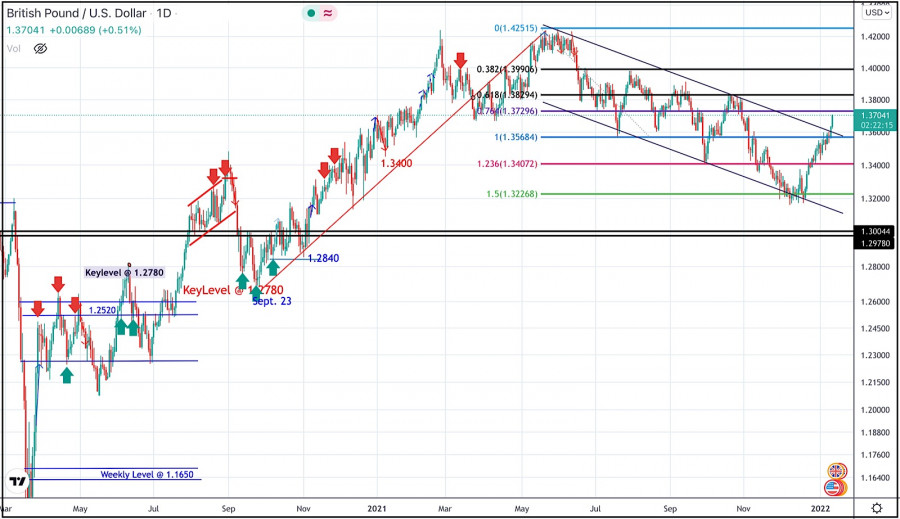
| January 12, 2021 : GBP/USD Intraday technical analysis and significant key-levels. Posted: 12 Jan 2022 11:47 AM PST
The GBPUSD pair has been moving sideways with some bearish tendency while bearish breakout below 1.3600 was needed to enhance further bearish decline. Bearish breakout below 1.3700 enabled quick bearish decline to occur towards 1.3400 which corresponded to 123% Fibonacci Level of the most recent bearish movement. This was a good entry level for a corrective bullish pullback towards 1.3650 and 1.3720 which was temporarily bypassed. Shortly after, the pair was testing the resistance zone around 1.3830 where bearish pressure originiated into the market. More bearish extension took place towards 1.3220 where the lower limit of the current movement channel came to meet with Fibonacci level. Conservative traders should have taken BUY trades around 1.3200 price levels as suggested in previous articles. BUYERS are watching the current price levels of 1.3730 to have some profits off their trades. Moreover, the price level of 1.3720 stands as a key-resistance to be watched for bearish reversal if some bearish signs existed Today. On the other hand, the short-term outlook remains bullish as long as the pair maintains its movement within the depicted channel above 1.3570. The material has been provided by InstaForex Company - www.instaforex.com |
| January 12, 2021 : EUR/USD Intraday technical analysis and trading plan. Posted: 12 Jan 2022 11:45 AM PST
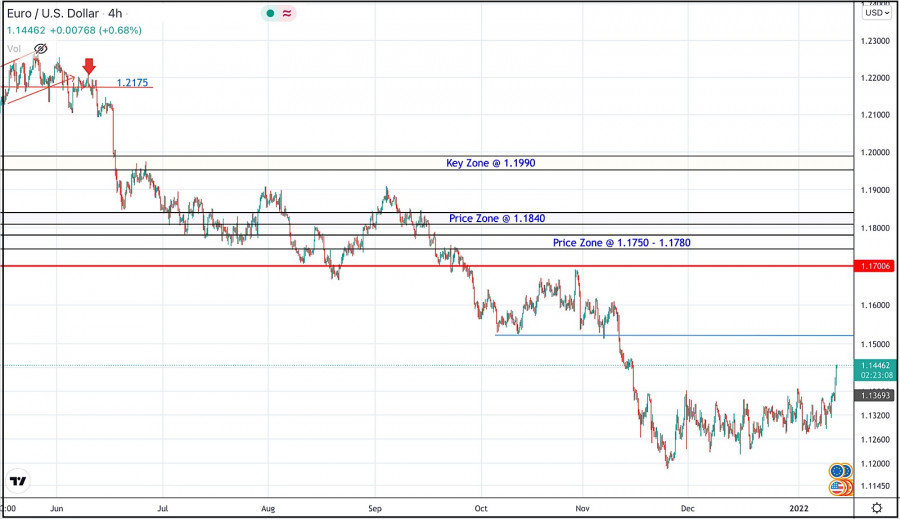
The bullish swing that originated around 1.1650 in August, failed to push higher than the price level of 1.1900. That's why, another bearish pullback towards 1.1650 was executed. However, extensive bearish decline has pushed the EURUSD pair towards 1.1600 and lower levels was reached. Shortly after, significant bullish recovery has originated upon testing the price level of 1.1570. The recent bullish pullback towards 1.1650-1.1680 was expected to offer bearish rejection and a valid SELL Entry. Significant bearish decline brought the EURUSD pair again towards 1.1550 levels which stood as an Intraday Support zone. Hence, sideway movement was demonstrated until quick bearish decline occurred towards 1.1200. Please note that any bullish movement above 1.1500 should be considered as an early exit signal to offset any SELL trades. The price levels around 1.1520 remain a reference zone that needs to be re-visited when the current bearish momentum ceases to dominate. The material has been provided by InstaForex Company - www.instaforex.com |
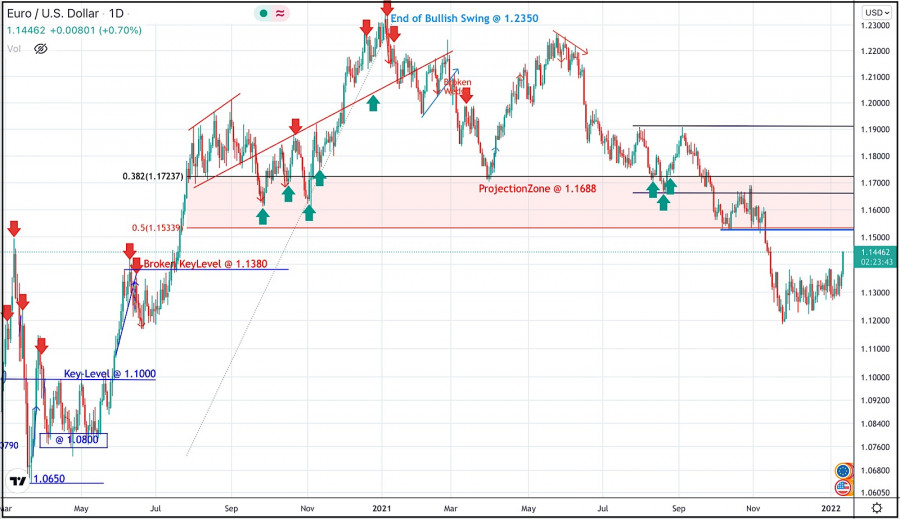
| January 12, 2021 : EUR/USD daily technical review and trading opportunities. Posted: 12 Jan 2022 11:44 AM PST
During the past few weeks, the EURUSD pair has been trapped within a consolidation range between the price levels of 1.1700 and 1.1900. In late September, Re-closure below the price level of 1.1700 has initiated another downside movement towards 1.1540. Price levels around 1.1700 managed to hold prices for a short period of time before another price decline towards 1.1200. Currently, the price zone around 1.1500 stands as a prominent supply-zone to be watched for SELLING pressure and a possible SELL Entry upon any upcoming ascending movement. Moreover, it is not advised to add new SELL Entries around the current price levels as the pair already looks oversold. The material has been provided by InstaForex Company - www.instaforex.com |
| Bitcoin rises as US inflation reaches 7% Posted: 12 Jan 2022 10:16 AM PST
Bitcoin showed an incredible reversal today, rising to $43,500. Digital gold is now in the green zone. Due to bitcoin's upward movement, the altcoin market also went up. Bitcoin has started its rally as the inflation rate in the United States has risen by 7%. Institutional investors are very uncomfortable with inflation, so they start buying Bitcoin in droves. Investors are concerned that inflation will continue to rise and even the most pessimistic forecasts will seem less daunting as the Fed will be even more aggressive in raising interest rates in 2022. The Federal Reserve will also tightly regulate the cryptocurrency market. Jerome Powell has already said that Treasury yields are set to rise and this could be the catalyst for a downward move this year. Many investors this year no longer perceive Bitcoin as a major protective measure against inflation. For traders, Bitcoin is already a riskier and more volatile asset than ever before. Investors therefore carefully consider all long-term risks and possible outcomes on the global stage when buying bitcoin. Investors are still hopeful that the Fed will not go ahead and take even more drastic measures to tighten its policy and will not buy up highly volatile assets. Today's cryptocurrency rally is marked by a breakout of the $42,600 resistance level. The next major resistance level will be at $44,000, and if bitcoin manages to hold at that level, the next one will be at $45,000. This will be followed by a very important resistance level at the $47,000. However, it is very difficult to make any optimistic outlook yet, as due to the unstable situation in Kazakhstan as well as unpredictable Fed policies, bitcoin could be on a rollercoaster ride. The material has been provided by InstaForex Company - www.instaforex.com |
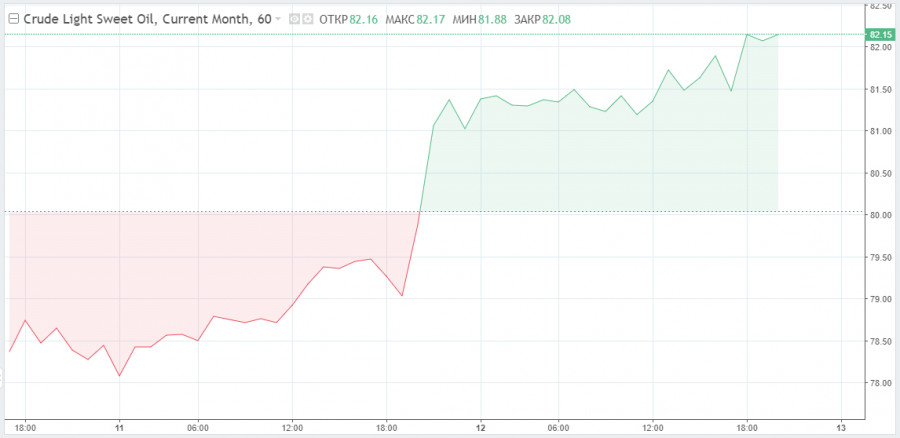
| Oil overcomes Omicron fear and is trading above $80 Posted: 12 Jan 2022 08:40 AM PST
WTI crude oil was trading above $80 in late Tuesday trading. Today, on Wednesday, US light crude oil continues its rise. Thus, at the moment of writing the article, futures for WTI oil are at $82.08 per barrel, while futures for Brent traded at $84.37 per barrel. Notably, during yesterday's trading the news reports were full of messages, which in any other situation would have created a bearish sentiment in the market. For example, the WHO noted again that the Omicron variant is rapidly spreading around the world. Moreover, the Oil Minister of Oman was quoted as saying that OPEC+ was not willing to push prices up to $100 and overheat the market. Despite this news, the price of oil rose significantly on Tuesday according to the traders' forecast. Therefore, the rapid rise in Omicron cases does not indicate that demand for fuel and other petroleum products may be falling, but that herd immunity is close. That is to say, the more people encounter this new strain, the more likely it is that the virus will finally begin to recede by the summer season. Besdes, the overall number of travel could reach pre-pandemic coronavirus levels. However, the Minister of Oman's comments initially had a negative impact on the quotations, although later it became clear to traders that this news is not new. The Alliance maintains its plans to increase production by 400,000 barrels per day. It is obvious that with implementation of these plans the market balance will be transformed into surplus. However, the market will not be overheated by such an increase in production, as well as the new shale boom in the USA and other countries. Oil producing companies complain that banks are not willing to finance new projects and determine new requirements. Oil producers must transform into more environmentally friendly companies. These new trends in the oil sector are raising the breakeven price of production projects, giving OPEC+ a head start. Oil received strong support after Jerome Powell's speeches, who is confident in the US economic recovery despite the spreading Omicron variant. Powell finally confirmed the analysts' forecasts that the US economy was ready to accept tightening of the monetary policy. He said that the regulator was able to maintain high rates of economic growth. Powell added that it would contribute to the demand for oil, which was highly sensitive to growth. After these optimistic statements the price of oil jumped yesterday. The oil quotations growth was caused by yesterday's released updated forecast of the US Energy Information Administration (EIA) about the oil demand. Thus, this year total demand in the USA is expected to increase by 840,000 barrels a day instead of 700,000 barrels as a year ago. At the same time, the EIA lowered its production forecast for 2022. Currently, it is forecasted that oil production in the USA will rise by 640,000 barrels a day instead of 670,000 barrels. According to the American Petroleum Institute (API), US crude inventories slumped again, while gasoline and distillate inventories, on the other hand, rose last week. Market participants are positive about overall growth in the first quarter, however the latest inventory data from API show subdued demand for crude. This is the reason why some analysts believe there is no strong grounds to predict the coming price rally. Currently, experts believe that if the risky sentiment on the stock market will remain acute for a long time, then during 2022 the oil quotes have chances to reach $100 and to consolidate in the range of $80-100. However, when planning transactions, it is recommended to take into account that this optimism about oil may fade as the US Federal Reserve takes a tougher stance on its economy.
|
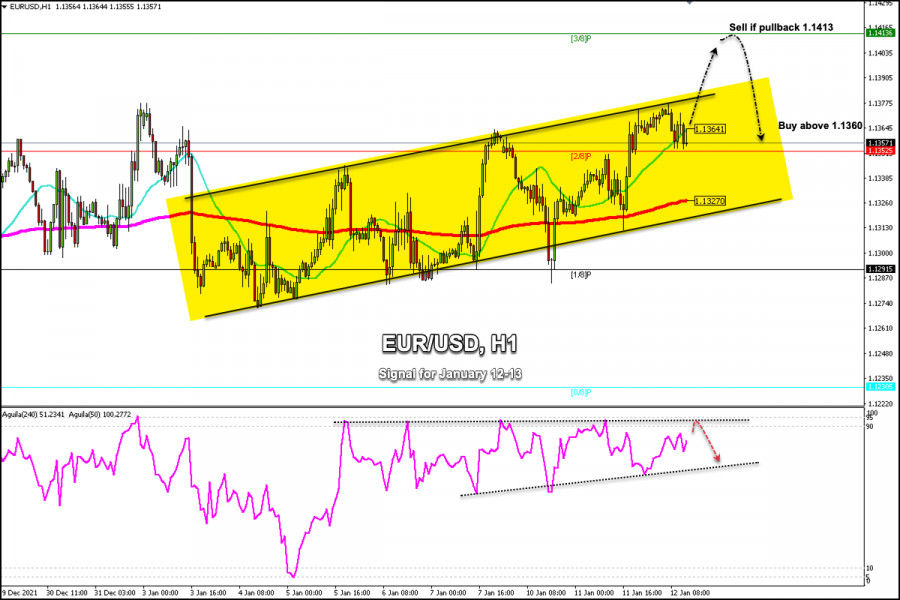
| Trading signals for EUR/USD on January 12 - 13, 2022: sell in case of pullback at 1.1413 (3/8) Posted: 12 Jan 2022 07:01 AM PST
Since January 3, the euro is trading in an uptrend according to the 1-hour chart. At this moment, it is located above 2/8 of Murray and below the SMA of 21. The markets are waiting for the inflation data from the United States. If the data confirms soaring inflation in the US, we could see a strong impulse of the euro towards resistance level of 3/8 Murray around 1.1413. The resistance zone of 1.1413 located around 3/8 Murray could offer a strong top for the euro and we could expect a correction again towards the support 2/8 Murray in 1.1352. The testimony of Fed Chairman Jerome Powell in front of the Senate disappointed some investors. He said that the decision to begin reducing the Fed's balance sheet could take between two and four policy meetings and that it was not under discussion for now. These comments gave the impetus for the euro to break the 200 EMA located at 1.1327. As the dollar continues its downtrend, it is likely that the euro can take advantage of the greenback's weakness. We could see the euro reaching the key level of 1.1500 in the coming days. The eagle indicator is reaching overbought levels. It is likely that in the coming days the euro may make a technical correction and fall back to the level of 1.1327 (200 EMA) or down to 1.1291 (1/8). Our trading plan is to wait for the euro's consolidation above the SMA of 21 located at 1.1365. In this case, we will be able to buy with targets at 1.1413 where 3/8 of Murray is located. On the other hand, a pullback to the resistance zone will be a good opportunity to sell if EUR/USD consolidates below 1.1413 (3/8) with targets at 1.1352 (2/8). Support and Resistance Levels for January 12 - 13, 2022 Resistance (3) 1.1441 Resistance (2) 1.1413 Resistance (1) 1.1387 ---------------------------- Support (1) 1.1352 Support (2) 1.1336 Support (3) 1.1287 *********************************************************** Scenario Timeframe H4 Recommendation: buy above Entry Point 1.1360 Take Profit 1.1390, 1.1413 (3/8). Stop Loss 1.1325 Murray Levels 1.1352 (2/8) 1.1413 (3/8) *********************************************************** Alternative scenario Recommendation: Sell if pullback Entry Point 1.1413 Take Profit 1.1377, 1.1352 (2/8) Stop Loss 1.1449 Murray Levels 1.1291 (1/8), 1.1230 (0/8) ********************************************************* The material has been provided by InstaForex Company - www.instaforex.com |
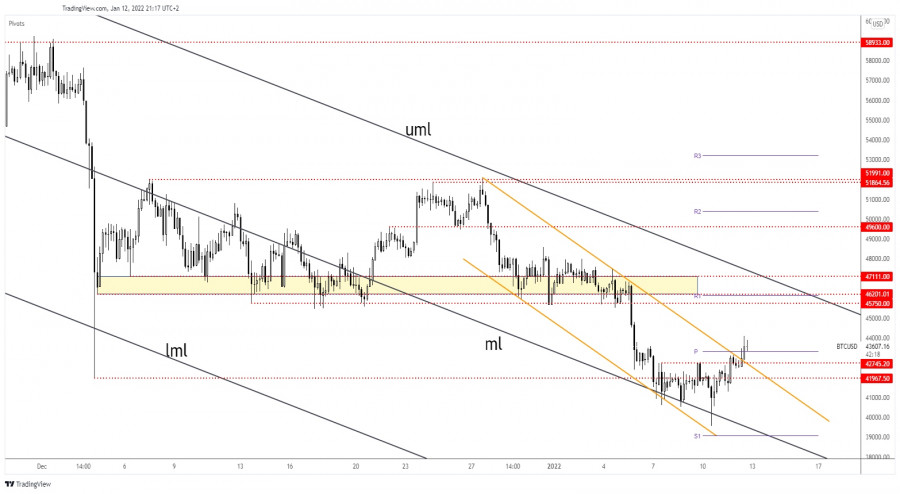
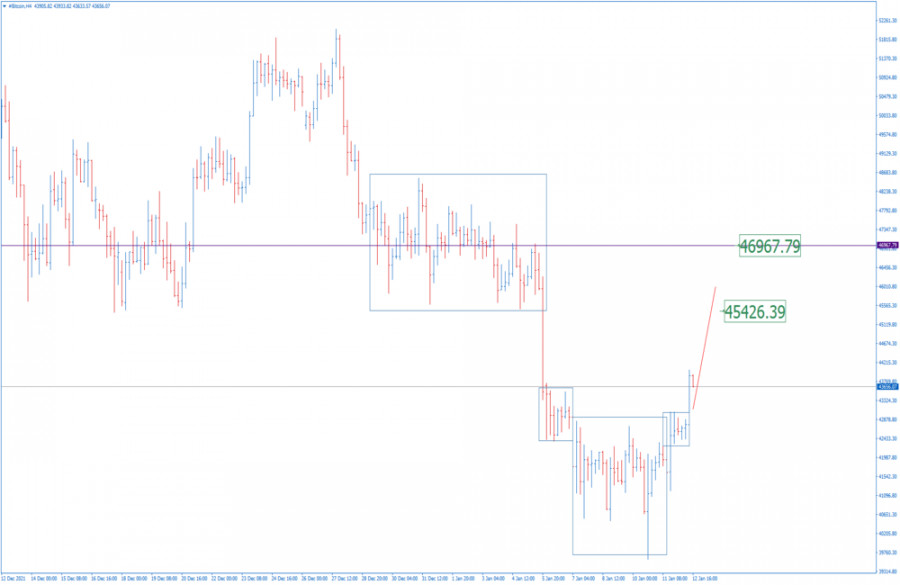
| BTC analysis for January 12,.2022 - Broken consolidation to the upside Posted: 12 Jan 2022 06:46 AM PST Technical analysis:
BTC has been trading upside today and there is potential for the bigger rise towarrds upper distribution. Trading recommendation: Due to the breakout of the consolidation to the upside, I see potential for the rally towards previous range. Watch for the buying opportunities on the pullbacks with the upside objectives at $45,425 and $47,000. Key support level is set at $42,250 The material has been provided by InstaForex Company - www.instaforex.com |
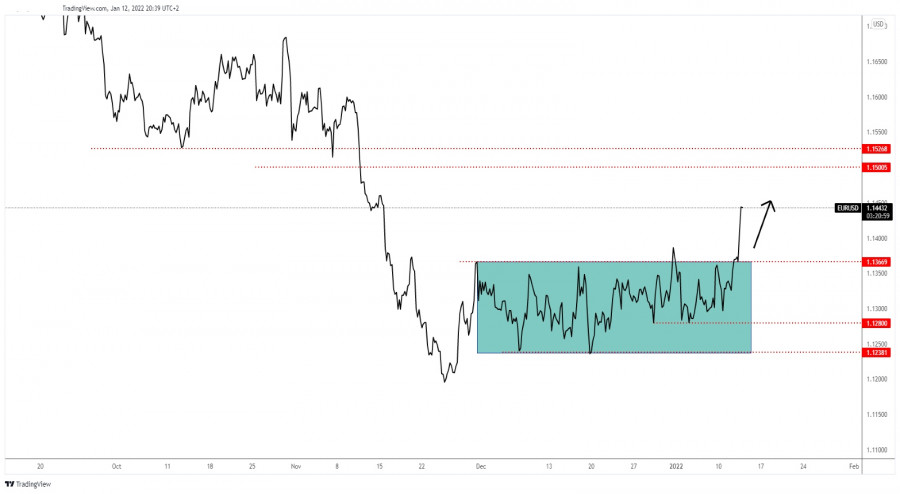
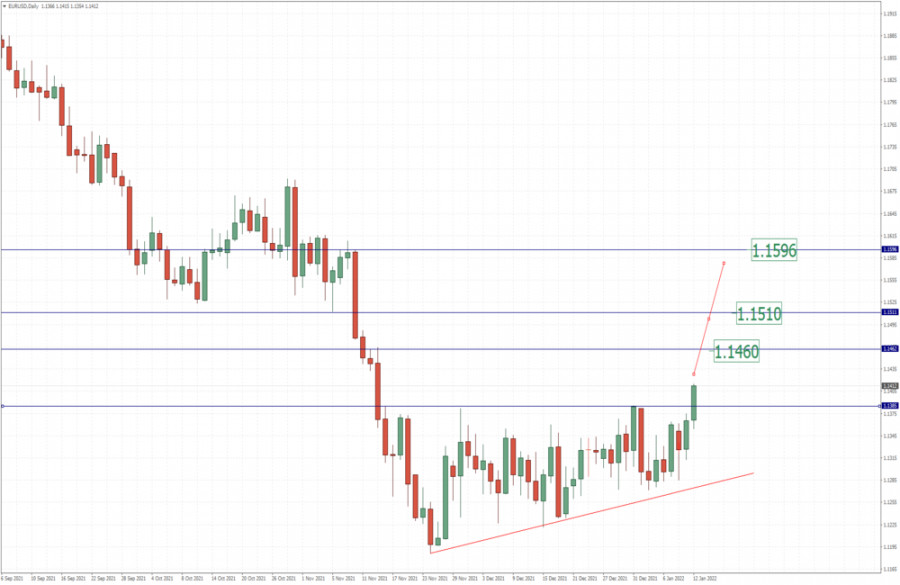
| EUR/USD analysis for January 12, 2022 - Breakout of multi month consolidation to the upside Posted: 12 Jan 2022 06:38 AM PST Technical analysis:
EUR/USD has been trading upside and there is the breakout of the key multi-month pivot resistance at the price of 1,1385. Trading recommendation: Due to the breakout of the key multi-month pivot resistance at the price of 1,1385, there is the chance for the bigger upside movement in the next period. Watch for the buying opportunities on the pullbacks with the upside objectives at 1,1460, 1,1510 and 1,1595. Key support level is set at 1,1385 (resistance became support) The material has been provided by InstaForex Company - www.instaforex.com |
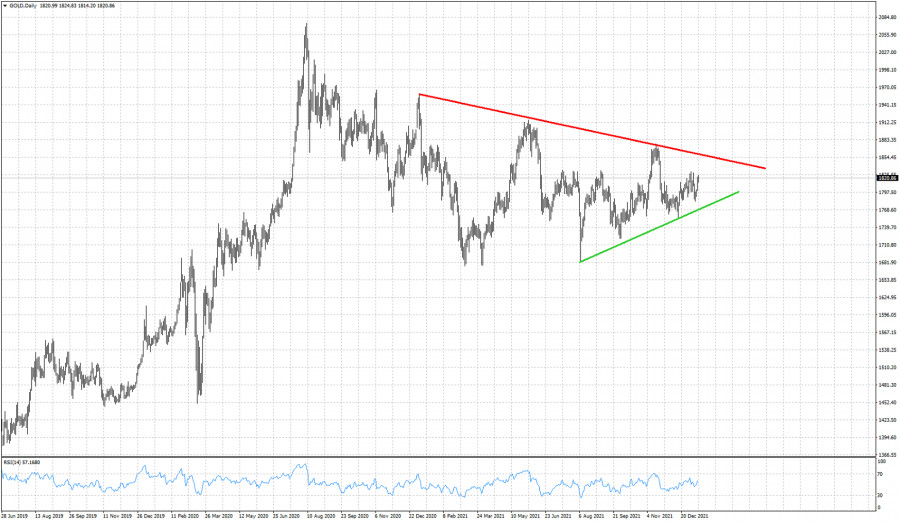
| Gold continues to trade above $1,800. Posted: 12 Jan 2022 06:07 AM PST Gold bulls have managed to reclaim the $1,800 level and are now trying to challenge the $1,830 resistance and previous high. Price continues to trade around $1,800 since last May. Price has broken above and below $1,800 several times but has not gone too far above or below in order to start a new trend.
Green line - support Fortunately for traders price has formed a triangle pattern. This is helpful for traders because the trading range is tightening and soon we should have a break out. Key resistance is at $1,857 and key support at $1,770. Gold price could continue until March to trade inside this trading range until it breaks it. In the near term price looks more probable to test the Red resistance trend line than the green support trend line. The medium-term trend is unclear. The material has been provided by InstaForex Company - www.instaforex.com |
| XRPUSD could reach $0.85 soon. Posted: 12 Jan 2022 06:02 AM PST XRPUSD like most of the cryptocurrencies are showing short-term reversal signals and signs of strength. In the 4 hour charts price has broken above short-term resistance and provided a short-term reversal signal.
Blue line- resistance XRPUSD is turning higher and is making higher highs and higher lows. There is potential for price to test the next important resistance at $0.85 area. It is too soon to tell if the low made two days ago, around $0.69, is a major low. Bulls have a lot of work ahead of them. At $0.82 we find the 38% Fibonacci retracement of the entire decline from $1.015. At $0.85 we find the 50% retracement and the horizontal resistance as shown in the chart above. Bulls need to break above this level in order to hope for a bigger reversal. The material has been provided by InstaForex Company - www.instaforex.com |
| Trading signals for Ethereum (ETH/USD) on January 12 - 13, 2022: buy above $3,144 (2/8 - 21 SMA) Posted: 12 Jan 2022 05:32 AM PST
On January 10, Ether reached the low of 2,920 at the same price levels of September 30, 2021. From this level, it is recovering and is now located above 2/8 Murray and above the SMA of 21 located at 3,144. Given that Ether is now giving a positive signal, as long as it remains above the 2/8 Murray located at 3,125, we could expect a recovery of ETH / USD towards the zone of the 200 EMA located at 3,690 and up to 4/8 of Murray in 3,750. Market participants can expect an increase in the volume of purchases. This could give momentum and the price could consolidate above the 200 EMA and thus rise to the psychological level of 4,000 that coincides with 5/8 Murray (4,062.50). The eagle indicator has left the oversold zone after breaking the 5-point level. Now it is giving a positive signal for Ether. The price is likely to reach the key level of 3,750 in the next few days. Our trading plan for the next few hours is to buy above 2/8 Murray around 3,125 with targets at 3,437 (3/8) and 3,750 (4/8). If Ether falls back below the key level of 21 SMA, we should be careful and expect a technical bounce around the psychological level of 3,000. A technical bounce around this support level between 2,920 - 3,000 could be an opportunity to buy back Ether. Support and Resistance Levels for January 12 - 13, 2022 Resistance (3) 3,521 Resistance (2) 3,437 Resistance (1) 3,307 ---------------------------- Support (1) 3,125 Support (2) 2,964 Support (3) 2,819 *********************************************************** Scenario Timeframe H4 Recommendation: buy above Entry Point 3,144 Take Profit 3,437 (3/8), 3,700 (200 EMA) Stop Loss 3,050 Murray Levels 3,125 (2/8) 3,437 (3/8) 3,750 (4/8) *********************************************************** The material has been provided by InstaForex Company - www.instaforex.com |
| Video market update for January 12,,2022 Posted: 12 Jan 2022 05:16 AM PST Watch for the the breakout mode on EUR/USD.... The material has been provided by InstaForex Company - www.instaforex.com |
| Posted: 12 Jan 2022 05:07 AM PST Bitcoin managed to hold its price above support at $40,000 and recovered reaching above $43,000 due to activity from bulls. Technical indicators and cryptocurrency onchain activity indicate a gradual weakening of sellers' positions. These factors can be perceived as the initial stage of recovery of major cryptocurrency quotes. However, bitcoin's success may be offset by the Fed report and the IMF statement.
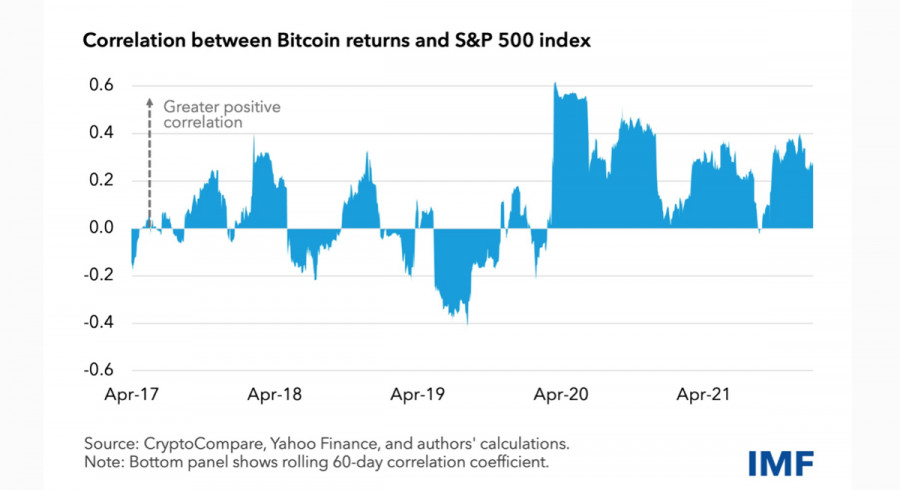
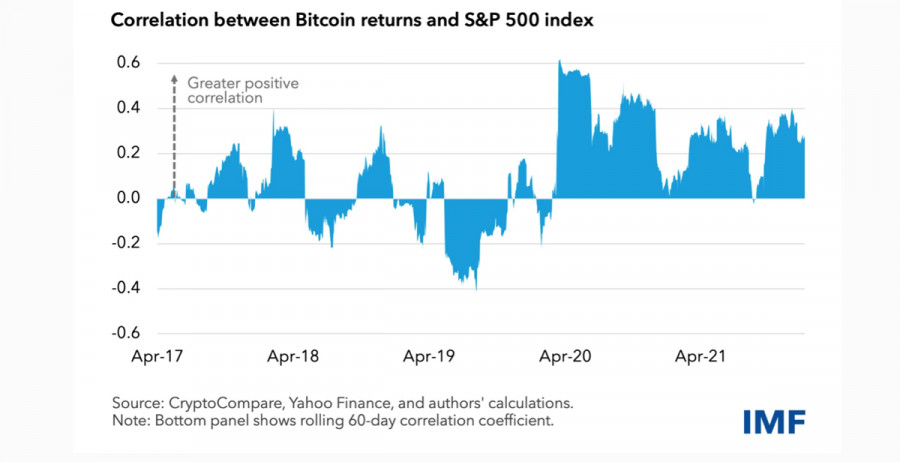
The Fed's conclusions should be expected within two weeks, but I assume that regardless of their statements, bitcoin's price is unlikely to change due to the market's readiness for pessimistic conclusions. The situation with the International Monetary Fund looks tenser, as its representatives said that bitcoin and the cryptocurrency market may cause destabilization in stock markets. IMF officials linked this fact to the record high level of correlation between the leading cryptocurrency and the S&P 500 Index.
The international regulator believes that the rise in popularity of cryptocurrencies and company stocks has increased due to the difficult economic situation in the world and the growing interest in high-risk assets. The IMF statement does not imply that the multi-thousand-dollar growth of bitcoin over the past 5 years had something to do with it. However, IMF officials believe that the cryptocurrency reaching a local low could have a negative impact on investments in stock markets. As a solution to the problem, the Fund suggests creating a set of rules to regulate the cryptocurrency industry. In general, the IMF's policies and statements look consistent, and it is likely that in 2022 the issue of mass regulation of the industry may appear. However, it will be a negative signal for the cryptocurrency market. The regulations imply increasing centralization of the industry. One of the main reasons for the explosion of interest in cryptocurrencies has been the lack of meticulous regulation that has consumed the securities market. In the long run, if this keeps investors safe and ensures large-scale acceptance of cryptocurrencies as a class asset, the road to all-time highs will be hard.
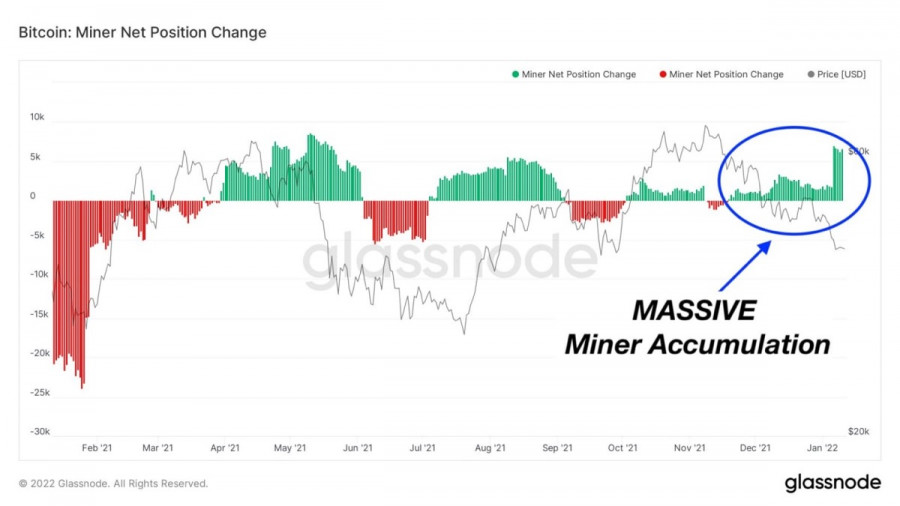
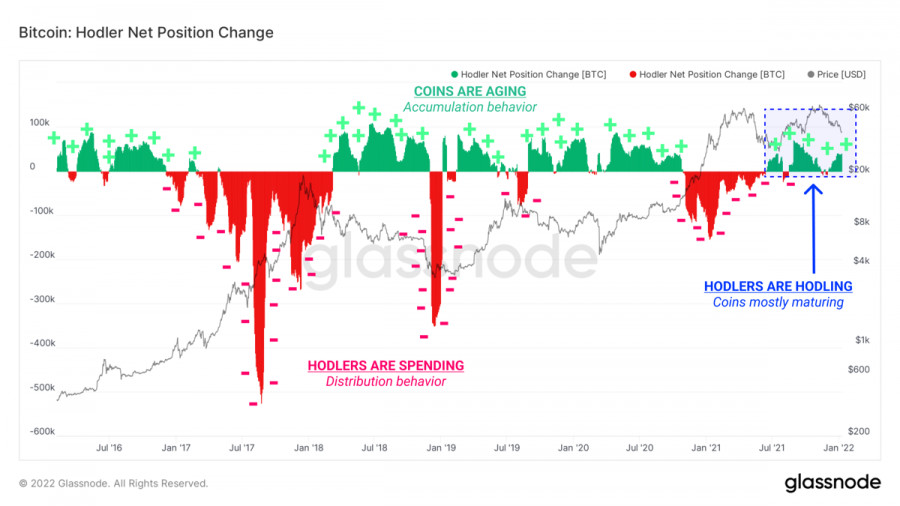
Notably, the cross-national regulation of the crypto industry does not exclude regulations on a national scale. In Thailand, for example, a specially created commission has announced that an extensive list of regulations for digital assets will be ready for approval at the end of January. Several types of taxation of crypto-assets are expected to be adopted, which could set a precedent that negatively affects the attraction of new investors and investments in the cryptocurrency market. Despite this negative background, major cryptocurrencies held key support levels. All market attention is focused on bitcoin, which as of 14.30 managed to break through and fix above $43,000. The steady recovery of the BTC/USD pair quotations is accompanied by an increase in buying activity and accumulation of volumes. According to Glassnode, investors with wallets of 1,000 BTC or more have begun to actively accumulate bitcoins after the asset broke through $50,000. Mining companies have also launched a period of accumulation of volumes. All the above indicates preparations for a recovery towards the $45,000-$50,000 range.
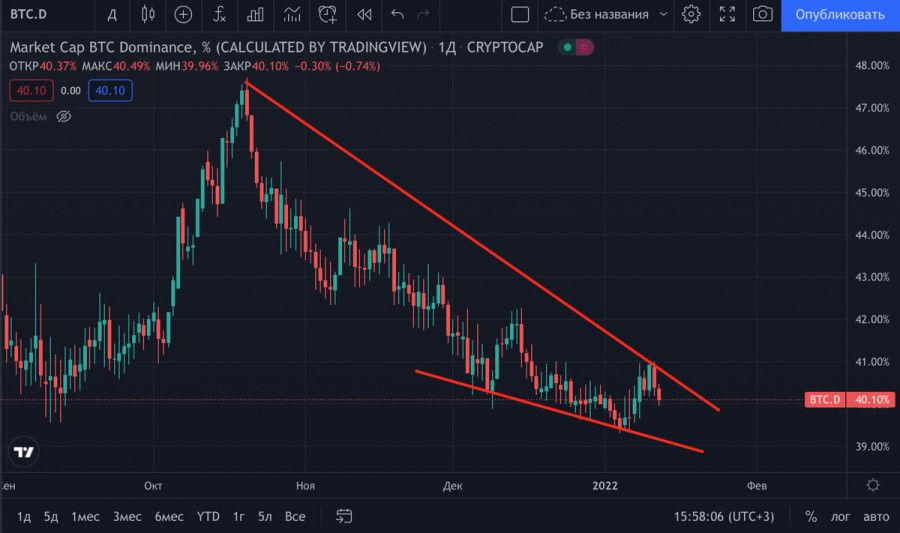
Bitcoin's dominance index is near a swing low of 40. This suggests that in the next month and a half we may see an altcoin season, which will subsequently be interrupted due to bitcoin's full recovery. The main cryptocurrency has reached a local bottom and managed to form a strong support zone. In the near future, I expect the start of the recovery period and fixation in the range of $42,000-$50,000. However, I keep in mind a potentially negative Fed report and the subsequent increase in volatility, which could send bitcoin gain liquidity in the $38,000-$40,000 range.
|
| Posted: 12 Jan 2022 04:07 AM PST Futures on US stock indices rose slightly on Wednesday, as investors are counting on a less aggressive report on US inflation, although prices are expected to rise at the fastest pace in almost 40 years. Dow Jones Industrial Average futures gained 46 points, while S&P 500 futures rose 0.1%. Nasdaq 100 jumped 0.2%. As noted above, the entire focus of traders during American trading will be on what data on the consumer price index for December of this year will be released. Economists expect CPI to grow by 7% compared to last year – the highest since the summer of 1982, and by 0.4% compared to November - this will be evidence of a slowdown in growth after a jump of 0.8%. The base index excluding food and energy is projected at 5.4% and 0.5%, respectively.
Some economists believe that inflation may show its peak value, after which its gradual decline will begin. For this reason, many will carefully consider this report for longer-term guidance in their strategies. Yesterday, Fed Chairman Jerome Powell told Senate lawmakers that he expects interest rates to rise this year along with the end of the monthly bond purchase program in March and the reduction of the Fed's balance sheet. Powell noted that these steps will be required to regain control over inflation, but such actions do not pose a threat to the economy - it has already largely recovered from the shock caused by the coronavirus pandemic and its various waves. Powell also did not talk about how many interest rate hikes there will be this year. The reaction of stock markets was lightning fast, as concerns related to the recent hawkish tilt of the Fed and the prospect of a more aggressive rate hike calmed down a bit, forcing investors to look at the cheaper assets. Bond yields, which rose sharply in early 2022, also stabilized on Tuesday, with the yield on 10-year Treasury bonds falling to 1.76% after exceeding the 1.8% level earlier this week. At the end of this week, major banks will begin the reporting season for the fourth quarter of 2021, so market volatility should remain at an acceptable level. JPMorgan Chase, Citigroup, and Wells Fargo will report. Quarterly results will be published before the market opens.
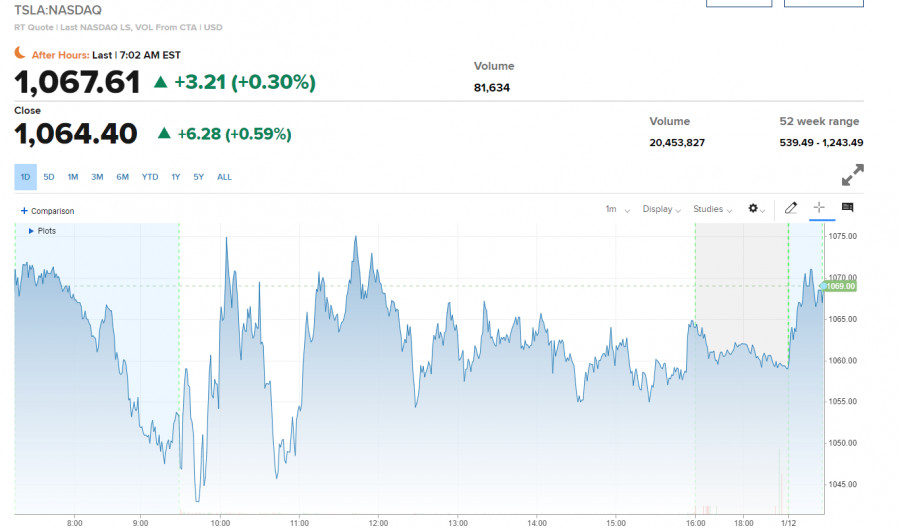
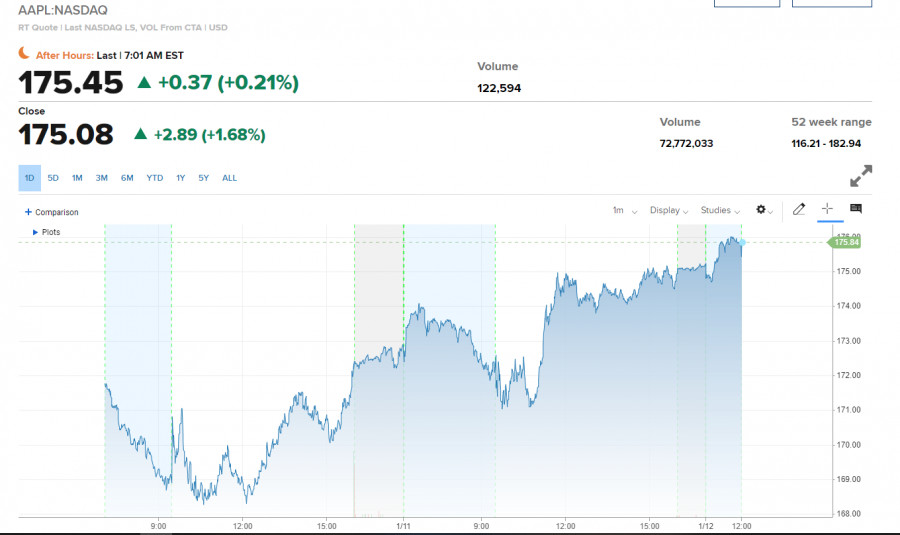
As for the premarket, Dish Network's securities are showing a satisfying large growth today, which jumped by 7.4% after the news that the company is again negotiating a merger with DirectTV. Norwegian Cruise Lines shares rose 1.9%, while Hilton Worldwide Holdings' shares rose 1.2%. Tesla securities at the moment added 0.5% and traded at 1070, after which they rolled down a little. Apple is also trading in a small plus 0.5% after yesterday's growth of 1.68% following the results of the regular session.
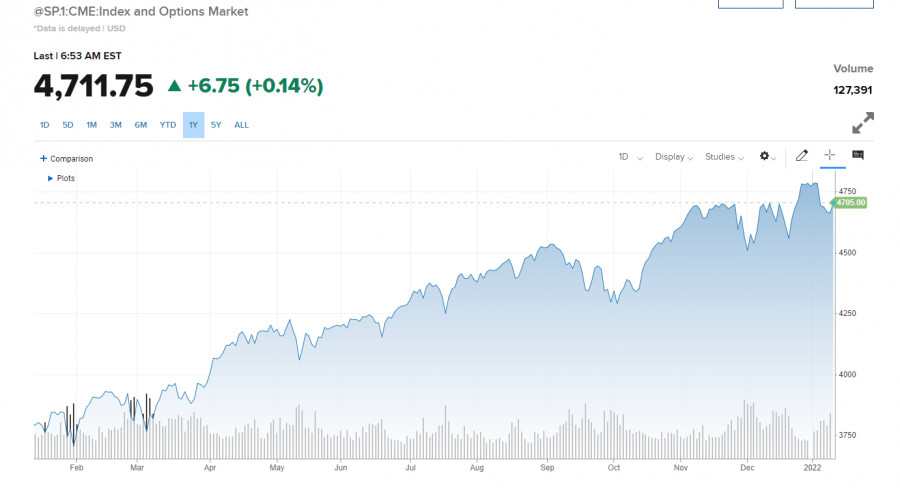
As for the technical picture of the S&P 500 Yesterday, the bulls returned the level of $ 4,665 and aimed for a more active recovery above $ 4,722. Only going beyond this range will return bullish momentum, which will lead the trading instrument to a larger resistance of $4,772 and open up an opportunity to upgrade to $ 4,818. With a repeated downward movement and a breakdown of $4,665, the S&P 500 will fall to the area of $ 4,598 and $ 4,551. The material has been provided by InstaForex Company - www.instaforex.com |
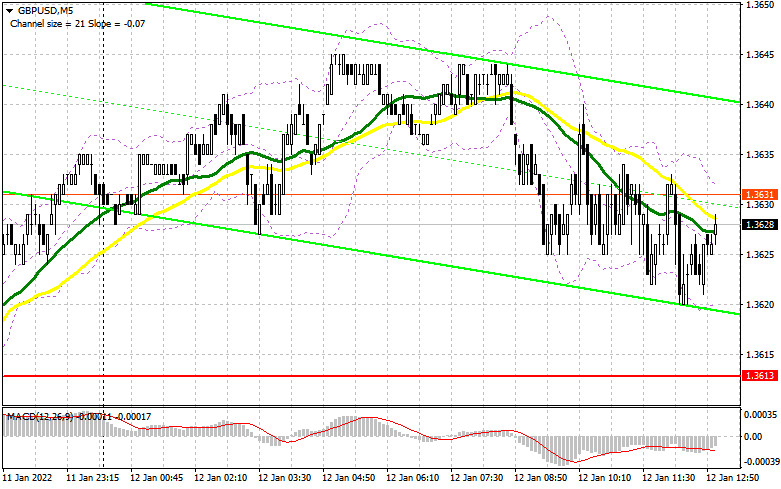
| Posted: 12 Jan 2022 03:46 AM PST To open long positions on GBP/USD, you need: In my morning forecast, I paid attention to the level of 1.3613 and recommended making decisions on entering the market. Let's take a look at the 5-minute chart and figure out the entry points. Due to the very low trading volume and volatility, we did not wait for the test of the nearest support level of 1.3613. In this regard, it was not possible to get signals to enter the market. The lack of important fundamental statistics is also one of the reasons why the pound is marking time. From a technical point of view, nothing has changed for the second half of the day. And what were the entry points for the euro this morning?
The primary task of buyers for today is to protect the support of 1.3613, which was formed following the results of yesterday. At this level, there are moving averages playing on the side of the bulls, which should also help the buyers of the pound to cope with the pressure. The formation of a false breakdown at 1.3613 forms a buy signal with the prospect of continuing the bull market aimed at updating the new resistance of 1.3664. A breakdown and test of this level from top to bottom will give an additional entry point and strengthen the position of buyers to continue the growth of GBP/USD to the highs: 1.3710 and 1.3754. A more distant target will be the 1.3793 area, where I recommend fixing the profits. However, this level will be available only with very weak inflation in the US in December this year. In the scenario of a decline in the pound during the US session and a lack of activity at 1.3613, it is best to postpone purchases to the level of 1.3566, from where it was possible to observe more aggressive actions of bulls yesterday. To miss this area is tantamount to missing the initiative. Only the formation of a false breakdown there at 1.3566 will give an entry point in the expectation of further recovery of GBP/USD. You can buy the pound immediately on a rebound from 1.3532, or even lower - from a minimum of 1.3493, counting on a correction of 20-25 points within the day. To open short positions on GBP/USD, you need: Bears have nothing so serious to offer so far to influence the bullish trend. Thank you for at least not being allowed to update the next monthly highs during European trading. Today's inflation in the United States may change the situation, but this is unlikely. Most likely, it will not go beyond the forecasts of economists, which will allow the Fed to pursue a less aggressive policy, as Jerome Powell said yesterday. The primary task for today remains to protect the resistance of 1.3664, as the pair's exit above this range will create several technical problems and lead to the continuation of the bullish trend. In the afternoon, a representative of the Bank of England will also speak, which may shake the market a little if it touches on the topic of interest rates. The formation of a false breakdown at the level of 1.3664 forms the first entry point into short positions, followed by a decline in the pair to the area of 1.3613, for which you will have to fight hard since there are also moving averages playing on the side of the bulls. A breakdown of 1.3613 and a reverse test from the bottom up will increase pressure on the pound and dump it to the next support of 1.3566. Only the consolidation and the reverse test of 1.3566 from the bottom up will give a new entry point into short positions with the prospect of a decline in GBP/USD by 1.3532 and 1.3496, where I recommend fixing the profits. If the pair grows during the American session and sellers are weak at 1.3664, it is best to postpone sales to a larger resistance of 1.3710. I also advise you to open short positions there only in case of a false breakdown. It is possible to sell GBP/USD immediately for a rebound from a large resistance of 1.3754, or even higher - from a new maximum in the area of 1.3793, counting on the pair's rebound down by 20-25 points inside the day.
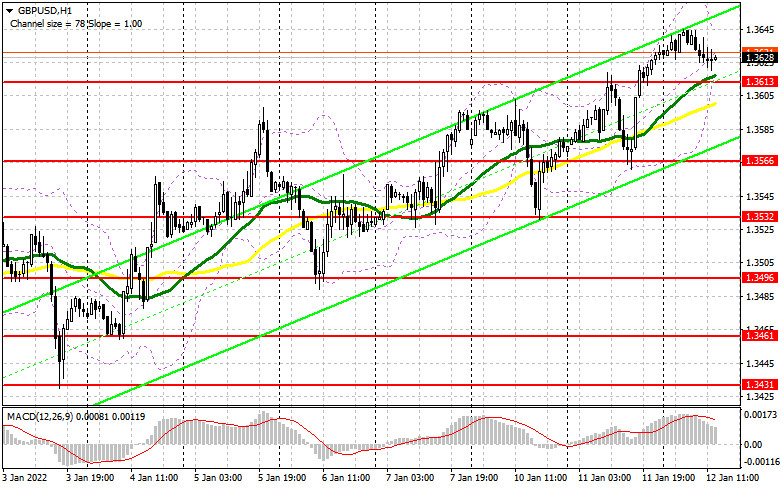
The COT reports (Commitment of Traders) for January 4 recorded a sharp increase in long positions and a reduction in short positions - which indicates an increase in the attractiveness of the pound after the Bank of England raised interest rates at the end of last year. If you look at the overall picture, the prospects for the British pound look pretty good. The Bank of England's decisions continues to support buyers of risky assets in the expectation that the regulator will continue to raise interest rates this year, which will make the pound even more attractive. High inflation remains the main reason why the Bank of England will continue to tighten its monetary policy. On the other hand, the US dollar also has support: inflation data in the US are expected this week, which, together with the recent report on the US labor market, will certainly force the Federal Reserve System to act more aggressively. The first interest rate hikes are planned in the spring, which will make the US dollar more attractive. The COT report for January 4 indicated that long non-commercial positions rose 20,824 to the level of 25,980, while short non-commercial positions fell from the level of 78,510 to the level of 65,151. This led to a serious change in the negative non-commercial net position from -57,686 to -39,171. The weekly closing price rose from 1.3209 to 1.3482. Signals of indicators: Moving averages Trading is conducted above 30 and 50 daily moving averages, which indicates the continuation of the pound's growth further along with the trend. Note: The period and prices of moving averages are considered by the author on the hourly chart H1 and differ from the general definition of the classic daily moving averages on the daily chart D1. Bollinger Bands A breakthrough of the upper limit of the indicator in the area of 1.3645 will lead to a new wave of growth of the pound. A breakthrough of the lower limit of the indicator in the area of 1.3610 will increase the pressure on the pound. Description of indicators
|
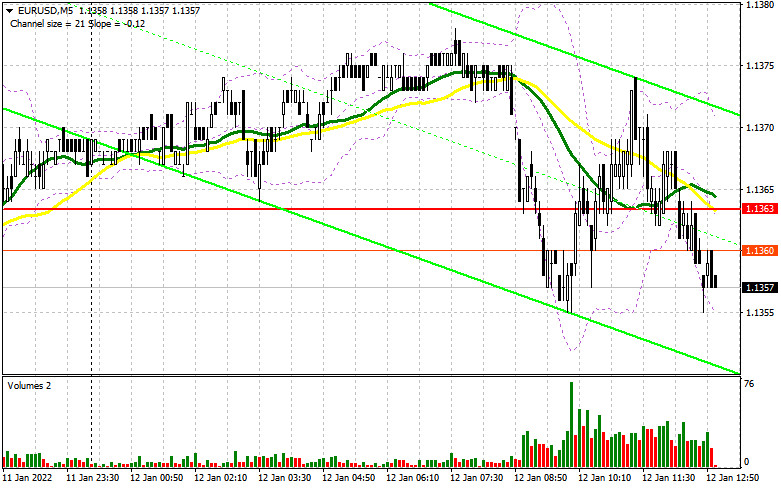
| Posted: 12 Jan 2022 03:34 AM PST To open long positions on EUR/USD: In the morning review, I paid attention to the level of 1.1363 and recommended it as a point for entering the market. Let's take a look at the 5-minute chart and see what happened there. After strong growth yesterday, the euro bulls failed to maintain the uptrend. The macroeconomic data for the euro area did not affect the volatility of the pair in any way. In the near term, markets will most likely focus on the CPI data in the US. A false breakout at 1.1363 in the first half of the day and a return to this level generated a buy signal. However, having gained 13 pips, the pair suddenly lost its bullish momentum. No other entry points were formed, so I had to revise the technical picture of the pair.
As I mentioned earlier, a lot will depend on the US inflation data for December which will be released shortly. If consumer prices stay near the current levels, the EUR/USD pair is set to grow in the short term. But before the pair can leave the sideways channel and break through its upper boundary, buyers need to focus on the level of 1.1353. This level was formed by end of the morning session. Moving averages that support the bullish trend are located slightly below this area. A false breakout at this level and weak data in the US should prompt the euro to retest the high of 1.1385. It is important for bulls to break through this range, and a retest of this level will pave the way towards the levels of 1.1415 and 1.1442 where I recommend taking profit. A further target will be the area of 1.1480. If the price reaches this level, it will confirm the resumption of the bullish trend. In case the pair declines during the North American session and bulls lose momentum at 1.1353, it is better to wait until the quote reaches stronger support at 1.1324. I recommend opening long positions there only after a false breakout is formed. You can buy EUR/USD immediately on a rebound from the level of 1.1294, setting the next target within a daily correction of 20-25 pips. To open short positions on EUR/USD: Sellers have made several attempts to change the situation but with no success so far. The market seems to be waiting for a new driver, the US report on inflation. If the actual data exceeds the forecast, it will give a strong bullish signal for the US dollar and cause a decline in the EUR/USD pair. However, if the pair rises in the course of the New York session, bears will need to do their best to protect the resistance at 1.1385, which is the upper boundary of a wide sideways channel formed at the beginning of this year. A movement above this level will change the direction of the pair and push it out of the flat channel. A false breakout at 1.1385 will create the first entry point for going short, considering the resumption of downward pressure and a decline towards the 1.1353 area. Both bulls and bears will fight for this level since it is of key importance to them. Moreover, moving averages that support the bullish trend are located below this level. A breakout of this range and its test from bottom to top will give an additional signal to open short positions with the prospect of falling to a low of 1.1324. Only if the price leaves this range, the market direction may reverse to the downside, thus canceling a number of stop-loss orders set by the buyers. This will send EUR/USD to the lows of 1.1294 and 1.1273 where I recommend taking profit. In case the euro develops an uptrend and the bears' activity drops at 1.1385, it is better to wait with selling the pair. The best scenario here will be to open short positions on a false breakout at 1.1415. It is possible to sell EUR/USD right after a rebound from the high of 1.1442, or even higher, near the level of 1.1480, considering a downward correction of 15-20 pips as the next target.
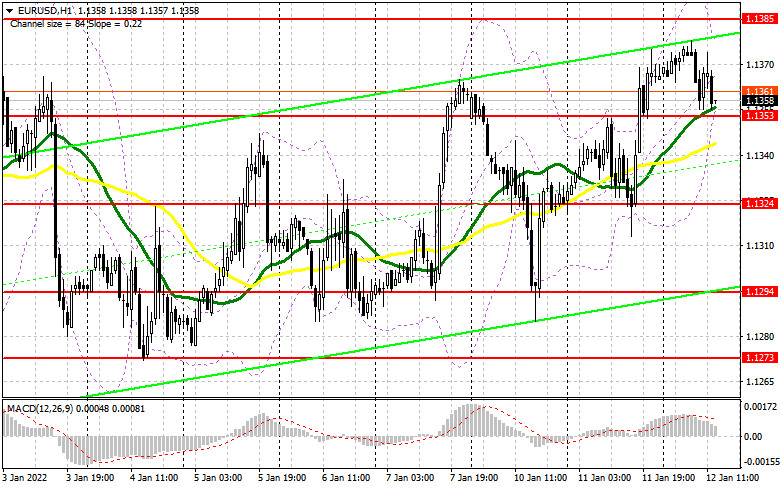
The COT report (Commitment of Traders) for January 4 revealed a sharp increase in the number of long positions and a reduction in short ones, which led to a change in the negative delta value. This suggests that the market sentiment is gradually changing. The demand for the European currency remains high despite the expected changes in the policy of the US Federal Reserve. This week we are waiting for a report on US inflation which is expected to rise above 7% on a yearly basis. If this forecast is confirmed, the US central bank may accelerate the pace of a rate hike. Considering that the situation in the US labor market has improved, we can expect at least four interest rate hikes this year. Meanwhile, the European Central Bank plans to end its emergency bond purchase program in March this year. Apart from this, nothing else has been done by the regulator to tighten its monetary policy which limits the upward potential of risk assets. The COT report indicated that long positions of the non-commercial group of traders went up from 196,595 to 199,073, while short positions fell from 206,757 to 200,627. This suggests that traders will continue to add more long positions on the euro, hoping for an extended uptrend. At the end of the week, the total non-commercial net position decreased its negative value from -10,162 to -1554. The weekly closing price rose slightly and amounted to 1.1302 against 1.1277 a week earlier.
Indicator signals: Moving averages The pair is currently trading just above the 30- and 50-day moving averages, which indicates the advantage of the euro buyers. Please note that the author analyzes the time period and prices of moving averages for the H1 chart only which differs from the general definition of the classic daily moving averages on the D1 chart. Bollinger Bands In case of growth, the upper band of the indicator at 1.1375 will act as resistance. A breakout of the lower band in the area of 1.1353 will deepen the fall of the pair. Description of indicators • A moving average determines the current trend by smoothing volatility and noise. 50-day period; marked in yellow on the chart; • A moving average determines the current trend by smoothing volatility and noise. 30-day period; marked in green on the chart; • Indicator MACD (Moving Average Convergence/Divergence) Fast EMA, 12-day period; Slow EMA, 26-day period. SMA with a 9-day period; • Bollinger Bands: 20-day period; • Non-commercial traders are speculators such as individual traders, hedge funds, and large institutions who use the futures market for speculative purposes and meet certain requirements; • Long non-commercial positions represent the total number of long open position of non-commercial traders; • Short non-commercial positions represent the total number of short open position of non-commercial traders; • The total non-commercial net position is the difference between short and long positions of non-commercial traders. The material has been provided by InstaForex Company - www.instaforex.com |


| You are subscribed to email updates from Forex analysis review. To stop receiving these emails, you may unsubscribe now. | Email delivery powered by Google |
| Google, 1600 Amphitheatre Parkway, Mountain View, CA 94043, United States | |


Comments