Forex analysis review
Forex analysis review |
- The dollar is full of strength and hope in anticipation of the Fed's decision. US may deploy troops, air force and navy in
- EUR/JPY. Passions around Ukraine: the yen skims the cream
- EUR/USD: the dollar will fall or soar - depends on the answer to the question: the Fed is ahead of the locomotive or is in
- January 26, 2021 : EUR/USD daily technical review and trading opportunities.
- Trading plan for GBP/USD on January 27: analysis of trades and simple tips for beginners
- January 26, 2021 : EUR/USD Intraday technical analysis and trading plan.
- January 26, 2021 : GBP/USD Intraday technical analysis and significant key-levels.
- Technical analysis of GBP/USD for January 26, 2022
- Technical analysis of EUR/USD for January 26, 2022
- GBPUSD at short-term resistance.
- Bitcoin: Short-term bounce or change in trend?
- EURUSD still trading around 1.13.
- How to trade EUR/USD on January 27, 2022. Simple trading tips and analysis for beginners
- Gold reverses towards cloud support.
- Gold upside invalidated, FOMC under spotlights
- Elon Musk urges McDonald's to accept Dogecoin
- EUR/USD challenges 1.1273 support before FOMC storm
- Video market update for January 26,,2022
- Trading signals for Dow Jones-30 (#INDU) on January 26 - 27, 2022: buy in case of rebound at 34,194 (21 SMA)
- BTC/USD on January 26. Short-term forecast for Bitcoin from the point of view of wave analysis. Trading recommendations for
- Crypto reputation tarnished by money laundering
- Wave analysis of EUR/USD on January 26, 2022
- Trading signals for BITCOIN on January 26 - 27, 2022: buy above $37,500 (6/8)
- Bitcoin survives biggest sell-off since 2020 and recovers above $35k: will BTC correction continue?
- Indonesia bans cryptocurrency transactions and markets await Fed meeting results
| Posted: 26 Jan 2022 01:17 PM PST
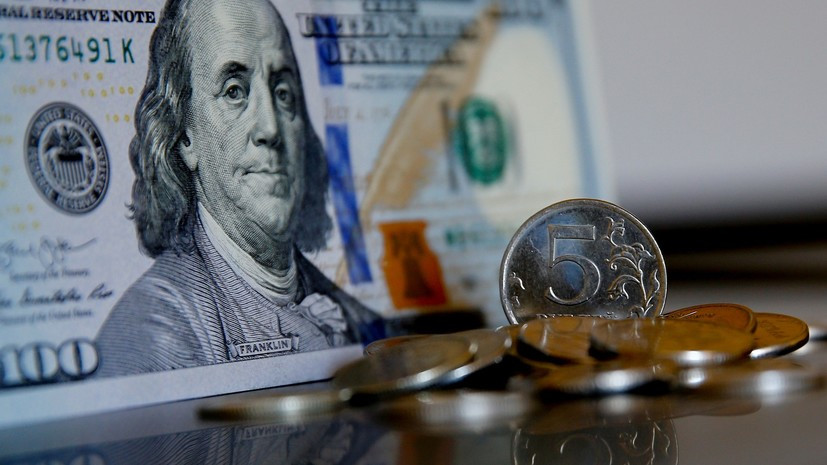
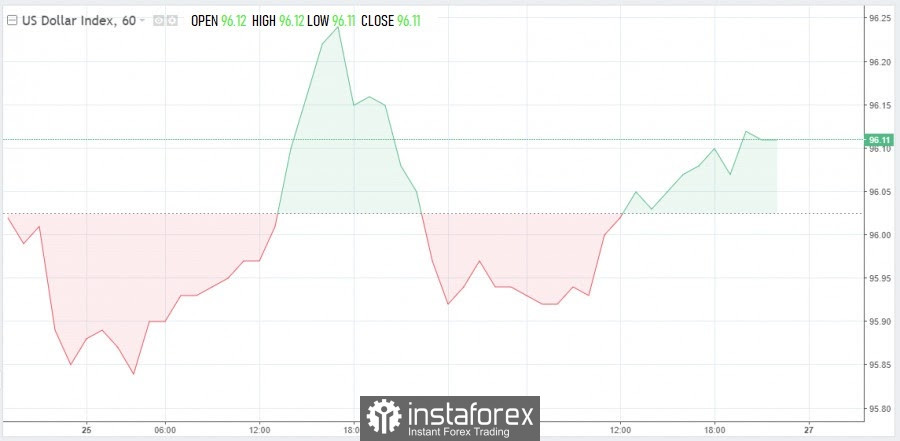
The US dollar is holding below the maximum level in 2.5 weeks on Wednesday. Support for the US currency on Wednesday afternoon is provided by investors' expectations of an increase in the Federal Reserve's interest rate. Some analysts are waiting for specifics on this issue from the central bank today. The US central bank will announce its decision on monetary policy today, then Fed Chairman Jerome Powell's press conference will begin. If the Federal Reserve still does not voice its own assumptions about a more aggressive tightening of monetary policy, then the dollar may weaken. Recall that inflation in the United States has almost reached the highest level in the last 40 years. At the same time, the unemployment rate fell to 3.9%. Since the beginning of this week, the markets have been in a state of both rise and fall. A kind of roller coaster was created by the hawkish position of the Fed and the obvious slowdown in growth. This combination worried investors, as a result of which the shares of large technology companies were sold off, and more reliable assets, which is the dollar, were in demand. As a result, the dollar on Wednesday against a basket of six major currencies reached its maximum level on January 7 - the 96.30 mark. Later, a decline below this level followed. Wednesday's trading showed a restrained mood of the participants, the greenback at the time of preparation of this material was at 96.11, futures for American stocks at the same time rose on the charts by more than 1%. USD Index
Tensions between the United States and Russia over Ukraine remain in the foreground. The beginning of this week was stirred up by the statements of the administration of US President Joe Biden about the expansion of the military presence in Eastern Europe due to the possible invasion of Russia on the territory of Ukraine. According to The New York Times, citing sources in the US administration, the US president does not rule out the possibility of deploying several thousand American troops, as well as ships and aircraft in the Baltic states and Eastern Europe. By the way, Biden admitted the possibility of such a development of events in December, noting at the same time that this could happen only in the event of an invasion of Russian troops on the territory of Ukraine. On January 22, at a meeting at the country residence of the US president, Camp David Biden was presented with several options from representatives of the Pentagon. One of which involves sending military personnel totaling 1-5,000 to the territory of Eastern Europe. If this plan is implemented, the number of NATO military personnel in Eastern Europe will increase tenfold. According to sources of the popular news outlet, the US president will make a final decision on this issue this week. At the same time, it should be noted that none of the options proposed by the Pentagon for the development of events provides for additional American troops on the territory of Ukraine itself. Meanwhile, the Russian Black Sea Fleet has already begun large-scale exercises. More than 20 warships as part of ship groups left the locations of Sevastopol and Novorossiysk, then made the transition to the designated areas in the Black Sea. The material has been provided by InstaForex Company - www.instaforex.com |
| EUR/JPY. Passions around Ukraine: the yen skims the cream Posted: 26 Jan 2022 01:16 PM PST Trading dollar pairs is risky today: the results of the January Federal Reserve meeting may redraw the fundamental picture, strengthening or weakening the position of the US currency. Moreover, we should not forget about the risks of false price movements, especially in the short period of time between the publication of the final communique and the press conference of Fed Chairman Jerome Powell. Therefore, it is advisable to stay out of the market for the next half-day, given the high degree of uncertainty. Or take a closer look at the main cross-pairs that are not affected by the greenback. Among the key crosses, the EUR/JPY pair can be distinguished: there is a pronounced downward trend here, which is due not only to the strengthening of the yen, but also to the weakening of the single currency. Such a "tandem" has led to the fact that the pair has decreased by almost 300 points over the past week. As you know, the Japanese currency is a safe haven instrument, so the growth of anti-risk sentiment has significantly strengthened the yen's position against the basket of major currencies – even the USD/JPY pair has been actively resisting the onslaught of dollar bulls in recent days. In other words, the yen now has its own resources for independent growth, and paired with the euro, the currency clearly dominates. However, not only paired with the single currency – for example, paired with the pound, the yen has also strengthened its position by almost 500 points since mid-January.
The growth of anti-risk sentiment in the markets is due to the escalation of tensions between Russia and Ukraine. To be more precise, the financial world is more concerned about the global prospects of the conflict. After all, all the previous events that took place earlier in the East of Ukraine were ignored by the market: traders of the foreign exchange market did not take into account the local, in their opinion, conflict. However, now the situation has acquired a larger scale - primarily in the context of information "pumping" by the Western media and top politicians in Europe and the United States. There is a rather paradoxical situation when the top officials of Ukraine and Russia deny preparations for military escalation, and the front pages of influential publications convince their readers of the opposite. For example, the President of Ukraine said this week that "there are no reasons for any panic, everything is under control." The Secretary of the National Security and Defense Council of Ukraine also urged Ukrainians to remain calm. At the same time, he stressed that he does not see the possibility for a full-scale Russian offensive on Ukraine. In turn, the Ukrainian Defense Minister said yesterday that at the moment the Russian armed forces "have not created a single strike group that would indicate planning an invasion of Ukraine." And although representatives of the Ukrainian side do not exclude negative scenarios, their rhetoric differs from the rhetoric of many Western politicians and those in power. For example, the head of the British government, Boris Johnson, said the day before yesterday that Moscow was preparing an "attack on Kiev." Referring to British intelligence data, he said that there are allegedly 60 Russian combat groups on the border of Ukraine with "a plan for a lightning war that can capture the country's capital." Prior to that, information appeared in the American press that the largest Ukrainian city of Kharkiv could be occupied in the near future. Against the background of such reports, it became known about the evacuation of relatives of employees of the US Embassy in Kiev. Then the UK, Australia and Germany announced the recall of their diplomatic staff from Ukraine. At the same time, the information background is "fueled" by militaristic statements and/or decisions. In particular, the head of Belarus Alexander Lukashenko promised to deploy "a whole contingent of the Belarusian army" on the border with Ukraine. This statement was made against the background of preparations for the joint military exercises "Allied Resolve-2022" with the Russian Federation, which will begin on February 10. In turn, a number of NATO member countries have announced the deployment of forces in Eastern Europe. For example, Spain will send warships to the Black and Mediterranean Seas, and fighters to Bulgaria. Denmark has already sent a frigate to the Baltic Sea and four F-16 fighters to Lithuania, the Netherlands is transferring two F-35 fighters to Bulgaria, France has expressed readiness to send troops to Romania, and the United States is considering increasing its military presence in eastern Europe. In particular, a Pentagon spokesman said the day before yesterday that about 8,500 American troops were put on high alert to support the NATO response force and in case of other emergencies. In other words, the prevailing fundamental background contributes to the strengthening of anti-risk sentiment in the market due to an increase in geopolitical risks. Shares of global companies began to actively lose their market value, while protective assets began to be in high demand. The beneficiary of the current situation in the context of the EUR/JPY cross-pair was the yen. It can be assumed that the pair's downward trend has not yet exhausted itself, since the conflict situation is still far from de-escalation. For example, today it became known that the United States has prepared, but has not yet transmitted to Russia its response to the request for "security guarantees". In addition, the foreign ministers of the United States and the Russian Federation recently announced that they would continue negotiations, but only after the United States had submitted written responses to Russia's demands. Thus, the unpredictable situation around Ukraine creates the basis for further development of the EUR/JPY downward trend. It is advisable to use any upward pullbacks on the pair to open short positions. The same is said by the technical side of the issue. The cross-pair on the daily chart is located between the middle and lower lines of the Bollinger Bands indicator, as well as on the lower border of the Kumo cloud (128.70). If the bears are able to settle below this target, we can consider short positions with the first target of 128.40 (the lower line of the Bollinger Bands on D1) and the main target of 127.80 – the lower boundary of the Kumo cloud on the W1 timeframe. The material has been provided by InstaForex Company - www.instaforex.com |
| Posted: 26 Jan 2022 01:16 PM PST
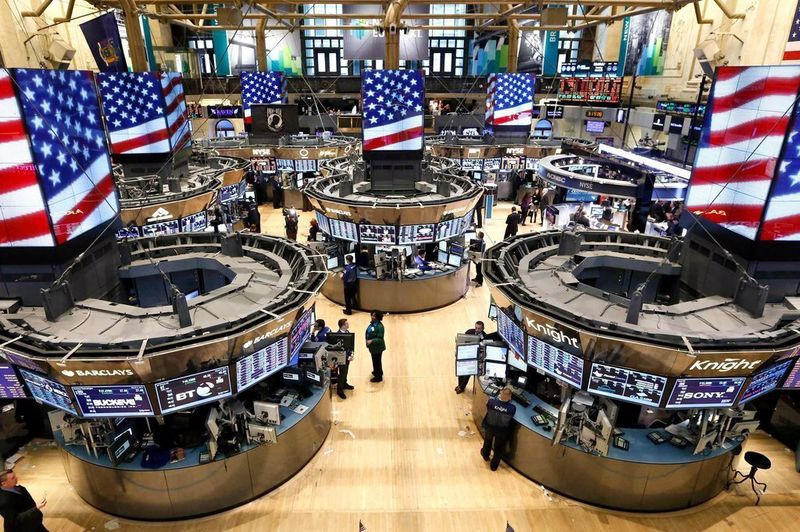
Markets held their breath waiting for the announcement of the Federal Reserve's verdict on monetary policy. The main currency pairs were locked in narrow trading ranges. On Tuesday, the greenback reached a high of more than two weeks around 96.25, after which it entered the consolidation phase. The day before, the EUR/USD pair fell to a monthly low near 1.1265 before recovering to 1.1300. This behavior of currencies is very different from the dynamics of the US stock market, which experienced a sell-off during the Asian session on Tuesday and resumed falling after the opening of New York sites. Following the results of yesterday's trading, the Dow Jones index sank by 0.19%, the S&P 500 declined by 1.22%, and the Nasdaq lost 2.28%. At the same time, the VIX (the so-called "Wall Street fear index") rose by 4.21% to 31.16, reaching a new six-month high. The high volatility of the stock market indicates the nervousness of investors who do not know how hawkish the statements of the US central bank will be following the results of the next meeting. The central bank's position on a number of issues will determine the dynamics of the currency and stock markets in the near future. Most analysts believe that for now the Fed should leave monetary policy unchanged. Nevertheless, the intrigue persists. Market participants are eagerly awaiting further clues about the timing and pace of interest rate hikes, as well as when and how the central bank is going to cut almost $9 trillion on its balance sheet, a process dubbed quantitative tightening (QT). If the high-tech Nasdaq is already mastering the correction zone, then the S&P 500 broad market index is about to join it - it has less than 1% left before entering the "bearish" territory. At the moment, the index has retreated from the record high recorded in early January by more than 9%. On Wednesday, futures on the main Wall Street indices are recovering in the hope of the softness of the comments of Fed Chairman Jerome Powell, who will take into account the fall in stocks, according to investors who are now buying.
The recent sell-off in the stock market was caused by concerns that the US central bank will begin to tighten policy earlier and faster than expected. According to CME, traders estimate the probability of an increase in the federal funds rate at the March FOMC meeting at almost 95%, and the probability of four rises for the entire 2022 exceeds 85%. Moreover, the chances of a fifth increase have increased to almost 60%. Goldman Sachs analysts believe that the acceleration of inflation in the United States may lead to the Fed becoming even more aggressive than expected regarding rate hikes this year. "We see the risk that the Fed will want to take certain steps to tighten monetary policy at the end of each meeting until the inflation picture changes," they said. JPMorgan Chase also sees a pretty good chance of more than four rate hikes, considering even six or seven rate hikes possible. The turbulence of the US stock market since the beginning of the month should send a clear signal to the Fed that it is not ready for such tough steps by the central bank. In the fall of 2018, Powell missed such a signal by insisting on further rate hikes in 2019. Did the Fed chairman draw any conclusions from that episode? This is a question for hundreds of billions of dollars, which can be added or disappear from the capitalization of companies traded on the US stock market. If the central bank is ready to raise the rate in March, then the "forward guidance" should indicate this. At least, FOMC members confirmed this possibility in separate speeches. At the same time, the central bank's increase in the key rate by 25 basis points has already been fully taken into account in the quotes. According to forecasts, the rate will increase by 100 basis points in total over the year. Attempts to restore US stock indices and the consolidation of the dollar confirm these expectations, which means that in order to further strengthen the US currency, the Fed should show a very hawkish attitude.
If Powell will say that the rate hike will begin in March, and it will take more than four rounds of monetary policy tightening to contain inflation, the greenback will sharply strengthen against its main competitors. However, any scenario in addition to this can provoke a rally in stocks and other risky assets, reducing the demand for a protective USD. For example, the head of the Fed may assume that inflation will normalize after several rounds of rate hikes or emphasize the dependence of the pace of policy tightening on economic indicators. The key point will also be the announced role of the asset balance in normalizing the Fed's policy. If the central bank gives QT more weight, the forecast of four rate hikes this year may be under threat, respectively, a rollback of expectations will follow, which will deprive the US currency of support. At the same time, the beginning of the reduction of the Fed's balance sheet at the meeting on March 16 is unlikely, since it is still growing and will finish growing closer to mid-March. "What they will need to do is say that we will respond as the conditions require. We need to cope with inflation, and even with what we are seeing, financial conditions are too loose. This is the only message they can give now," Grant Thornton analysts believe. "The fact that Fed officials are talking about reducing the balance sheet at the same time that they are still increasing it is a bit inconsistent. For this reason, we expect that there may be some disagreements at the current meeting, and at least one FOMC member, such as St. Louis Fed President James Bullard, may insist on an immediate cessation of purchases," they added. If there is a need to accelerate the transition to normalization of monetary policy, the central bank could announce the end of quantitative easing at the January meeting, but FOMC members are unlikely to take this step, given the recent fall in stock indices. If the Fed does announce the end of the active phase of QE at the current meeting, the shock is guaranteed, the stock market will collapse, and the greenback will soar amid investors' flight from risk. A similar effect can be produced by the statement of Powell on the possibility of raising the rate immediately by 0.50% in March. Although futures on major US stock indexes are rising by more than 1% on Wednesday, market sentiment remains fragile, strategists at TD Securities say. "Any hints from the Fed on a starting point for QT or an "earlier" and "faster" rate hike may affect the market, but we do not expect final signals yet, and the result may be ambiguous," they said. While waiting for the Fed's verdict on monetary policy, investors remain in a nervous state, which keeps the US currency afloat. At the same time, traders are not in a hurry to buy the dollar, assessing how active the Fed's actions will be in the fight against inflation.
"We believe that the US central bank will say that it is going to use all the tools to combat inflation, which is still a problem, even though the S&P 500 index has fallen by 10%. We don't think they will be scared by this. They need to tighten financial conditions so that they can better cope with inflation. Therefore, the Fed is unlikely to come out and say that the market is misjudging four rate hikes this year," Bank of America strategists noted. "We believe that the hawkish tone at the FOMC meeting can serve as a key catalyst for the next dollar growth. Our forecast for EUR/USD for this year remains at 1.1000, and it is likely that this level will be reached earlier. We expect the first increase in the federal funds rate in March, and then an increase of 25 basis points will be in each quarter. We predict that quantitative tightening will be announced at the meeting in June, but there is a risk that it will be done in May," they added. On Wednesday, the USD index is moving sideways around 96.00, which allows the EUR/USD pair, which is trading today at 1.1300, to consolidate losses. If the Fed reports that it may begin to reduce the balance sheet after the first rate hike, which will most likely take place in March, this will support the dollar. Moreover, the greenback is likely to benefit from the Fed's decision to complete quantitative easing earlier than planned by increasing the pace of curtailing monthly asset purchases. On the other hand, the Fed may express concern about the deteriorating prospects for the global economy and take a cautious stance on tightening policy in the future. Such a tone of the central bank's statements may provoke a sharp recovery in US stocks and make it difficult for the dollar to find demand. "Some market participants assume that today Powell may soften his tone a bit, and the FOMC will try to signal three, not four, rate hikes this year. Such an outcome may put pressure on the USD and provoke a breakthrough of the EUR/USD pair in the north direction. In general, the current long positioning of the market in the US currency continues to indicate the potential of EUR/USD pullbacks. Taking into account the continuing divergence of the Fed and ECB rates, as well as the potential support for the USD from the flight of investors to safe havens, we prefer to sell the pair on growth, expecting further strengthening of the dollar by the middle of the year," Rabobank analysts said. The technical picture, which has changed little since the previous day, indicates that attempts to restore the main currency pair are likely to remain short-lived. In particular, EUR/USD remains below the bearish trend line from mid-January, and the RSI indicator remains below 50. The nearest support is located at 1.1270, followed by 1.1250 and 1.1230. The initial resistance was marked at 1.1300, and then at 1.1330 and 1.1350. The material has been provided by InstaForex Company - www.instaforex.com |
| January 26, 2021 : EUR/USD daily technical review and trading opportunities. Posted: 26 Jan 2022 01:12 PM PST
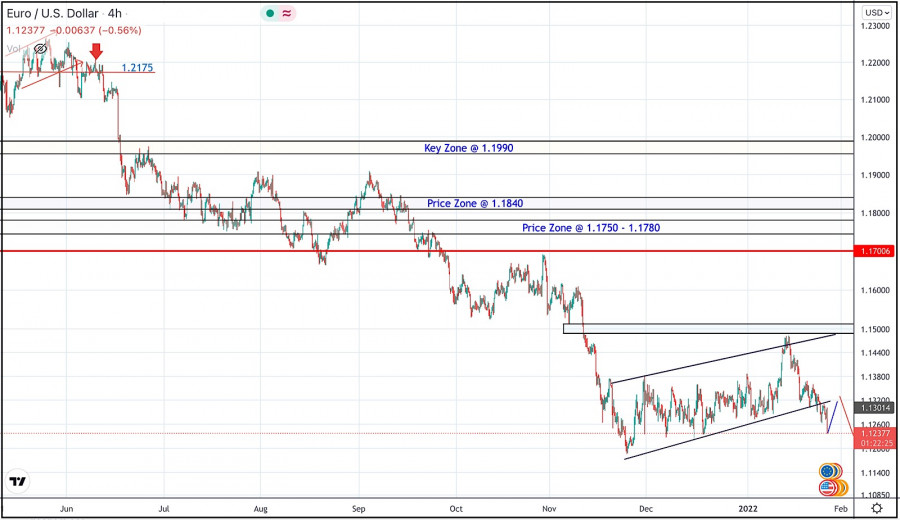
During the past few weeks, the EURUSD pair has been trapped within a consolidation range between the price levels of 1.1700 and 1.1900. In late September, Re-closure below the price level of 1.1700 has initiated another downside movement towards 1.1540. Price levels around 1.1700 managed to hold prices for a short period of time before another price decline towards 1.1200. Since then, the EURUSD has been moving-up within the depicted movement channel. Currently, the price zone of 1.1480-1.1500 stands as an intraday Resistance zone to be watched for short-term SELL trades. On the other hand, the price zone around 1.1500 stands as a prominent supply-zone to be watched for SELLING pressure and a possible SELL Entry upon the next ascending movement. The material has been provided by InstaForex Company - www.instaforex.com |
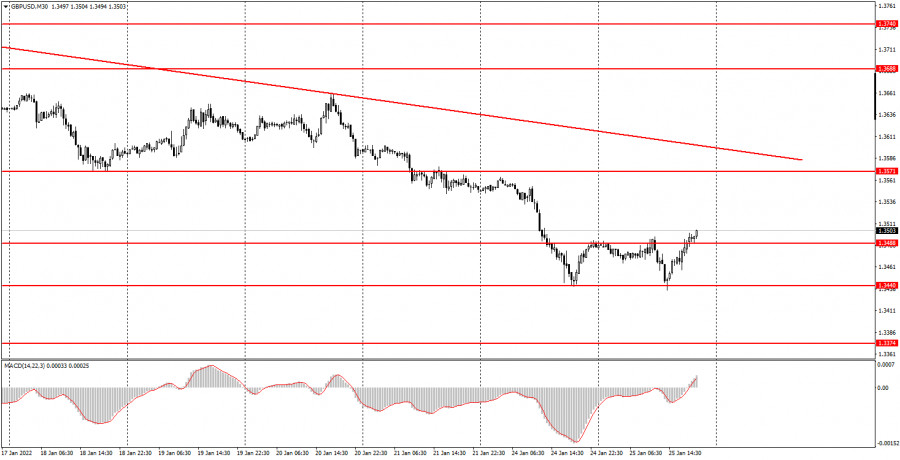
| Trading plan for GBP/USD on January 27: analysis of trades and simple tips for beginners Posted: 26 Jan 2022 12:50 PM PST Analysis of Wednesday's trades:30M chart of GBP/USD
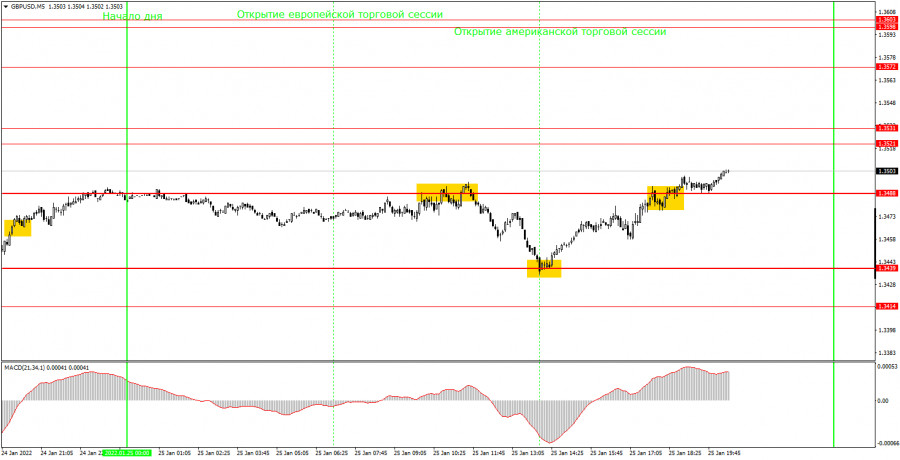
On Wednesday, January 26th, GBP/USD was barely moving. There were some slight changes in the EUR/USD rate, but the cable was stuck in a narrow range. The intraday volatility was limited to 30 pips. Though GBP/USD was fluctuating between 1.3488 and 1.3521, it managed to touch one of these levels only once. As seen on the 30M time frame, the price was above 1.3488 during the day. At the same time, the downward trend line remains valid, so a downward movement may resume at any moment. However, anything can happen today, as the Federal Reserve is scheduled to announce the results of its monetary policy meeting. Naturally, this event is likely to have a great impact on the US dollar. For now, we can only conclude that the downward trend remains intact. The Fed's statement should be extremely dovish to push the GBP/USD pair above the trend line. 5M chart of GBP/USD
The 5M time frame shows that GBP/USD moved between 1.3488 and 1.3521 on Wednesday. In other words, we witnessed a flat trend with the volatility of just 30 pips. The pair was trading in a sideways channel, but it managed to break one of its boundaries only once. In particular, it rebounded from 1.3521 in the late European session. Interestingly, it was a rather strong SELL signal that could be followed by opening a short position. Still, the pair was able to move by only 20 pips after the signal. So, there were two options: either to set a Stop Loss at a breakeven level or close a trade manually at 1.3488. Actually, there was no clear rebound from this level. All we have to do now is wait for the FOMC statement. After that, the pair may move by decent 100-200 pips from the current levels. Trading plan for Thursday, January 27thOn the 30M time frame, GBP/USD continues correcting after two rebounds from 1.3440. However, the situation may change drastically at the end of Wednesday. Before the FOMC statement, the bias remained downward. The post-meeting trend is hard to predict. The regulator is unlikely to hike the interest rate, but it may reduce the QE program. It will be a hawkish decision that may provide support to the US dollar. On the 5M time frame, I set the key levels for tomorrow at 1.3366, 1.3414, 1.3439, 1.3488, 1.3521-1.3531, and 1.3572. The United Kindom will not publish any significant reports while the United States will release the GDP data for the fourth quarter. This report usually has a significant impact on the American currency. The basic principles of the trading system:1) The strength of the signal depends on the time period during which the signal was formed (a rebound or a break)/ The shorter this period, the stronger the signal. 2) If two or more trades were opened at some level following false signals, i.e. those signals that did not lead the price to Take Profit level or the nearest target levels, then any consequent signals near this level should be ignored. 3) During the flat trend, any currency pair may form a lot of false signals or do not produce any signals at all. In any case, the flat trend is not the best condition for trading. 4) Trades are opened in the time period between the beginning of the European session and until the middle of the American one when all deals should be closed manually. 5) We can pay attention to the MACD signals in the 30M time frame only if there is good volatility and a definite trend confirmed by a trend line or a trend channel. 6) If two key levels are too close to each other (about 5-15 pips), then this is a support or resistance area. How to read a chart:Support and Resistance price levels can serve as targets when buying or selling. You can place Take Profit levels near them. Red lines are channels or trend lines that display the current trend and show which direction is better to trade. The MACD indicator (14,22,3) is a histogram and a signal line showing when it is better to enter the market when they cross. This indicator is better to be used in combination with trend channels or trend lines. Important speeches and reports that are always reflected in the economic calendars can greatly influence the movement of a currency pair. Therefore, during such events, it is recommended to trade as carefully as possible or exit the market in order to avoid a sharp price reversal against the previous movement. Beginning traders should remember that every trade cannot be profitable. The development of a reliable strategy and money management are the key to success in trading over a long period of time. The material has been provided by InstaForex Company - www.instaforex.com |
| January 26, 2021 : EUR/USD Intraday technical analysis and trading plan. Posted: 26 Jan 2022 12:46 PM PST
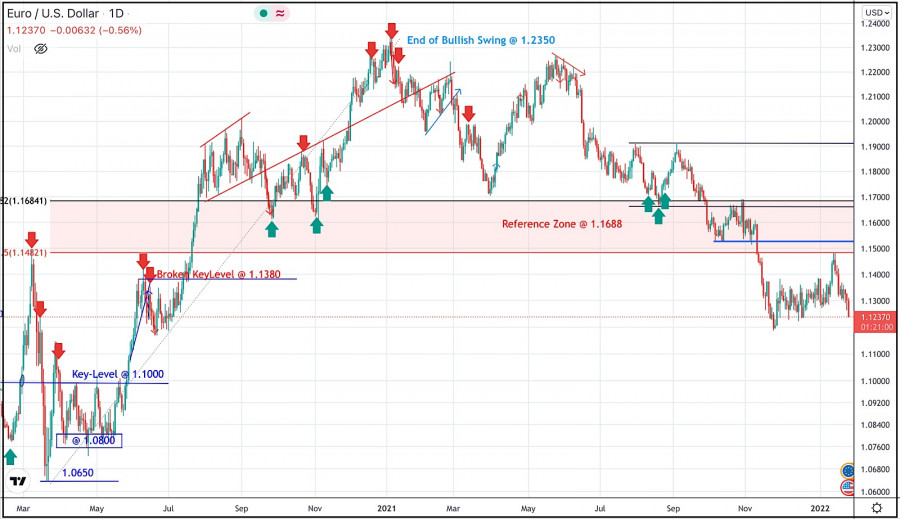
The bullish swing that originated around 1.1650 in August, failed to push higher than the price level of 1.1900. That's why, another bearish pullback towards 1.1650 was executed. However, extensive bearish decline has pushed the EURUSD pair towards 1.1600 and lower levels was reached. Shortly after, significant bullish recovery has originated upon testing the price level of 1.1570. The recent bullish pullback towards 1.1650-1.1680 was expected to offer bearish rejection and a valid SELL Entry. Significant bearish decline brought the EURUSD pair again towards 1.1550 levels which stood as an Intraday Support zone. Hence, sideway movement was demonstrated until quick bearish decline occurred towards 1.1200. Please note that any bullish movement above 1.1500 should be considered as an early exit signal to offset any SELL trades. The price levels around 1.1520 remain a reference zone that needs to be re-visited when the current bearish momentum ceases to dominate. The material has been provided by InstaForex Company - www.instaforex.com |
| January 26, 2021 : GBP/USD Intraday technical analysis and significant key-levels. Posted: 26 Jan 2022 12:43 PM PST
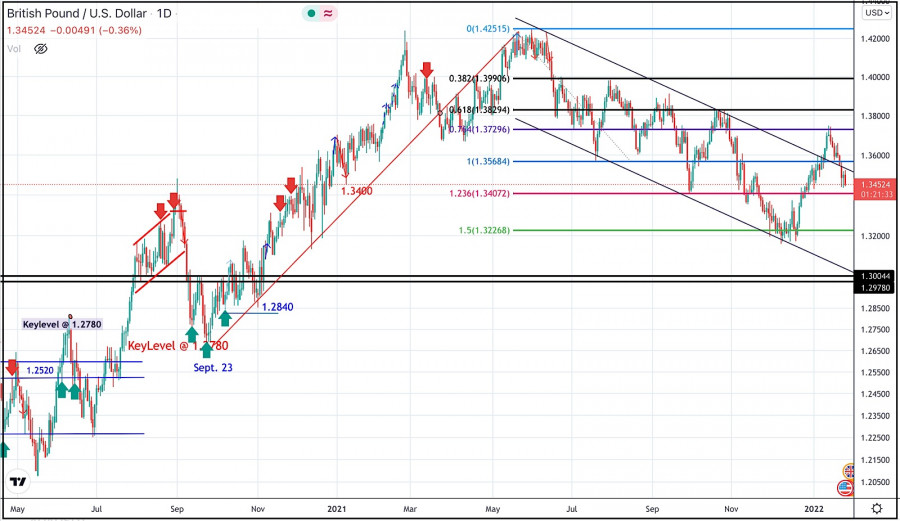
The GBPUSD pair has been moving within the depicted bearish channel since July. Bearish extension took place towards 1.3220 where the lower limit of the current movement channel came to meet with Fibonacci level. Conservative traders should have taken BUY trades around 1.3200 price levels as suggested in previous articles. Recent bullish breakout off the current bearish channel has occurred few days ago. However, BUYERS were watching the price levels of 1.3730 to have some profits off their trades. Moreover, the price level of 1.3720 stood as a key-resistance which offered bearish rejection on last Thursday. Shortly after, the short-term outlook turned bearish when bearish decline below 1.3570 occurred earlier this week. As mentioned before, bearish decline below 1.3570 will probably enhance the bearish side of the market at least towards 1.3400 then 1.3250 if sufficient bearish momentum is maintained. The material has been provided by InstaForex Company - www.instaforex.com |
| Technical analysis of GBP/USD for January 26, 2022 Posted: 26 Jan 2022 12:35 PM PST
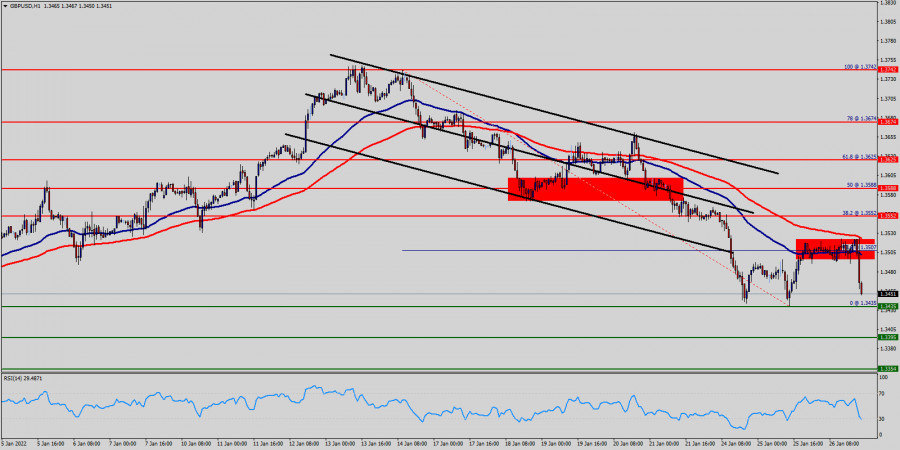
The GBP/USD pair can still form an ascending impulse, it continues to rise upwards. The major support is seen at 1.3435 which coincides with the ratio of 00% Fibonacci - double bottom. According to the main scenario, it may start forming correctional structures. Today, we foresee the price to move towards the level of 1.3435 and then reach a new maximum again around the price of 1.3507. Please, note that the strong resistance stands at the level of 1.4030. If the price breaks the level of 1.4030, we expect potential testing of 1.4100. The current ascending structure implies that the market may reach the level of 1.4100. In this area, the trend is challenging a major resistance level. The ascending impulse is strong enough to buy above the support of 1.3435. Therefore, the price is expected to reach a high once again. It is rather gainful to buy at 1.3435 with the targets at 1.3507 and 1.3552. So, it is recommended to place take profit at the price of 1.3552 as the first target today. On the contrary, stop loss should be placed at the price of 1.3355 (below the daily support). The bullish outlook remains the same as long as the RSI indicator is pointing to the upside on the one-hour chart. The market is still indicating a strong bullish trend from the area of 1.3435. On the downside, a clear break and daily close below 1.3507 could trigger further bearish pressure testing 1.3435 which represents a double bottom. Consequently, the GBP/USD pair is able to close below the support of 1.3435 on the one-hour chart; the trend will continue its bearish momentum today. As a result, it is gainful to sell below this price with targets at 1.3435 and 1.3395. However, the bullish trend is still expected for the upcoming hours as long as the price is above 1.3435 levels. The material has been provided by InstaForex Company - www.instaforex.com |
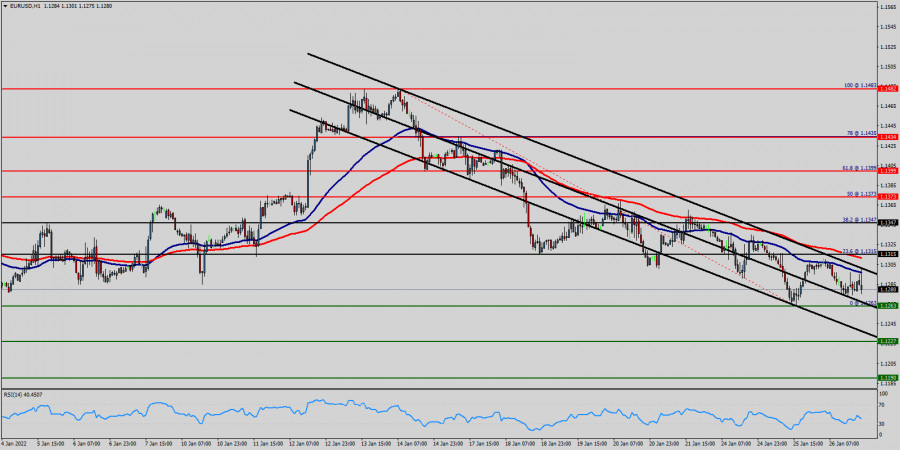
| Technical analysis of EUR/USD for January 26, 2022 Posted: 26 Jan 2022 12:08 PM PST
The EUR/USD pair dropped sharply from the 1.1315 level towards 1.1251. Now, price is set at the 1.1251 - the price of 1.1347 is acting as a daily pivot point. It should be noted that the volatility is very low for that the price of the EUR/USD pair is still moving between 1.1347 and 1.1227 in the coming hours. Furthermore, the price has been set below the strong resistance at the levels of 1.1347 and 1.1434 which coincide with the 38.2% and 78% Fibonacci retracement levels respectively. Additionally, currently the price is in a bearish channel. According to the previous events, the pair is still in a downtrend. From this point, the EUR/USD pair is continuing in a bearish trend from the new resistance of 1.1434. Thereupon, the price spot of 1.1434 remains a significant resistance zone. Therefore, the possibility that the US Dollar will have a downside momentum is rather convincing and the structure of the fall does not look corrective. It will indicate a bearish opportunity below 1.1434, for that it will be a good signal to sell below 1.1434 or 1.1315 with the first target of 1.1227. It is equally important that it will call for downtrend in order to continue bearish trend towards 1.1190. However, the stop loss should be located above the level of 1.1434. The material has been provided by InstaForex Company - www.instaforex.com |
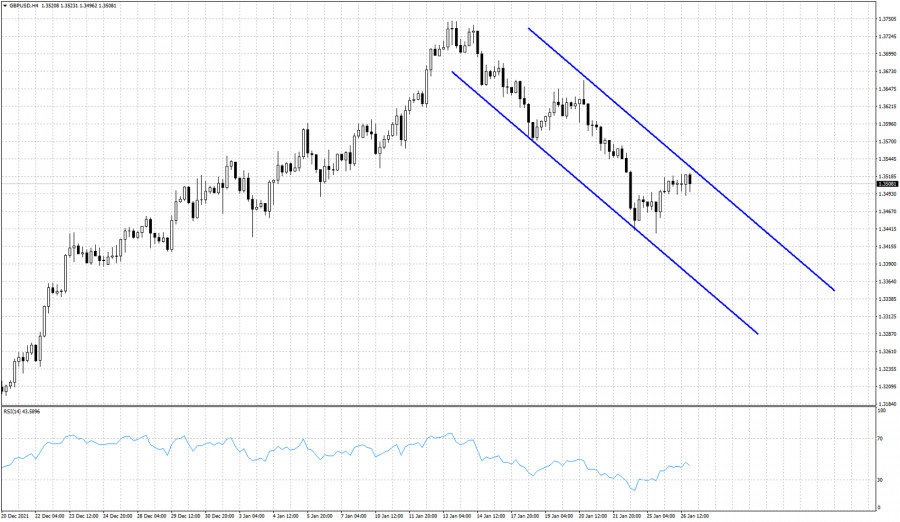
| GBPUSD at short-term resistance. Posted: 26 Jan 2022 11:35 AM PST GBPUSD is in a bearish short-term trend. GBPUSD is making lower lows and lower highs inside the bearish channel that was created after the top at 1.3747. Price is now trading very close to the channel boundary. This is important short-term resistance.
Resistance by the upper channel boundary is at 1.3533. Bulls need to break above the channel boundary in order to provide a bullish signal. A rejection at current levels is what we believe the more likely scenario. A rejection will re-confirm the bearish channel and push price lower towards 1.34.
GBPUSD is inside an expanding wedge pattern. The latest rejection could lead to the lower wedge boundary towards 1.30 and below December lows. Bulls have support at 1.3455 and 1.3390 where we find the 50% and 61.8% Fibonacci retracements of the rise from 1.30 to 1.3747. Breaking below these two levels will increase chances of a move towards the December lows and maybe lower. The material has been provided by InstaForex Company - www.instaforex.com |
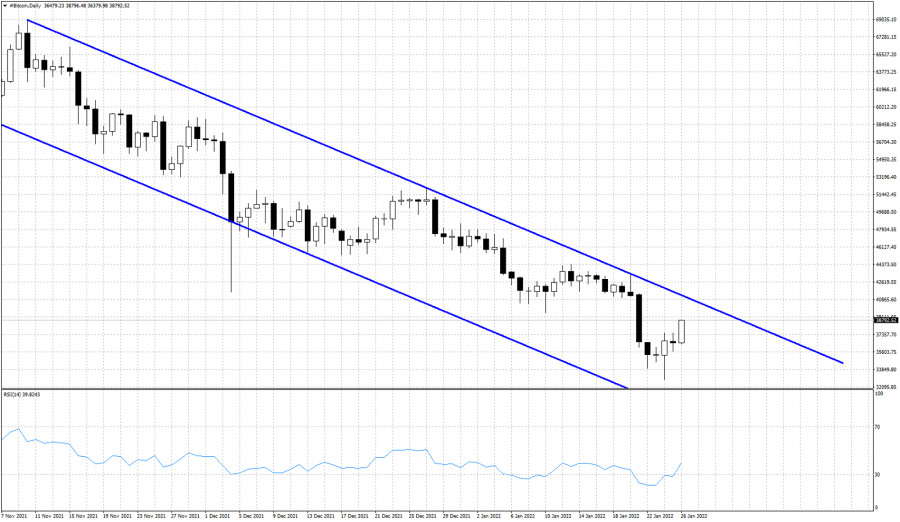
| Bitcoin: Short-term bounce or change in trend? Posted: 26 Jan 2022 11:23 AM PST Bitcoin recently made a low around $32,800. Tonight price is trading around $38,000 but Bitcoin is still inside the bearish channel from its all time highs. Technically trend remains bearish and we consider this upward movement as a counter trend bounce. In previous posts we mentioned that such a bounce towards the $40,000 level was justified and expected.
With the Daily RSI turning upwards from oversold levels, price is bouncing as expected. Resistance is at the upper channel boundary at $41,000. As long as price is below this level we consider that bears remain in control of the trend. More downside should be expected for Bitcoin. The material has been provided by InstaForex Company - www.instaforex.com |
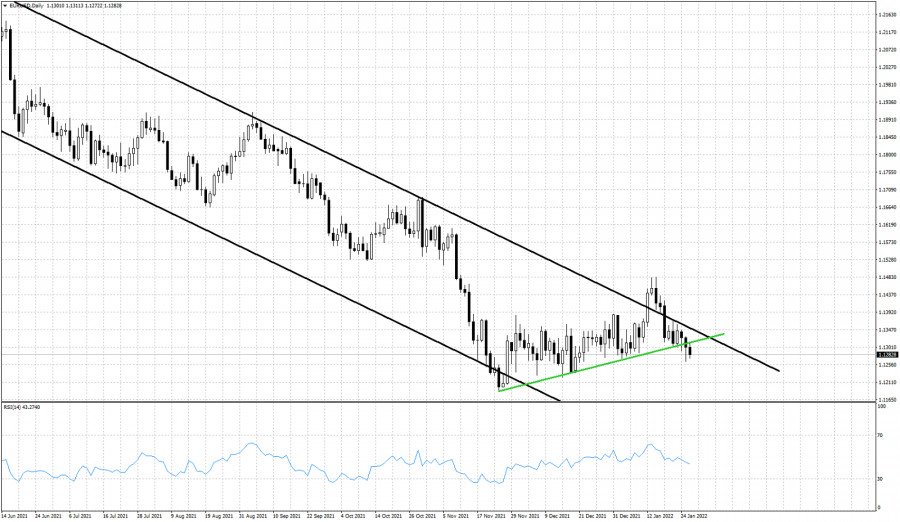
| EURUSD still trading around 1.13. Posted: 26 Jan 2022 11:19 AM PST EURUSD is still inside the medium-term bearish channel but despite breaking multiple times below 1.13, EURUSD continues to be supported and price returns to 1.13. The FOMC meeting did not provide any new vital information to stir the market, so we remain focused on the technical levels we mentioned before.
Green line -support EURUSD is trading inside the bearish channel and below the green support trend line. EURUSD remains vulnerable to a move towards 1.10. Trend remains bearish. Bulls need to recapture at least 1.1370 in order to hope for a trend reversal. The break below the green trend line support was an added bearish signal and price could start a strong move lower any time now. This scenario can only be avoided if bulls recapture 1.1370-1.14. The material has been provided by InstaForex Company - www.instaforex.com |
| How to trade EUR/USD on January 27, 2022. Simple trading tips and analysis for beginners Posted: 26 Jan 2022 11:16 AM PST Analyzing trades on Wednesday EUR/USD on 30M chart
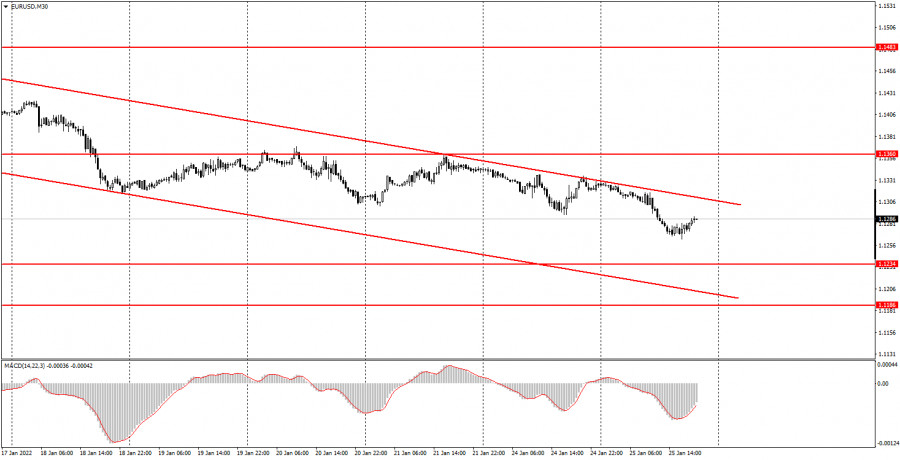
EUR/USD market activity was very low on Wednesday. In our previous review, we reminded you that the results of the FOMC meeting would be announced on Wednesday evening. This is one of the most important events for the foreign exchange market and the US dollar. As we can see, market participants preferred to wait for the outcome of the meeting, so trading activity was very low during the day. There was a minor downtrend on the intraday chart with volatility of just 40 pips. It is difficult to earn much with such low volatility, so this trend is not worth mentioning. In addition, the price made two attempts to leave the descending channel during the day, and each time it went above this range by just a few pips. Remarkably, there was neither a clear breakout of the channel nor a clear rebound from its upper boundary. Therefore, all technical signals formed during the day should have been ignored amid such a slow market. EUR/USD on 5M chart
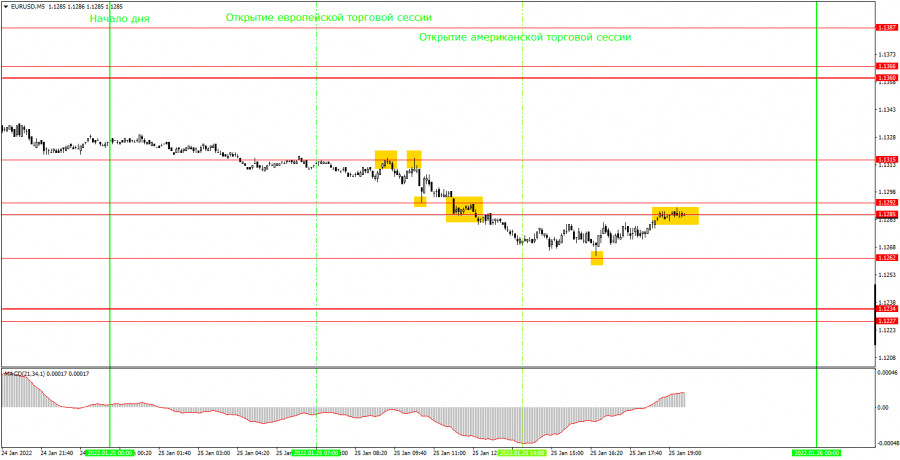
On the 5-minute time frame, we could observe a well-distinguished trend. Lately, the pair has been demonstrating at least a slight trend movement in the daily session, which usually results in a small profit. When there is no trend, there is no profit. Today, the pair had a chance to move lower on the daily chart which would go in line with the trend on the 30-minute time frame. However, after overcoming the area of 1.1285-1.1292, the price came to a halt. Then the pair rebounded from this area three more times. Obviously, it was not necessary to open short positions each time it made a pullback. Therefore, a sell order that was placed on the very first signal could be closed at any time during the day. This trade could bring you either a minimum loss or a minimum profit, which was quite difficult. Within an hour, the Fed will announce the results of its meeting, and the press conference with Jerome Powell will start. We do not recommend trading at this time, as it can be too dangerous. The market reaction can be unpredictable, with rapid fluctuations and mixed movements. Trading tips on Thursday On the 30-minute time frame, the price remains inside the sideways channel of 1.1234 - 1.1360 which is located within the descending channel. However, everything can change on Thursday morning. The levels marked on the chart can be used for trading, but both channels may be canceled after the Fed makes an announcement. On the 5-minute chart on Thursday, we recommend trading at these levels: 1.1227-1.1234, 1.1262, 1.1285-1.1292, 1.1315, and 1.1360-1.1366. In general, there are quite a lot of levels on the chart now, which is typical of a flat movement. Therefore, you need to be more careful when the price rebounds from these levels on the intraday chart. The macroeconomic background on Thursday will be moderate. Novice traders can pay attention to the US GDP report for the fourth quarter. There will be a few more minor reports, but they are unlikely to cause any market reaction. Besides, tomorrow, traders will be digesting the result of the FOMC meeting. Basic rules of the trading system 1) The strength of the signal is determined by the time it took the signal to form (a rebound or a breakout of the level). The quicker it is formed, the stronger the signal is. 2) If two or more positions were opened near a certain level based on a false signal (which did not trigger a Take Profit or test the nearest target level), then all subsequent signals at this level should be ignored. 3) When trading flat, a pair can form multiple false signals or not form them at all. In any case, it is better to stop trading at the first sign of a flat movement. 4) Trades should be opened in the period between the start of the European session and the middle of the US trading hours when all positions must be closed manually. 5) You can trade using signals from the MACD indicator on the 30-minute time frame only amid strong volatility and a clear trend that should be confirmed by a trendline or a trend channel. 6) If two levels are located too close to each other (from 5 to 15 pips), they should be considered support and resistance levels. On the chart Support and Resistance Levels are the levels that serve as targets when buying or selling the pair. You can place Take Profit near these levels. Red lines are channels or trend lines that display the current trend and show in which direction it is better to trade now. The MACD indicator (14, 22, and 3) consists of a histogram and a signal line. When they cross, this is a signal to enter the market. It is recommended to use this indicator in combination with trend patterns (channels and trendlines). Important announcements and economic reports that can be found on the economic calendar can seriously influence the trajectory of a currency pair. Therefore, at the time of their release, we recommend trading as carefully as possible or exiting the market in order to avoid sharp price fluctuations. Beginners on Forex should remember that not every single trade has to be profitable. The development of a clear strategy and money management is the key to success in trading over a long period of time. The material has been provided by InstaForex Company - www.instaforex.com |
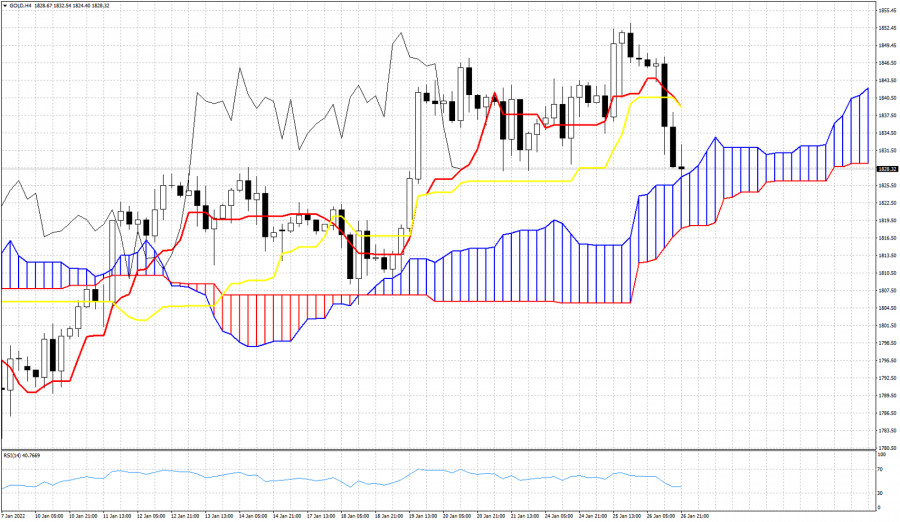
| Gold reverses towards cloud support. Posted: 26 Jan 2022 11:14 AM PST Gold price is trading below $1,830. Our upside target was at $1,860 while yesterday price reached $1,853. Gold today broke below the tenkan-sen and kijun-sen indicators which provided support at $1,840. This was our first warning that price was vulnerable to more downside.
|
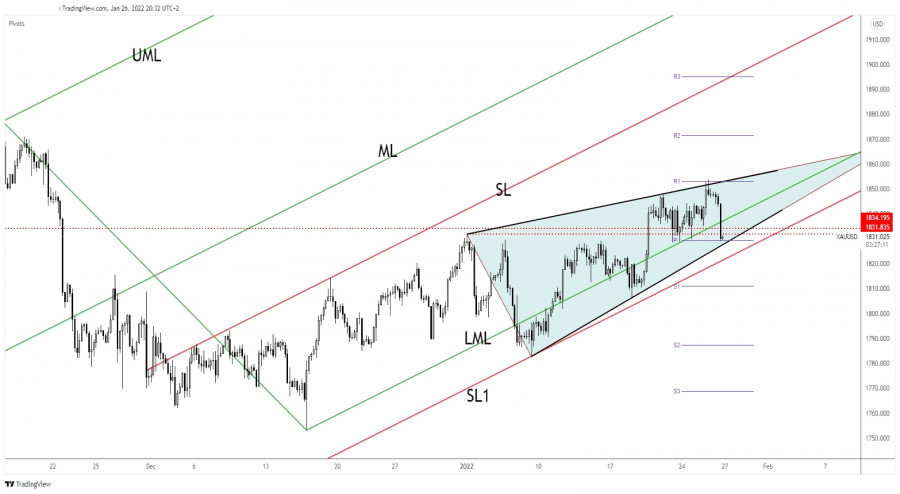
| Gold upside invalidated, FOMC under spotlights Posted: 26 Jan 2022 11:00 AM PST The price of gold plunged after reaching 1,853.88 yesterday's high. The price action developed a Rising Wedge pattern. Still, the reversal formation is far from being confirmed. You have to be careful as the fundamentals will move the rate later. Dovish FOMC could boost the XAU/USD, while more hawkish than expected FED could push the yellow metal towards new lows. Gold dropped by 1.34% from yesterday's high to 1,829.01 today's low. The pressure is high ahead of the FOMC. The FED is expected to keep the Federal Funds Rate at 0.25%. Still, the FOMC Statement and the FOMC Press Conference could really shake the markets. You have to be careful as a dovish or hawkish tone could bring sharp movements. XAU/USD massive drop
Gold registered only a false breakout above the weekly R1 (1,853.10) and now it has reached the 1,829.37 weekly pivot point. It has failed to stay above the Ascending Pitchfork's lower median line (LML) and above 1,834.19 - 1,831.83 signaling strong sellers and that the upside movement ended. Still, in my opinion, only a valid breakdown below the Rising Wedge's support, through the black uptrend line, and below the outside sliding line (SL1) could really confirm a downside reversal. Staying above the weekly pivot point and above the black uptrend line could announce a new bullish momentum. XAU/USD forecastTechnically, XAU/USD is in a support zone, false breakdowns could signal a potential rally. A valid breakdown below the immediate support levels could activate a larger downside movement. The material has been provided by InstaForex Company - www.instaforex.com |
| Elon Musk urges McDonald's to accept Dogecoin Posted: 26 Jan 2022 10:34 AM PST
After a long period of stagnation and a drop from historic highs, Dogecoin is finally starting an uptrend. The cryptocurrency starts a correction, thanks to Elon Musk. Technoking of Tesla has asked McDonald's on Twitter to start accepting Dogecoin as a type of payment. This will help speed up the global adoption of Dogecoin and increase and accelerate its demand and growth. Musk posted tweets asking McDonald's to turn its attention to Dogecoin and make it the official means of payment alongside the dollar. As a result, the cryptocurrency gained 7% in 24 hours. Dogecoin is attracting more and more attention from many well-known companies, as it is a people's cryptocurrency, which is designed exclusively for transactions and spending money on services and purchases. Looking ahead, the cryptocurrency could reach its all-time highs again, hitting the $0.7 mark and renewing it. In a tweet, Musk said he would eat McDonald's famous 'Happy Meal' on television if the burger chain starts accepting Dogecoin.
As Musk is a marketing and manipulation genius in the cryptocurrency market, this could be a good booster and catalyst for Dogecoin. Earlier this month, Tesla accepted Dogecoin as payment for the company's official merchandise. This triggered a 16% rise in the cryptocurrency. Later, however, as Bitcoin began to fall and pulled the altcoin market with it, Dogecoin also followed that downward trend. Many analysts believe that following this reaction from Musk and his unlimited support, Dogecoin will be worth $0.3 by the end of the first quarter of this year. The material has been provided by InstaForex Company - www.instaforex.com |
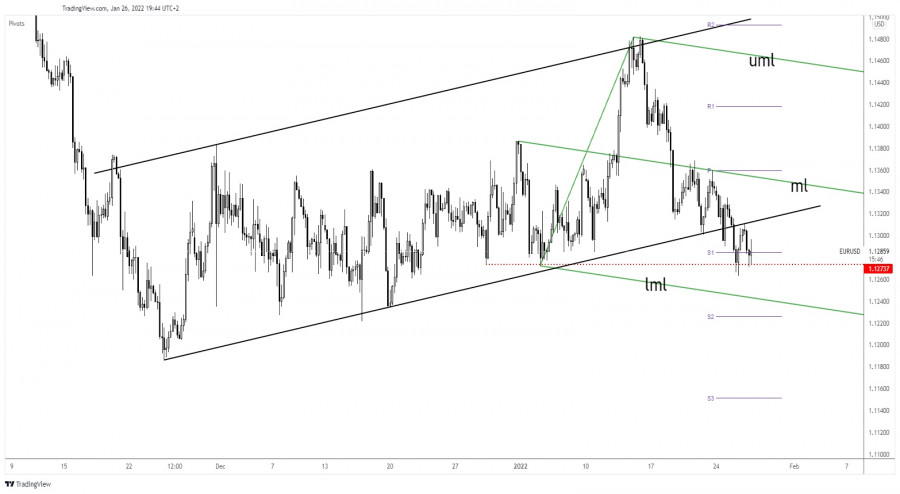
| EUR/USD challenges 1.1273 support before FOMC storm Posted: 26 Jan 2022 10:27 AM PST EUR/USD changed little in the short term. Most likely, traders are waiting for the FOMC meeting. The pair was traded at 1.1286 level at the time of writing far below 1.1310 today's high. Technically, the rate retested the broken uptrend line and now it hovers above a static downside obstacle. The pair maintains a bearish bias. DXY's further growth may force the pair to approach and reach new lows. Still, it remains to see what will really happen after the FOMC Statement, Federal Funds Rate publication, and after the FOMC Press Conference. These are seen as high-impact events, so anything could happen. As you already know, the Federal Reserve is expected to maintain its current monetary policy in the January meeting. Still, the FED could confirm rate hikes in March. More hawkish than expected FOMC policy could boost USD, while a dovish tone could crash the greenback. EUR/USD breakdown confirmed
EUR/USD rebounded after retesting the 1.1273. This level stands as a strong static downside obstacle. As you already know from my previous analysis, staying below the uptrend line and making a valid breakdown below 1.1273 could confirm more declines. In the short term, it could come back to test and retest the immediate resistance levels before dropping towards new lows. You have to be careful as the price could register sharp movements in both directions around the FOMC meeting. EUR/USD outlookNew false breakouts above the uptrend line and above the median line (ml) could bring fresh selling opportunities. Also, closing and stabilizing below the 1.1273 could activate a downside continuation. The downside pressure is high after escaping from the ascending channel's body. The material has been provided by InstaForex Company - www.instaforex.com |
| Video market update for January 26,,2022 Posted: 26 Jan 2022 08:49 AM PST Watch for the upside continuation pattern on USD/JPY..... The material has been provided by InstaForex Company - www.instaforex.com |
| Posted: 26 Jan 2022 08:14 AM PST
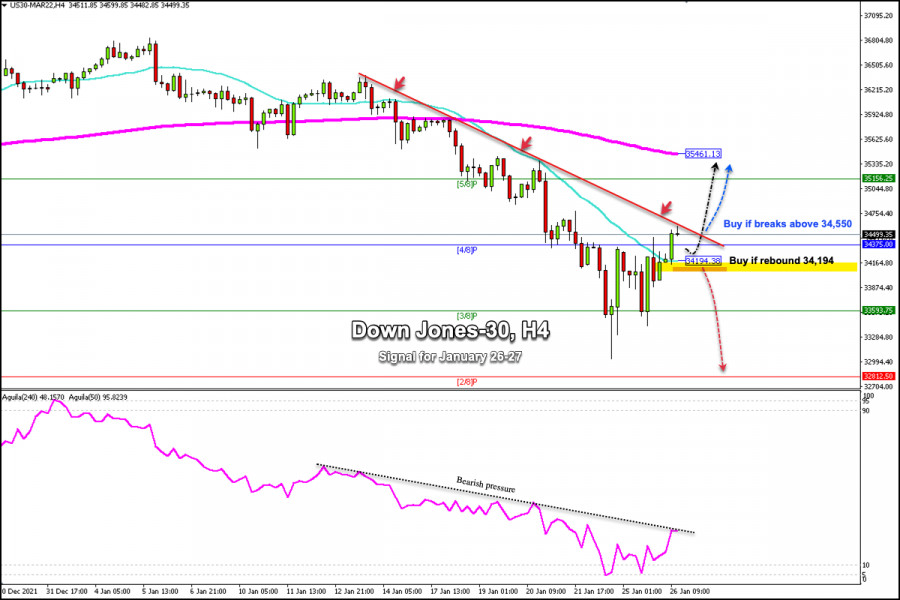
The Dow Jones-30 Industrial Average (#INDU) is trading just below the downtrend channel formed on Jan 11. This channel is exerting strong downward pressure. The index is expected to make a technical correction towards the SMA of 21 located at 34,194 in the next few hours. The price action suggests that today's Federal Reserve policy announcements are already priced in. However, there are still some worries about tensions between Russia and Ukraine. Without hesitation, the Fed's decision in the medium term will continue to affect the Wall Street market. So, the Dow Jones-30 index is likely to remain under downward pressure and could trigger a long-term downward trend. According to the daily chart, the Dow Jones remains bearish. It is projected that it could fall to the key level of 32,000 points in the coming days. On the other hand, if the DJ30 recovers, it should trade above the 35,461 zone, that is where the 200 EMA is located. A daily close above this level could mean a change in trend and a move higher is expected to the level of the 37,000 points. According to the 4-hour chart, we can see that the Dow Jones has stopped its upward momentum just below the downtrend channel. An imminent technical correction towards 34,194 is possible. You can sell below this level with targets at SMA 21. If the upside pressure prevails, the price could drop to 2/8 Murray at 32,812. A technical bounce around 21 SMA could be a good opportunity to buy and in case of a sharp break of the downtrend channel with targets towards 5/8 Murray located at 35,156 and up to 200 EMA located at 35,461. The material has been provided by InstaForex Company - www.instaforex.com |
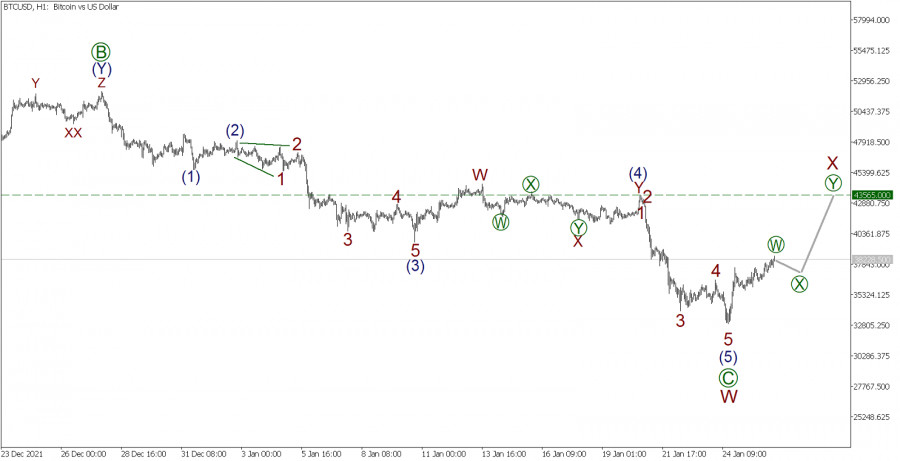
| Posted: 26 Jan 2022 07:36 AM PST The main news from the world of cryptocurrencies: We continue to consider Bitcoin from the point of view of Elliott theory on an hourly timeframe. BTCUSD H1:
On the last section of the hourly timeframe chart of the BTCUSD cryptocurrency pair, we see the completion of the downward movement, and then the price reversal. It seems that the downward acting wave W has been completed, and now the formation of a bullish wave of bundle X is taking place. The wave bundle X may take the form of a double zigzag (W)-(X)-(Y), as shown on the chart by trend lines. The end of this construction is expected to reach the level of 43565.00, at which the correction sub-wave (4) was completed. In the current situation, it is recommended to consider opening deals for purchases. Trading recommendations: Buy 38228.50, Take profit: 43565.00. The material has been provided by InstaForex Company - www.instaforex.com |
| Crypto reputation tarnished by money laundering Posted: 26 Jan 2022 07:35 AM PST More than $8.6 billion in cryptocurrencies were laundered by cybercriminals in 2021 - up by 30% from 2020, a report by Chainalysys said. According to the report, which was released on January 26, more than $33 billion worth of crypto were laundered since 2017. Due to rising crypto prices, most of the total laundered money was moved to centralized exchanges over time. The sharp rise in money laundering activity in 2021 is not surprising, given the significant growth of both legal and illegal crypto activity last year, Chainalysis said. Furthermore, rising stock prices could have led to speculative traders using the crypto market crypto to convert their gains into cash or vice versa. During money laundering, cash that was acquired from illegal activities is being legalized and transferred to accounts of legal institutions, and its true origin is concealed. According to Chainalysis, only 17% of the laundered $8.6 billion went to decentralized finance applications (DeFi, DAO, etc.), referring to the sector which facilitates crypto-denominated financial transactions outside traditional banks. This was up from 2% in 2020 In theory, the rising amount of DeFi transactions should have led to an increased inflow of illegally-acquired cash. However, a sizeable portion of the laundered money was likely moved to more popular market sectors. Mining pools, high-risk exchanges, and mixers also saw substantial increases in value received from illicit addresses, the report said. Mixers typically combine potentially identifiable or tainted cryptocurrency funds with others, in order to conceal the trail to the fund's original source. Wallet addresses associated with theft sent just under half of their stolen funds, or more than $750 million worth of crypto in total, to decentralized finance platforms. Legalizing laundered funds via DeFi could probably be easier compared to other means. Furthermore, it could also serve as a profitable yet risky investment, with yield higher than those offered by bonds or deposits in regular banks. Chainalysis also clarified that the $8.6 billion laundered last year represents funds derived from crypto-native crime such as darknet market sales or ransomware attacks in which profits are in crypto instead of fiat currencies. "It's more difficult to measure how much fiat currency derived from off-line crime — traditional drug trafficking, for example — is converted into cryptocurrency to be laundered. However, we know anecdotally this is happening," Chainalysis said. Crypto tokens could be used for both legitimate and illegal purposes. However, increased government regulation could be necessary to minimize the crypto's misuse by cybercriminals. Otherwise, the resulting scrutiny and accusations could severely undermine the crypto industry. The material has been provided by InstaForex Company - www.instaforex.com |
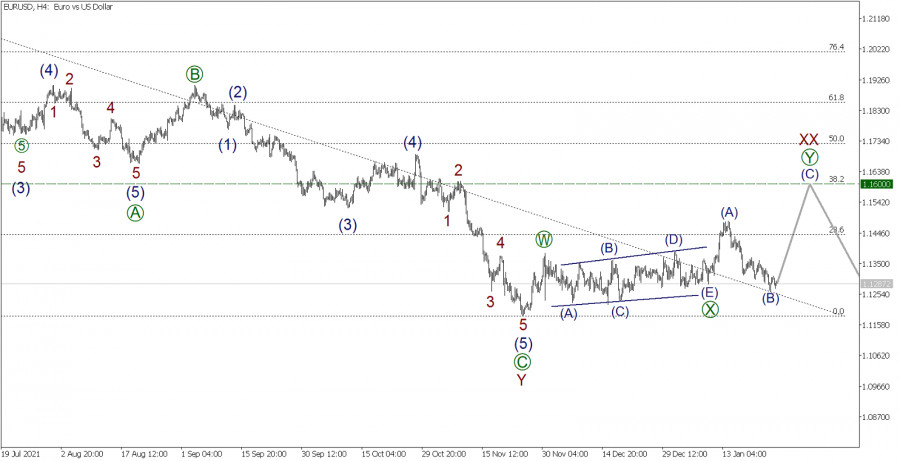
| Wave analysis of EUR/USD on January 26, 2022 Posted: 26 Jan 2022 07:30 AM PST Today we wait for the Fed's decision on the interest rate. Plus, the crude oil inventories, which will be released at 15:30 UTC. All these important events can finally strengthen the bulls to complete the formation of wave XX. EURUSD, H4:
According to the Elliott theory, we see a global corrective trend that is moving in a downward direction. Perhaps this trend is taking the form of a triple zigzag W-X-Y-XX-Z. On the 4-hour timeframe, we see that the decline in the current wave Y was completed, followed by the rise of the market in wave XX. The internal structure of wave XX hints at a double zigzag [W]-[X]-[Y], where the link wave [X] is an inclined triangle. Now a bullish actionary wave [Y] is under development, which can be a standard zigzag (A)-(B)-(C). The final impulse wave (C) is needed to complete the above zigzag. (There is a possibility that wave (C) will take the form of a finite diagonal). The cost of quotes may rise to the level of 1.1600. At this level, the size of wave XX will be 38.2% on Fibonacci lines from wave Y. Trading recommendation: Buy 1.1277, Take profit 1.1600. The material has been provided by InstaForex Company - www.instaforex.com |
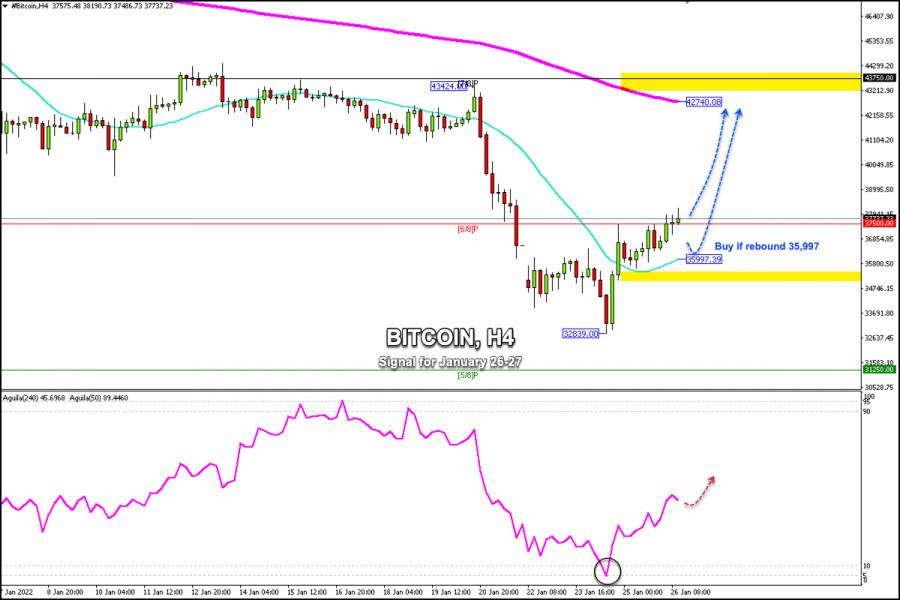
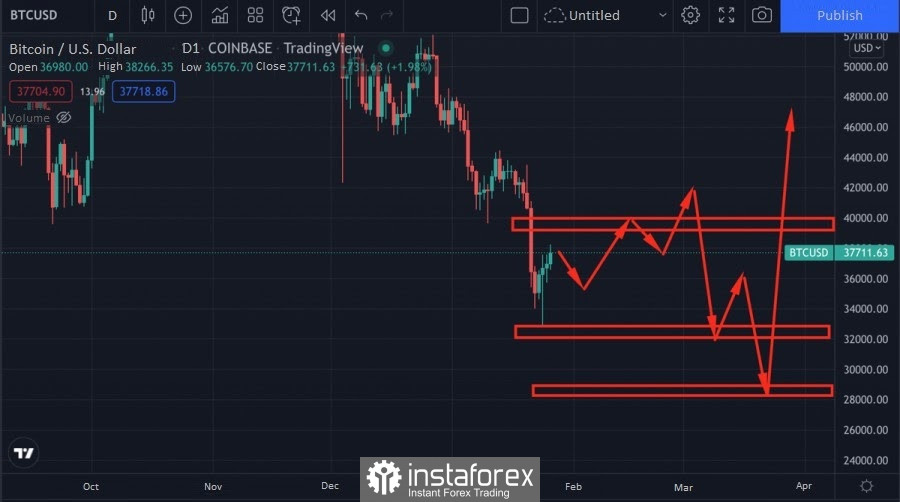
| Trading signals for BITCOIN on January 26 - 27, 2022: buy above $37,500 (6/8) Posted: 26 Jan 2022 07:16 AM PST
After falling to the low of July 2021 around 32,839, Bitcoin has managed to recover and is now above 6/8 Murray at 37,500. The trend remains bullish and it is likely that in the coming days it could go as high as 42,740 zone of 200 EMA. The market focus is on the Federal Reserve decision at 19:00 GMT. This policy update can also affect Bitcoin, if the Fed decides to increase the interest rate in March. Bitcoin is likely to fall in the short term to the minimum of $32,839 and to the psychological level of $30,000. Technically, Bitcoin has gotten relief from the downside pressure and is now approaching the psychological level of $40,000. As the market remains bearish below 42,740, any bounce is likely to be seen as an opportunity to sell with targets towards the 21 SMA at 35,997. Around the 21 SMA, a technical bounce is expected that could give Bitcoin a chance to resume its upward movement again with targets towards 40,000 and up to 42,740. On the contrary, if Bitcoin trades again below the level of 36,000 in the next few days, a continuation of the downward movement is expected towards 34,720 and up to 31,250 (5/8 Murray). Our trading plan for the next few hours is to buy if Bitcoin consolidates above 37,500 or to wait for a technical correction towards the 21 SMA at 35,997 and to buy with targets at the psychological level of 40,000 and up to 42,740 (200 EMA). Support and Resistance Levels for January 26 - 27, 2022 Resistance (3) 41,159 Resistance (2) 39,314 Resistance (1) 38,404 ---------------------------- Support (1) 37,500 Support (2) 36,532 Support (3) 35,569 *********************************************************** Scenario Timeframe H4 Recommendation: buy above o buy if rebound Entry Point 37,500; 35,997 Take Profit 40,000; 42,740 (200 EMA) Stop Loss 36,900 Murray Levels 31,250 (5/8) 37,500 (6/8) 43,750 (7/8) *************************************************************************** The material has been provided by InstaForex Company - www.instaforex.com |
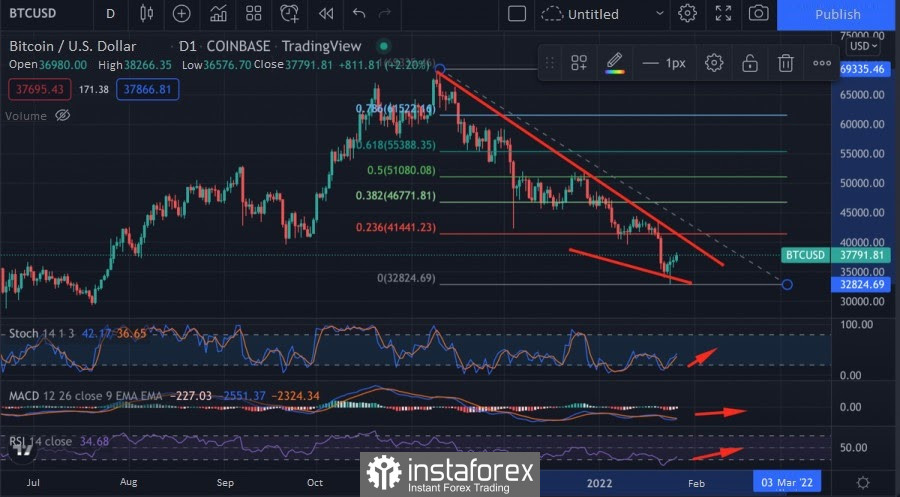
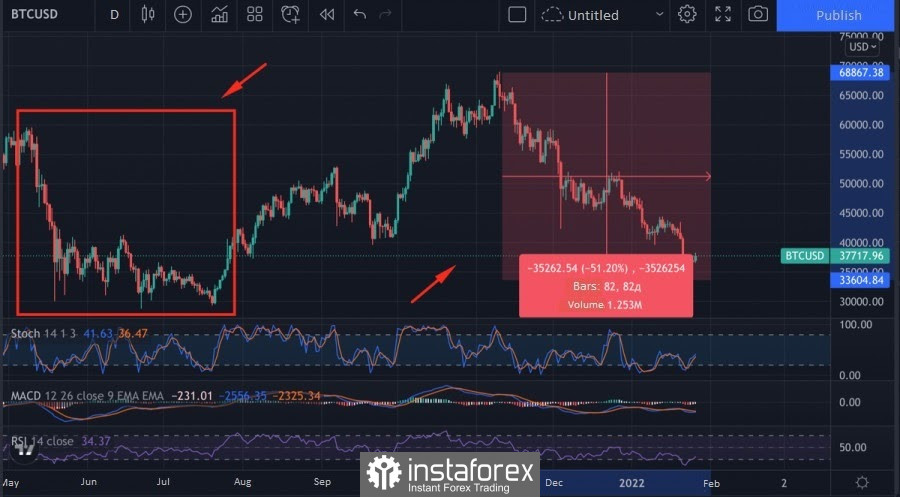
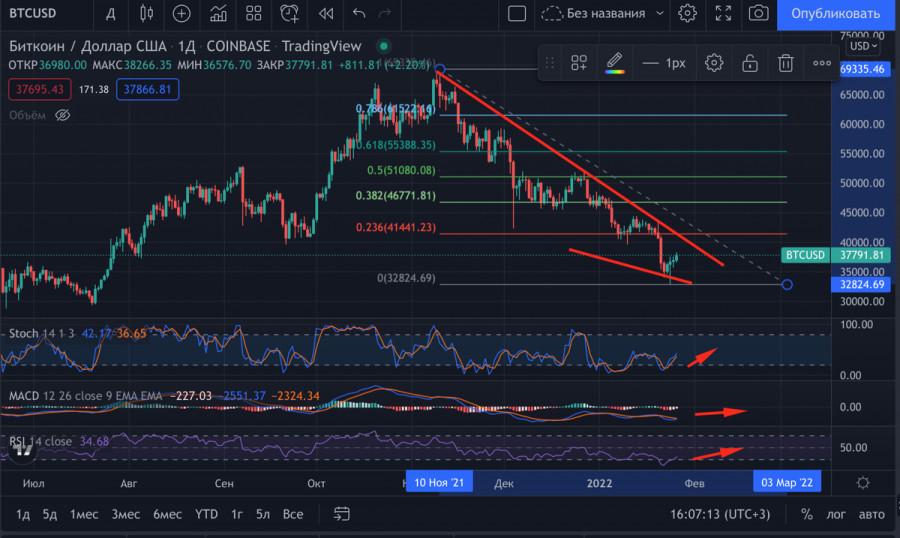
| Bitcoin survives biggest sell-off since 2020 and recovers above $35k: will BTC correction continue? Posted: 26 Jan 2022 07:07 AM PST The total panic in the cryptocurrency market is gradually replaced by moderate optimism, and most digital coins begin an upward movement. All this was impossible without a rebound of the main cryptocurrency. Bitcoin experienced one of the biggest sell-offs in its history and was close to the start of a bear market. But as we expected, the cryptocurrency made a powerful rebound from the $33k-$34k area on the back of market activation. The price movement gave rise to rumors about a wide trend reversal and a new move to the highs, but this is not entirely true. Over the past day, Bitcoin has risen in price by 3.5% and continues to recover following the stock markets. According to Bloomberg, the correlation of the main cryptocurrency and stock indices has reached another record. Therefore, when analyzing bitcoin, you should pay attention to the classic market. At the same time, Bitcoin had its own reasons for the fall. Glassnode experts claim that Bitcoin experienced the second largest sell-off since the bear market. However, the worst is behind us as the asset made a strong recovery momentum to $37.5k. Santiment analysts believe that investors in unison staged the biggest "buy the dip" flash mob of the month. The result of the bulk buying was the breakdown of the $35k line and movement to the first significant resistance zone at $38k. Let's forget about the Fed's possible impact on the price movement for a moment, as I believe that yesterday's upward momentum was also triggered by optimism regarding the Fed's positions. In addition, Jerome Powell himself is cautious in his statements, and therefore, most likely, something out of the ordinary will not happen.
Now, let's discuss the possible complexities. Bitcoin is quite capable of breaking through the $38k resistance level, where the zone of stops and sell orders begins. However, at the current stage, the bulls do not have enough volume to pass the $39k-$40k zone. This range was an important support zone and is now considered a dangerous resistance level. In addition, this is a psychological mark, where the maximum number of shorts will be concentrated. The downward trend level of November 10 also passes here and the 0.236 Fibo level looms nearby. The combination of these factors makes a permanent breakdown of the $40k mark unlikely. I suppose that in the near future we will have a local period of bitcoin consolidation, during which the altcoin market will recover to local highs. However, it is still dangerous to go long as the move to $39k-$40k will be impulsive. The asset will not be able to break through this zone on the first try, and, most likely, it will touch it with a long upper wick. After that, we are waiting for a downward movement and a re-collection of liquidity from the $32k-$35k and $35k-$40k range.
It is quite expected that the bitcoin will drop below $30k, but in the current conditions, the price is unlikely to fall below the previous low at $28.7k. As I expected, bitcoin follows the scenario of April-June 2021. The correction will end around the 55% price drop from ATH. February will be a full-fledged beginning of the upward movement of bitcoin to new highs.
|
| Indonesia bans cryptocurrency transactions and markets await Fed meeting results Posted: 26 Jan 2022 06:54 AM PST The cryptocurrency market followed stock markets and began to strengthen near the local bottom. The capitalization of digital assets has been growing for the third day in a row. Over the past 24 hours, crypto-assets rose by 3%, due to which the total value of the market increased to $1.7 trillion. Meanwhile, governments are not particularly interested in the current situation and determine their attitude to the cryptocurrency market in the long term. Everyone expected a complete ban of digital assets by the Central Bank of Russia, but Indonesia decided to get ahead and announced a number of significant bans related to cryptocurrencies in the country. The regulator said that from now on, financial companies are prohibited from conducting transactions with cryptocurrencies. Indonesia's Financial Services Authority noted that the country saw a surge in cryptocurrency activity in 2021. Total trading volumes were as high as $60 billion.
In this context, the regulator did not completely ban a significant part of state revenues and allowed the trading of digital assets on a commodity exchange. In addition, an exchange exclusively for cryptocurrency trading regulated by the state is expected to launch in the first quarter of 2022. Indonesia has opted for a compromise and has significantly increased the state's influence in the cryptocurrency industry. The Russian Federation stated that it did not plan to completely ban cryptocurrencies. Instead, legal mechanisms will be developed for legal transactions with digital assets and their taxation. The country's Ministry of Finance said that controlling the cryptocurrency industry would be a more effective protection for citizens than their complete ban. It is reported that Kazan may become a testing ground for the development of basic mechanisms to regulate cryptocurrencies. The bill is not expected before the fall of 2022, and therefore the situation with cryptocurrencies will continue to unfold in the near future. In the meantime, the market has completely ignored such news and is closely watching the immediate aftermath of the Fed's tapering of the QE program. At the beginning of 2022, stock markets started falling amid tightening of the Fed's monetary policy to fight inflation. The Fed meeting and Chairman Powell's press conference are being held tonight. The market is waiting for the timing of the stimulus program winding down and the key rate hike. According to preliminary data, the rate hike is expected in spring, April, or May, and during this period a massive correction of the crypto market may begin. Market participants also expect a cessation of buybacks and a reduction in balance sheets.
The Fed chairman's statement is likely to determine the sentiment of the stock and crypto markets for the first and second quarters. If Powell's rhetoric is not so pessimistic, the market may expect growth momentum. In case of even more negative forecasts, technical analysis of financial instruments may require revision. In case the Fed's statements remain as expected, the situation will not change considerably, as it is already embedded in the price of indices and cryptocurrencies. Bitcoin follows stock indices, but in the near future, I expect a decrease in correlation and differentiation of investment approach after the results of the Fed meeting.
|


| You are subscribed to email updates from Forex analysis review. To stop receiving these emails, you may unsubscribe now. | Email delivery powered by Google |
| Google, 1600 Amphitheatre Parkway, Mountain View, CA 94043, United States | |


Comments