Forex analysis review
Forex analysis review |
- Analysis of GBP/USD on January 25. The British stopped before the 1.3455 mark and are waiting for the FOMC meeting.
- Ripple: accumulation or distribution?
- Ethereum reached down channel
- EUR/USD analysis on January 25. The missing news background is not a hindrance: the euro continues to slide down.
- Trading signals for Nasdaq-100 (#NDX) on January 25 - 26, 2022: buy in case of rebound off 14,000 points (weekly support)
- US consumer confidence declines
- Trading signals for GOLD on January 25 - 26, 2022: buy in case of rebound at $1,843 (6/8)
- EUR/USD. Why is the dollar getting more expensive and should it be trusted?
- BTC/USD on January 25. Cryptocurrency issues according to Elliott Theory
- Wave analysis of EUR/USD on January 25, 2022
- UBS bank warn onset of "crypto winter" despite resumption of investment flows in crypto funds
- Trading signals for Ethereum (ETH/USD) on January 25 - 28, 2022: buy above $2,500 in case of rebound off $2,187 (-1/8 - 0/8)
- Oil rally continues: what can trigger a correction?
- Bitcoin demand grows as prices fall; Will whales be able to buy the bottom?
- NZDUSD breaks below key Fibonacci support.
- Gold remains firm above $1,830.
- AUD/USD Forecast: Australian inflation soar
- The Dollar index and the expected move higher.
- XRPUSD challenges June- July lows.
- Ichimoku cloud indicator analysis on EURUSD for January 25, 2022.
- Video market update for January 25,,2022
- Asian stock market declines notably
- BTC analysis for January 25,.2022 - Sideways mode
- Analysis of Gold for January 25,.2022 - Higher lows and potential for upside continuation
- EUR/USD analysis for January 25, 2022 - Breakout of key pivot at 1.1300
| Posted: 25 Jan 2022 09:56 AM PST
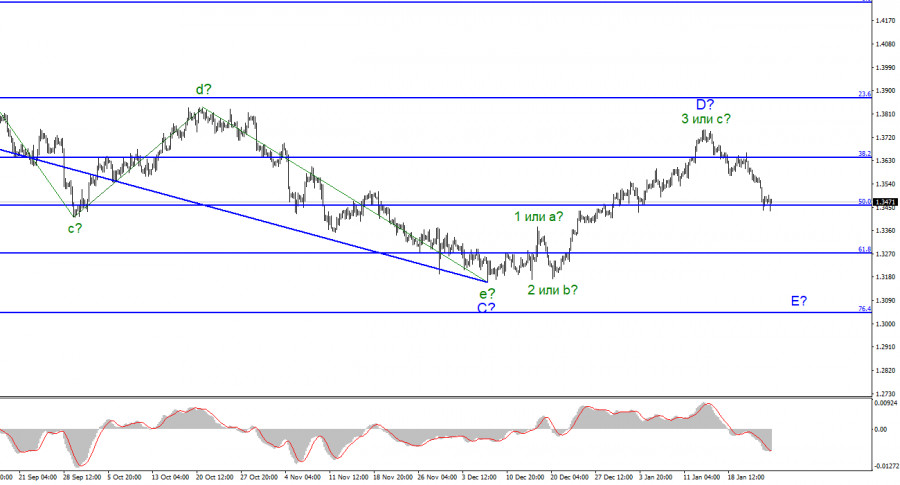
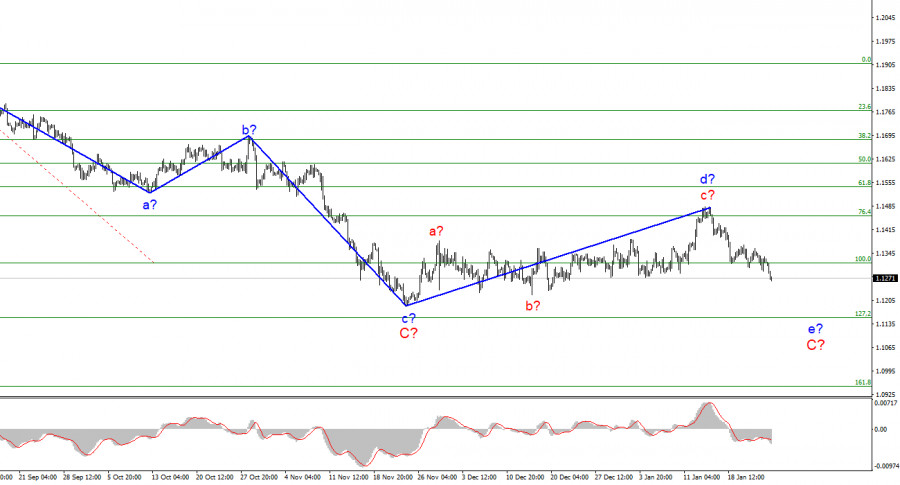
For the Pound/Dollar instrument, the wave markup continues to look quite convincing. In the last few weeks, the instrument has continued to build an upward wave, which is currently interpreted as wave D of the downward trend segment. If the current wave marking is correct, then this wave has completed its construction and the construction of wave E has begun. Thus, the entire downward section of the trend may take on an even more extended form. Wave D has taken a clear three-wave form and its internal wave marking does not cause any questions now. A successful attempt to break through the 1.3644 mark, which corresponds to 38.2% Fibonacci, indicates that the markets are ready to sell the British. A successful attempt to break through the 50.0% level may cause increased sales of the British. Correction waves are not visible at all inside the supposed wave E, which leads to the conclusion about its possible very extended appearance. Thus, both the euro and the pound may significantly sink in price in the coming months. Moving away from the topic of Boris Johnson and focusing on the FOMC meeting. The exchange rate of the Pound/Dollar instrument decreased by 50 basis points during January 25, but in the afternoon it managed to add about the same amount in price. Thus, the scenario of the previous day was completely repeated, when the demand for the US currency grew for most of it, but by the end of the day, the situation changed slightly towards the British. However, the Briton is still not in his best position right now. If the current wave marking is correct, then its decline will continue with targets located below the previous low mark of 1.3159. This means that the instrument may lose at least 300 more points in the coming weeks. Tomorrow's Fed meeting can help him in this. As I said in my review of the Euro/Dollar instrument, there is a high probability that the demand for the US currency will grow tomorrow against the background of the FOMC decisions. Most likely, Jerome Powell will also take a "hawkish" position, which will further assure the market of the inevitability of a rate hike in 2022. But the meeting of the Bank of England will take place a little later, so the Briton will have "nothing to cover" tomorrow. Although he already had the opportunity to have his say last week, when various reports were published only in the UK. Unfortunately, not all of them could support the demand for the pound and not all of them were interested in the market at all. In the same week, all the most interesting things will happen in the USA. Today, the news background was also only in America. The consumer confidence indicator in January was 113.8, which is slightly better than market expectations. However, this report did not cause any reaction from the market. Yesterday, the dollar fell slightly against the background of weak business activity indices, but today it should have continued to increase. But this report was rather weak, and there were no others today. As in the case of the Euro/Dollar instrument, I believe that the wave marking is in the first place now, and the news background is in second place. General conclusions. The wave pattern of the Pound/Dollar instrument assumes the construction of an assumed E wave. A successful attempt to break through the 1.3458 mark will allow you to continue selling the instrument with targets located near the estimated 1.3271 mark, which corresponds to 61.8% Fibonacci. I am not considering alternative options right now, as there is no reason for this. The E wave can get a clear five-wave structure.
|
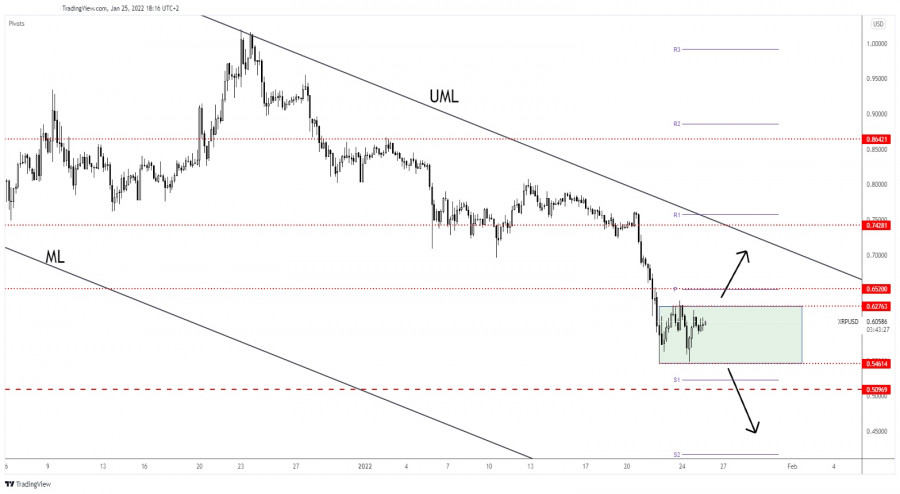
| Ripple: accumulation or distribution? Posted: 25 Jan 2022 09:21 AM PST Ripple found strong demand in the short term and now it tries to rebound. It's trading at 0.6083 level at the time of writing. XTP/USD is up by 10.98% since yesterday's low of 0.5488 level. In the last 24%, Ripple is up by 4.56% but is still down by 18.26% in the last 7 days. Bitcoin's current rebound helped the altcoin to grow as well. You already know from my analysis that when Bitcoin grows, XRP, ETH, BCH, LTC, etc. could increase as well because we have a positive correlation. XRP/USD Range Pattern!
XRP/USD is trapped between 0.6276 and 0.5461 levels. Escaping from this range could bring fresh trading opportunities. In the short term, the bias remains bearish. Failing to retest the descending pitchfork's upper median line (UML) in the last attempt signaled strong sellers. Technically, the 0.5461 stands as the immediate support, while the 0.5096 represents a major downside obstacle. Still, a valid upside breakout from the current range pattern could announce that the crypto could try to approach and reach the upper median line (UML). XRP/USD Prediction!In the short term, Ripple could continue to move sideways. A downside breakout from the current range, a new lower low could signal a downside continuation. On the other hand, an extended sideways movement followed by a new higher high could signal a strong rebound towards the UML. A bullish reversal could be announced only by a valid breakout above the upper median line (UML). The material has been provided by InstaForex Company - www.instaforex.com |
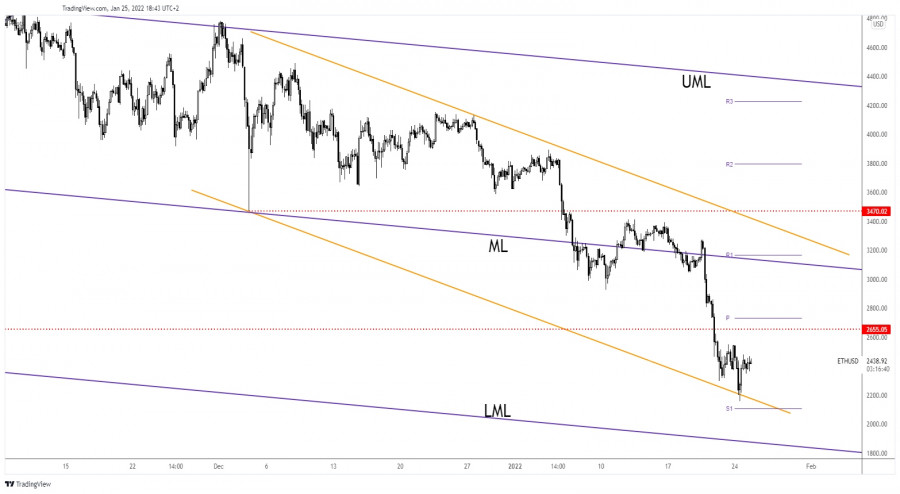
| Posted: 25 Jan 2022 09:20 AM PST Ethereum is trading at 2,445 at the time of writing far above yesterday's low of 2,160. ETH/USD increased as much as 14.37% from 2,160 to 2,470.35 today's high. Still, technically, this could be only a temporary rebound as the pressure remains high. BTC/USD's rebound helped the price of Ethereum to start increasing as well. Only a major bullish pattern could really announce that the ETH/USD could develop a larger swing higher. The current bounce back to be only a temporary one. The sellers could catch a new bearish momentum when this throwback is over. ETH/USD Rebound!
As you can see on the H4 chart, the ETH/USD found support right on the down channel's downside line and now it tries to come back higher. Unfortunately, as long as it stays under 2,655, the bias remains bearish. This level represents a static resistance. A strong sideways movement or a bullish pattern could signal strong rebound towards the channel's upside line. In the short term, after failing to reach the weekly S1 (2,107.87), ETH/USD could approach and reach the weekly pivot point (2,732.88). ETH/USD Forecast!Ethereum could rebound after reaching the channel's support. 2,655.05 is seen as immediate resistance. Personally, I want to see a strong accumulation or new false breakdowns below the immediate support levels before developing a strong leg higher. A temporary rebound could help the sellers to cath new bearish movements from around 2,655 and if it the rate makes false breakouts above the weekly pivot point (2,732). The material has been provided by InstaForex Company - www.instaforex.com |
| Posted: 25 Jan 2022 09:19 AM PST
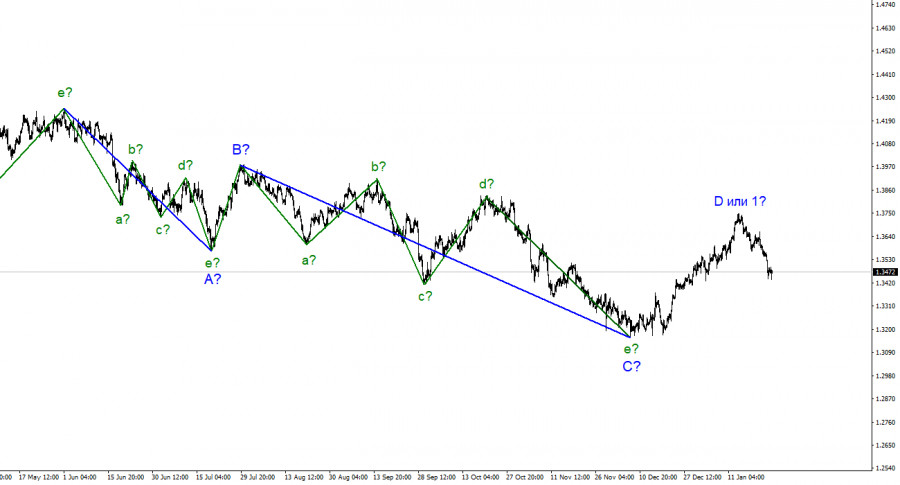
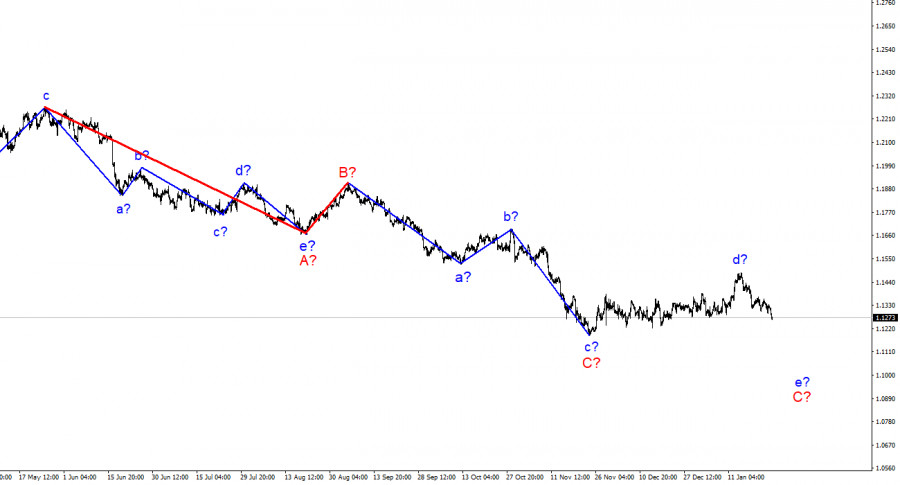
The wave marking of the 4-hour chart for the euro/dollar instrument still looks convincing. Wave d turned out to be longer than I originally expected, but this does not change the essence of the wave marking. I still believe that this wave is corrective, not impulsive, as evidenced by its internal wave structure. Therefore, it cannot be wave 1 of a new upward trend segment. If this is indeed the case, then the decline in quotes resumed within the framework of the expected wave e-C. In the near future, the quotes of the instrument may fall to the low of the expected wave c-C and a successful attempt to break this mark will indirectly confirm the current wave marking. I am not considering alternative options right now, since the wave pattern does not require this. A successful attempt to break through the 1.1315 mark indicates readiness for further sales of the European currency. Fed Meeting: what you need to know the day before. The euro/dollar instrument fell by 60 basis points on Tuesday. Thus, the market continues to get rid of the European currency. There was no news background today either in the Eurozone or in the US. Nevertheless, the decline in the quotes of the instrument continued throughout the day. From this, I conclude that in this way the markets are preparing for tomorrow's summing up of the FOMC meeting. This is the most important event of the week, but before it happens, I think we need to clearly understand what kind of world we are in. First, I consider it necessary to note the wave pattern once again. There are times when the wave picture is ambiguous, so the news background can just help to understand the prospects of the instrument. Now the situation is the opposite. It is the wave pattern that implies a further fall of the instrument in almost any case. Second, the results of the FOMC meeting will also be in favor of the US currency in almost any case. The only question is, what kind of decisions will the FOMC committee make? I think there is no doubt that the Fed will reduce the volume of asset purchases under the QE program. I still think the probability of an interest rate increase is small, but everything can be, given the inflation that is growing every month. Thus, I even urge you to be prepared for surprises from the FOMC. Although most likely, they will not be. Even the growth of the European currency is possible tomorrow evening if the Fed confines itself to only reducing the QE program. The market has long taken into account the complete curtailment of the incentive program, which should be completed by the end of March. Thus, this FOMC decision alone may not impress the market. However, in any case, we are talking about a slight rise in the instrument, after which its decline should resume. If the interest rate is raised already in January, the demand for the dollar may grow significantly, which will only accelerate the process of building the expected wave e- C. General conclusions. Based on the analysis, I conclude that the construction of the ascending wave d is completed. If this assumption is correct, then now it is necessary to sell the instrument based on the construction of the wave e-C with targets located near the estimated mark of 1.1154, which is equivalent to 127.2% Fibonacci. So far, there is no reason to expect the execution of an alternative option, which would involve a strong increase in the instrument. Only a small correction in the composition of wave e-C is possible.
|
| Posted: 25 Jan 2022 08:28 AM PST
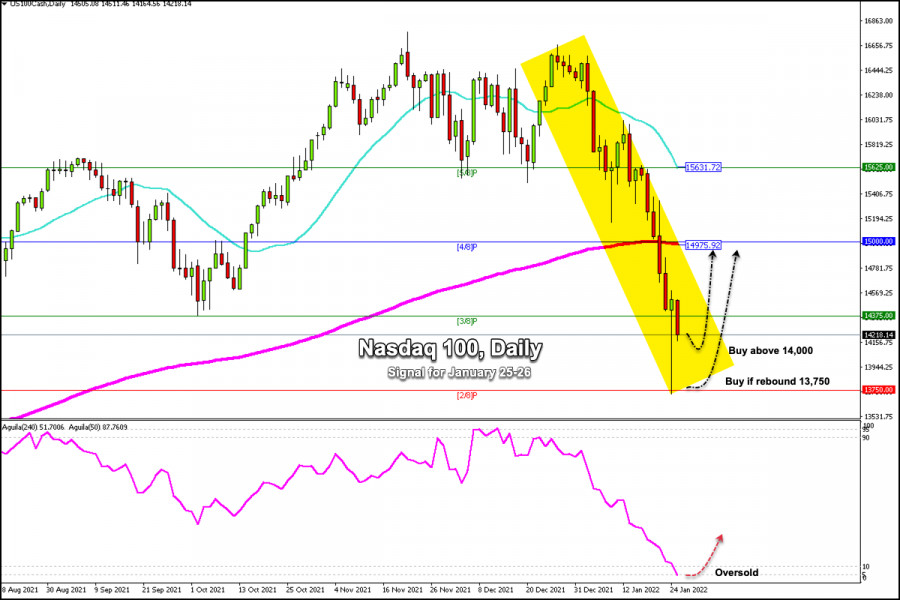
Nasdaq-100 fell sharply in the middle of the American session on Monday. This fall is due to the uncertainty about the Russian invasion into Ukraine and the investors' concern about aggressive tightening of monetary policy by the Federal Reserve. The Nasdaq-100 is currently trading at 14,218. Amid the bearish pressure, the index could make a bounce around the key $14,000 level. The Eagle indicator has reached extreme oversold levels. A technical correction is likely in the next few days above 14,000 or if there is a bounce off around 13,750 (2/8 Murray). The main trend remains bearish according to the daily chart. Trading through the support 2/8 Murray (13,750) will indicate a resumption of the downtrend. Nasdaq-100 is likely to trade between 3/8 Murray and 2/8 Murray around 14,375 and 13,750 in the coming days. Above 14,375, a strong upward move is expected towards the EMA 200 located at 15,000 points. Our trading plan is to buy if it bounces around 14,000 points. Or wait for the rebound at the low of yesterday at 13,750, with targets at 14,275 and up to 15,000 points. Support and Resistance Levels for January 25 - 26, 2022 Resistance (3) 14,834 Resistance (2) 14,526 Resistance (1) 14,375 ---------------------------- Support (1) 14,022 Support (2) 13,959 Support (3) 13,750 *********************************************************** Scenario Timeframe H4 Recommendation: buy in case of rebound off Entry Point 14,000 Take Profit 14,375 (3/8) 15,000 (4/8) Stop Loss 13,920 Murray Levels 13,750 (2/8) 14,375 (3/8) 15,000 (4/8) 15,625 (5/8) *************************************************************************** The material has been provided by InstaForex Company - www.instaforex.com |
| US consumer confidence declines Posted: 25 Jan 2022 08:22 AM PST US consumer confidence decreased in January, for the first time in four months. Americans changed their views on economic and labor market prospects: more consumers planning to buy houses, cars and other other high-priced products, although their optimism about business and labor market conditions has reduced in the near term. US consumer confidence dceclinesAccording to a Conference Board report on Tuesday, US consumer confidence fell to 113.8 from a downwardly revised 115.2 in December. Economists had expected a drop to 111. The figures mean fewer consumers are expecting the economy to improve, incomes to rise and new jobs to appear in the next six months. At the same time, Americans were more optimistic about current business conditions. The percentage of respondents who consider conditions favourable rose to a six-month high, and shopping plans strengthened. Lynn Franco, senior director of economic indicators at the Conference Board in Washington said that the current conditions index had improved, suggesting that the economy had entered 2022 on solid footing. She noted that expectations for short-term growth prospects had weakened, indicating a likely slowdown in the first quarter of 2022. The Conference Board's expectations index fell to 90.8 from 95.4, while the current conditions indicator improved to a five-month high of 148.2. Franco also added that the percentage of consumers planning to buy houses, cars and large appliances in the next six months had increased. The drop in confidence likely indicates an increase in COVID-19 infections. According to official data, an average of 696,541 new coronavirus cases are reported daily in the United States. The winter wave of infections caused by the Omicron variant is likely to subside in some regions, including hardest-hit New York. As for business conditions, news of mergers and super profits for companies in 2021 affect consumer opinion. However, the situation is pessimistic concerning consumption. In fact, inflation is the reason for it. The traditional way to secure from inflation is buying real estate, cars, etc. as soon as possible. Besides, consumer activity with considerable growth of prices is not considered positive, especially taking into account Goldman Sachs outlook to decrease the economic indicators for the first half of 2022. In the meantime, this news certainly will not be favourable for the indices. The material has been provided by InstaForex Company - www.instaforex.com |
| Trading signals for GOLD on January 25 - 26, 2022: buy in case of rebound at $1,843 (6/8) Posted: 25 Jan 2022 07:57 AM PST
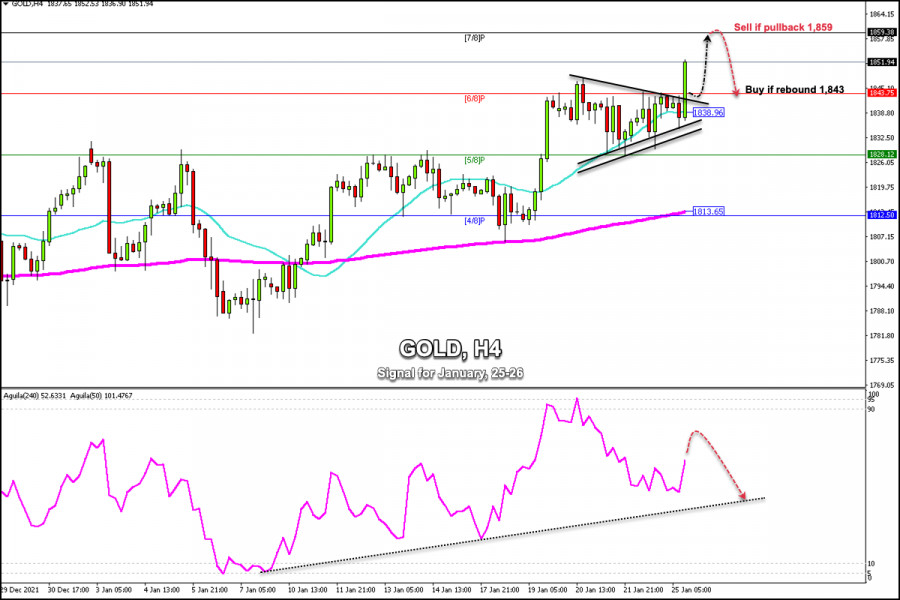
Early in the American session, gold broke above the symmetrical triangle pattern. Currently trading at 1,851.94, gold is likely to keep the bullish momentum until it challenges the strong resistance at 1,859. On the other hand, the resistance of 6/8 Murray has turned into strong support, a technical bounce is likely in the next few hours around this level. Gold is rising because the FOMC is starting its two-day FOMC meeting. Traders and investors are very nervous and worried which makes them take refuge in gold. The metal is expected to reach overbought levels, so we can predict a correction below 1,859 (7/8 Murray) in the next few days. On the other hand, in case of a return and consolidation below 1,838, we could expect a change in trend and a move lower towards 1,828 and EMA 200 located at 1,813. Tomorrow the rate-setting committee is due to unveil their policy decisions. So beware of higher volatility in the market around policy announcements. Therefore, we must be very careful. As long as gold trades above 1,838, the outlook will remain bullish with targets until 1,875. On the contrary, the clearly hawkish policy update will be bearish for the gold price that could below 1,838. Then it will be a clear sell signal with targets up to 1,812. Our trading plan for the next few hours will be to wait for a technical bounce at 1,843 to buy or wait for a pullback at 7/8 Murray around 1,859 to sell. We believe that in the next few hours gold could consolidate between 7/8 and 6/8 Murray. Support and Resistance Levels for January 25 - 26, 2022 Resistance (3) 1,862 Resistance (2) 1,852 Resistance (1) 1,848 ---------------------------- Support (1) 1,838 Support (2) 1,829 Support (3) 1,818 *********************************************************** Scenario Timeframe H4 Recommendation: buy in case of rebound Entry Point 1,843 Take Profit 1,859 (7/8) 1,875 (8/8) Stop Loss 1,837 Murray Levels 1,859 (7/8) 1,843 (6/8) 1,828 (5/8) 1,812 (4/8) *************************************************************************** The material has been provided by InstaForex Company - www.instaforex.com |
| EUR/USD. Why is the dollar getting more expensive and should it be trusted? Posted: 25 Jan 2022 07:55 AM PST The bears of the EUR/USD pair have renewed their monthly price low on Tuesday, approaching the lower border of the range of 1.1260–1.1360. The pair traded within this range for 6 weeks, from the end of November to January. However, since the 20th of December, traders have not approached the lower limit of this echelon: sellers fixed profits as soon as they found themselves in the area of the 12th figure. On Tuesday they turned out to be more persistent, against the backdrop of a general strengthening of the U.S. currency. The U.S. dollar index rallied again, fueled by hawkish expectations of market participants. In addition, the greenback followed Treasury yields, which also shows a positive trend.
The European currency, in turn, is not able to contain the onslaught of dollar bulls. Given that Monday's PMI data, as well as Tuesday's data from IFO, turned out to be in the "green zone," exceeding the forecast values. In particular, the German indicator of economic expectations from the IFO came out in January at around 95.2 points (against the forecast of growth to 93 points). But EUR/USD traders completely ignored the European releases. The tone of the trades is set by the greenback, which is waiting for the results of the January meeting of the Fed. It should be noted that at the moment a rather dangerous situation is developing in the foreign exchange market. The U.S. currency is growing without any specific fundamental reasons. Traders live with hawkish expectations. At the beginning of the year, experts discussed the possibility of a double or triple rate hike in 2022. Then Atlanta Fed President Raphael Bostic allowed four rounds of promotion before the end of the year. However, this scenario is not the most hawkish either: recently, the market has been talking about the fact that the Fed may raise interest rates at almost every meeting in 2022, in response to rising inflationary indicators in the United States. Deutsche Bank analysts, in particular, spoke about such prospects. In their opinion, the American regulator may present a "hawkish surprise" tomorrow, stating that it will raise the rate 6 or 7 times by the end of the year, starting from the March meeting. In total, eight Fed meetings are scheduled this year, but "with a strong desire" Committee members can also organize an extraordinary meeting, as it was in 2020, at the height of the first wave of the coronavirus crisis. In other words, traders' rates are really rising. In my opinion, this is not a completely "healthy" situation, which can turn into big losses for dollar bulls. By and large, the dollar is in demand in fulfillment of the trading principle "buy the rumor, sell the fact." Whether the second part of this algorithm will be executed is an open question, everything will depend on the results of the January Fed meeting. If the Fed limits itself to general phrases and does not implement the most hawkish expectations, the EUR/USD pair will go up again, and at an accelerated pace. The market will not be satisfied with half measures or veiled hints. The issued "credit of trust" will be demanded back "with interest." The U.S. regulator will need to try hard to meet the requirements. Fed Chair Jerome Powell will have to, firstly, announce the first rate hike in March, secondly, announce the start of the Fed's balance sheet reduction in May, and thirdly, agree to the aggressive pace of rate hikes within the current year. This is, so to speak, a "minimum program," with the implementation of which the dollar will continue its path. If Powell fails to sound unambiguous signals regarding the pace of rate hikes and the reduction of the Fed's balance sheet, the greenback will collapse throughout the market. In my opinion, the market is too "electrified" in this regard, thanks to a record increase in inflation, good Nonfarm Payrolls, and hawkish comments from representatives of the Federal Reserve. On the eve of the meeting, they are forced to observe a "silence regime," but up to this point, many members of the Committee have clearly outlined their position. Among them are Brainard, Williams, Daly, Bostic, Mester, George, Barkin, Harker, Bullard. In one way or another, they voiced a "hawkish position," laying the foundation for the corresponding market expectations. The flywheel of the information wave began to gradually unwind, allowing dollar bulls to seize the initiative in almost all pairs. But will the Fed be able to live up to its "expectations"? There is no answer to this question, there are only assumptions. Among the experts, there is no consensus on the possible outcome of the January meeting. According to some analysts, "desperate times call for desperate measures." Record inflation will allow the Fed to make extremely tough decisions without any foreplay. Others believe that the Fed's balance sheet cut will lead to a difficult policy normalization, and this fact could lower the forecasts for the number of rate hikes this year. In view of such uncertainty, it is better to bypass dollar pairs today and tomorrow, unless, of course, trading is considered as a lottery. On the one hand, the pair continues to trade within the range of 1.1260–1.1360. But on the other hand, trading decisions are now emotional in nature (many fundamental factors are simply ignored), so it is extremely risky to open deals now, both in favor of the greenback and against it. The material has been provided by InstaForex Company - www.instaforex.com |
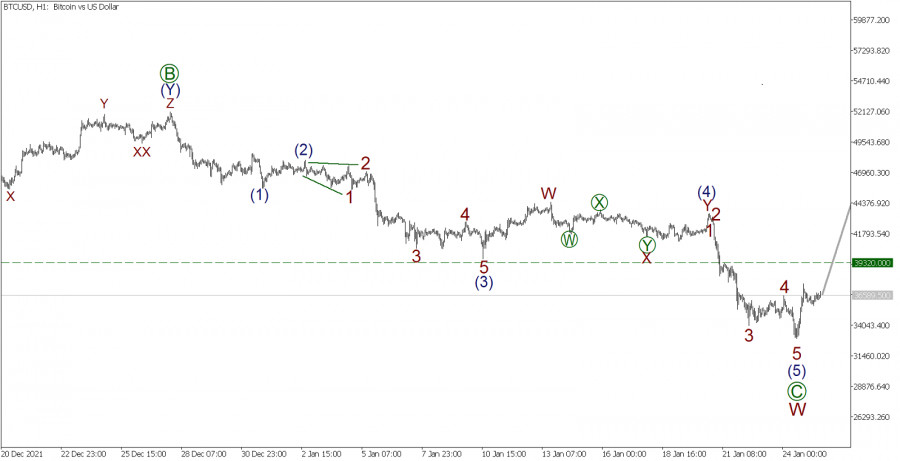
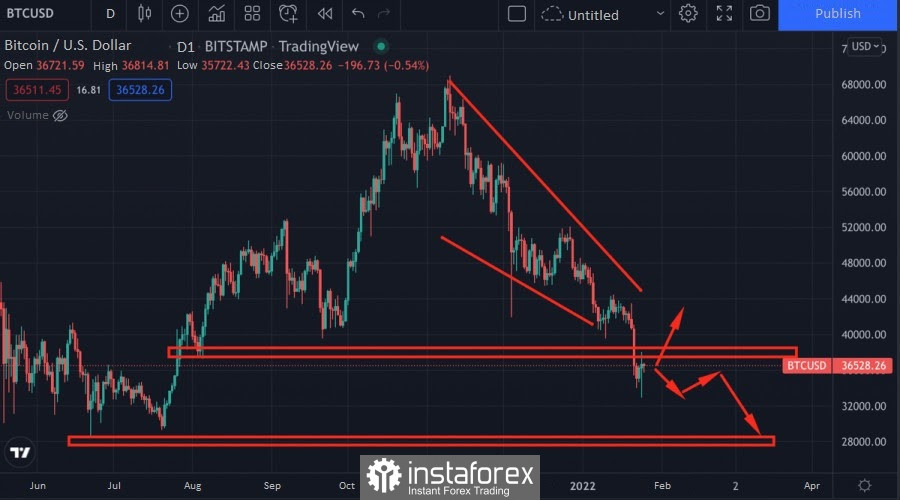
| BTC/USD on January 25. Cryptocurrency issues according to Elliott Theory Posted: 25 Jan 2022 07:37 AM PST Major cryptocurrency news: EOS blockchain platform founder Dan Larimer's company, ClarionOS, will prepare the codebase for Mandel hardfork, designed to give the community control over the protocol. The organization has allocated ClarionOS 200,000 EOS, about $514,000 at the time of writing the article, to fund it. In early 2022, Larimer promised to create a tremendous app designed to make EOS a platform for creating and developing DAOs. Notably, Larimer, the CTO of Block.one, resigned in January 2021. In March, he introduced the decentralized social network Clarion. Bitcoin is further discussed on the hourly time frame according to Elliott theory. BTC/USD H1:
As for the BTC/USD pair, the development of the downward wave W, part of a new corrective trend is observed. The new trend will most likely be a double W-X-Y zigzag. Wave W has probably ended as its final leg [C] looks fully completed by impulse (1)-(2)-(3)-(4)-(5). Therefore, the emergence of a new ascending wave is shown in the last part of the chart. However, at the moment it is hard to predict the form of this wave. It is assumed that the price may rise to the previous high of 39320.00 in the next trading days. In this situation, it is possible to consider opening buy trades from the current level to take profit at it. Trading recommendations: Buy 36589.50, Take profit: 39320.00. The material has been provided by InstaForex Company - www.instaforex.com |
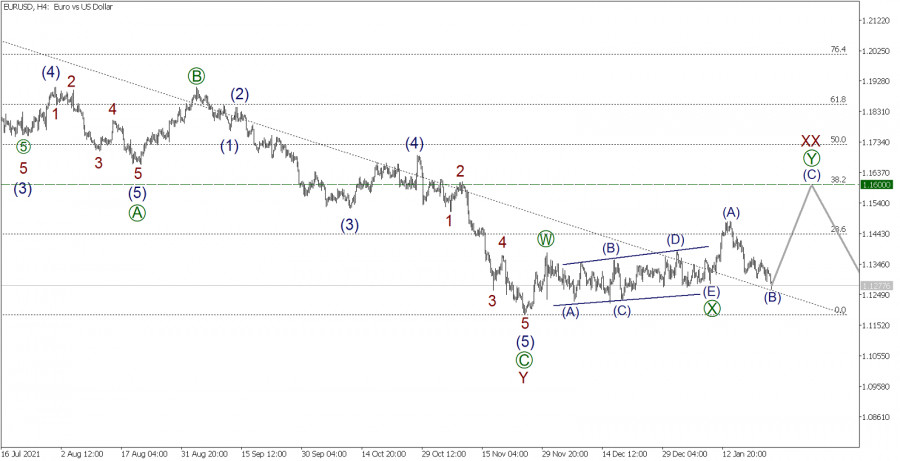
| Wave analysis of EUR/USD on January 25, 2022 Posted: 25 Jan 2022 07:17 AM PST EURUSD, H4:
The EURUSD currency pair forms a corrective pattern - a triple zigzag W-X-Y-XX-Z. After the end of the downward movement of the market, the current wave Y was completed, which took the form of a simple zigzag. After the completion of wave Y, a zigzag wave [W] and a horizontal linking wave [X] were formed in the form of an inclined triangle. These sub-waves are the constituents of the linking wave XX, which can take the form of a double combination [W]-[X]-[Y]. There is a possibility that sub-waves (A)-(B), impulse and correction were formed. Thus, in order to complete the active wave [Y], it is necessary to wait for the development of the final impulse wave (C). The end of the upward movement can be expected at the level of 1.1600. At this price level, the size of wave XX will be 38.2% of the Fibonacci lines from wave Y. Today's U.S. Consumer Confidence report could increase the chances of the bulls and help boost the Eurodollar. In the current situation, it is possible to consider longs from the current level in order to take profit at the level of 1.1600. Trading recommendation: Buy 1.1277, take profit 1.1600. The material has been provided by InstaForex Company - www.instaforex.com |
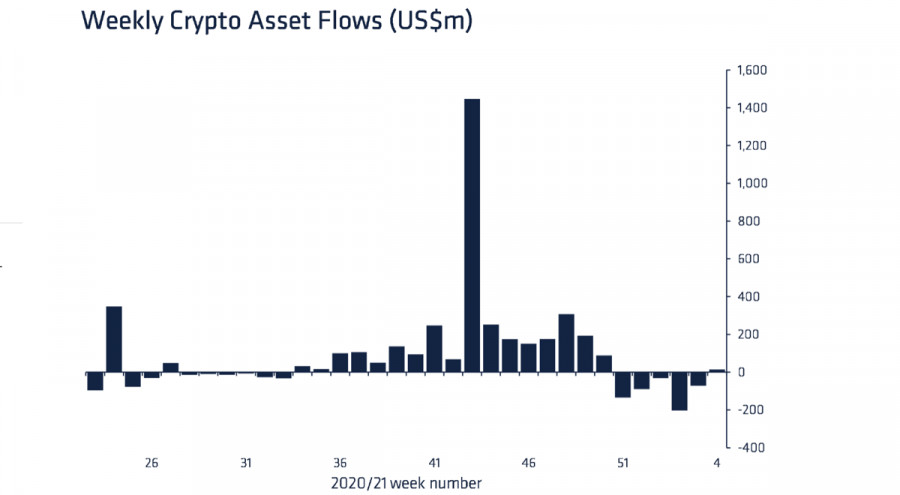
| UBS bank warn onset of "crypto winter" despite resumption of investment flows in crypto funds Posted: 25 Jan 2022 07:02 AM PST Investors in the cryptocurrency market have lost all hope of restoring quotes in the past two weeks. However, hope appeared when no one believed in it anymore. This phrase fully reflects the current situation in the cryptocurrency market. Bitcoin followed the local SPX and NASDAQ bullish momentum and hit $37.5k. Following BTC, the altcoin market also showed a slight increase, which resulted in the growth of the total capitalization of cryptocurrencies by 7% to $1.69 trillion. Thanks to the rebound of the main digital assets, the question has again appeared on the agenda: is it worth waiting for a trend reversal or will Bitcoin drag the entire market into a bear den? Experts from Switzerland's largest bank UBS gave an answer without waiting for the question. According to analysts, Bitcoin and the cryptocurrency market are moving towards a "crypto winter " that could last several years. The fate of Bitcoin is in the hands of the FedBank representatives voiced a key factor contributing to the further fall of Bitcoin. It lies in the position of the Fed and the increase in interest rates, due to which the first cryptocurrency will become less attractive to institutional investors. This statement is debatable as the value of Bitcoin is not limited to being an alternative to gold and fiat. In the next two days, the Fed will give a detailed commentary on digital assets, and the market reaction to this will be the key to understanding further processes in the crypto market.
Indeed, the rise of BTC in the last bull cycle of 2020-2021 was tied to government stimulus programs. Given the catastrophic rise in inflation, the Fed decides to shut down the printing press and raise rates. JPMorgan and Goldman Sachs experts believe that the Fed will raise interest rates at least twice in 2022 in order to effectively counter inflation. These decisions will be painfully received by the cryptocurrency market and bitcoin. Bitcoin is close to a trend reversalDespite the pessimistic statements, Bitcoin holds a key support zone at around $33k. Moreover, for the first time in six weeks, there is an influx of funds into cryptocurrency funds, which can also be a signal of a "thaw." Major players in the stock markets are returning, and the first among them was Rothschild Investment, which bought more shares of the Grayscale Bitcoin trust. The third largest BTC wallet is also on the alert and has acquired 160 coins today alone
All these factors indicate a possible reversal in the price of the bitcoin. The key support zone has held out, major players are returning to the market, and the overall capitalization is growing. Bitcoin is approaching the point of no return, which will be the Fed meeting. Growth of major indices ahead of Powell's speech speaks of the optimistic mood of the market. If expectations are confirmed and the cryptocurrency breaks through the important resistance level of $35.5k, then this will become a signal for the entire market and start a cycle of accumulation and recovery. Otherwise, we should expect a breakdown of the long-term support line at $33k. In the event of a decline, the next key area of resistance will be the yearly low at $28.7k. Its breakdown will mark the onset of winter in the cryptocurrency market.
|
| Posted: 25 Jan 2022 06:39 AM PST
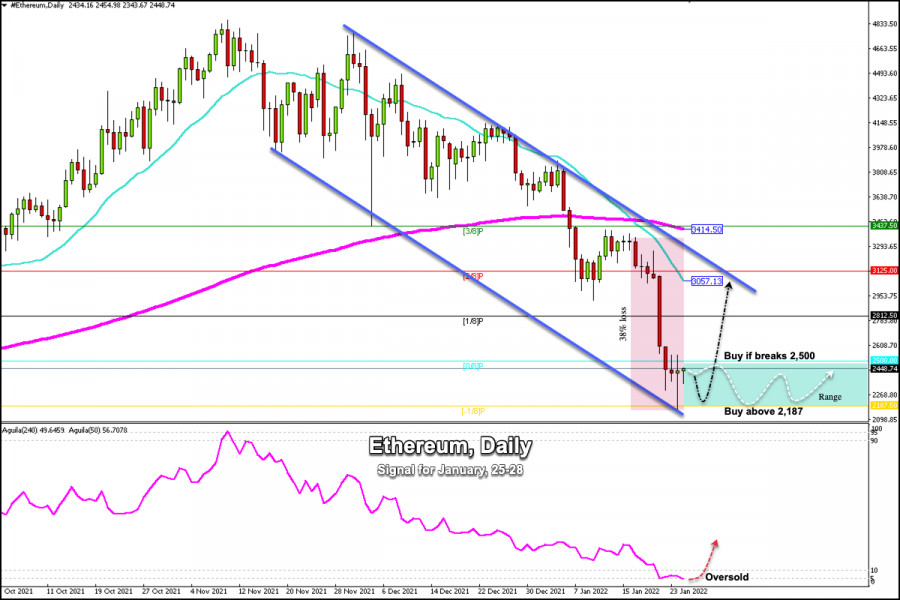
Ethereum (ETH/USD) has incurred a painful loss of more than 50% from its all-time high, and a loss of more than 38% in less than 1 week. According to the daily chart, Ether has reached the extremely oversold support of -1/8 Murray around 2,187. We can observe a downtrend channel, formed since November 28. On January 23, Ether hit the bottom of the bearish channel bouncing quickly. The daily candle on January 24 has formed a Doji, which represents indecision in the market. Ether currently has settled below 0/8 Murray and above -1/8 Murray. This is likely to be the range borders for the next few days, until Ether makes a consolidation around this zone. On the other hand, if Ether breaks and consolidates above the level of 2,500, a recovery could occur and rally to the psychological level $3,000 zone of SMA 21 at 3,057 and to the top of the downtrend channel. Below 2,187 (-1/8 Murray), Ether could lose key bottom support and we could see an accelerated crash towards the level of 1,800 and finally at 1,500. In the medium term and with the increase in the interest rate in the United States, ETH is likely to reach this price level. However in the short term, a technical correction is expected towards the zone of $3,000. The eagle indicator is touching the oversold zone, a correction is expected in the next few days to ease the downward pressure. So, ETH could resume its dominant trend. Our trading plan for the next few hours is to wait for a correction towards the support of 2,185 or a break above 2,500. On the other hand, if Ether fails to break 2,500, it is likely to trade within the range between 0/8 Murray and -1/8 Murray. Support and Resistance Levels for January 25 - 28, 2022 Resistance (3) 2,768 Resistance (2) 2,602 Resistance (1) 2,500 ---------------------------- Support (1) 2,376 Support (2) 2,210 Support (3) 2,022 *********************************************************** Scenario Timeframe H4 Recommendation: buy if rebounds or if breaks Entry Point 2,187 or 2,500 Take Profit 2,812 (1/8) 3,057 (21 SMA) Stop Loss 2,000 or 2400 Murray Levels 2,187 (-1/8) 2500 (0/8) 2,812 (1/8) 3,125 (2/8) *************************************************************************** The material has been provided by InstaForex Company - www.instaforex.com |
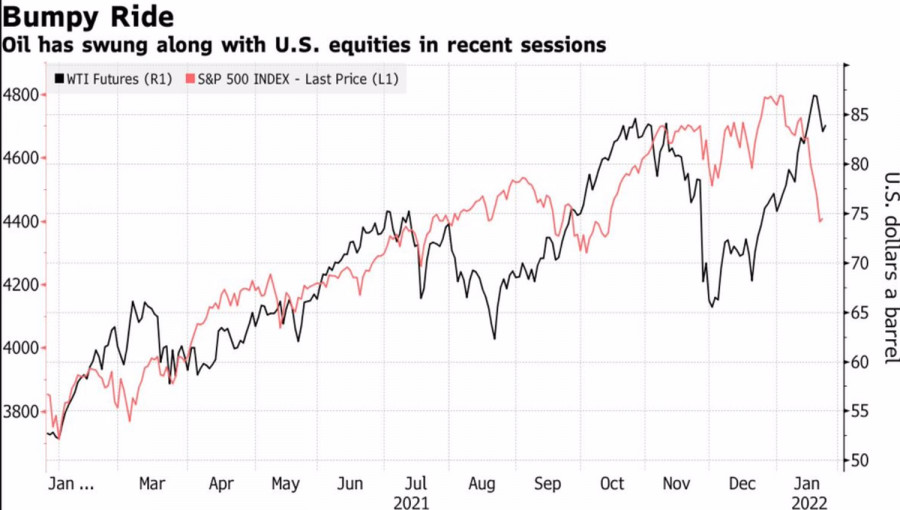
| Oil rally continues: what can trigger a correction? Posted: 25 Jan 2022 06:22 AM PST If U.S. stocks are an indicator of global risk appetite, then oil is an indicator of the health of the global economy. As a rule, the S&P 500 and Brent go the same way, but at the start of 2022, they parted ways. Fears that the Fed's aggressive monetary tightening will slow U.S. GDP growth are leading to a sell-off in equities as oil rises amid a recovery in global demand and supply woes. It seems that the health of the global economy is all right, only investors are in no hurry to buy risky assets. Dynamics of oil and S&P 500
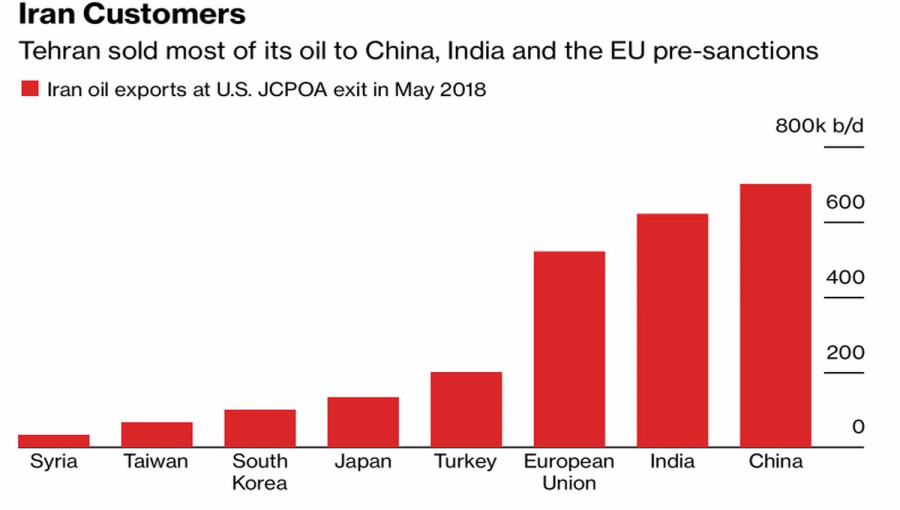
Despite the calls of U.S. President Joe Biden, American shale oil producers are in no hurry to increase production and prefer to spend money not on new drilling rigs, but on payments to shareholders and on loans. It is not conducted on the speech of Biden and OPEC+. At the same time, even increasing production by 400,000 b/d per month, in the light of the limited technical capabilities of the countries participating in the Alliance, looks problematic. BNP Paribas estimates that OPEC+ will not be able to meet its target, also because spare capacity has been halved over the past year. The situation is aggravated by the tense geopolitical situation in the Middle East and Eastern Europe. In the first case, we are talking about attacks by Houthi militants on the oil facilities of the UAE, about the explosion of an oil pipeline in Turkey, which for some time stopped the supply of oil to this state from Iran. In the second, about the escalation of the conflict between the Russian Federation and the West, which may result in the introduction of Russian troops into the territory of a neighboring country. According to RBC Capital Markets, the likelihood of such a scenario is 50 to 50. Sanctions against Moscow will lead to higher prices for gas in Europe and oil products, which are planned to replace it. In the worst case, events will develop according to the Iranian scenario. A sharp decline in Tehran oil exports at one time led to an increase in Brent and WTI quotes. At present, it is Iran, not U.S. shale producers, that is the wild card in the oil market. If the country manages to remove restrictions, oil prices are able to enter a correction. Selling Iranian oil before sanctions
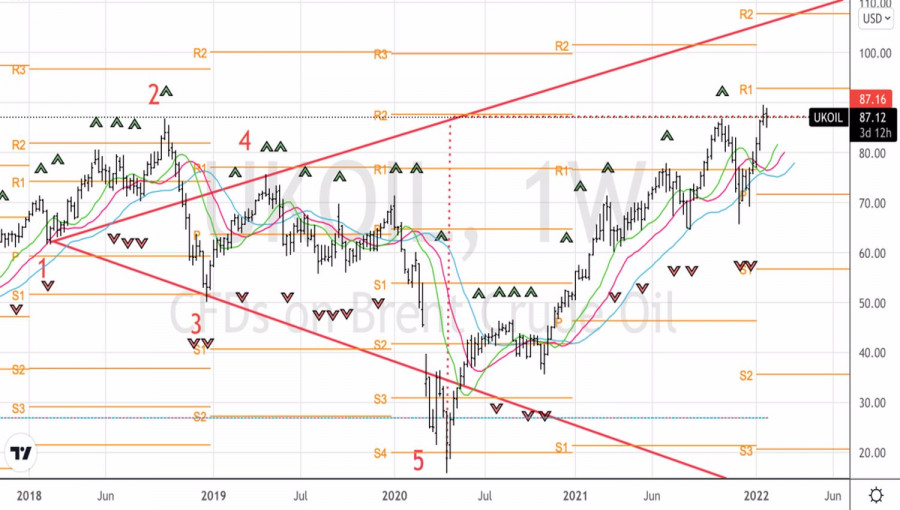
This will be facilitated by overly inflated speculative net-longs for key grades of oil and oil products. Hedge funds have built them up for five consecutive weeks and brought the ratio of bullish longs to bearish shorts to 6.24 to 1, compared to 3.83 to 1 as of mid-December. However, while Tehran has not come to an agreement with the West, there is not a cloud in the sky for the oil market. Even the possible strengthening of the U.S. dollar in response to the "hawkish" surprise from the Fed at the meeting on January 25-26 does not really scare buyers of the North Sea variety. Technically, Brent's rally towards the $100 and $110 per barrel targets in the Wolfe Wave pattern is not going to stop. The roller coaster of trading on January 24 allowed us to form longs on pullbacks at attractive levels, in accordance with the previous recommendation . We continue to buy oil in the hope of achieving our targets. Brent, Daily chart
|
| Bitcoin demand grows as prices fall; Will whales be able to buy the bottom? Posted: 25 Jan 2022 05:53 AM PST Last year, the old whales (long-term large bitcoin holders) may have reduced their positions a bit. However, as the latest data shows, the demand for the main cryptocurrency shows no signs of disappearing, despite the price drop. Some panic sell, others actively buyWhile the market is experiencing panic selling, bitcoin whales are accumulating spare BTC, as evidenced by the falling balances on the exchanges. Bitcoin is buying up aggressively near $30,000 as bidders begin to soak up liquidity from short sellers. Bitcoin is clearly attractive at current levels. Data from the network monitoring resource CryptoQuant shows that since the end of December, bitcoin exchanges have again begun to lose their coin reserves. After a period of traders sending BTC to exchanges, perhaps to sell or rid themselves of further losses, there is now more overall outflow than inflow. Between December 7 and 28, 2021, BTC reserves on 21 major platforms controlled by CryptoQuant increased from 2.396 million to 2.428 million BTC. After that, the long-term downward trend resumed, with 2.366 million BTC accumulated on exchanges as of Monday, despite the fact that the spot price was at a six-month low. Meanwhile, the old whales, despite some impatience in recent years, are still able to provoke a reversal in the price trend, according to CryptoQuant CEO Ki Young Ju. "It seems they have been sold $BTC to new players at the tops or bottoms," he said in a series of tweets on the subject, noting that institutional investors have likely been the main buyers since 2020. Whales begin to redeem the bottomIt is now well known that the trend of the exchange balance now coincides with tangible demand in the network from large investors. As noted by CC15Capital's Twitter account this week, the run to $33,000 was accompanied by multimillion-dollar BTC buy-ins, in particular from one wallet. Since August, the account has accumulated more than $1 billion worth of bitcoin from an initial balance of zero. This phenomenon also comes against the backdrop of a strong determination by long-term holders not to sell. As reported by Cointelegraph, coins that have not moved for a year or more now make up 60% of the total supply of bitcoins. On Monday, Bitcoin managed to stay in the 36,000–38,000 zone, leaving a long shadow of a false breakout. So far, the best scenario is seen in the consolidation of the main cryptocurrency in this range. But even the fact that bitcoin whales entered the market to replenish reserves at a discount does not exclude the fall of the main cryptocurrency to the support of 29,027.83. And from there, an upward reversal looks more likely, because the price for the purchase will be more profitable.
|
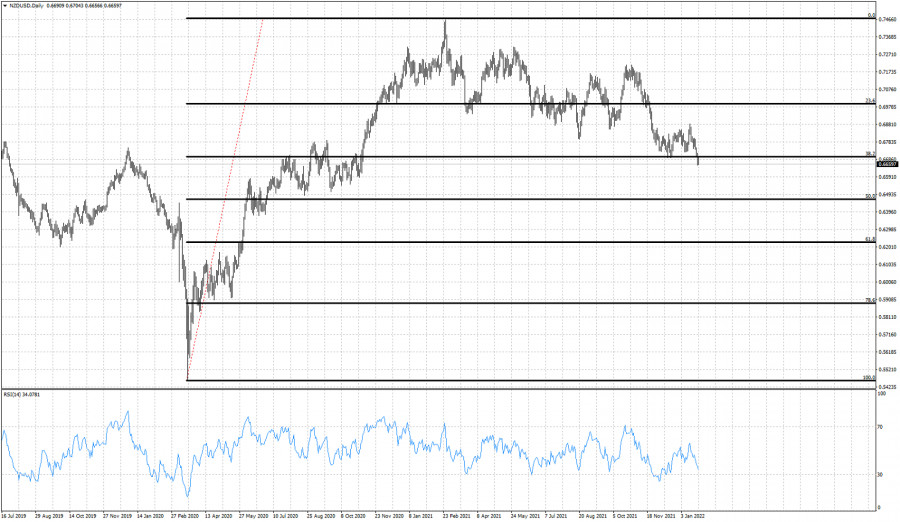
| NZDUSD breaks below key Fibonacci support. Posted: 25 Jan 2022 05:43 AM PST NZDUSD is in a bearish trend making lower lows and lower highs. Price is now at 0.662 and yesterday we saw it breaking below the major 38% Fibonacci retracement of the entire upward movement from 0.5465 to 0.746.
|
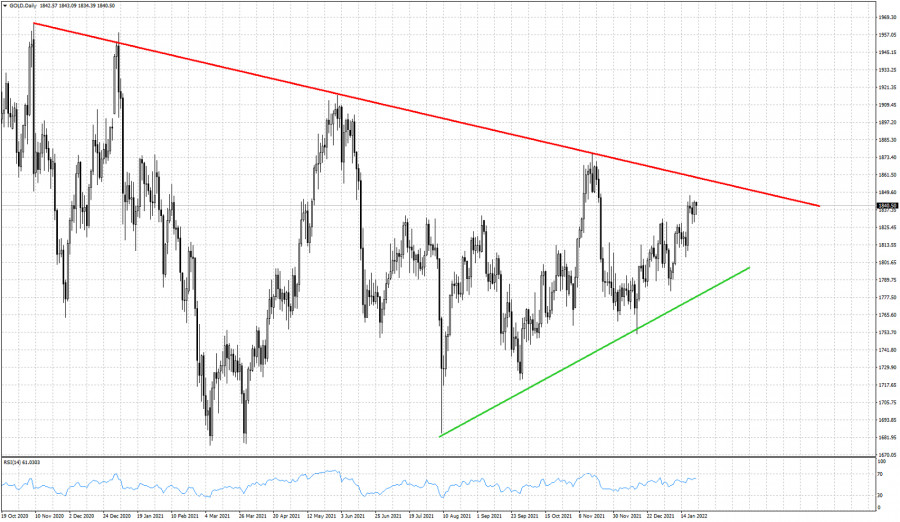
| Gold remains firm above $1,830. Posted: 25 Jan 2022 05:38 AM PST Despite Dollar strength, Gold price continues to trade around $1,840-30. After having broken the resistance at $1,830, Gold price remains steadily above it. As we mentioned back then, Gold price has the potential to move higher towards $1,860.
Green line -support Gold is trading inside this long-term tightening triangle formation. Short-term trend is bullish since the $1,752 low as price is making higher highs and higher lows since then. Gold price got rejected three times at the red resistance trend line. So one thing is for sure, the $1,860 where we find now the red resistance trend line, is important resistance and we expect to see a big test for traders there. Gold price is near major resistance. This is not ideal for opening new bullish positions. Traders need to be cautious. Support is found at $1,830 and next at $1,815. Bulls do not want to see these levels broken. The material has been provided by InstaForex Company - www.instaforex.com |
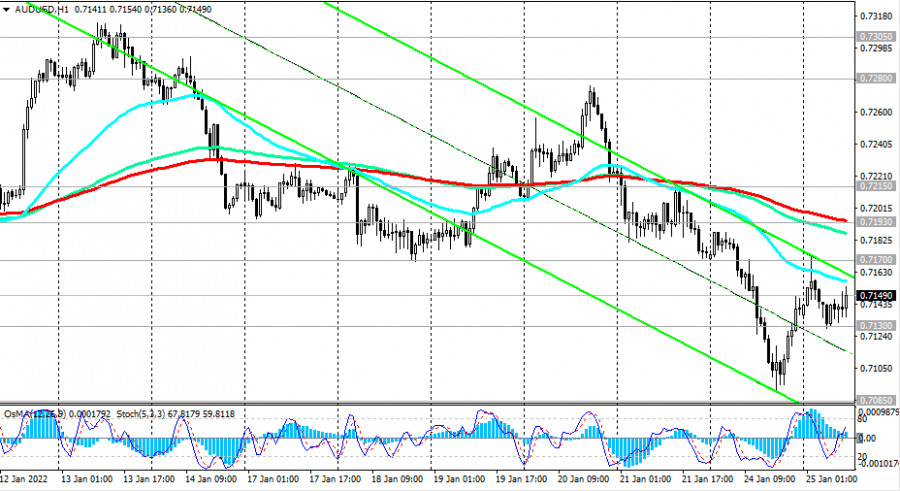
| AUD/USD Forecast: Australian inflation soar Posted: 25 Jan 2022 05:33 AM PST The Australian dollar strengthened sharply at the beginning of the Asian trading session on Tuesday, having received support from the Australian Bureau of Statistics, which published fresh inflation data. According to the ABS, the consumer price index rose in the 4th quarter by 1.3% (+3.5% in annual terms). The base CPI grew by +1.0%, and its annual growth rate accelerated to 2.6%, the highest since 2014. "Shortages of building supplies and labor, combined with continued strong demand for new dwellings, contributed to price increases for newly built houses, townhouses and apartments," ABS commented, adding that problems in global supply chains and shortages of some goods, combined with rising transport tariffs and strong demand led to a rise in prices for many goods, including materials for housing construction, cars, furniture, and audio and video equipment. After the publication of the report by the Australian Bureau of Statistics, the AUD/USD pair rose to an intraday high of 0.7172, but during the Asian trading session it declined, dropping to the local support level of 0.7130.
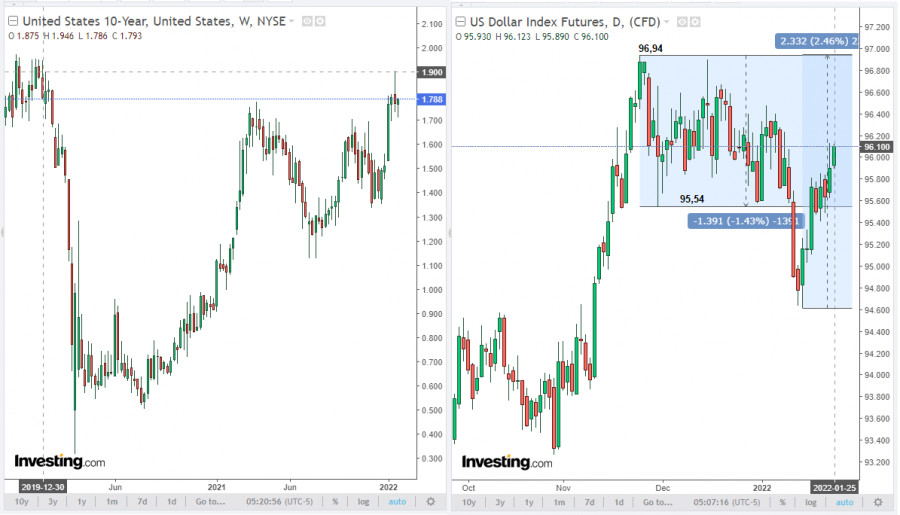
At the time of writing, AUD/USD is trading near 0.7150, remaining the only major dollar pair with a white intraday candle. The rest of the main competitors of the U.S. dollar are losing to it today, while the DXY dollar index is growing again. At the time of writin, DXY futures were trading near 96.10, 149 pips above the local low of 94.61 reached the week before last.
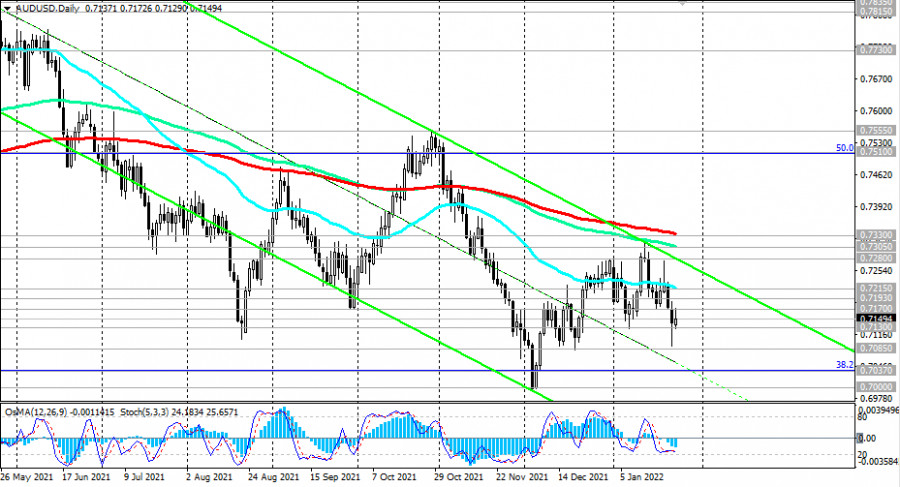
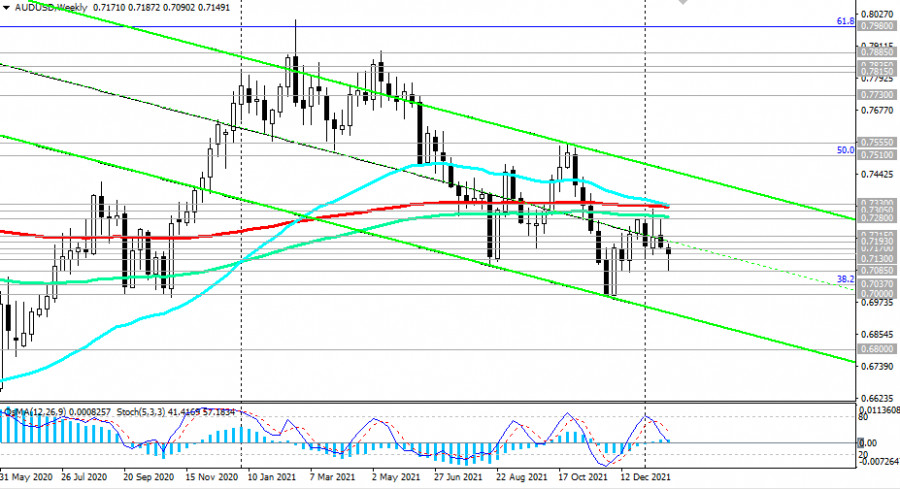
Then the dollar fell against the backdrop of a strong rise in inflation in the United States. U.S. consumer prices rose 7.0% in December year-on-year, the highest since June 1982, according to released data. Investors are obviously wary of accelerating inflation, fearing that the Fed's tightening of monetary policy may not be enough. The Fed's meeting on monetary policy begins today. It will end tomorrow with the publication of the interest rate decision at 16:00 UTC. Now market participants are waiting for the Fed to start a cycle of raising interest rates. If all goes according to plan, the Fed's first rate hike could happen as early as spring. In total, 3 increases are expected this year. However, there is a growing market sentiment that this may not be enough, and the Fed will have to resort to more aggressive steps to curb accelerating inflation. As early as the week before last, St. Louis Fed President James Bullard said it now looks like it will be necessary to raise interest rates four times to curb high inflation. "We want to bring inflation under control in a way that does not disrupt the real economy, but we are also firm in our desire to get inflation to return to 2% over the medium term," Bullard said. Investors are now assessing high inflation in the U.S. and the likelihood that the Fed will have to raise rates more aggressively this year to contain price increases. Market participants are also set on the fact that the Fed, after raising interest rates, will begin to reduce its asset portfolio (the Fed's balance sheet is now $8.8 trillion). The current accelerated reduction in asset purchases by the Fed and expectations of the start of a cycle of interest rate hikes in March are already pushing U.S. Treasury yields higher. Last week, the yield on 10-year U.S. bonds exceeded 1.900%. The dollar, as you know, is sensitive to the growth of government bond yields, since this growth has an inverse correlation with the cost of government bonds. Growth in sales of government bonds is accelerating, causing an increase in their yield and, accordingly, demand for the dollar. Nevertheless, the Fed's interest rate is expected to remain at 0.25% at the January meeting. Market participants will carefully study the comments of the Fed leaders. Thus, during the period of publication of the rate decision, volatility may increase sharply throughout the financial market, primarily in the U.S. stock market and in dollar quotes, especially if the rate decision differs from the forecast or unexpected statements are received from the Fed's management. As for the AUD and the monetary policy of the RBA, its next meeting will be held next week. Australia's 4th quarter inflation data released today was well above expectations. With the Australian labor market continuing to strengthen, creating the conditions for accelerated wage growth, this allows many economists to predict an earlier start to the tightening of the RBA policy. According to their new forecast, the RBA will raise the key rate in August 2022, and not in the 4th quarter, as previously expected. If at the meeting next Tuesday the RBA leaders confirm the possibility of such a scenario, then the AUD can get good support. With the Fed and, now the RBA, expected to start tightening their monetary policies this year, we are yet to see the AUD/USD trajectory fluctuate wildly. In the meantime, the downward dynamics of this currency pair is preserved, leaving an advantage for short positions on it. Technical analysis and trading recommendations In response to the publication of fresh data on the dynamics of consumer inflation in Australia today, the AUD has strengthened, and the pair AUD/USD has grown, briefly breaking through the local resistance level of 0.7170. Nevertheless, the pair is in a stable downward trend, below the key resistance level 0.7330 (200 EMA on the daily and weekly charts).
A breakdown of the local support level 0.7130 will be the first signal for resuming sales, and a breakdown of the local support level 0.7085 will be a confirmation. The nearest decline targets are support levels 0.7037 (38.2% Fibonacci retracement to the pair's decline from 0.9500 in July 2014 to 2020 lows near 0.5510), 0.7000. In an alternative scenario, an upward correction will resume with targets at the resistance levels of 0.7193 (200 EMA on the 1-hour and 4-hour charts), 0.7215 (50 EMA on the daily chart).
The potential for corrective growth remains until the key resistance levels of 0.7280 (144 EMA on the weekly chart and the upper limit of the downward channel on the daily chart), 0.7305 (144 EMA on the daily chart), 0.7330 (200 EMA on the daily and weekly charts). At the same time, AUD/USD remains in the global bearish trend zone, trading below the key resistance level of 0.7330. Therefore, it is worth giving preference to short positions. Support levels: 0.7130, 0.7085, 0.7037, 0.7000, 0.6900, 0.6800 Resistance levels: 0.7170, 0.7193, 0.7215, 0.7280, 0.7305, 0.7330 Trading Recommendations for AUD/USD pair: Sell Stop 0.7125. Stop-Loss 0.7175. Take-Profit 0.7085, 0.7037, 0.7000, 0.6900, 0.6800 Buy Stop 0.7175. Stop-Loss 0.7125. Take-Profit 0.7193, 0.7215, 0.7280, 0.7305, 0.7330 The material has been provided by InstaForex Company - www.instaforex.com |
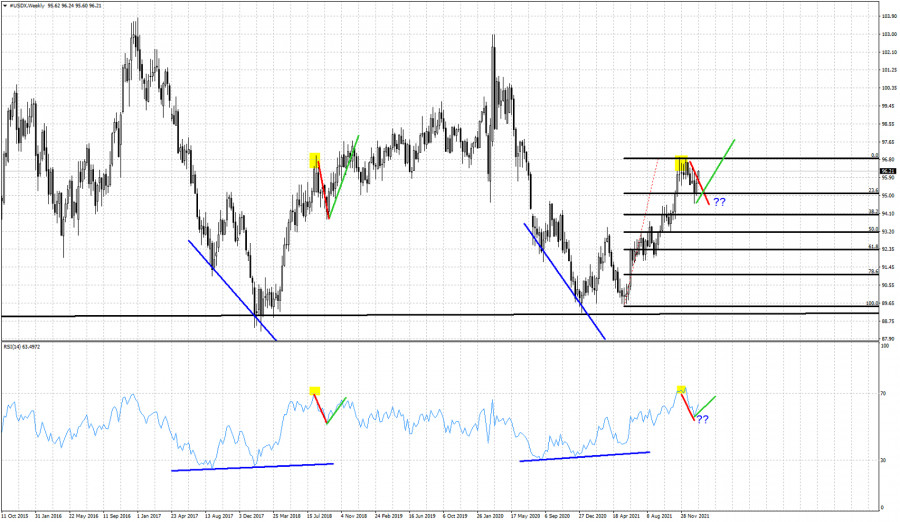
| The Dollar index and the expected move higher. Posted: 25 Jan 2022 05:33 AM PST On January 18th we pointed out that the Dollar index was expected to make a bullish reversal. We came to this conclusion as we believe that the Dollar index is following the same path it did back in 2017-2018.
Red line- same declines Green lines- expected same upward moves Black lines- Fibonacci retracements The Dollar index is bouncing higher after touching the 23.6% Fibonacci retracement. Our 2017-2018 analogy warned us for the coming pull back from 96.90 and we recently warned traders of the increased chances of an upward reversal from the recent pull back at 94.60. The Dollar index has the potential to move to new higher highs as long as price is above 94.60. The move higher could again be very choppy if it follows the 2018 rise to 98. We follow closely the price action in the Dollar index to see if the past can continue to give us hints on where we should expect next to see the index. The material has been provided by InstaForex Company - www.instaforex.com |
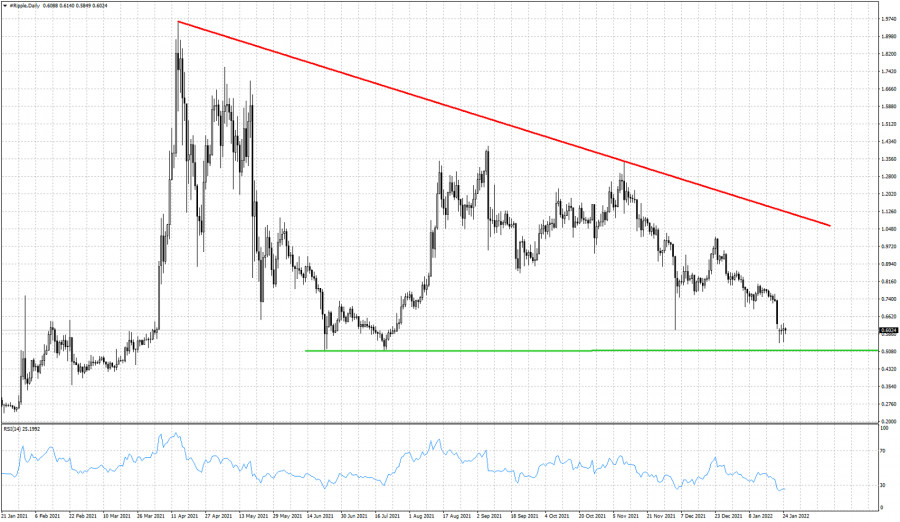
| XRPUSD challenges June- July lows. Posted: 25 Jan 2022 05:26 AM PST The decline in XRPUSD has stopped at $0.5457. Price is trading between $0.54 and $0.63. As we explained in previous posts, XRPUSD broke below two key support trend lines and remains vulnerable to a move lower.
Green line- horizontal support and June-July 2021 lows XRPUSD is in a bearish trend. This is very clear as price continues making lower lows and lower highs. Next major support is found at $0.50 where we find the June-July lows of 2021. The RSI on a daily basis has not provided any reversal warning. There is no bullish divergence in the RSI and this implies that we should expect more downside. The chances of breaking below $0.50 remain high. Price could produce a bounce from $0.50 as it is very important horizontal support. As long as price holds above $0.50, there are also chances that a strong multi week bounce can follow and push price towards the major resistance trend line towards $1. Concluding, this is not the time to be bearish XRPUSD as it approaches major support. Nevertheless trend remains in control of the bears. There is still no sign of a reversal. The material has been provided by InstaForex Company - www.instaforex.com |
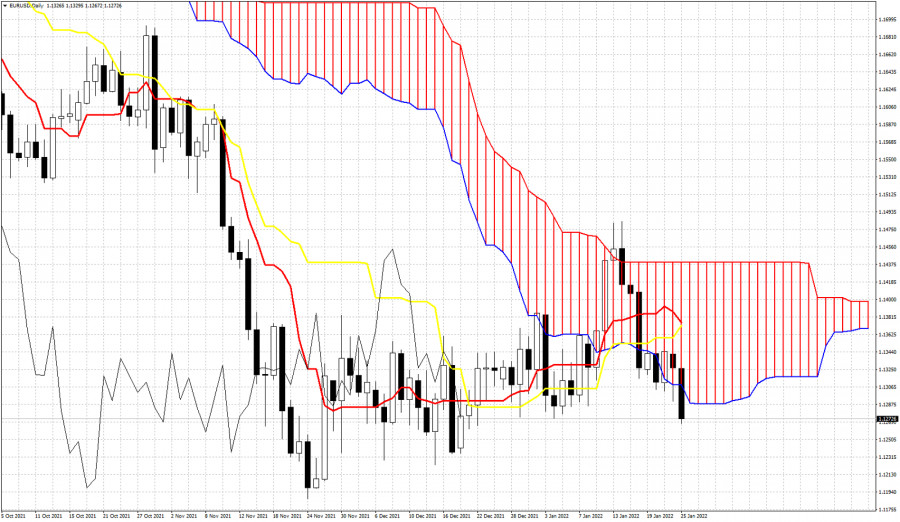
| Ichimoku cloud indicator analysis on EURUSD for January 25, 2022. Posted: 25 Jan 2022 05:21 AM PST EURUSD is under pressure. Price yesterday managed to recover most of its losses but today price is breaking below the Ichimoku cloud support providing a bearish signal. EURUSD is trading at 1.1272 having made a lower low relative to yesterday's low at 1.1291.
|
| Video market update for January 25,,2022 Posted: 25 Jan 2022 05:20 AM PST Watch for downsside continuation patterns on EUR/USD... The material has been provided by InstaForex Company - www.instaforex.com |
| Asian stock market declines notably Posted: 25 Jan 2022 04:58 AM PST
Asian stock indices posted a considerable decline on Tuesday. Thus, the Shanghai Composite Index fell by 1.12%, the Shenzhen Composite Index dropped by 1.65%, and the Hang Seng Index went down by 1.36%. Other indices of the Asian stock market fell even lower: Korea's Kospi lost 2.92%, Australia's S&P/ASX 200 was down by 2.55%, and the Japanese Nikkei 225 declined by 1.98%. The main reason for such a significant drop in the Asian market is the upcoming meeting of the US Federal Reserve. The regulator is widely expected to make a decision on changes in monetary policy that will take place in March this year. Fed's policy tightening is aimed at fighting record-high inflation. This will eventually affect all global stock markets as liquidity is set to decrease. The second reason is the rapid spread of a newly detected coronavirus strain. Every day, different countries all over the world report an increasing number of new Omicron cases. This may lead to new restrictions which will result in a slowdown in economic growth. Among the Nikkei 225 stocks, the biggest decline was recorded in Japan Steel Works, Ltd. (-8.7%), Rakuten Group Inc. (-7.3%), and SoftBank Group Corp. (-5.9%). As for the Hang Seng Index components, Sino Biopharmaceutical, Ltd. (-4.7%), Geely Automobile Holdings, Ltd. (-4.4%), and JD.com Inc. (-3.5%) posted the biggest losses. According to preliminary estimates, South Korea's GDP grew by 4% last year compared to 2020, its highest reading since 2011. In the last quarter of 2021 alone, GDP grew by 4.1% year-on-year and 1.1% on a quarterly basis, far exceeding the forecast of 3.7% and 0.9% respectively. Despite the upbeat macroeconomic data, Korea's index declined, dragging down the shares of Samsung Electronics Co. (-2.1%) and LG Corp. (-3.4%). Meanwhile, Australia reported a 1.3% increase in consumer prices in the fourth quarter of 2021 on a quarterly basis. At the same time, prices increased by 3.5% over the same period in 2020, which was a record high for the last 7 years. According to forecasts, prices were expected to rise by no more than 1% quarter-on-quarter and 3.2% year-on-year. Following a decline in the Australian index, securities of ANZ (-4%), Commonwealth Bank of Australia (-3%), and National Australia Bank (-3%) fell in price. Santos, Beach Energy, and Woodside Petroleum also depreciated by 4.8%, 7.7%, and 4.7% respectively. The material has been provided by InstaForex Company - www.instaforex.com |
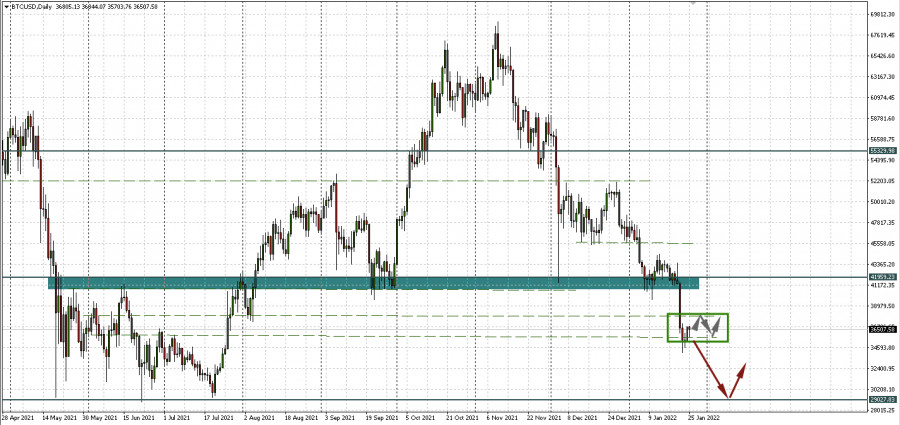
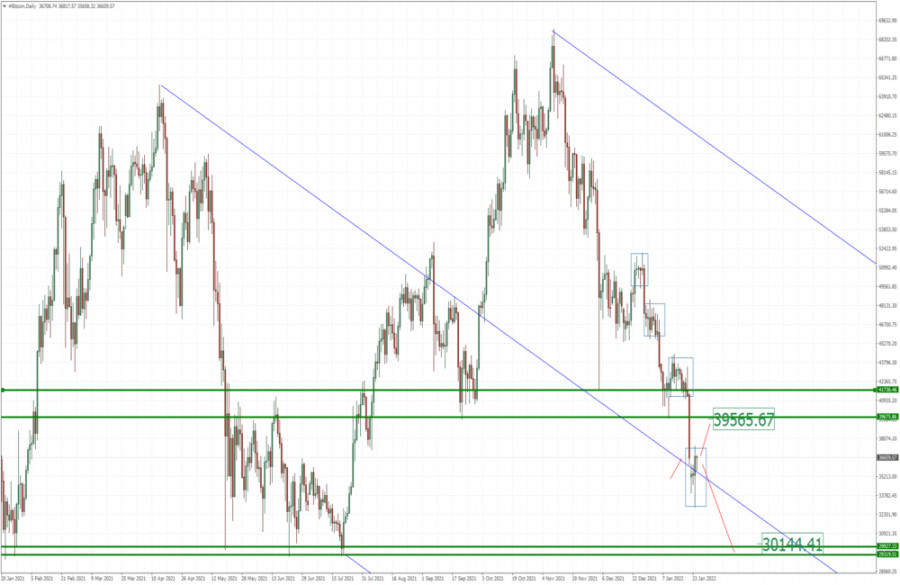
| BTC analysis for January 25,.2022 - Sideways mode Posted: 25 Jan 2022 04:43 AM PST Technical analysis:
BTC/USD has been trading sideways in last 24 hours. I see the consolidation day today and potential for another breakout. Trading recommendation: If you see the breakout of resistance at thee price of $37,600, watch for upside opportunities with the upside objective at $39,565 If you see the downside breakout of support at $33,000, watch for selling opportunities with objective at $30,150 The material has been provided by InstaForex Company - www.instaforex.com |
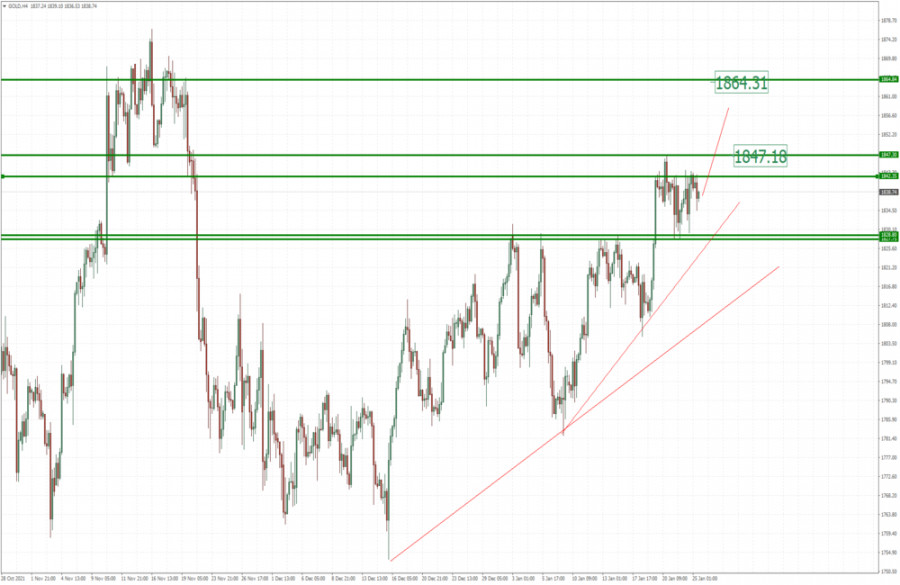
| Analysis of Gold for January 25,.2022 - Higher lows and potential for upside continuation Posted: 25 Jan 2022 04:38 AM PST Technical analysis:
Gold has been trading sideways at the price of $1,838 but there is still chance for the upside continuation. Trading recommendation: Gold is still trading in the short-term upside trend and I see potential for the upside continuation in case of the breakout of key resistance at $1,844. Watch for potential breakout of key resistance at $1,845 to confirm rise towards $1,865 and $1,877. Key support level is set at the price of $1,828 The material has been provided by InstaForex Company - www.instaforex.com |
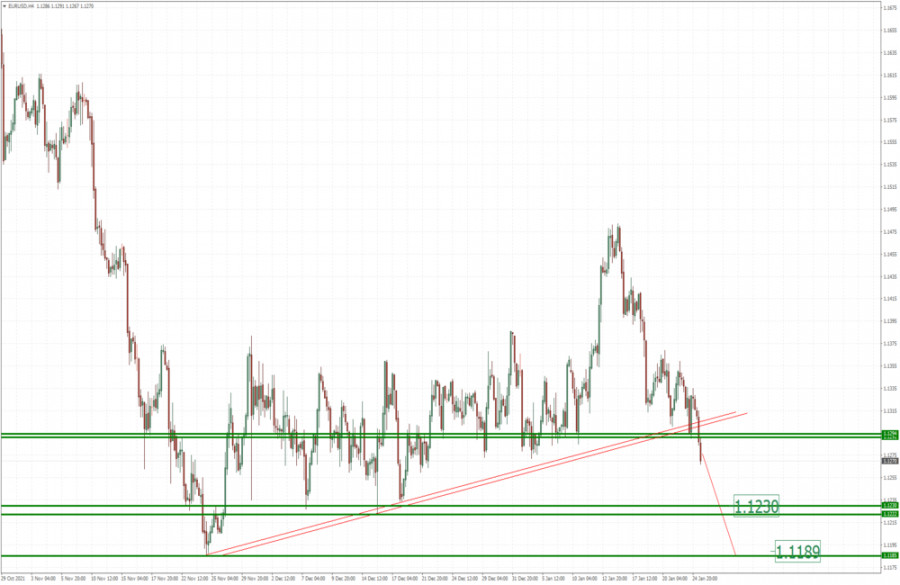
| EUR/USD analysis for January 25, 2022 - Breakout of key pivot at 1.1300 Posted: 25 Jan 2022 04:33 AM PST Technical analysis:
EUR/USD has been trading downside today and I see potential for the downside continuation in the next period. Trading recommendation: Due to strong downside momentum and the breakout of the key support at the price of 1,1300, I see potential for further downside continuation. Watch for selling opportunities on the rallies with the downside objectives at the price of 1,1230 and 1,1190. Additionally, there is the the breakout of rising trend-line , which is another confirmation for the downside continuation. The material has been provided by InstaForex Company - www.instaforex.com |

| You are subscribed to email updates from Forex analysis review. To stop receiving these emails, you may unsubscribe now. | Email delivery powered by Google |
| Google, 1600 Amphitheatre Parkway, Mountain View, CA 94043, United States | |


Comments