Forex analysis review
Forex analysis review |
- Analysis of GBP/USD on January 15. The pound is also ready to complete the construction of an upward wave.
- EUR/USD analysis on January 14. A sharp decline in the European currency. Is the rising wave complete?
- Analysis of the trading week of January 10-14 for the GBP/USD pair.
- Analysis of the trading week of January 10-14 for the EUR/USD pair. Traders ignored important data and started buying up
- Gold challenges 1,815.57 static support
- Ethereum stops decline at key Fibonacci retracement.
- Bearish candlestick formation in GBPUSD.
- Gold's getting rejected for the third time at $1,830.
- Technical analysis on EURUSD for January 14, 2022.
- January 14, 2021 : EUR/USD daily technical review and trading opportunities.
- January 14, 2021 : EUR/USD Intraday technical analysis and trading plan.
- January 14, 2021 : GBP/USD Intraday technical analysis and significant key-levels.
- Musk says Tesla to accept dogecoin
- GBP/JPY new downtrend activated
- Bitcoin confirmed its breakout
- EUR/USD plunges despite poor US Retail Sales
- Trading signals for Dow Jones 30 (#INDU - DJ30) on January 14 - 17, 2022: sell below 35,873 (200 EMA)
- Trading signals for EUR/USD on January 14 - 17, 2022: sell below 1.1474 (4/8 - strong resistance)
- Technical analysis of EUR/USD for January 14, 2022
- EU energy bills set to push new highs in 2022
- Trading signals for USD/JPY on January 14 - 17, 2022: buy in case of rebound off around 113.65 (3/8)
- BTC analysis for January 14,.2022 - Downside breakout of consolidation
- Analysis of Gold for January 14,.2022 - Potential for the breakout or downside rotaion
- Visa to test its cryptocurrency services
- USD/CAD analysis for January 14, 2022 - Potential for bigger upside movement
| Posted: 15 Jan 2022 03:14 AM PST
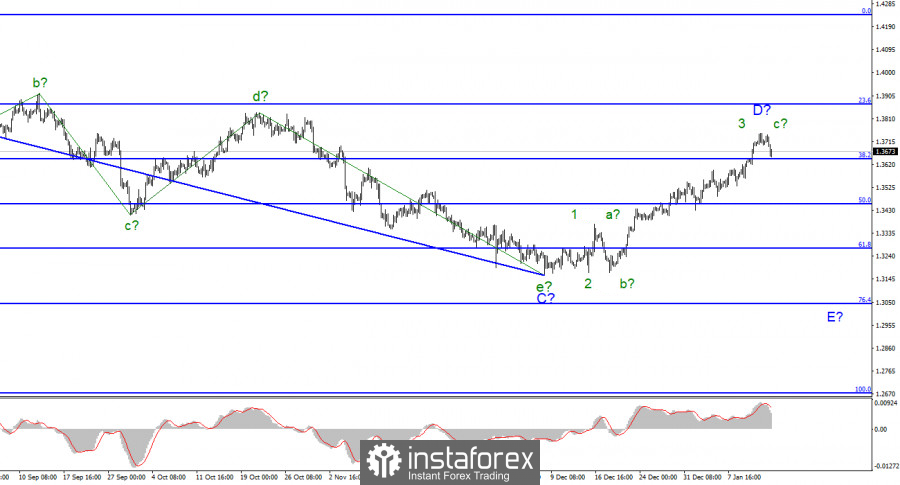
For the pound/dollar instrument, the wave markup continues to look quite convincing and is becoming more and more structured. In the last few weeks, the instrument has continued to build an upward wave, which is currently interpreted as wave D of the downward trend segment. If the current wave marking is correct, then the decline in quotes will resume after the completion of this wave, which could already happen on Friday. Thus, the entire downward section of the trend may take on an even more extended form. However, if wave D takes a five-wave form, then it will need to be recognized as an impulse, and in this case, it will no longer be able to be a corrective wave D, and the entire wave pattern will require additions. At the moment, only three waves are visible inside it, which can be a-b-c series. However, a successful attempt to break through the 1.3644 mark, which corresponds to 38.2% Fibonacci, will indicate the readiness of the markets to sell the British. Let's move away from politics. The Fed has a delicate job to do with PEPP. The exchange rate of the pound/dollar instrument decreased by 30 basis points during January 14. This is very little if we count by the closing and opening levels of the day. However, the dynamics of the instrument decreased by 90 points, which may mean the completion of the construction of the ascending wave D. If the news background was of average strength for the euro/dollar instrument, then the pound/dollar instrument was strong. In addition to the American reports, which I mentioned in the article on the euro/dollar, quite interesting publications have also been published in the UK. I should mention the GDP report for November, which grew by 0.9% m/m, as well as the report on industrial production, which grew by 1.0% m/m. In both cases, market expectations were lower. Nevertheless, the pound was only thinking about continuing to increase for one hour, and then it crashed down like a stone. The markets did not win back the British statistics and did not pay attention to the American ones. I think this may indicate that the markets are ready to build a new downward wave. The same situation was observed on Friday for the euro/dollar and a downward wave is also expected there. Thus, both instruments can start a long decline. I note that the markets did not want to work out the reports on Friday, but they also do not pay attention to other news. For example, the news about Omicron, which continues to attack both America and the European Union. Also, the markets are not interested in all the scandals with Boris Johnson, unsuccessful negotiations with the European Union on the protocol on the border with Northern Ireland, and a possible referendum on independence in Scotland. Even if these topics are considered separately and at different times, there is still no connection between them and the position of the Briton about the American. I believe that wave analysis is in the first place now General conclusions. The wave pattern of the pound/dollar instrument assumes the completion of the construction of the expected wave D in the near future (or has already been completed). Since this wave has not yet taken a five-wave form, I expect that a new descending wave E will be built. And it should begin in the very near future. However, I advise you to expect a sales signal, such as a successful attempt to break through the 1.3644 mark. And only, in this case, start selling the instrument with the first targets located near the 1.3452 and 1.3274 marks.
|
| Posted: 15 Jan 2022 02:02 AM PST
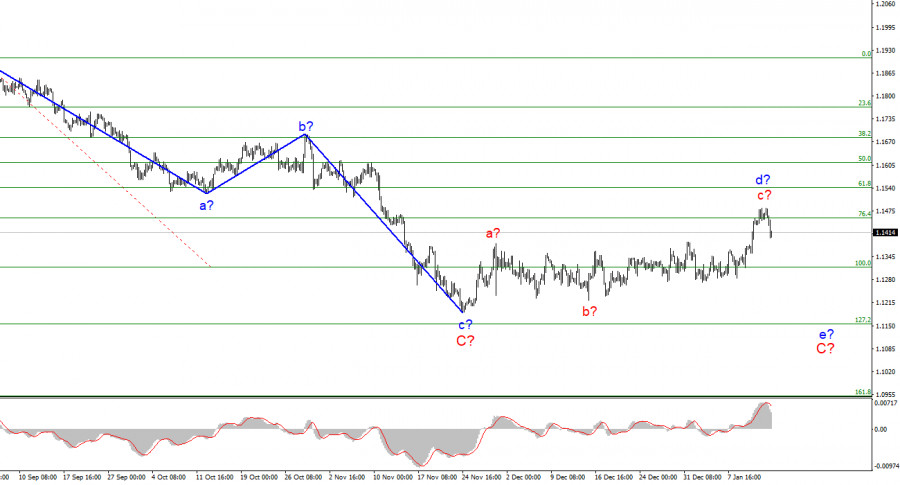
The wave marking of the 4-hour chart for the euro/dollar instrument still does not change. Over the past few days this week, the quotes of the instrument have been rising and have broken through the previous peak of the expected wave d. Thus, wave d turned out to be more extended than I originally expected. However, this change does not change the essence of the wave markup. I still believe that the current wave is corrective, not impulsive, as evidenced by its complex internal wave structure. Therefore, it cannot be wave 1 of a new upward trend segment. If so, the decline in quotes will resume within the framework of the expected wave e-C and Friday's departure of quotes from the reached highs may indirectly indicate the construction of a new downward wave. At the same time, a further increase in the quotes of the European currency may lead to the need to make adjustments to the current wave markup, since wave d will turn out in this case to be the longest wave in the composition of the downward trend section. An unsuccessful attempt to break through the 1.1455 mark also indicates that the market is not ready for further purchases of the instrument. American inflation continues to accelerate. The euro/dollar instrument fell by 50 basis points on Friday. Demand for the European currency began to decline, which corresponds to the current wave marking but does not correspond to Friday's news background. Christine Lagarde said on Friday that the ECB is ready to adjust monetary policy to reach the inflation target of about 2%. "We understand that the rise in prices worries the residents of the European Union. Our commitment to the goal of price stability remains unwavering, and we will take all necessary measures to stabilize price growth," the ECB president said. This speech was quite neutral since Lagarde did not say anything about raising the interest rate or ending the stimulus program. According to earlier information, it follows that the emergency asset purchase program will be completed in March 2022, but there is no new information about this. It is completely unknown what impact the winter wave of the pandemic will leave on the economy. Let me remind you that in the European Union, up to 50% of the population may become infected in the coming months. That's what the WHO thinks. With such a huge number of patients, it is unlikely that the economy will not suffer in any way. And if it suffers, the plans of the ECB may change. Also on Friday, a report on retail trade with America in December was released. The figures turned out to be sad. Instead of zero sales growth, the markets saw a decrease in volumes by 1.9% m/m. The report on industrial production was no better, it decreased by 0.1% m/m with market expectations of +0.2% m/m. The consumer sentiment index from the University of Michigan also turned out to be weak: only 68.8 with expectations of 70.0. Thus, all the most important reports in America turned out to be weak, but demand for the US currency still rose on Friday. From my point of view, this is evidence that the market is ready to build a downward wave, despite the weak news from the United States. General conclusions. Based on the analysis, I conclude that the construction of the ascending wave d can be completed. If this assumption is correct, then now it is possible to sell the instrument based on the construction of the wave e-C with targets located near the calculated marks of 1.1315 and 1.1154, which equates to 100.0% and 127.2% by Fibonacci. A successful attempt to break through the 1.1455 mark will indicate an even greater complication of the upward wave and cancel the sales option.
|
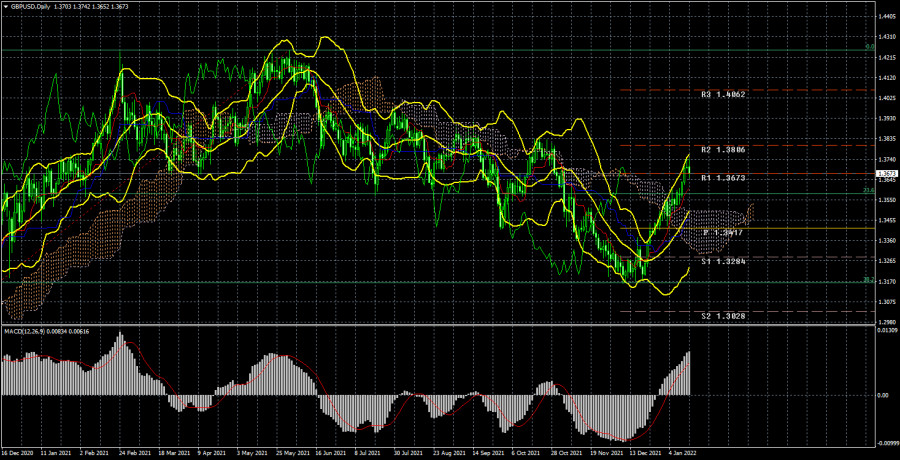
| Analysis of the trading week of January 10-14 for the GBP/USD pair. Posted: 15 Jan 2022 12:38 AM PST Long-term perspective.
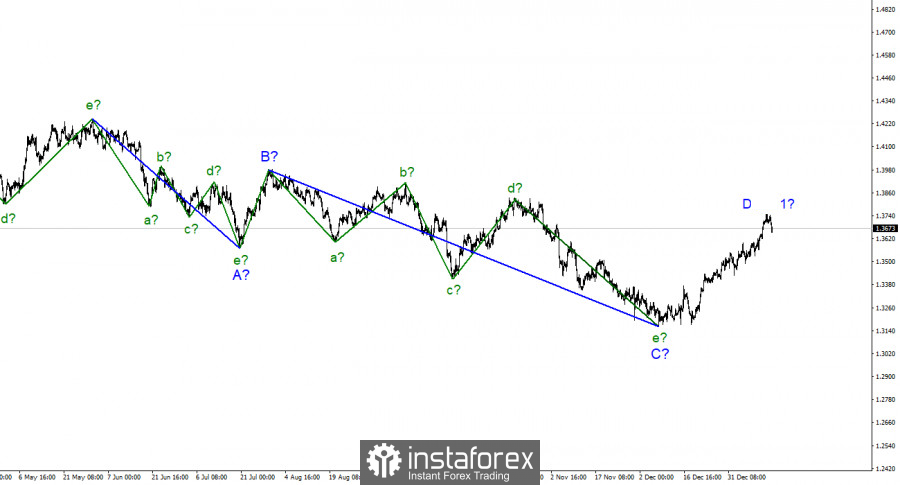
The GBP/USD currency pair has increased by another 100 points during the current week. Thus, the recoilless growth has been going on for almost a month. We have already said earlier that at first this growth could have been triggered by the decision of the Bank of England to raise the key rate. But almost a month has passed since that moment, and the pound continues to grow although no positive news is coming from the UK. However, the pound overcame the Ichimoku cloud almost seamlessly, therefore, traders are set to buy the pound/dollar pair. What can all this mean? First, it may mean a banal correction against the downward trend of 2021. On the 24-hour TF, it is visible that at the moment the price has failed to go beyond the previous local maximum. Consequently, the downward trend may persist. Second, it means that the fundamental background does not play a special role for traders now, since many significant events did not provoke the reaction that one would expect. Third, this means that in the near future the euro/dollar and pound/dollar pairs may try to "come into balance". Most of the time they move the same way, as they are influenced by strong American factors. However, in recent months they have been moving in completely different ways, although the fundamental background from the UK or the European Union is not so strong. Based on this, we believe that the pound sterling may begin to fall in the near future. At least a part of the correction, since the overall growth over the past month is already 560 points. Analysis of fundamental events. In principle, everything we said in the article on the euro/dollar is also relevant for the pound/dollar. This week, representatives of the Fed made it clear that they are not going to deviate from the planned plan to tighten monetary policy, therefore, the "hawkish" rhetoric not only persists but also intensifies. However, for most of the weeks, the pound calmly continued to grow. On Friday, when the report on retail sales in the United States failed, and a little earlier, quite good statistics were released in the UK on GDP and industrial production, the pound was falling. There was absolutely no logic. Or traders react selectively to the fundamental background. But even in this case, it is quite difficult to explain the movement of quotes from the point of view of the "foundation". At the end of this month, the Bank of England and the Fed will hold new meetings at which new important decisions can be made. Perhaps these events will bring traders back from their "parallel reality", but since the "foundation" is being ignored at the moment, more attention should be paid to the "technique". Separately, I would like to note the report on American inflation this week, which showed another acceleration of the consumer price index to 7.0% y/y. Earlier, rising inflation also supported the US currency, as it increased the likelihood of tightening the Fed's monetary policy. This week, the inflation report provoked a drop in the dollar, which once again confirms that the markets interpret the "foundation" and "macroeconomics" in their way. Trading plan for the week of January 17 - 21: 1) The pound/dollar pair has overcome the Kijun-sen and Senkou Span B lines and is now ready to form a new upward trend. Thus, at this time, it is possible to continue trading on the lower TF for an increase, but we should expect a small pullback down, which should end at least below the critical line. After that, a new round of upward movement should begin with the goals of 1.3673 and 1.3806, and maybe even higher. But for this, the pound sterling must receive fundamental support. 2) The bears have let the initiative out of their hands. Now it will be possible to consider selling the pair again no earlier than fixing the pair below the Kijun-sen line. The level of 1.3162, which is a strong Fibonacci level of 38.2%, kept the pair from falling further, so the "technique" does not imply a new strong fall in the pound in the first months of 2022. Explanations to the illustrations: Price levels of support and resistance (resistance /support), Fibonacci levels - target levels when opening purchases or sales. Take Profit levels can be placed near them. Ichimoku indicators (standard settings), Bollinger Bands (standard settings), MACD (5, 34, 5). The material has been provided by InstaForex Company - www.instaforex.com |
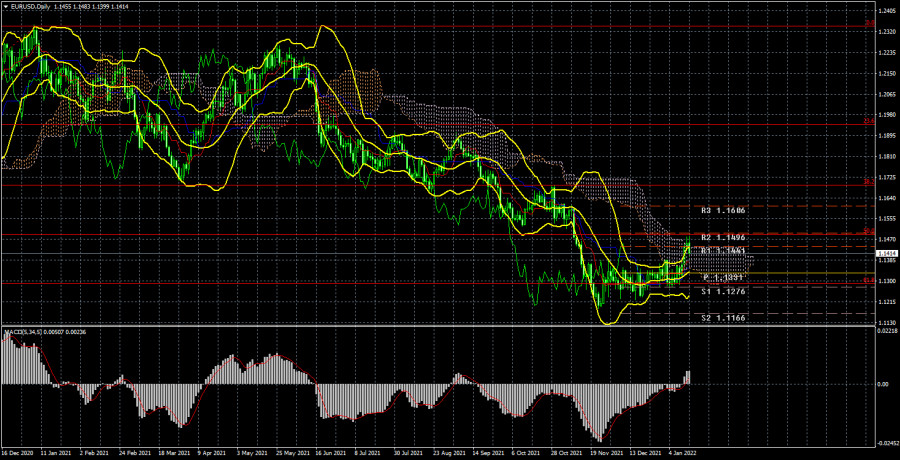
| Posted: 15 Jan 2022 12:38 AM PST Long-term perspective.
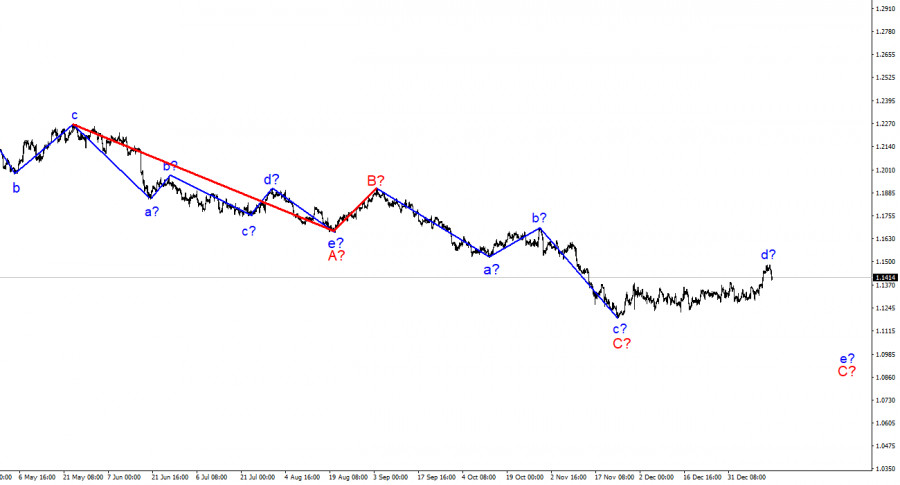
The EUR/USD currency pair has finally left the side channel during the current week after a month and a half of being in the side channel and has grown by about 100 points. Thus, at the moment, it can be concluded that the flat is completed, but the prospects of the European currency remain doubtful. At the moment, the pair has grown to the upper line of the Ichimoku cloud and failed to overcome it, bouncing off it and starting a new round of downward movement on Friday. Thus, the first attempt to start forming a new upward trend failed. We have already said earlier that a lot now depends on whether market participants have played all the factors of the dollar's growth? Recall that the main factor is the tightening of monetary policy in 2022. Traders bought up the dollar in the second half of 2021 based on expectations of the curtailment of the QE program, as well as a rate increase. But the markets are already confident that the program will be completed in March of this year, and the rate will be increased at least 3 times. Thus, these factors may no longer support the dollar. At the same time, the rhetoric of the Fed representatives is tightening every day. Initially, the Fed planned to curtail QE in June 2022, and start raising the rate even later. Now the timing has shifted due to rising inflation. And this factor may again force traders to buy the US dollar since in the European Union there is no talk of raising the rate at all and the maximum that can be counted on is the rejection of the PEPP program this year. Thus, the general fundamental background allows for the continued growth of the US currency. In any case, we do not seriously consider the growth of the euro currency until it is fixed above the Ichimoku cloud. Analysis of fundamental events. What can I say about the "foundation" in the reporting week? First, it did not have any impact on the market. Second, if it had, then the dollar would have to grow from Monday to Thursday, and on Friday it would fall. Throughout the week, FOMC members spoke, who made it clear to the market that monetary policy will be tightened as part of the fight against inflation and will do it more quickly and more strongly than previously expected. Thus, the fall of the US currency was not logical, since the tightening factor is a bullish factor for the national currency. Thus, the growth of the pair was exclusively technical. On Friday, the dollar began to rise at night and maintained this trend all day. However, the retail sales report for December in the States completely failed, and Christine Lagarde did not change the nature of her rhetoric by an inch. Therefore, there were no reasons for the dollar to grow on Friday. What is the result? The market is now in a state of search. Bulls could not move the pair up for a month and a half, and bears could not break through the 1.1230 level to continue moving down. As a result, a situation could arise in which traders tried to "take overclocking" before a new attempt to break through the level of 1.1230 while ignoring statistics and the "foundation". Trading plan for the week of January 17 - 21: 1) On the 24-hour timeframe, the pair tried to start a new upward trend, but the Senkou Span B line could not be overcome. Therefore, a new round of downward movement may begin now and the price may go below 1.1230 in the coming weeks. In any case, it doesn't make sense to talk about serious purchases below Senkou Span B. And sales can be resumed if the pair goes below the critical line. You can also try to sell a pair now but in small lots. Still, the signal of a rebound from the Ichimoku cloud can be considered strong. 2) As for purchases of the euro/dollar pair, in the current conditions, they should be considered no earlier than fixing the price above the Ichimoku cloud, because the price in 2021 overcame the Kijun-sen several times, but then could not continue moving up. There are no fundamental prerequisites for a new upward trend to begin in the near future. Explanations to the illustrations: Price levels of support and resistance (resistance /support), Fibonacci levels - target levels when opening purchases or sales. Take Profit levels can be placed near them. Ichimoku indicators (standard settings), Bollinger Bands (standard settings), MACD (5, 34, 5). Indicator 1 on the COT charts - the net position size of each category of traders. Indicator 2 on the COT charts - the net position size for the "Non-commercial" group. The material has been provided by InstaForex Company - www.instaforex.com |
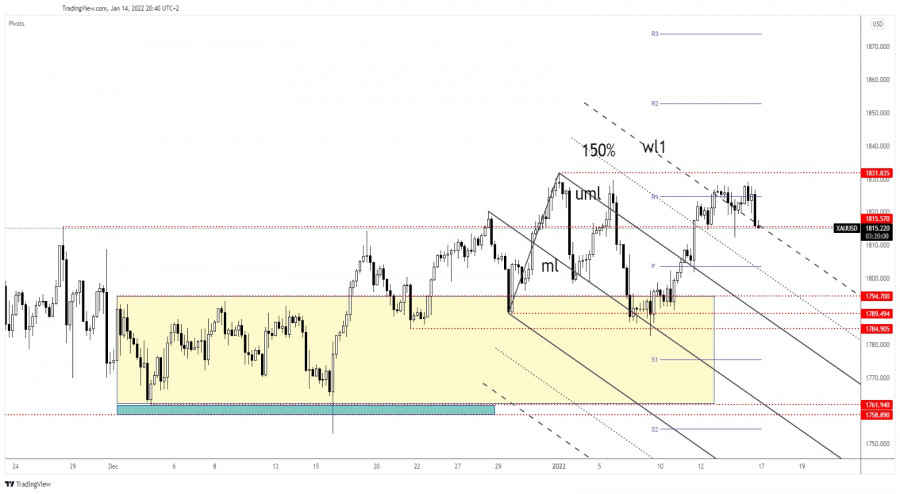
| Gold challenges 1,815.57 static support Posted: 14 Jan 2022 12:19 PM PST Gold was falling at the time of writing after failing to approach and reach the 1,831.83 resistance. The yellow metal turned to the downside as the US Dollar started to grow versus its rivals despite the fact that the US reported poor economic figures these days. As you already know from my analysis, we have a strong negative correlation between XAU/USD and DXY (Dollar Index). Surprisingly or not, Gold dropped despite the US retail sales indicators reporting a strong drop. Also, Industrial Production fell by 0.1% in December, the specialists expected a 0.2% growth. Gold registered a strong sell-off in the short term only because the Dollar Index was oversold. Still, XAU/USD's drop could be only a temporary one. XAU/USD drops as DXY rallies
As you can see on the H4 chart, Gold reached 1,815.57 static support. As long as it stays above it, the yellow metal may resume its growth. The sideways movement could represent only an accumulation before jumping higher. Technically, the rate retests the first warning line (wl1) which stands as a dynamic support. Actually, at the time of writing, XAU/USD was challenging the confluence area formed at the intersection between the warning line with the 1,815.57 level. XAU/USD predictionA valid breakdown through the confluence area may announce a larger downside movement towards the 1,800 psychological level. On the other hand, staying above this area, above the mentioned support levels, XAU/USD could start increasing again. A false breakdown with great separation or a minor consolidation could announce a bullish momentum towards 1,831.83. The material has been provided by InstaForex Company - www.instaforex.com |
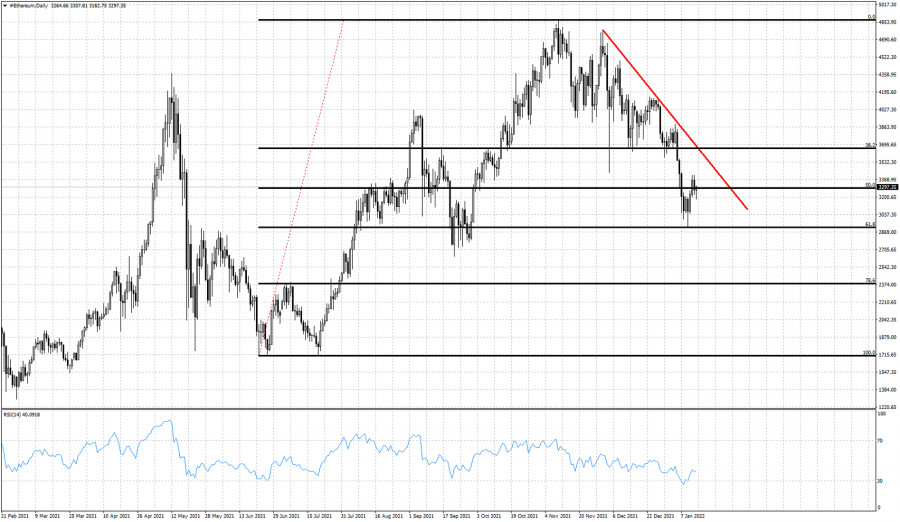
| Ethereum stops decline at key Fibonacci retracement. Posted: 14 Jan 2022 11:42 AM PST Ethereum is trading around $3,300 after making a low close to $2,920. Price has so far retraced the 61.8% of the entire rise from June lows and our pull back targets have all been achieved. There are a lot of chances of a bigger bounce towards $3,620, but for now we still consider this as a counter trend bounce.
Red line- resistance trend line Trend remains bearish in the short-term as price continues making lower lows and lower highs. The 61.8% Fibonacci retracement is key support and failure to stay above it would be a bearish sign and we should expect a deeper pull back towards the 78.6% level. The RSI is bouncing higher from oversold levels but there is no bullish divergence evident. Our primary scenario is that we see a counter trend bounce and price should continue lower. The material has been provided by InstaForex Company - www.instaforex.com |
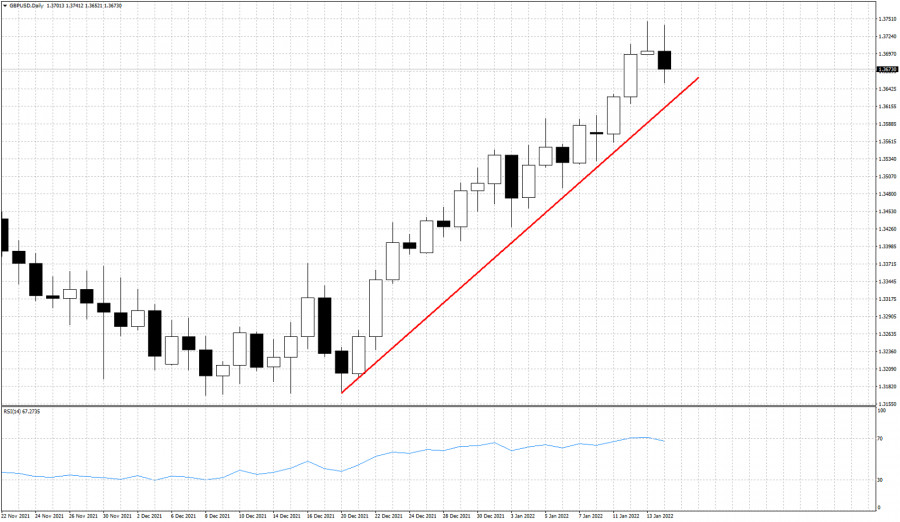
| Bearish candlestick formation in GBPUSD. Posted: 14 Jan 2022 11:34 AM PST GBPUSD has reached as high as 1.3747 yesterday and 1.3741 earlier today. Price got rejected at recent highs and is now lower than yesterday. Yesterdays candlestick pattern is a bearish hammer formation indicating increased chances of a bearish reversal.
Technically trend remains bullish as price continues making higher highs and higher lows. Price continues to respect the upward sloping support trend line, but with the RSI turning lower from overbought levels combined with a bearish hammer pattern, as we said before, at current levels we prefer to be neutral if not bearish. I believe the upside potential is very limited. The material has been provided by InstaForex Company - www.instaforex.com |
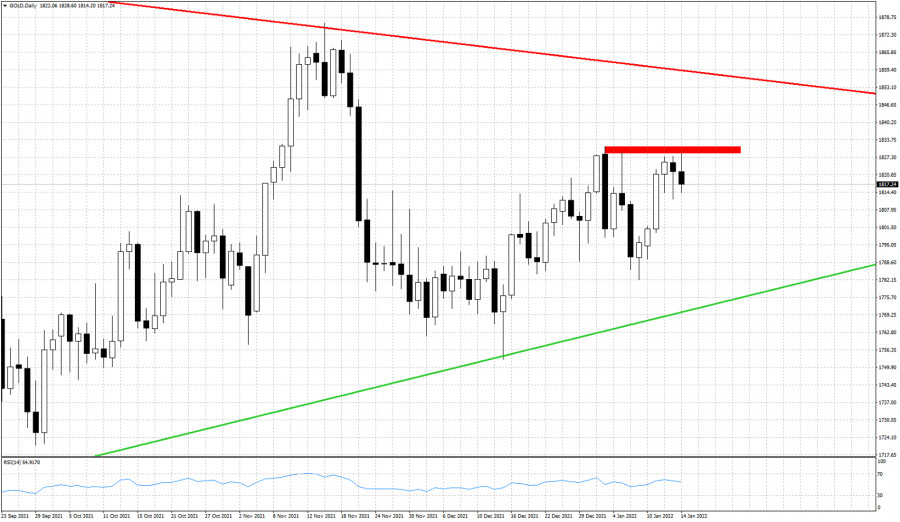
| Gold's getting rejected for the third time at $1,830. Posted: 14 Jan 2022 11:31 AM PST In order for Gold price to continue higher towards $1,860, bulls will need to break above $1,830 as we mentioned in our last analysis. Gold today tested the key horizontal resistance once again and got rejected.
Green line -support Red rectangle- short-term resistance Inability to break above $1,830 is a bearish sign. I do not expect to see a fourth rejection at $1,830. If Gold price approaches this resistance area again, I then would expect a break upwards and a move towards $1,860 at least. Until then, Gold price is vulnerable to a move lower towards $1,780 where we find key upward sloping support trend line. The material has been provided by InstaForex Company - www.instaforex.com |
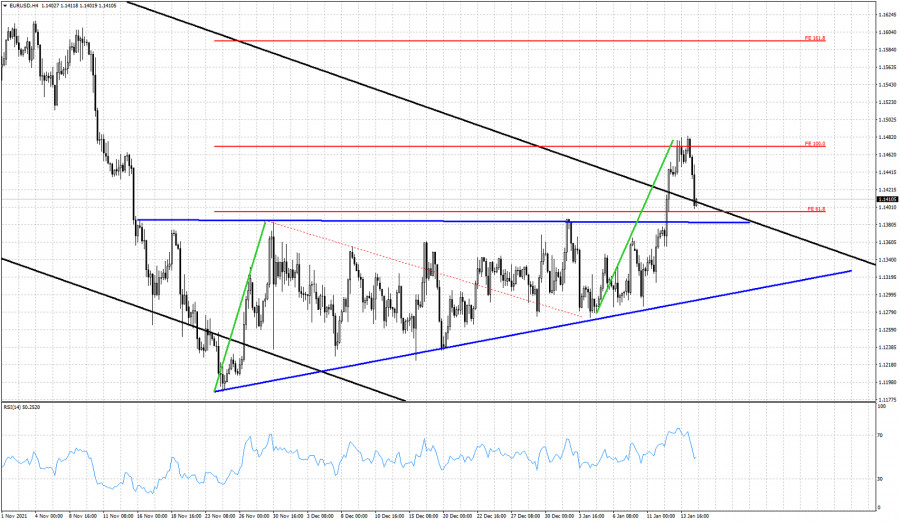
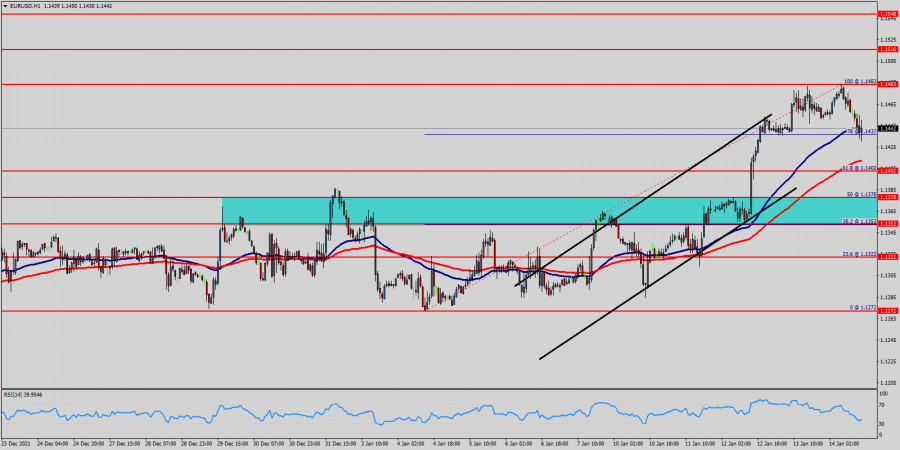
| Technical analysis on EURUSD for January 14, 2022. Posted: 14 Jan 2022 11:28 AM PST EURUSD is under pressure today. Price has managed to reach as high as 1.1483 but bulls were unable to hold it near its recent highs and bears have managed to push price towards 1.1410. In our previous analysis we warned that price has reached our Fibonacci extension target and that a pull back was to be expected. The first pull back target was the broken channel resistance as a back test.
Black lines- bearish channel Blue lines- sideways consolidation Green lines- equal size moves EURUSD is back testing the broken channel. Price is hitting the upper channel boundary from above and bulls do not want to see price break back inside the bearish channel. A bounce off the broken channel would be ideal for bulls. The 1.1390-1.14 area used to be key resistance during the sideways consolidation phase. Now it is important support. Failure to hold above this level would be a bearish sign. The material has been provided by InstaForex Company - www.instaforex.com |
| January 14, 2021 : EUR/USD daily technical review and trading opportunities. Posted: 14 Jan 2022 11:14 AM PST
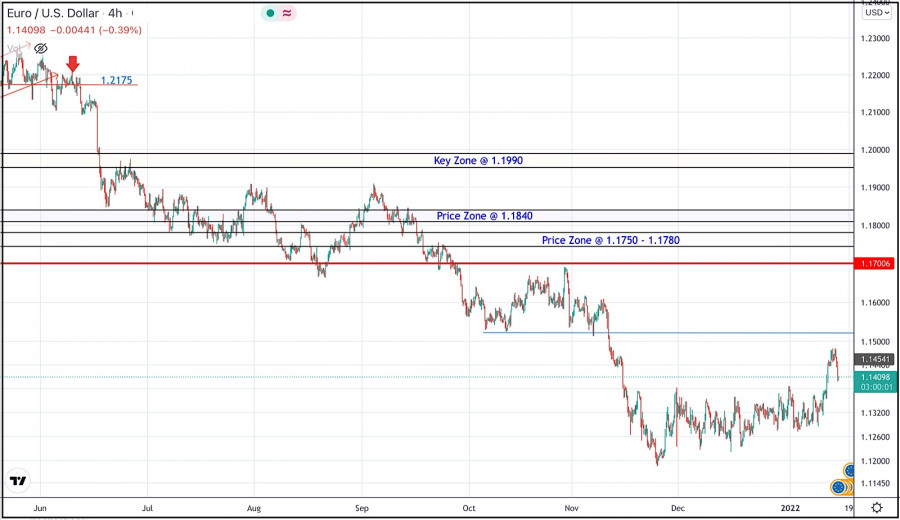
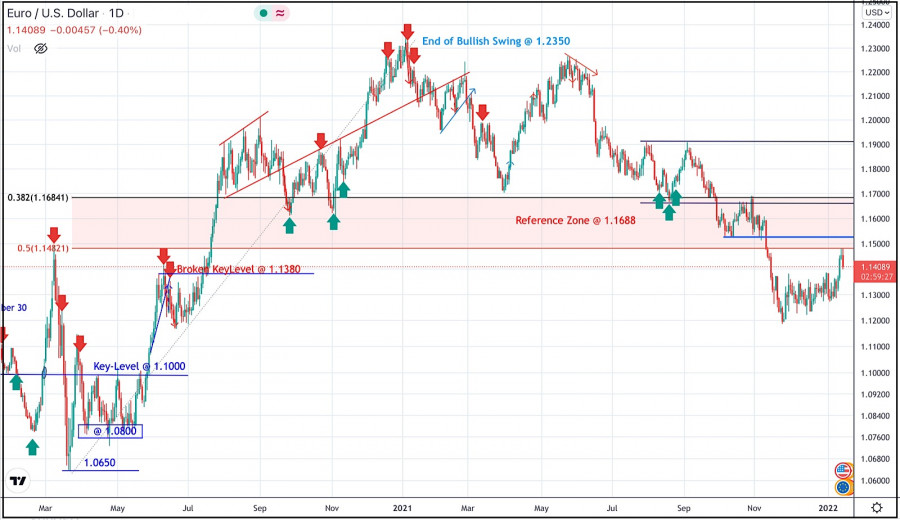
During the past few weeks, the EURUSD pair has been trapped within a consolidation range between the price levels of 1.1700 and 1.1900. In late September, Re-closure below the price level of 1.1700 has initiated another downside movement towards 1.1540. Price levels around 1.1700 managed to hold prices for a short period of time before another price decline towards 1.1200. Currently, the price zone around 1.1500 stands as a prominent supply-zone to be watched for SELLING pressure and a possible SELL Entry upon the current ascending movement. Moreover, it is not advised to add new SELL Entries around the current price levels as the pair already looks oversold. The material has been provided by InstaForex Company - www.instaforex.com |
| January 14, 2021 : EUR/USD Intraday technical analysis and trading plan. Posted: 14 Jan 2022 11:13 AM PST
The bullish swing that originated around 1.1650 in August, failed to push higher than the price level of 1.1900. That's why, another bearish pullback towards 1.1650 was executed. However, extensive bearish decline has pushed the EURUSD pair towards 1.1600 and lower levels was reached. Shortly after, significant bullish recovery has originated upon testing the price level of 1.1570. The recent bullish pullback towards 1.1650-1.1680 was expected to offer bearish rejection and a valid SELL Entry. Significant bearish decline brought the EURUSD pair again towards 1.1550 levels which stood as an Intraday Support zone. Hence, sideway movement was demonstrated until quick bearish decline occurred towards 1.1200. Please note that any bullish movement above 1.1500 should be considered as an early exit signal to offset any SELL trades. The price levels around 1.1520 remain a reference zone that needs to be re-visited when the current bearish momentum ceases to dominate. The material has been provided by InstaForex Company - www.instaforex.com |
| January 14, 2021 : GBP/USD Intraday technical analysis and significant key-levels. Posted: 14 Jan 2022 11:12 AM PST
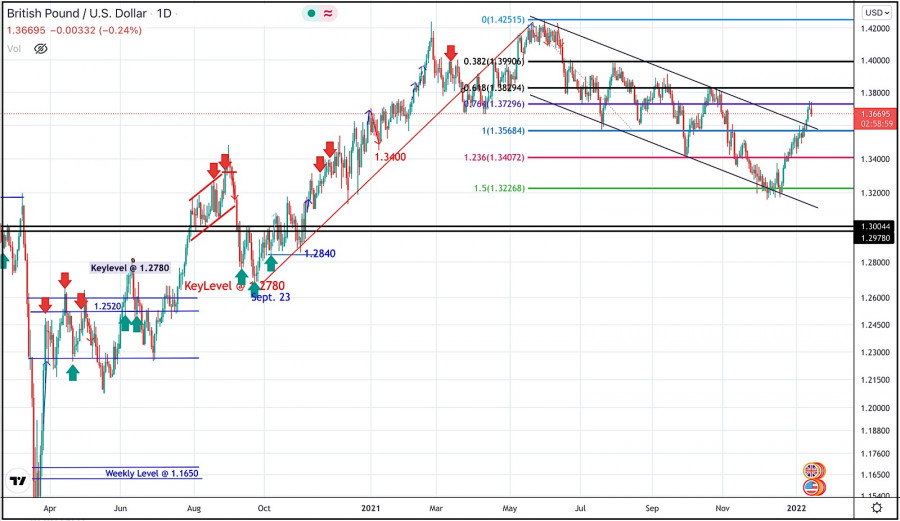
The GBPUSD pair has been moving sideways with some bearish tendency Until Bearish breakout below 1.3700 enabled quick bearish decline to occur towards 1.3400 which corresponded to 123% Fibonacci Level of the most recent bearish movement. This was a good entry level for a corrective bullish pullback towards 1.3650 and 1.3720 which was temporarily bypassed. Shortly after, the pair was testing the resistance zone around 1.3830 where bearish pressure originiated into the market. More bearish extension took place towards 1.3220 where the lower limit of the current movement channel came to meet with Fibonacci level. Conservative traders should have taken BUY trades around 1.3200 price levels as suggested in previous articles. Recent bullish breakout off the depicted bearish channel has occurred few days ago. However, BUYERS are watching the upcoming price levels of 1.3730 to have some profits off their trades. Moreover, the price level of 1.3720 stands as a key-resistance to be watched for bearish reversal if some bearish signs existed Today. On the other hand, the short-term outlook remains bullish as long as the pair maintains its movement above the depicted channel above 1.3570. On the other hand, any bearish decline below 1.3570 will probably enhance the bearish side of the market at least towards 1.3400 The material has been provided by InstaForex Company - www.instaforex.com |
| Musk says Tesla to accept dogecoin Posted: 14 Jan 2022 10:42 AM PST On Friday, Musk announced on Twitter that Tesla Inc would accept Dogecoin as payment for its products, such as the Giga Texas belt buckle and mini-model electric cars. |
| GBP/JPY new downtrend activated Posted: 14 Jan 2022 10:00 AM PST
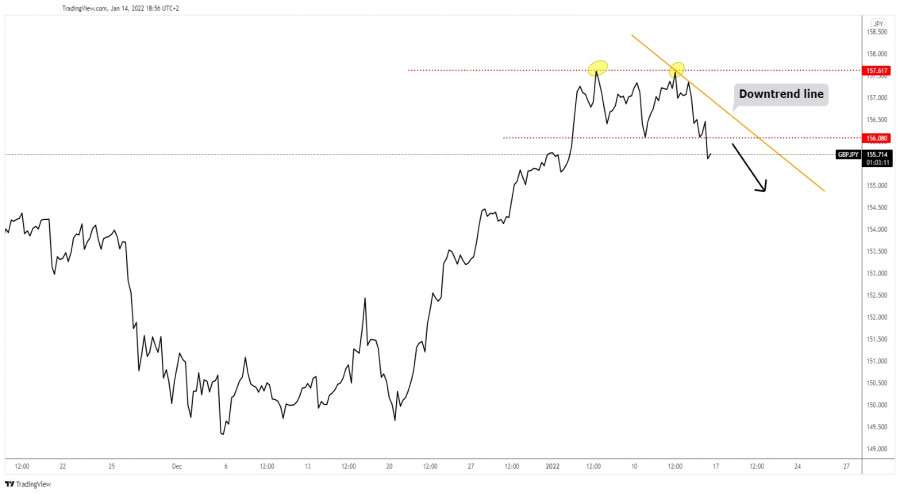
GBP/JPY downside breakoutThe GBP/USD pair found strong resistance, supply, around the 157.61 level signaling that the upwards movement is over. As you can see on the h4 chart, the pair failed to jump above 157.61 signaling exhausted buyers. Now, it has dropped below the 156.08 former low indicating strong downside pressure. Personally, I've drawn a downtrend line. As long as it stays under the downtrend line and below 156.08 former low, the GBP/USD pair could extend its downside movement. GBP/JPY trading conclusionThe current breakdown below 156.08 indicates a further drop and is seen as a potential selling opportunity. GBP/JPY could approach and reach fresh new lows as long as it stays under the downtrend line. The material has been provided by InstaForex Company - www.instaforex.com |
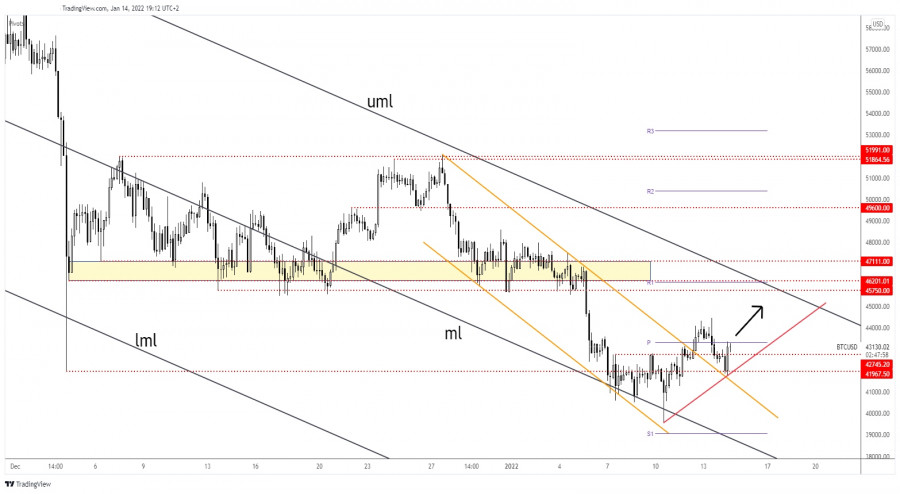
| Bitcoin confirmed its breakout Posted: 14 Jan 2022 09:58 AM PST Bitcoin rallied after reaching 41,967.50 static support. At the time of writing, it was traded at 43,123.48 level. BTC/USD registered a 3.76% growth from today's low of 41,782.21 to 43,351.50 daily high. In the short term, the bias remains bullish, the cryptocurrency could resume its rebound. In the last 24 hours, BTC/USD is up by 0.34% and by 2.69% in the last 7 days. Technically, the crypto retreated a little only to test and retest the immediate support levels before trying to jump higher. BTC/USD upside pressure
As you can see on the H4 chart, BTC/USD escaped from a down channel pattern which is seen as a bullish formation. It has dropped and retested the 41,967.50 support, developing a bullish engulfing pattern. Now, it challenges the weekly pivot point (43,331.49). Jumping and stabilizing above it may signal potential further growth. Personally, I've drawn an uptrend line, so as long as it stays above it, BTC/USD could extend its growth. BTC/USD outlookBTC/USD could extend its growth if it closes and stabilizes above the weekly pivot point of 43,331.49. In the short term, it could develop an up channel as long as it stays above the uptrend line. The 45,750 and the descending pitchfork's upper median line (uml) could be used as upside targets. Only a new lower low, a bearish closure below 41,782.21 could invalidate an upside continuation. The material has been provided by InstaForex Company - www.instaforex.com |
| EUR/USD plunges despite poor US Retail Sales Posted: 14 Jan 2022 09:57 AM PST The EUR/USD pair was dropping like a rock at the time of writing as the Dollar Index has managed to rebound. It was traded at 1.1403 far below 1.1482 today's high. In the short term, it seems unstoppable. It seems that the USD was too oversold to be able to drop deeper. The DXY reached the 61.8% retracement level and now it has turned to the upside. As you already know, the US Core Retail Sales dropped by 2.3% in December versus 0.2% growth expected, while the Retail Sales fell by 1.9%, whereas traders expected zero growth. The Industrial production, Prelim UoM Consumer Sentiment, and the Capacity Utilization Rate reported worse-than-expected figures as well. EUR/USD natural correction
As you can see on the H4 chart, the EUR/USD pair jumped above the Ascending Pitchfork's median line (ML) where it has found resistance. Failing to stay above it, the price signaled that a sell-off could develop. Now, it challenges the weekly R1 (1.1405) level, a valid breakdown may signal a further drop. The next major downside target is represented by the 1.1374 - 1.1386 area. The Ascending Pitchfork's lower median line, the immediate up-sloping line represents a dynamic support. EUR/USD predictionAfter its amazing rally, a temporary decline was somehow expected. Still, the sell-off could end around the 1.1386 - 1.1374 area. Staying above this area, registering only false breakdowns, or developing a strong bullish pattern may announce a new bullish momentum. A consolidation above this area could bring new long opportunities. On the other hand, dropping and closing below this zone may signal a deeper drop. The material has been provided by InstaForex Company - www.instaforex.com |
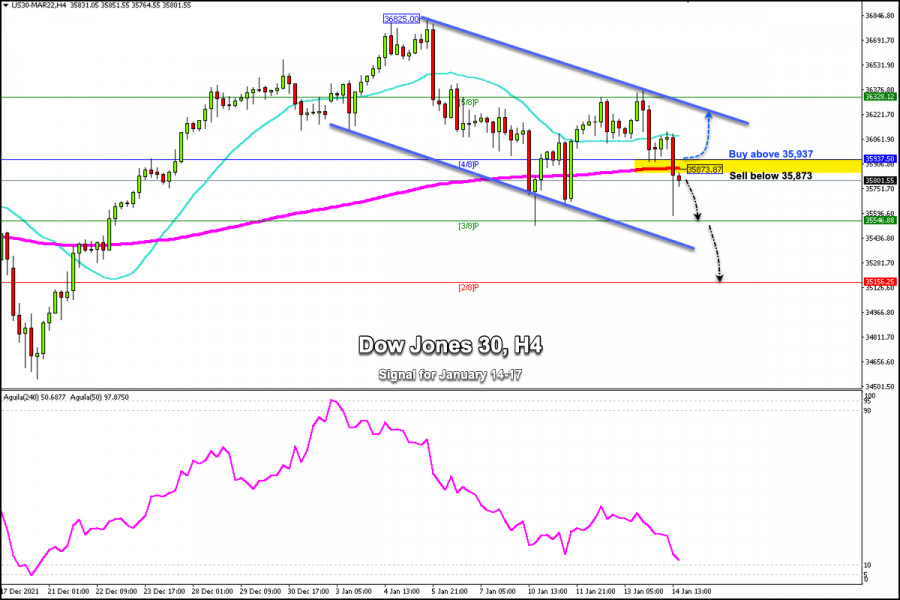
| Posted: 14 Jan 2022 08:09 AM PST
According to the 4-hour chart, the Dow Jones Industrial Average (#INDU – DJ30) is trading under bearish pressure, below the 200 EMA located at 35,873. Technological components of the industrial average with notable negative numbers were Microsoft Corporation down 4.23%. salesfore.com inc. lost 3.87% and Apple Inc shed 1.90%. The Dow Jones 30 is under downward pressure. This downtrend is likely to continue in the coming days. US bonds increased their yields due to investor uncertainty regarding the Fed's monetary policy. US Treasuries perked up earlier in the week after the Fed Chairman said the central bank would be in a position to begin a cycle of monetary tightening with several interest rates hikes this year as soon as the bond-buying program is terminated. According to the 4-hour chart, the trend of the Dow Jones is bearish as long as it remains trading below the 200 EMA. A continuation of the downward pressure is expected towards the support of 3/8 Murray located at 35,546 and down to 2/8 of Murray around 35,156. Conversely, if in the next few days, the DJ30 manages to consolidate above 4/8 Murray around 35,937, we could see a move higher towards the top of the downtrend channel at 36,220. In case of a sharp break above 5/8 Murray, the index could reach the all-time high of 36,825. If this level is broken, the price could print a new high of 37,000. The eagle indicator is giving a negative signal and supports our bearish strategy. Therefore, as long as the DJ30 trades below 35,876, we can sell with targets at 35,546 and down to 35,156. Support and Resistance Levels for January 14 - 17, 2022 Resistance (3) 36,101 Resistance (2) 35,937 Resistance (1) 35,816 ---------------------------- Support (1) 35,635 Support (2) 35,463 Support (3) 35,350 *********************************************************** Scenario Timeframe H4 Recommendation: sell below Entry Point 35,873 Take Profit 35,546 (3/8), 35,156 (2/8) Stop Loss 35,965 Murray Levels 36,328 (5/8) 35,937 (4/8) 35,546 (3/8) *********************************************************** The material has been provided by InstaForex Company - www.instaforex.com |
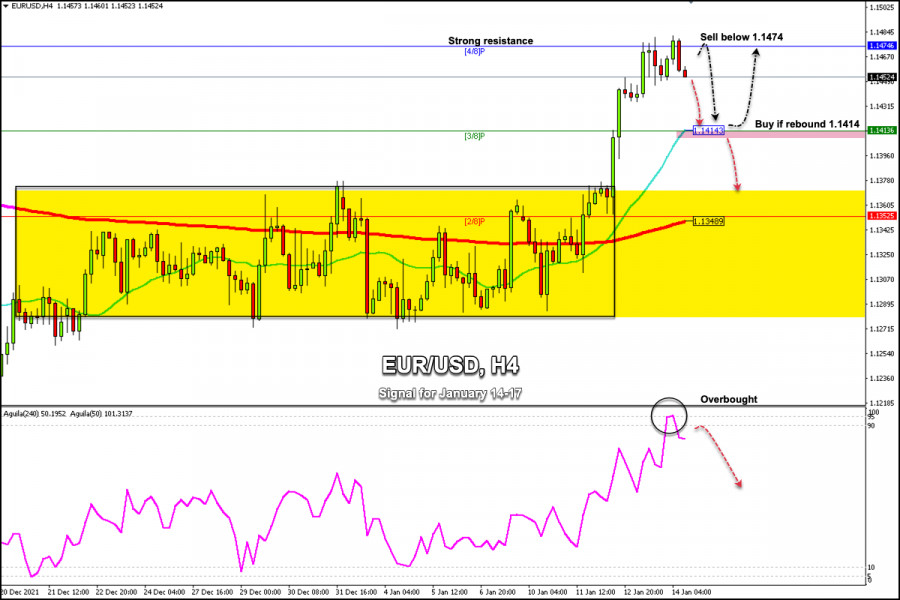
| Trading signals for EUR/USD on January 14 - 17, 2022: sell below 1.1474 (4/8 - strong resistance) Posted: 14 Jan 2022 07:14 AM PST
The euro is trading below 4/8 Murray around 1.1474, currently trading at 1.1452 with a slightly bearish bias. After having tried to break this resistance zone of 1.1474 for more than five times, according to the 4-hour chart, the euro gets exhausted and without strength. On January 12, EUR/USD managed to escape from the trading range where the pair had consolidated since December 20. EUR also managed to assert itself above the 200 EMA located at 1.1335. The outlook remains bullish for the euro as long as it remains above the 2/8 Murray (1.1352) and above the 200 EMA (1.1348). In the coming days, any correction will be seen as an opportunity to buy with targets towards the key level of 1.1500. If the euro manages to break the 21 SMA located at 1.1414, an acceleration to the downside could occur with a possible target at 1.1352 (2/8). Below this support is the 200 EMA located at 1.1348 which could offer a strong technical bounce to the Euro. So, EUR/USD could resume its uptrend. The dollar index (USDX) fell towards the support of 94.58 around 2/8 of Murray. From this level, it is bouncing and there is a possibility of the US dollar's recovery which could weaken the euro and we could see a fall in the next few days towards the SMA of 21 at 1.1414. Since December 13, the eagle indicator has been giving a signal that the euro is extremely overbought. Therefore, the euro failed to break the top of 1.1474. Now the currency pair is under the bearish pressure. It is likely that there could be a downward correction move in the coming days. Our trading plan for the next few hours is to sell below 1.1474 or at the current price levels which is now trading at 1.1452. Our first target will be 1.1414 (21 SMA) and if this level is broken at 1.1348 (200 EMA). Support and Resistance Levels for January 14 - 17, 2022 Resistance (3) 1.1502 Resistance (2) 1.1478 Resistance (1) 1.1456 ---------------------------- Support (1) 1.1432 Support (2) 1.1410 Support (3) 1.1386 *********************************************************** Scenario Timeframe H4 Recommendation: sell below Entry Point 1.1474 or currently at 1.1452 Take Profit 1.1414 (21 SMA), 1.1352 (2/8) Stop Loss 1.1512 Murray Levels 1.1474 (4/8) 1.1413 (3/8) 1.1352 (2/8) *********************************************************** The material has been provided by InstaForex Company - www.instaforex.com |
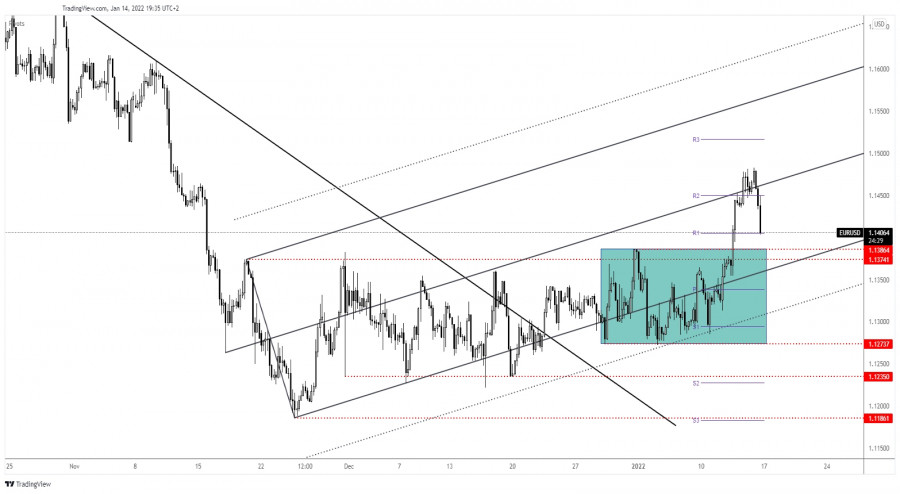
| Technical analysis of EUR/USD for January 14, 2022 Posted: 14 Jan 2022 07:05 AM PST
Forecast :
|
| EU energy bills set to push new highs in 2022 Posted: 14 Jan 2022 06:18 AM PST
On Friday morning, natural gas futures gained 10%, reaching $1,100 per 1,000 m3. Early into the European session, the price of February NYMEX natural gas futures declined to $4,182 per million Btu. European natural gas prices began to increase in spring 2021, when TTF neutral gas price index was at $250-300 per 1,000 m3. Spot prices surpassed $600 in August and $1,000 in October, eventually peaking at $2,190 on December 21, 2021, after increasing twofold during the day. Afterwards, January futures declined to $1,020 around New Year's Eve. The natural gas crunch sent prices to the highest levels since gas hubs were established in 1996, leading to record high power bills across the EU. According to Citigroup, using current forward prices, the region's total primary energy bill will come in at about $1 trillion - the highest bill over the last decade. Previous price spikes were triggered by growing oil prices. This would affect heating and power supply of all consumers, from households to industries trying to reduce their carbon emissions. The EU's gas stockpiles are at their lowest levels in 10 years. Europe's natural gas production is predicted to decline by 50% in 2040 compared to 2010, reaching 130 billion m3 and accounting for only 2.5% of the world's total supply. Currently, the EU produces about 7% of the world's natural gas. Gas production is expected to decline by 50 billion m3 in Norway, which currently produces more than half of Europe's domestic supply, and by 35 billion m3 in the Netherlands. European gas imports could rise to more than 430 billion m3 in the next 20 years, as European nations strive to shift away from coal to renewable energy sources. Natural gas remains the most suitable energy source due to low winds limiting the output of wind power plants. The material has been provided by InstaForex Company - www.instaforex.com |
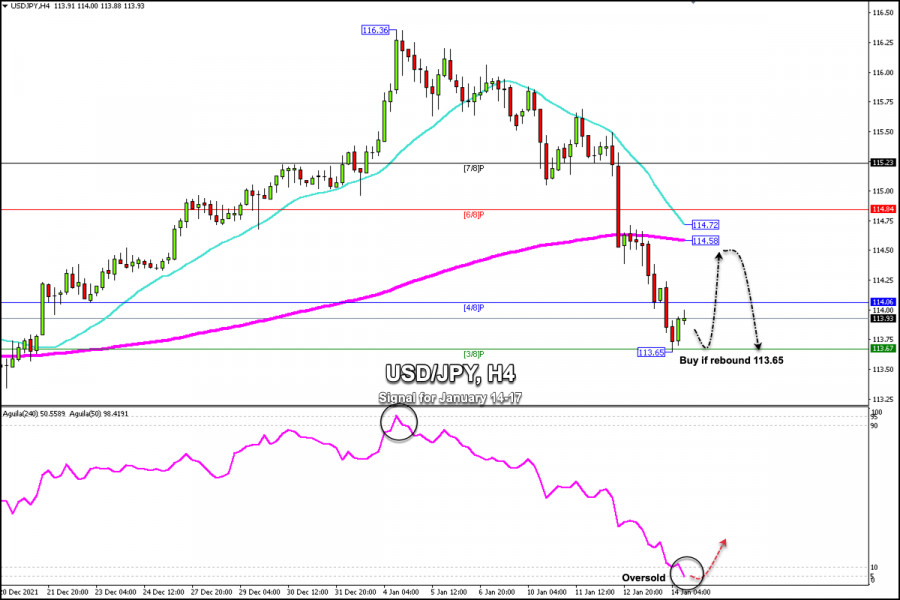
| Trading signals for USD/JPY on January 14 - 17, 2022: buy in case of rebound off around 113.65 (3/8) Posted: 14 Jan 2022 06:12 AM PST
USD/JPY fell to support 3/8 Murray around 113.65. Investors are currently flocking to safe-haven assets in the face of weak expectations from the Fed chairman and the US dollar's decline since earlier in the week. In a few hours, the US retail sales report will be published. This data is likely to support the US dollar if the result is above 0.2%. Favorable data could weaken the Japanese yen so that it will be able to bounce above 113.67 with targets towards the 200 EMA located at 114.58. USD/JPY has been in a downtrend since the 200 EMA was broken on January 12. Now the short-term outlook has turned to the downside. The yen is expected to continue to strengthen and could drop to the key level of 112.50 in the medium term. A technical bounce towards the 200 EMA located at 114.60 will give us an opportunity to sell and the downtrend could resume. If USD/JPY fails to break the 200 EMA, it could be the start of another bearish move and the price could reach the support zone between 113.65 and 112.50. The downside pressure could ease when the Japanese yen can trade back above 114.52. A daily close above this level could go looking for the 115.00 psychological level and the currency pair could climb as high as +2/8 Murray at 116.40. The eagle indicator has touched the 5-point level which represents extremely oversold market. An imminent technical bounce is likely in the next few hours which could give us a buying opportunity as long as USD/JPY remains trading above 3/8 Murray around 113.65. Our trading plan is to wait for a consolidation above 3/8 Murray to buy with targets at 114.06 (4/8) and 114.58 (200 EMA). If the yen breaks this level, we should avoid buying and wait for a consolidation of the next support level around 113.28. Support and Resistance Levels for January 14 - 17, 2022 Resistance (3) 114.28 Resistance (2) 114.06 Resistance (1) 113.87 ---------------------------- Support (1) 113.47 Support (2) 113.28 Support (3) 112.89 *********************************************************** Scenario Timeframe H4 Recommendation: buy in case of rebound Entry Point 113.65 Take Profit 114.06 (4/8), 114.58 (200 EMA) Stop Loss 113.20 Murray Levels 113.67 (3/8) 114.06 (4/8) 114.84 (6/8) 115.23 (7/8) *********************************************************** The material has been provided by InstaForex Company - www.instaforex.com |
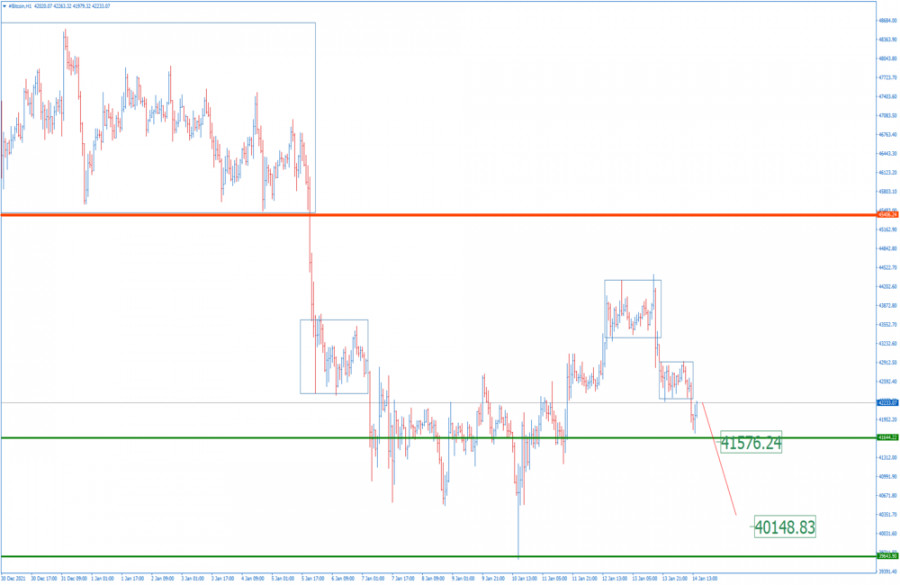
| BTC analysis for January 14,.2022 - Downside breakout of consolidation Posted: 14 Jan 2022 05:28 AM PST Technical analysis:
BTC has been trading downside today and I see potential for further downside continuation. Trading recommendation: Due to the breakout consolidation to the downside, I see potential for further downside continuation. Watch for selling opportunities on the rallies with the downside objectives at $41,575 and $40,150 Key resistance is set at $42,900 The material has been provided by InstaForex Company - www.instaforex.com |
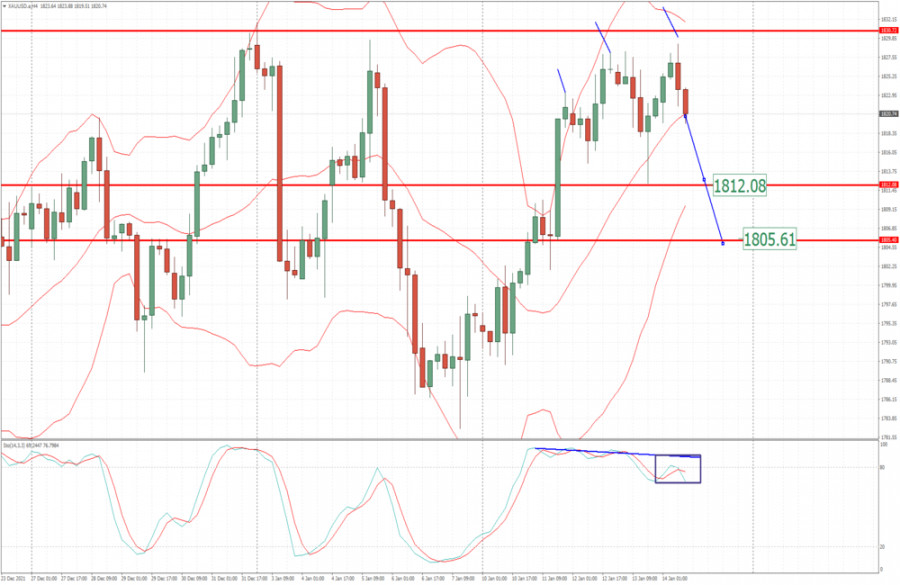
| Analysis of Gold for January 14,.2022 - Potential for the breakout or downside rotaion Posted: 14 Jan 2022 05:22 AM PST Technical analysis:
Gold has been trading inside of the trading range at the price of $1,821. Watch for potential breakout. So far, I found 3 pushes higher but bulding divergence, which gives more odds for downside rotation. Trading recommendation: Watch for potential downside rotation towards pivot supports at $1,812 and $1,805 Stochastic is showing fresh bear cross and 3 pushes higher, which is another sign for the downside rotation. Key resistance is set at $1,831 The material has been provided by InstaForex Company - www.instaforex.com |
| Visa to test its cryptocurrency services Posted: 14 Jan 2022 05:20 AM PST
On Thursday, Visa Inc joined its rival Mastercard Inc., offering central banks a chance to test retail applications for the digital currencies they will issue This spring, the card-payment provider will start a pilot program with ConsenSys Inc, a blockchain software company, after discussions with about 30 central banks whose goals involve government-backed digital currencies. Governments around the world are exploring the possibility of central bank digital currencies, CBDC amid concerns that fast-growing cryptocurrencies could destabilize financial markets or even replace fiat currencies. Cuy Sheffield, Visa's head of crypto said: "We think that stablecoins and CBDCs will coexist in the future, and there'll be a number of different approaches to creating products based on that." Payment service providers likely see government-backed digital assets as a safe and secure method to use blockchain, which should be faster and more efficient than traditional electronic transactions. Mastercard launched a similar CBDC testing platform in 2020. Besides, Visa is working with more than 60 crypto platforms to issue cards linked to digital currencies, such as USD Coin, a stablecoin issued by a consortium that includes Circle Internet Financial Inc. Nigeria and the Bahamas are among the few countries already circulating CBDCs. Moreover, China is testing a digital yuan in several cities before planning to use it at the Beijing Winter Olympics. ConsenSys, which is being led by Ethereum co-founder Joseph Lubin, has worked with several central banks to test CBDC, including the Hong Kong Monetary Authority, the Reserve Bank of Australia and the Bank of Thailand. The US Federal Reserve is expected to release a report evaluating the government-backed virtual currency in the coming weeks. The material has been provided by InstaForex Company - www.instaforex.com |
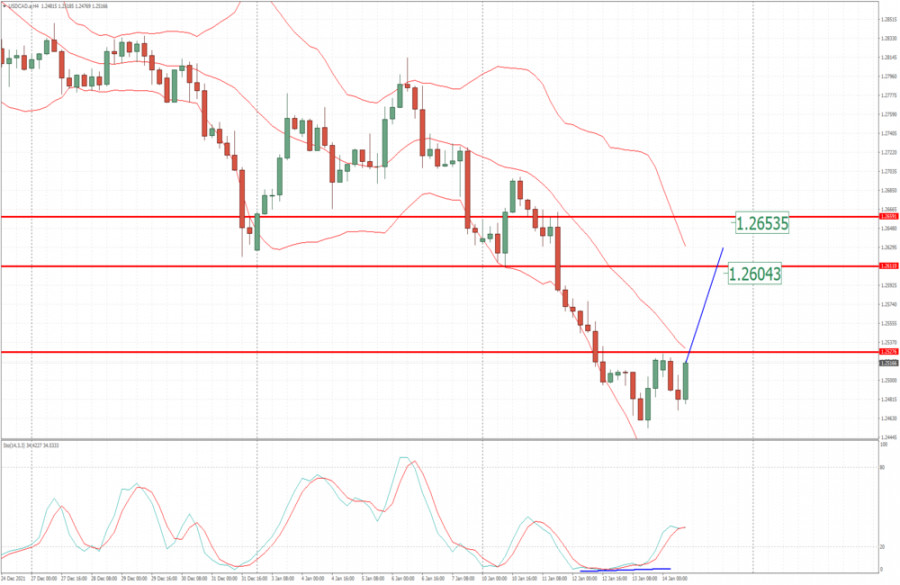
| USD/CAD analysis for January 14, 2022 - Potential for bigger upside movement Posted: 14 Jan 2022 05:14 AM PST Technical analysis:
USD/CAD has been trading sideways at the price of 1,2517. I see potential for the upside breakout of key pivot at the price of 1,2527 and further rally. Trading recommendation: Watch for the potential breakout of key pivot resistance at 1,2527 and further rise. Upside objectives are set at the price of 1,2605 and 1,2650 Stochastic is showing fresh bull cross, which is another sign and confirmation for the upside continuation. Key support level is set at 1,2455 The material has been provided by InstaForex Company - www.instaforex.com |


| You are subscribed to email updates from Forex analysis review. To stop receiving these emails, you may unsubscribe now. | Email delivery powered by Google |
| Google, 1600 Amphitheatre Parkway, Mountain View, CA 94043, United States | |


Comments