Forex analysis review
Forex analysis review |
- Analysis of GBP/USD on January 9. Nonfarm Payrolls disappointed traders and the dollar is declining again.
- EUR/USD analysis on January 9. Contradictory Europe does not allow the euro currency to grow.
- Ray Dalio: Fiat is the worst investment in our time.
- GoldMan Sachs – $100,000 per coin, Peter Brandt – $30,000 per coin!
- GBP/USD. Preview of the new week. The pound is "aiming" for a new upward trend and is waiting for support from the GDP report.
- Preview of the new week for EUR/USD currency pair.
- Bitcoin collapse: Kazakhstan is to blame, of course.
- Will institutional investors keep Bitcoin from falling again? Strategic important level.
- Analysis of the trading week of January 3-7 for the GBP/USD pair. Nonfarm helped the pound to continue to grow.
- Analysis of the trading week of January 3-7 for the EUR/USD pair. Absolutely festive movement with a characteristic flat.
| Posted: 09 Jan 2022 05:42 AM PST
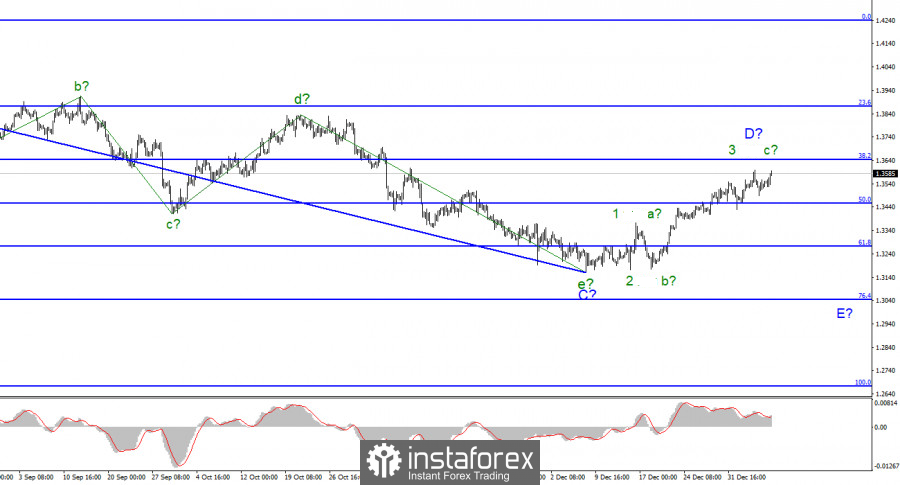
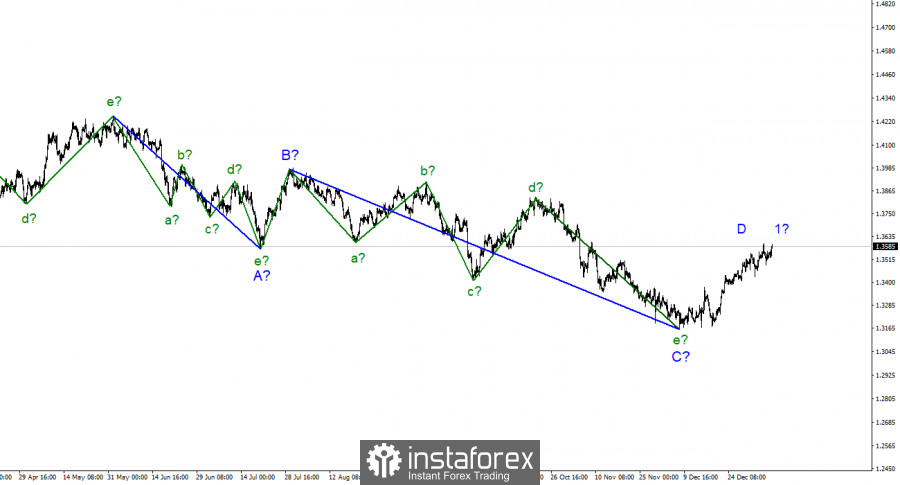
For the pound/dollar instrument, the wave markup continues to look quite convincing and acquires a more structured look. In the last few weeks, the instrument has continued to build an upward wave, which is currently interpreted as wave D of the downward trend segment. If this assumption is correct, then the decline in quotes will resume after the completion of this wave, which may happen in the near future, given the size of the corrective wave B, which is visible in the picture below. Thus, the entire downward section of the trend may take on an even more extended form. However, at the moment, the increase in the quotes of the instrument continues, and wave D can take a five-wave form. If this happens, then it will need to be recognized as an impulse, and in this case, it will no longer be able to be a corrective wave D, and the entire wave pattern will require additions. At the moment, there are still three waves visible inside it, which can be the a-b-c series. In this case, an unsuccessful attempt to break the 1.3641 mark, which corresponds to 38.2% Fibonacci, may lead to its completion. Nonfarm Payrolls are too small for the dollar to start rising. The exchange rate of the pound/dollar instrument increased by 60 basis points during January 7, and I am surprised that the amplitude of movements was so insignificant. On Friday, the news background was very strong, although nothing was interesting in the UK. Thus, the two key reports of the day are the unemployment rate in the US and the number of new jobs in the US (Nonfarm Payrolls). Strangely enough, with falling unemployment (from 4.2% to 3.9%), the number of Non-Farms turned out to be low – only 199K. The expectations of the markets were twice as high. There were also reports on changes in the number of jobs in the private sector of the economy and the manufacturing sector of the economy. But, as it is not difficult to guess, they also turned out to be worse than expected. The markets considered that the unemployment rate is a less important indicator and reacted only to Non-farms. It is for this reason that the demand for the US currency decreased in the afternoon. And given the weakness of payrolls, I expected a stronger decline in dollar quotes, but the unemployment report cooled the sellers' ardor. I also note that the report on wages in the United States turned out to be better than expected and could also delay part of the negative effect after the release of nonfarm. As a result, the dollar declined and the construction of wave D continued, which should already be completed. On Monday, I expect a new decline in demand for the instrument and a new pullback down. General conclusions. The wave pattern of the pound/dollar instrument assumes the completion of the construction of the proposed wave D in the near future. Since this wave has not yet taken a five-wave form, I expect that a new descending wave E will be built. And it should begin in the very near future. Therefore, I advise you to sell the instrument with targets located near the calculated marks of 1.3271 and 1.3043, which corresponds to 61.8% and 76.4% by Fibonacci, if a successful attempt to break through the 1.3456 mark is made. Or an unsuccessful attempt to break through the 1.3641 mark, which corresponds to 38.2% Fibonacci.
|
| EUR/USD analysis on January 9. Contradictory Europe does not allow the euro currency to grow. Posted: 09 Jan 2022 05:42 AM PST
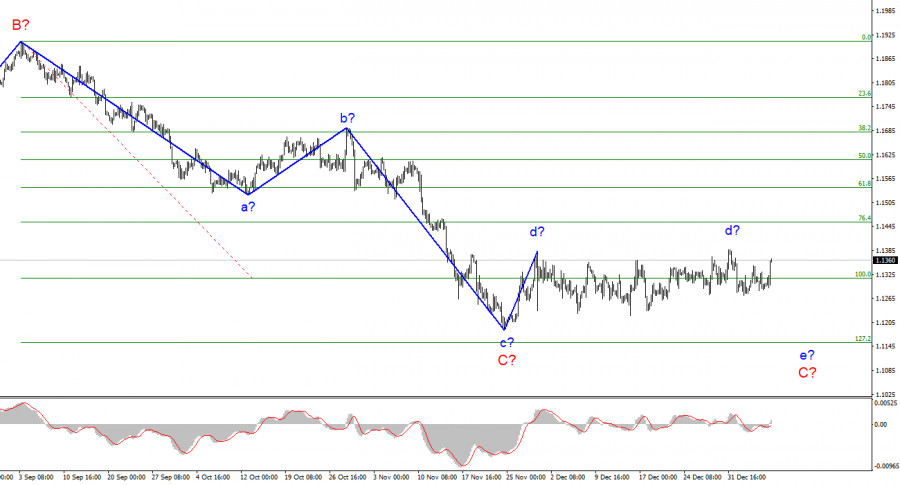
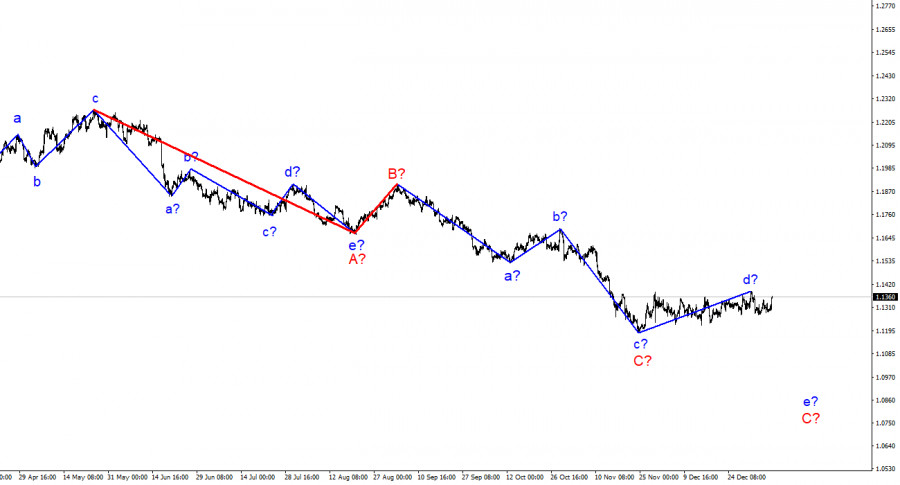
The wave marking of the 4-hour chart for the euro/dollar instrument has not changed for more than a month and after another week nothing new can be added to it. All this time, the horizontal movement continues and at the moment it is not even possible to say for sure whether the construction of the proposed wave d has been completed. The entire wave from November 24 may be both wave d, after which the construction of wave e-C will begin, and the first wave of a new upward (or corrective) trend segment, which has taken on a rather complex form. This is exactly the problem of corrective waves or trend sections. They can become more complicated and take almost any form. Even the breakthrough of the last local peak did not lead to clarity on the issue of the proposed wave d. At the moment, I am inclined to think that the construction of the downward trend section will continue – we have been seeing too uncertain an increase in quotes in recent weeks. However, in any case, the proposed wave d may take on an even more extended and complex form. Inflation in Europe continues to rise. The euro/dollar instrument rose by 70 basis points on Friday. Considering how strong the news background was this day, I am surprised that the instrument passed only 70 points and not more than twice. It is the news background that should be carefully considered since both the European Union and the United States have published reports that are important for analyzing the state of economies. Let's start with the Eurozone. The consumer price index rose from 4.9% to 5.0% y/y. It would seem that the increase is quite small, but it is still an increase in prices. It would be more correct to say: the acceleration of price growth. Inflation in the EU remains lower than in the US, where this indicator is already about 7%, but still, 5% is also a lot. The demand for the euro currency, although it did not grow (although it could), still the markets ticked this report in their heads. I also note that the basic consumer price index did not change in December, remaining at 2.6%. On the one hand, such high inflation would have to support the demand for the euro currency. The logic is simple: the higher the inflation, the sooner the ECB will move to measures to limit it. It is unlikely that the central bank will simply observe that prices are rising and do nothing. Since six months ago, the Fed and the ECB have taken a similar position on this issue, preferring to simply wait for inflation to slow down without active actions from the regulator. However, this approach has not yielded positive results. Therefore, the Fed, under market pressure, began to curtail the QE program and is preparing to raise rates. But the current state of the economy, which has already fully recovered after the crisis, allows it to do this. But things are worse in Europe, so an increase in inflation does not guarantee that the ECB will take measures to contain it, since the economy still needs financing and stimulation in order not to lose growth rates. General conclusions. Based on the analysis, I conclude that the construction of the descending wave C can be completed. However, the internal wave structure of this wave still allows the construction of another downward, internal wave. Thus, I advise selling the instrument with targets located around the 1.1152 mark until a successful attempt to break the peak of wave d occurs. A restrictive order can be placed above the peak of wave d. You can open one trade, as the MACD turns down quite often.
|
| Ray Dalio: Fiat is the worst investment in our time. Posted: 09 Jan 2022 05:42 AM PST
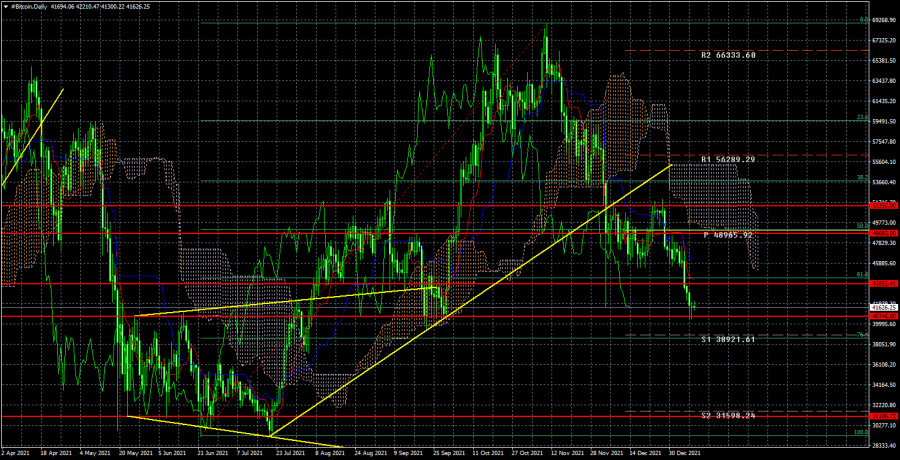
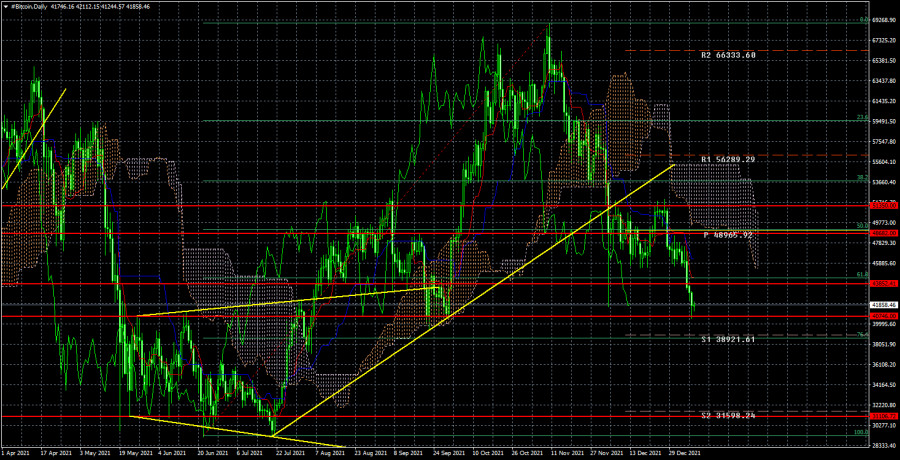
Bitcoin continues its decline and at the moment is not far from the psychological level of $ 40,000 per coin. The overcoming of the ascending trend line is visible on the 24-hour timeframe, so we believe that the decline will continue. Moreover, this week, bitcoin also managed to overcome the Fibonacci level of 61.8% - $ 44,411. Consequently, at the moment, BTC has already dropped lower than 61.8% from its last growth of almost $ 40,000. From our point of view, this fact also only increases the likelihood of a further drop in cryptocurrency. It is worth noting that recently the number of traders and investors who believe that bitcoin will continue to fall has increased. The minutes of the last Fed meeting, which was published this week, played an important role in forming this opinion. Recall that this document reflected the "hawkish" mood of the majority of members of the monetary committee, so the chances of a faster and stronger tightening of monetary policy in the United States are growing. And along with them, the "bearish" sentiment in the cryptocurrency market is growing, because no matter what anyone says, but in the last two years bitcoin has been growing due to an increase in the money supply around the world. And now, when central banks refuse to stimulate, the demand for bitcoin will not grow at such a pace. In principle, we do not see it in the coming year above the current absolute maximum. At the same time, the head and founder of the hedge fund Bridgewater Associates Ray Dalio said in an interview that cash is the worst investment in our time. Dalio noted that the leading cryptocurrencies have not only survived but have also shown impressive growth in recent years. Also, the head of the hedge fund drew attention to the fact that money has been depreciating in recent years and is doing it very quickly. Naturally, Dalio could not help but pay attention to the inflation rate in the United States, which has risen to 7% over the past year and is the highest in the last 40 years. It is because of such high inflation that Dalio considers money to be "junk", although a few years ago he considered cryptocurrencies to be "junk", predicting bitcoin's imminent demise. Thus, even such a well-known investor, we can say, admitted his wrongness and changed his mind. But will this mean that bitcoin will continue to grow over a long distance, given the tightening of regulation by central banks and governments, as well as the rejection of monetary stimulus and the decline in the dominance index?
On the 24-hour timeframe, the quotes of the "bitcoin" are fixed below the ascending trend line, so the "bullish" trend is broken. At the moment, the quotes have fallen to the level of $ 40,746, so overcoming this level will open the way to the level of $ 31,106 - the lows of 2021. Please note that bitcoin has been falling for 2 months and so far this fall is almost recoilless and very strong. This suggests that investors are getting rid of coins, and not increasing purchases in any way. The material has been provided by InstaForex Company - www.instaforex.com |
| GoldMan Sachs – $100,000 per coin, Peter Brandt – $30,000 per coin! Posted: 09 Jan 2022 05:42 AM PST
During the weekend (the cryptocurrency market is open), bitcoin failed to show a powerful movement. In principle, we can only note the second test of the $ 40,746 level, which we consider very strong and even trend-forming. In other words, if it resists the onslaught of bears, then bitcoin may return to the "bullish" trend. Maybe not for long, since the fundamental background is still not on the side of the "bitcoin", but still. If this level is overcome, then the path will be open up to the level of $ 31,100. Yesterday, we were already wondering whether institutional investors will be able to save bitcoin from falling this time? Recall that many experts on the cryptocurrency market believe that major players continue to increase their stocks of "digital gold" coins. To understand what is happening, we recommend paying attention to the period in May-July 2021, when bitcoin could not overcome just the level of $ 31,100. Buyers immediately redeemed all available coins as soon as the price approached this level. In other words, investors regard this level as very attractive for purchases. Will it be the same with the $ 40,746 level? We believe that each subsequent price rebound from this level will increase the chances that it will eventually stand. So far there have been only two tests. Goldman Sachs believes that bitcoin will grow to $ 100,000, but growth will be slow. Meanwhile, analysts at the major investment bank Goldman Sachs said that bitcoin will continue to be in demand from investors as an alternative to gold. According to the bank's representatives, bitcoin can increase its share in the savings market to 50% over the next 5 years. And if this happens, the price of the cryptocurrency will rise to $ 100,000. What is noteworthy is that Goldman Sachs indicates a clear period when this may happen, and this forecast does not contain "fiction", like "the cryptocurrency will grow to $ 100,000 within the next week." There is a clear justification for why this may happen, there is a clear deadline. From our point of view, this forecast can be trusted. At the same time, trader Peter Brandt said that in the coming months, the cryptocurrency may fall to the level of $ 30,000 per coin, where, in his opinion, the "bottom" of the correction is located. It is very important that almost none of the experts and analysts now see bitcoin below the $ 30,000 level, as they believe that investors will immediately start buying it, as it was last year. Well, we'll see. In the meantime, it should be recalled that about 90% of all possible "bitcoin" coins have already been mined. There are only about 2 million coins left, which will take at least 100 years to mine since the reward for the extracted block will constantly decrease. The next "halving" should happen in 2024.
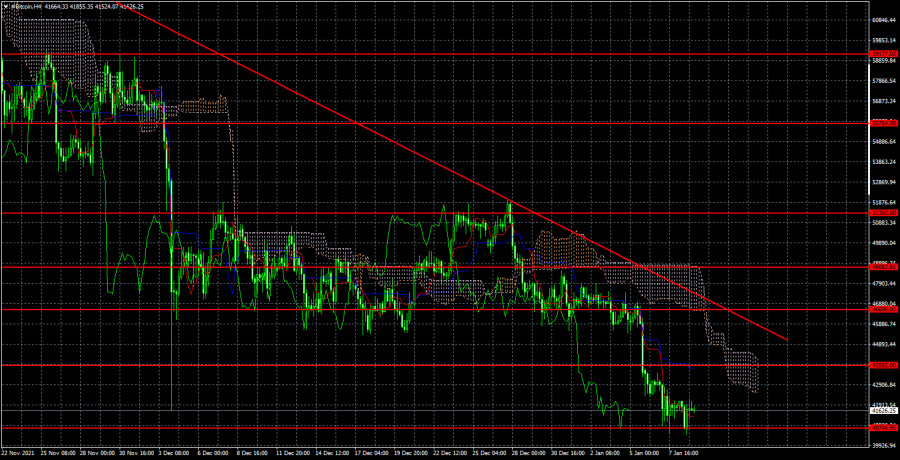
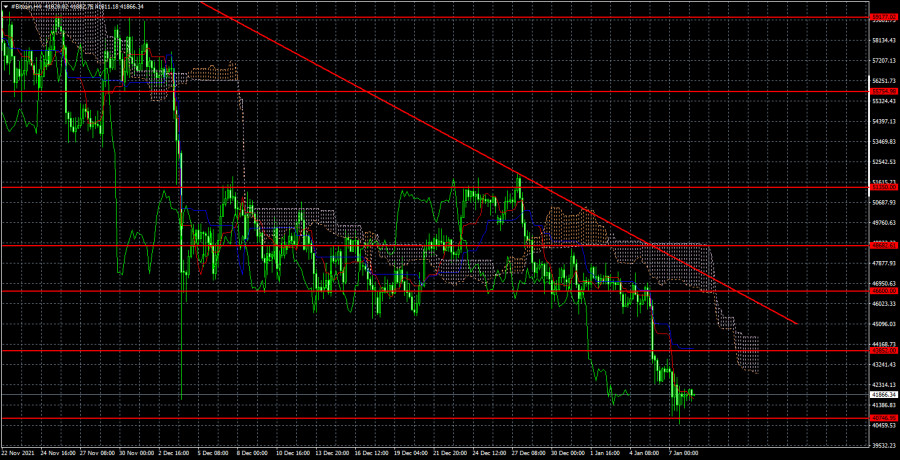
On the 4-hour timeframe, the trend remains downward (trend line). BTC quotes dropped to the important level of $ 40,746 but bounced off it twice. If the price is fixed below this level, then the path will open up to the level of $ 31,106, from which a new round of cryptocurrency growth began last summer. We believe that the probability of continued decline is very high. Institutional investors may try to defend the $ 40,746 level, but will they succeed on a bearish trend? The material has been provided by InstaForex Company - www.instaforex.com |
| Posted: 09 Jan 2022 05:42 AM PST
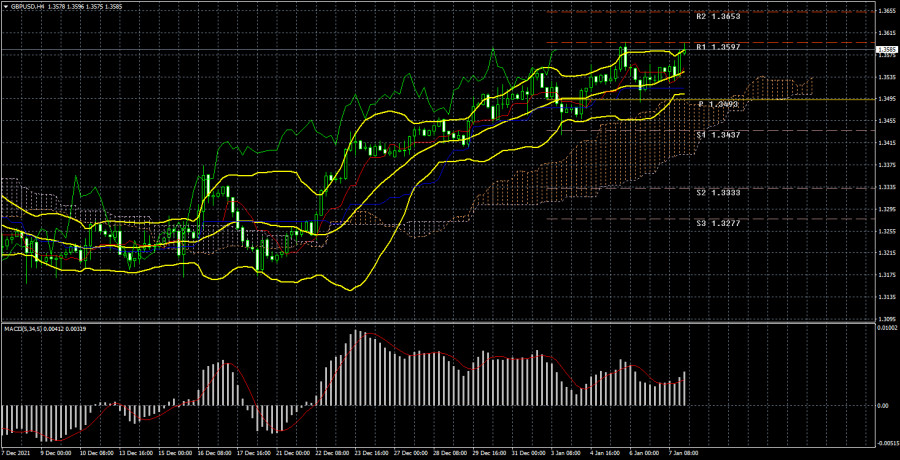
The pound/dollar continued to grow this week. It is very important that the growth of the British currency began around the same time when the Bank of England raised the key rate by 0.15%. Of course, it is now quite difficult to say when the next increase will happen, since even the December one was quite unexpected for many traders and at the same time, the quantitative stimulus program continues to operate in Britain. Nevertheless, it cannot be denied that the pound sterling received serious market support against the background of this BA decision. From our point of view, the pound may well be at the beginning of a new upward trend. We have already said earlier and once again draw attention to the fact that the price bounced from the important 38.2% Fibonacci level on the 24-hour TF. Consequently, after a slight downward correction, the upward movement may resume. The support for the "bullish" trend will be the Senkou Span B and Kijun-sen lines. In the new week, the British currency will look for support from the fundamental background. According to tradition, there will be a little of it in the UK. In the UK, they like to publish all the most important statistics on one day, and on the rest - not to provide any important information. So it will be next week. Nothing interesting is planned from Monday to Thursday. But on Friday, important reports on GDP for different periods of time, a report on industrial production and the balance of visible trade will be published. Of course, the most important data will be on GDP. According to forecasts, GDP may increase by the end of November, and this may support demand for the pound. At the same time, we believe that this report can be considered local in terms of significance. That is, it is unlikely to affect the overall mood of the market, whatever it may be. As for other news from the UK, but with the beginning of the new year, negotiations with Paris and Brussels on the "Northern Ireland protocol" with the second and on the "fish issue" and the "migration issue" with the first should resume. As before, these topics do not have any impact on the pound yet. Nevertheless, given the looming, another political crisis and the fact that many Britons are not happy with the results of Brexit, Boris Johnson's policy, the solution or absence thereof of these issues may affect the political sphere of the country. Of course, American statistics will be even more important. After all, the United States remains the country with the largest economy in the world, and the dollar has the status of a reserve currency. Hence the corresponding regalia and privileges. Two important reports and two not-so-important reports will be published in the US next week. First of all, you should pay attention to the inflation reports for December and retail trade volumes for the same month. It is expected that the consumer price index will continue to grow and will amount to 7.0-7.1%. If this forecast comes true, then the probability that the QE program in America will be completed ahead of schedule, and rates will start to rise faster, will increase. And this, in turn, is a bullish factor for the US currency. However, as we said earlier, all these factors can already be fully taken into account by the market, but the dollar can still receive local support. The retail trade report is likely to be as neutral as possible. On Friday, data on industrial production in December and the consumer sentiment index from the University of Michigan for January will also be published. We believe that the second indicator may affect the course of trading, but only if its value is very different from the previous one (70.6) or forecast (70.0). There will also be speeches by several Fed members over the next week, who are likely to be "hawkish", which may also support the US currency.
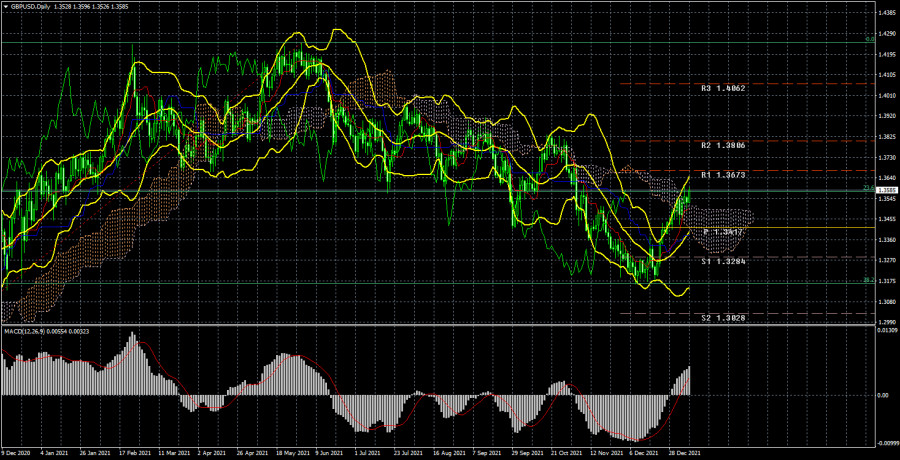
Recommendations for the GBP/USD pair: The pound/dollar pair continues its upward trend on the 4-hour timeframe, as evidenced by the Bollinger Bands and Ichimoku indicators. At the moment, the pair continues to be located above the critical line, so there is no reason to expect even a correction. Consequently, the growth of the British currency can continue with the goals of 1.3653 and 1.3757. Only if the price is fixed below Kijun-sen and/or Senkou Span B, we can expect a correction of 200 points, according to our conclusions made on the 24-hour TF. But in general, we expect the upward trend to continue globally in the next few months. Explanations to the illustrations: Price levels of support and resistance (resistance /support), Fibonacci levels - target levels that are targets when opening purchases or sales. Take Profit levels can be placed near them. Ichimoku indicators (standard settings), Bollinger Bands (standard settings), MACD (5, 34, 5). The material has been provided by InstaForex Company - www.instaforex.com |
| Preview of the new week for EUR/USD currency pair. Posted: 09 Jan 2022 05:42 AM PST
Well, the holidays are over and it's time to start working again. The euro/dollar pair spent the pre-holiday two weeks quite actively (judging by the volatility), but it was still located inside the side channel, which has approximate boundaries of 1.1230 and 1.1360. The current week has ended near the upper limit and this is the fifth or sixth attempt to leave the channel through it. As we have already said in previous articles, a slight upward bias is present for the euro/dollar pair, However, at the same time, it is not possible to extract any benefit from understanding this, since there is no trend movement. There is also little sense in the fact that the euro currency has risen by 120-130 points in a month and a half. So it turns out that the technical picture has not changed in the last month and a half, so nothing special can be said about it now. The lines of the Ichimoku indicator have practically no value since they are weak in the flat. On a 24-hour TF, the flat looks just like a temporary phenomenon, but on a 4-hour TF, the flat looks like a flat. The hope, as before, is for macroeconomic statistics and fundamental events. This hope may be justified, but we also believe that the flat can end by itself. Over the past month, there have been enough important events and reports that could help the pair get out of the side channel. Even this Friday, an important and unexpected (in its significance) Nonfarm Payrolls report was published. Thus, we believe that sooner or later the demand for one of the currencies will increase or decrease so much that the pair will leave the side channel by itself. But so far this is not happening and the illusory chances of the influence of the "foundation" remain. Therefore, we will consider all the important events of the next week. There will be very few important events in the European Union. On Monday, the unemployment rate for November will be published. According to experts' forecasts, this indicator will remain at the level of 7.3%, which is a very high value. For example, in the United States, unemployment has already fallen to 3.9%. On Tuesday, Christine Lagarde will make a speech, from which the market will expect at least some "hawkish" hints and statements. And it is unlikely to wait. On Wednesday, a report on industrial production in the EU for November will be published, the growth rate of which may decrease to 0.3-0.5% m/m. ECB Vice President Luis de Guindos will speak on Thursday. On Friday - once again Christine Lagarde. Recall that not every speech of the chairman of the central bank provokes the reaction of traders. For this reaction to take place, it is required that Lagarde make some kind of loud statement. At this time, traders can expect her to strengthen the "hawkish" mood to keep up with the Fed and the Bank of England. However, if tightening monetary policy in the United States is a reasonable step, then the European economy continues to stand on its feet "with the help of two crutches," as Lagarde herself said last year. Simply put, the completion of the PEPP program now is the maximum that can be expected from the European regulator. Moreover, if in the States we are talking about unloading the Fed's balance sheet, then the ECB will increase the standard APP stimulus program immediately after the completion of PEPP in March. Of course, in a smaller volume, but one way or another, the money will continue to flow into the EU economy. And this is still a stimulus, this is still an "ultra-deep" monetary policy. Therefore, if we talk about the prospects of the euro on the fundamental background, they remain quite weak. However, it should be remembered that the dollar has somehow become more expensive for most of 2021, so the factors that provoked its growth may have already been worked out several times by traders. After all, it's no secret that the Fed will raise the key rate two or three times this year. Consequently, this decision of the Fed, which has not yet been made, may already be embedded in the current dollar exchange rate.
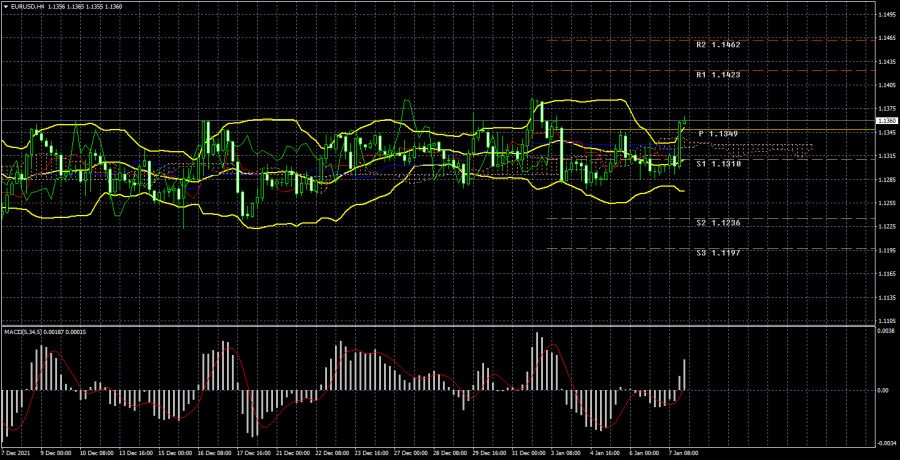
Trading recommendations for the EUR/USD pair: The technical picture of the EUR/USD pair on the 4-hour chart according to the Ichimoku strategy looks extremely eloquent. The pair is located between the levels of 1.1236 and 1.1360 and cannot leave this channel in any way. During one week, the pair may cross the Senkou Span B and Kijun-sen lines several times, since they are weak in the flat. Therefore, in the current situation, we should wait for the pair to exit the side channel. Since there is still a minimum upward slope, it is not possible to work even on a rebound from the channel boundaries. They're too blurry. Explanations to the illustrations: Price levels of support and resistance (resistance /support), Fibonacci levels - target levels when opening purchases or sales. Take Profit levels can be placed near them. Ichimoku indicators (standard settings), Bollinger Bands (standard settings), MACD (5, 34, 5). The material has been provided by InstaForex Company - www.instaforex.com |
| Bitcoin collapse: Kazakhstan is to blame, of course. Posted: 08 Jan 2022 09:16 AM PST
Bitcoin continues its decline, which began on November 10, when the quotes updated their absolute maximum near the level of $ 69,000. As you can see, none of the forecasts predicting the cost of bitcoin of $ 100,000 (and there were hundreds of such in 2021) did not come true. Admittedly, there has been little really serious fundamental background in recent months. By and large, bitcoin began to fall around the time when the Fed announced the beginning of the curtailment of the quantitative stimulus program. At the beginning of the new year, Kazakhstan "finished off" the cryptocurrency, in which civil unrest began, which forced the country's government to restrict the use of the Internet in the country. In a country whose mining share is 18% of the global total. Interestingly, a certain part of Chinese miners fled from repression to neighboring Kazakhstan. Thus, approximately 15-20% of the mining capacities located in Kazakhstan were disconnected from the network at the beginning of 2021. The hashrate of the network immediately collapsed and with it the price of bitcoin. As you can see, the "bitcoin" remains extremely dependent on the fundamental background. If in the case of any currency, we are talking about a change in the exchange rate by a couple of percent due to a negative or positive background, then in the case of bitcoin, the change can be 10-20% within a short period. Some experts immediately changed their forecast, allowing bitcoin to fall even more. For example, Mike Novogratz, the head of Galaxy Digital, believes that the first cryptocurrency can now sink to $ 38,000. Bitcoin is losing its dominance index. In addition, bitcoin is no longer considered by all investors as the best cryptocurrency for investment. Since December last year, the bitcoin dominance index has only been declining. For example: in February 2017, the bitcoin dominance index was 95%. In October last year – about 50%. Now the index has fallen to 40%. This means that investors' interest in altcoins is growing. Simply put, "we are not united by bitcoin." Every day new cryptocurrencies appear, those that appeared immediately after bitcoin are developing. Naturally, investors are starting to pay attention to Ethereum or Litecoin, which pull back some of the cash flows. Thus, the global fundamental background for "bitcoin" is not the best right now and it is not yet clear how it can improve.
On the 24-hour timeframe, the quotes of the "bitcoin" are fixed below the ascending trend line, so the "bullish" trend is broken. At the moment, the quotes have fallen to the level of $ 40,746, so overcoming this level will open the way to the level of $ 31,106 - the lows of 2021. Please note that bitcoin has been falling for 2 months and so far this fall is almost recoilless and very strong. This suggests that investors are getting rid of coins, and not increasing purchases in any way. The material has been provided by InstaForex Company - www.instaforex.com |
| Will institutional investors keep Bitcoin from falling again? Strategic important level. Posted: 08 Jan 2022 09:16 AM PST
In the first week of the new year, bitcoin fell by another $ 6,000. If you look at the long-term chart, there is nothing surprising in this, since the long-term ascending trend line has been overcome. Thus, the "bullish" trend is broken. We have been expecting such a scenario for a long time, but all the time bitcoin has been held at the expense of new, large and institutional investors. However, despite the fact that many experts still believe that bitcoin will grow no matter what, and the "digital gold" is the future of finance, we remind you that bitcoin lost up to 80-90% of its value every time after the completion of the "bullish" trend. Of course, it is impossible to compare what was with cryptocurrency 5-6 years ago with what is now. A lot has changed in such a long time: a pandemic has emerged, central banks around the world have poured hundreds of billions of dollars into stimulating the economy, the money supply has grown, and the pandemic is not over yet. To some extent, we believe that the growth of "bitcoin" in the last 2 years is accidental. If there had been no pandemic, there probably would have been no growth, since there would have been no huge monetary incentives. Nevertheless, the fact that BTC is growing does not mean that it will grow forever now, but it cannot fall in principle. The Fed is against Bitcoin. At the end of last year, we repeatedly drew the attention of traders to the fact that the US Federal Reserve is slowly taking the path of tightening monetary policy. We said that in the last two years bitcoin had wonderful conditions, as there was more and more money in the economy, and the rates were ultra-low, which forced investors to look for riskier and more profitable investment tools with rising inflation (or expectations of rising inflation). Now the situation is changing in the opposite direction. The Fed may completely abandon the stimulus as early as March 2022. This will mean that money from "nowhere" will no longer flow into the economy. Accordingly, cash flows to the cryptocurrency market will decrease. Consequently, demand will not grow. Further, starting in March, the Fed may begin to raise the key rate, which will mean an increase in the profitability of other less risky assets. Sooner or later, the Fed will start unloading its balance sheet. Simply put, to withdraw excess money from the economy by selling treasury and mortgage bonds. Accordingly, investors will have less money on their hands. Inflation will begin to decline sooner or later, as regulators around the world do not allow it to be at the level of 5-7%. And bitcoin has recently been called an "inflation hedging tool". Accordingly, if inflation falls, then many investors will no longer need to buy the first cryptocurrency. All this, from our point of view, will reduce the demand for "bitcoin" in the long term. Moreover, we all see a tendency to tighten regulation of the circulation of cryptocurrencies and other digital assets. Taxes will be raised and controls will be tightened. All this makes bitcoin, with its ultra-volatility and increased risks, far from the most attractive tool.
The trend on the 4-hour timeframe is downward again. BTC quotes dropped to the important level of $ 40,746, which is the minimum from September 22 and 29. If the price is fixed below this level, then the path will be open up to the level of $ 31,106, from which a new round of cryptocurrency growth began this summer. We believe that the probability of continued decline is very high. Institutional investors may try to defend the $40,746 level, but will they succeed in a bearish trend? The material has been provided by InstaForex Company - www.instaforex.com |
| Posted: 08 Jan 2022 12:48 AM PST Long-term perspective.
The GBP/USD currency pair has grown by only 50 points during the current week, but the main thing is that it has maintained an upward trend. On a 24-hour timeframe, this growth of the British currency still looks like a correction against the downward trend of 2021, but during the first week of the new year, the pair managed to gain a foothold above the Ichimoku cloud. And this is also very important. If you look at all the bulls' attempts over the past year to overcome the Ichimoku cloud, you can see that they always ended in failures. Thus, now, for the first time in the last 12-13 months, there is a real opportunity to start forming a new uptrend. We have already said earlier that we expect a movement of 400-500 points up since this is exactly the nature of the movement (with deep corrections) that was observed all last year. At the moment, the pair has moved away from the last local minimum by 430 points. We also said earlier that the pound is now more likely to grow against the dollar than the euro. First, during 2020, the pound grew much stronger than the euro. Second, during 2021, the pound fell much weaker than the euro. Third, the Bank of England raised its key rate in December, showing its intentions to embark on the path of tightening monetary policy. And this is a strong fundamental support factor for the British currency. Thus, we believe that now the pound has a real chance of forming a new upward trend. Analysis of fundamental events. There were practically no important publications and events in the UK this week. It is possible to note only the indices of business activity in the service and manufacturing sectors, which in general turned out to be stronger than experts predicted. It is important that these reports were for December, that is, the omicron pandemic did not have a devastating impact on business activity. So we can assume that the British economy will show a not too strong slowdown in the fourth quarter. And this is again a factor in supporting demand for the pound. Also this week, business activity indices in the United States were published, which generally deteriorated slightly in December compared to the previous month. On the other hand, the ADP report showed an increase in the number of employees in the private sector by as much as 800 thousand, with a forecast of +400 thousand. However, the market cheerfully ignored this report. The Fed minutes on Wednesday showed that the regulator may start raising rates earlier and do it more often in 2022 than previously expected. Most members of the monetary committee support such a plan for the current year. Also, talk is slowly beginning about unloading the Fed's balance sheet, which has grown to $8.7 trillion during the pandemic. Now the Fed can start selling securities, thus withdrawing excess liquidity from the economy. This should also have a positive impact on inflation and the dollar exchange rate. These factors will have to support the US currency, but, as we said earlier, they can already be taken into account by the market, since all the second half of the year-2021 traders were tuning in to this development. Separately, it should be said about the unemployment rate has already fallen to 3.9% in the United States. The pandemic level is 3.4-3.5%. Thus, we can even conclude that the labor market has almost completely recovered, but at the same time, the Nonfarm index is of greater importance, which for the second month in a row turns out to be weaker than forecasts. Trading plan for the week of January 10-14: 1) The pound/dollar pair has overcome the Kijun-sen and Senkou Span B lines and is now ready to form a new upward trend. Thus, at this time, it is possible to continue trading on the lower TF for an increase, but we should expect a small pullback down, which should end at least below the critical line. After that, a new round of upward movement should begin with the goals of 1.3673 and 1.3806, and maybe even higher. 2) The bears have let the initiative out of their hands. Now it will be possible to consider selling the pair again no earlier than fixing the pair below the Kijun-sen line. The level of 1.3162, which is a strong Fibonacci level of 38.2%, kept the pair from falling further, so the "technique" does not imply a new strong fall in the pound in the first months of 2022. Explanations to the illustrations: Price levels of support and resistance (resistance /support), Fibonacci levels – target levels when opening purchases or sales. Take Profit levels can be placed near them. Ichimoku indicators (standard settings), Bollinger Bands (standard settings), MACD (5, 34, 5). The material has been provided by InstaForex Company - www.instaforex.com |
| Posted: 08 Jan 2022 12:04 AM PST Long-term perspective.
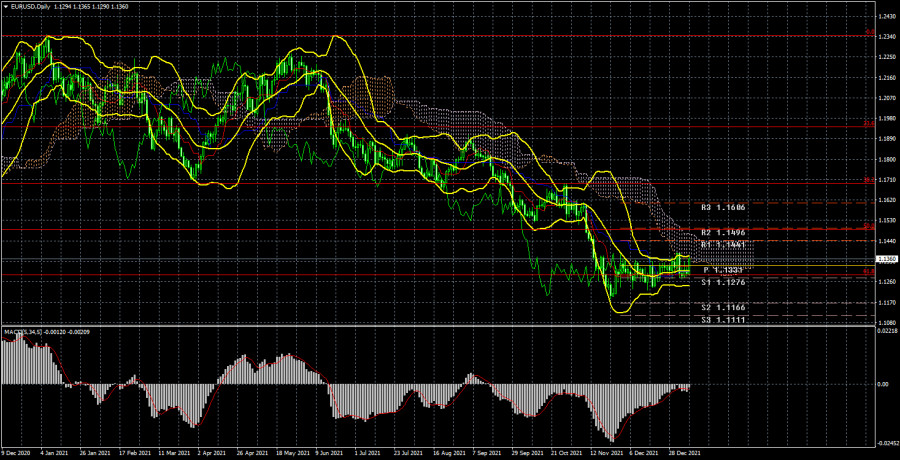
During the current week, the EUR/USD currency pair continued to remain inside the side channel, which it has been for more than a month. And the current week, which became the first in the new year, was not an exception or a week of "big changes". In other words, traders again failed to withdraw the pair from the side channel, the boundaries of which run approximately along with the levels of 1.1230 and 1.1350. The pair ended the week near the upper limit of this channel, as on Friday the American statistics again disappointed traders. However, this will be discussed a little later. So far, I would like to say that the minimum upward slope is still present. We have already said that this minimum bias can be expressed by 120 points of growth of the European currency in a month and a half. As we can see, this upward trend has a purely formal appearance and essence. Naturally, it is still very difficult to trade a pair in a flat environment. Complicating the situation is the fact that the lateral channel has no clear boundaries. Twice this week, the pair tried to get out of it through the upper boundary and twice failed. Thus, the most important conclusion is that the pair is in a very limited range and there is even no difference whether there is an upward slope at this time or the movement is purely lateral. The flat is even better visible on the 24-hour TF than on the 4-hour TF. Bollinger bands have narrowed to a minimum. The nearest target of the current movement may be the Senkou Span B line, which runs at the level of 1.1440. However, when the pair will be able to get to this level, it is very difficult to say. In principle, now it remains only to wait for the moment when the price completes the flat, or to trade on the lowest timeframes in the hope of a trend movement within individual days. Analysis of fundamental events. What can I say about the "foundation" in the reporting week? There were few macroeconomic events, but there was something. Of course, in the first place in terms of importance and significance is the Nonfarm Payrolls report, which failed for the second time in a row. This time, the number of new jobs outside the agricultural sector amounted to 199 thousand, with a forecast of 426 thousand. Approximately the same pattern was observed a month earlier. Given the fact that omicron is currently raging all over the world, it would be foolish to think that it will have no impact on the economy and the labor market. It seems that we are now seeing the effects of a new strain. At the same time, it should be recognized that every month cannot be successful. Perhaps weak Nonfarms are only partially related to omicron. Anyway, this report still did not affect the technical picture of the pair in any way. It should also be noted that inflation in the Eurozone continues to grow and by the end of December was already 5.0% y/y, although the markets expected it to slow down to 4.8%. But, as we can see, Christine Lagarde's forecasts that inflation will begin to slow down have not yet come true in the same way as Jerome Powell's forecasts. Trading plan for the week of January 10-14: 1) On a 24-hour timeframe, the overall trend remains downward. And the movement itself in the last 5-6 weeks remains a pure flat. Thus, there are still chances for a resumption of the downward movement, but so far the markets do not find grounds to withdraw the pair from the side channel. Most likely, the markets will not even need any important event to complete the flat. There have been such events over the past month, but they have not helped in any way. Most likely, the flat will end on its own, thanks to market mechanisms. 2) As for purchases of the euro/dollar pair, in the current conditions, they should be considered no earlier than fixing the price above the Ichimoku cloud, because the price in 2021 overcame the Kijun-sen several times, but then could not continue moving up. There are no prerequisites for a new upward trend to begin in the near future yet. First of all, technical. Explanations to the illustrations: Price levels of support and resistance (resistance /support), Fibonacci levels - target levels when opening purchases or sales. Take Profit levels can be placed near them. Ichimoku indicators (standard settings), Bollinger Bands (standard settings), MACD (5, 34, 5). The material has been provided by InstaForex Company - www.instaforex.com |


| You are subscribed to email updates from Forex analysis review. To stop receiving these emails, you may unsubscribe now. | Email delivery powered by Google |
| Google, 1600 Amphitheatre Parkway, Mountain View, CA 94043, United States | |


Comments