Forex analysis review
Forex analysis review |
- Ethereum surpasses our pull back targets!
- XRPUSD breaks below key long-term support.
- Will the decline stop around $35,000 in Bitcoin?
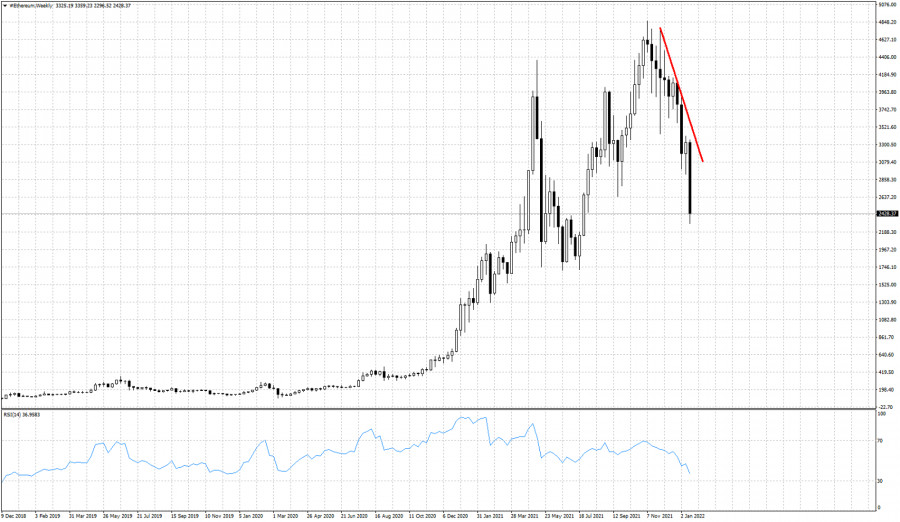
| Ethereum surpasses our pull back targets! Posted: 22 Jan 2022 08:38 AM PST Back in December when Ethereum was trading around $4,000 we warned traders that a break below the support area of $3,985 would be a bearish reversal sign. On January 5th another analysis of ours warned bulls using the Ichimoku cloud indicator when price was showing rejection signs.
On January 6th our analysis confirmed the trend change and the bearishness in Ethereum's charts as price was testing $3,300. Price is now trading around $2,500 having retraced 78.6% of the entire rise from the June - July 2021 lows. This is the last support bulls have, as a break below it will increase chances of pushing below the $1,700 lows of the summer of 2021. There is no sign of this decline stopping yet. Buying now seems like trying to catch a falling knife. Traders need to be very cautious. The material has been provided by InstaForex Company - www.instaforex.com |
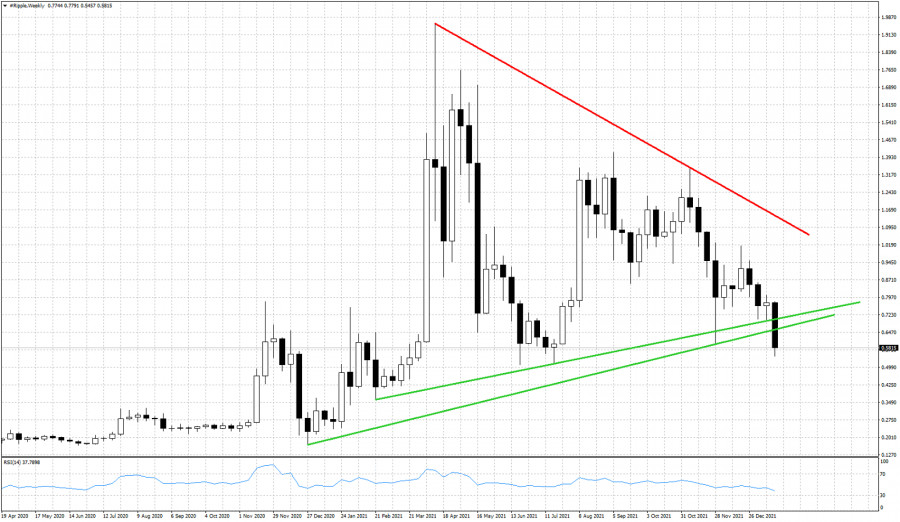
| XRPUSD breaks below key long-term support. Posted: 22 Jan 2022 08:30 AM PST XRPUSD has broken below the key long-term support at $0.65. XRPUSD not only has the SEC lawsuit as a major burden, it's price behavior is also closely tied to major cryptocurrencies like Bitcoin, thus the recent selling pressures could not leave XRP unaffected.
Green lines - support trend lines On a weekly basis price is about to break below the key upward sloping green support trend lines. XRP is approaching the June - July lows around $0.50. This is the last support level until $0.35. Even in the Daily chart the RSI is not providing any bullish divergence. Technically XRP should continue lower with bounces higher on the way to form lower highs. It is clear that bears remain in control of the trend in XRP. There is no sign of a reversal, on the contrary, currently it looks more probable for price to break next support level. The material has been provided by InstaForex Company - www.instaforex.com |
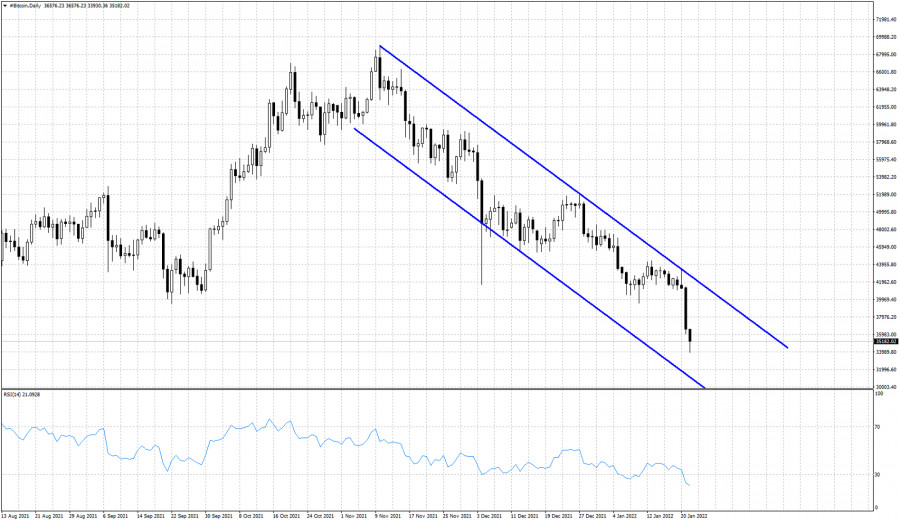
| Will the decline stop around $35,000 in Bitcoin? Posted: 22 Jan 2022 08:24 AM PST Bitcoin and most cryptocurrencies are under selling pressures the last two days. Price is making new lower lows towards $35,000 and the next major support we find now is at the June-July lows just above $29,000.
Bitcoin has broken all major Fibonacci retracement levels. The RSI is making new lower lows in the Daily chart. There is no bullish divergence. A bounce towards $40,000 is justified as we are currently at oversold short-term levels. However price remains inside the downward sloping channel as we see in the Daily chart above. In order to call a low is in, we should at least see price exit the bearish channel. Until then, bears remain in control of the short-term trend. The material has been provided by InstaForex Company - www.instaforex.com |
| You are subscribed to email updates from Forex analysis review. To stop receiving these emails, you may unsubscribe now. | Email delivery powered by Google |
| Google, 1600 Amphitheatre Parkway, Mountain View, CA 94043, United States | |


Comments