Forex analysis review
Forex analysis review |
- AUD/USD: could it make larger rebound?
- May 13, 2022 : EUR/USD daily technical review and trading opportunities.
- GBP/USD lifted by poor US data, falling wedge in play
- May 13, 2022 : EUR/USD Intraday technical analysis and trading plan.
- May 13, 2022 : GBP/USD Intraday technical analysis and significant key-levels.
- Trading Signal for GBP/USD on May 13-16, 2022: buy above 1.2207 (2/8 Murray - oversold)
- Trading Signal for GOLD (XAU/USD) on May 13-16, 2022: buy above $1,802 (strong support - oversold)
- Trading plan for Ripple on May 13, 2022
- Trading plan for Ethereum on May 12, 2022
- Bitcoin badly bruised
- Trading plan for Bitcoin on May 13, 2022
- Analysis on Bitcoin current market conditions.
- GBPUSD justifies at least a short-term bounce.
- Ichimoku cloud indicator analysis on EURUSD for May 13, 2022.
- Gold challenges major support
- Powell: soft economic landing may be challenging
- Trading plan for Silver on May 13, 2022
- Trading plan for Gold on May 13, 2022
- Technical review for WTI: prices will rise again
- Technical review for XAU/USD: there is a chance for growth, but it will be limited
- US premarket on May 13: stock market recovering and Twitter dropping by 20%
- XAU/USD Technical Analysis and Trading Tips on May 13, 2022
- Technical review for AUD/USD: price is likely to increase, but will be limited
- XAU/USD heading towards recent balance at 1,800.00
- Trading plan for USDJPY on May 12, 2022
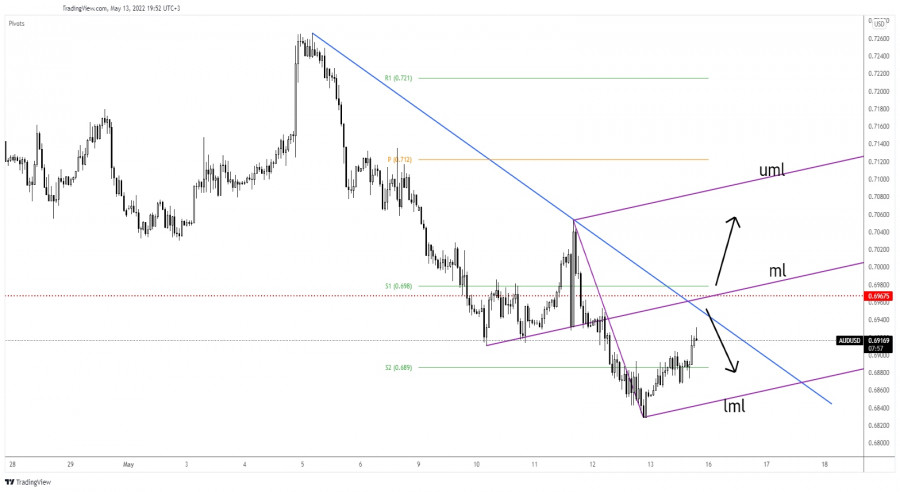
| AUD/USD: could it make larger rebound? Posted: 13 May 2022 09:58 AM PDT AUD/USD rebounded in the short term which it has natural after its massive drop. It was traded at 0.6919 at the time of writing far above 0.6828 yesterday's low. It has increased by 1.50% from yesterday's low to today's high of 0.6931. The currency pair started to grow ahead of the Chinese data. As you already know, China and Australia are economic partners. The Chinese New Loans dropped unexpectedly lower from 3130B to 645B far below 1550B estimates, while the M2 Money Supply rose by 10.5% exceeding the 9.9% forecasts. The AUD/USD pair extended its rebound as the US Prelim UoM Consumer Sentiment came in worse than expected. The indicator was reported at 59.1 points below 64.1 estimates, and versus 65.2 in the previous reporting period. AUD/USD Bearish Bias!
AUD/USD rebounded but the bias remains bearish as long as it stays below the downtrend line. The 0.6967 historical level represents an upside static resistance, while the ascending pitchfork's median line (ml) stands as a dynamic obstacle. Personally, I would like AUD/USD to reach and challenge these upside obstacles before registering a strong move. AUD/USD Forecast!A valid breakout above the downtrend line, 0.6967, and through the median line (ml) may signal a broader growth and could bring new buying opportunities. False breakouts through these levels or a major bearish pattern printed around these obstacles may signal a new sell-off. The material has been provided by InstaForex Company - www.instaforex.com |
| May 13, 2022 : EUR/USD daily technical review and trading opportunities. Posted: 13 May 2022 09:20 AM PDT
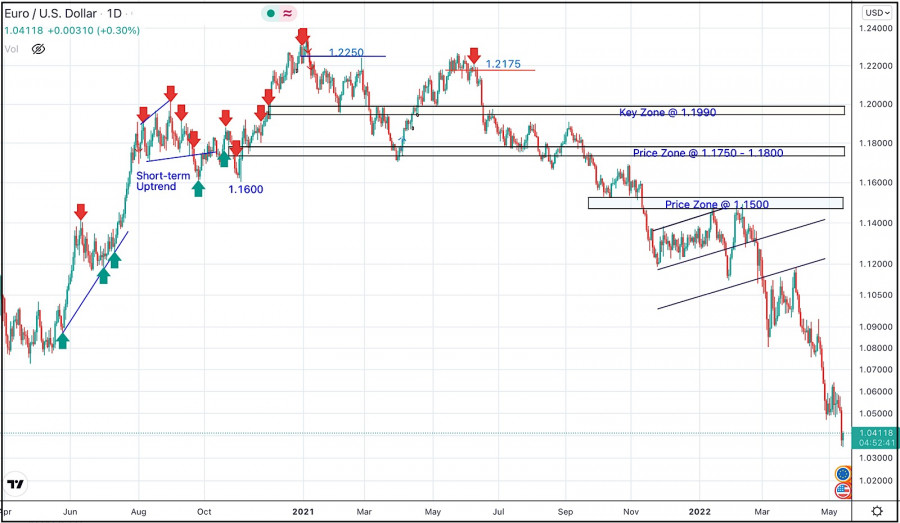
In late September, Re-closure below the price level of 1.1700 has initiated downside-movement towards 1.1500 where some recovery was witnessed. Shortly after, Price levels around 1.1700 managed to hold prices for a short period of time before another price decline took place towards 1.1200. Then the EURUSD has temporarily moved-up within the depicted movement channel until downside breakout occurred recently. Since then, the price zone around 1.1500 has applied significant SELLING pressure when a valid SELL Entry was offered upon the previous ascending movement towards it. Shortly after, the EURUSD looked oversold while approaching the price levels of 1.0800. That's where the recent upside movement was previously initiated. That's why, the recent movement towards 1.1200 was considered for another SELL Trade which is already running in profits now. For beginners, the current price levels are too low to have SELL trades around. Hence, intraday BUY trades are considered a better option. Any ascending movement above 1.0600 will probably enable more advancement towards 1.0700 and 1.0850. Otherwise, conservative traders should stay out of the market. The material has been provided by InstaForex Company - www.instaforex.com |
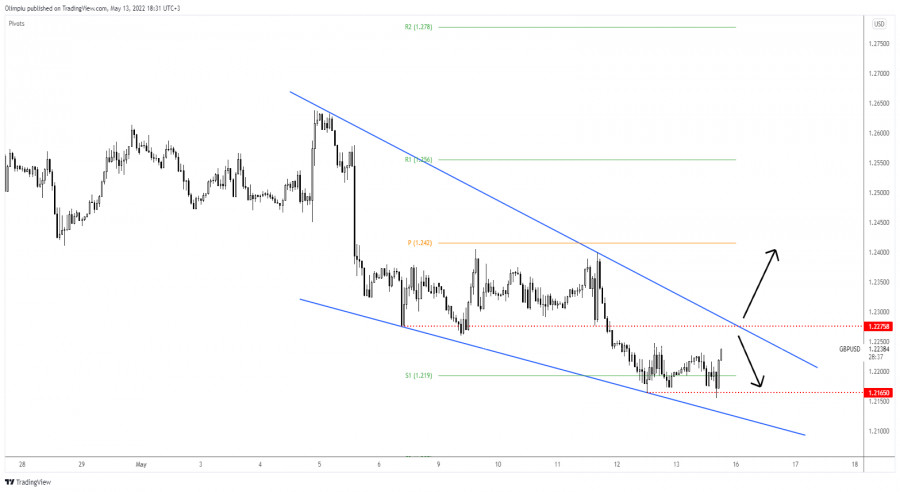
| GBP/USD lifted by poor US data, falling wedge in play Posted: 13 May 2022 09:19 AM PDT GBP/USD is trading in the green at the 1.2233 level at the time of writing. It has rebounded as the USD was punished by the DXY's sell-off. The Dollar Index registered a false breakout above 104.92 signaling exhaustion and a potential drop in the short term. When the DXY drops, the USD could depreciate versus the other currencies. Fundamentally, the greenback was weakened by the US Prelim UoM Consumer Sentiment which dropped unexpectedly lower from 65.2 points to 59.1 points far below 64.1 estimates. In addition, the Prelim UoM Inflation Expectations rose by 5.4%. GBP/USD Bullish Momentum!
GBP/USD found support on the 1.2165 previous low and now it seems determined to approach and reach the 1.2275 and the downtrend line which represents upside obstacles. As long as it stays below the downtrend line, the bias remains bearish. Technically, the Falling Wedge pattern could represent an upside reversal pattern. On the other hand, registering only false breakouts above these obstacles, or failing to reach them may signal a new sell-off. GBP/USD Outlook!The GBP/USD pair could develop a larger growth only if it activated the Falling Wedge. jumping, closing, and stabilizing above the 1.2275 and above the downtrend line may signal a larger rebound and could bring new long opportunities. False breakouts through these obstacles may signal that the rebound ended and that the GBP/USD pair could come back down at least towards 1.2165. The material has been provided by InstaForex Company - www.instaforex.com |
| May 13, 2022 : EUR/USD Intraday technical analysis and trading plan. Posted: 13 May 2022 09:17 AM PDT
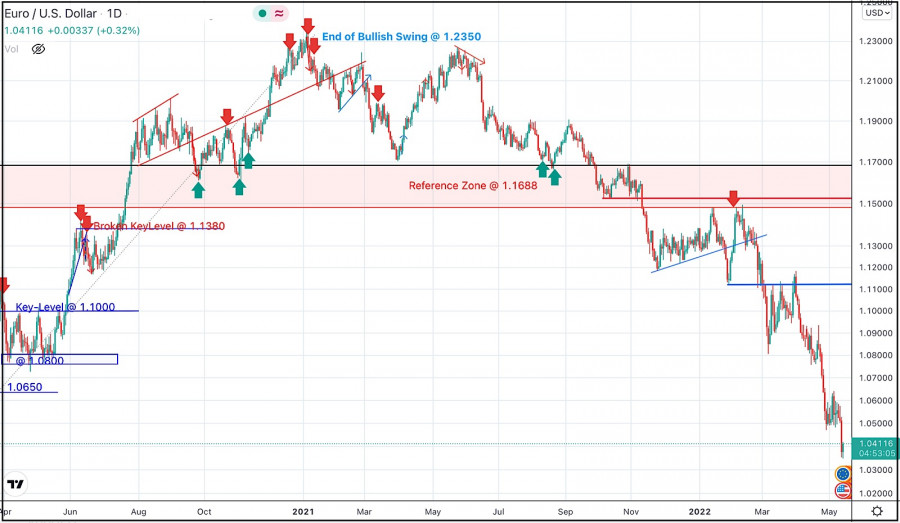
A short- term sideway movement was demonstrated within the highlighted zone around 1.1600 before quick bearish decline could occur towards 1.1200. On the other hand, the price zone around 1.1500 - 1.1600 remained a reference zone that applied significant bearish pressure upon two successive bullish visits before another bearish continuation sign was expressed. Hence, downside movement proceeded towards 1.1000 then 1.0920 where short-term bullish pullback was initiated. The price levels around 1.1150 hindered further bullish movement before another bearish move was aggressively expressed towards 1.0500. Failure to persist below the newly-recorded LOW at 1.0350 will probably enable another bullish pullback at least towards 1.0800 and probably 1.1150. Until then, Intraday traders shouldn't have any BUY trades unless bullish persistence above 1.0650 is achieved first. The material has been provided by InstaForex Company - www.instaforex.com |
| May 13, 2022 : GBP/USD Intraday technical analysis and significant key-levels. Posted: 13 May 2022 09:16 AM PDT
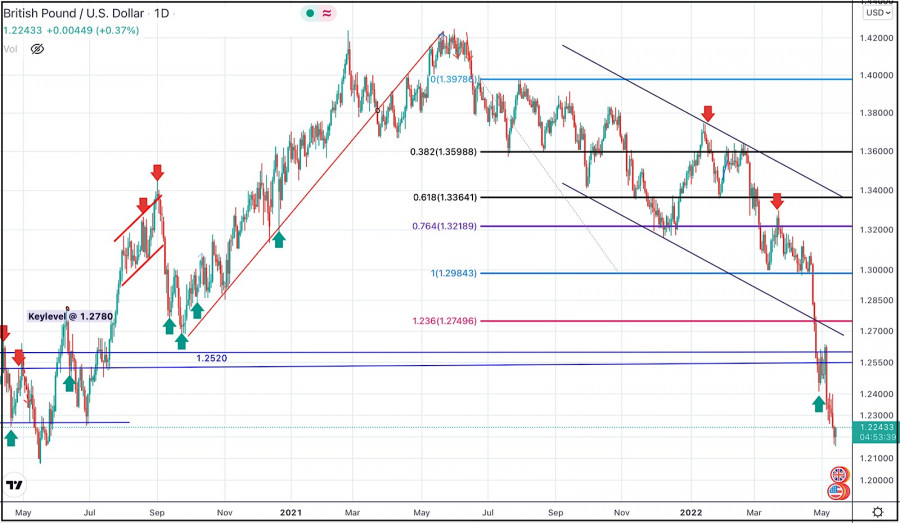
The GBPUSD pair has been moving within the depicted bearish channel since July. Sideway movement was expressed above 1.3600 while the price levels around 1.3730 - 1.3800 were considered as they offered significant bearish rejection. The short-term outlook turned bearish when the market went below 1.3600. This enhanced the bearish side of the market towards 1.3200 which brought the pair back towards 1.3600 for another re-test. Hence, the recent bullish pullback towards 1.3600 should have been considered for SELL trades as it corresponded to the upper limit of the ongoing bearish channel. Shortly after, Bearish persistence below 1.3360 was needed to enable further downside continuation towards 1.2980 - 1.3000. Bullish rejection has arised many times around 1.3000 standing as a significant Daily Support where the previous consolidation range has arised. This happened before another bearish decline could take place earlier this week. Another bearish breakout below 1.2980 has enabled quick bearish extension towards 1.2600-1.2550 where some bullish recovery and a short-term sideway movement could be established before another downside movement was expressed The current bearish decline is expected to extend towards 1.2100 where bullish recovery can be expected. Bullish breakout above 1.2400 is needed to abolish the short-term bearish scenario and may enable quick bullish advancement towards 1.2550, 1.3300 and probably 1.3600 if sufficient bullish momentum is expressed. The material has been provided by InstaForex Company - www.instaforex.com |
| Trading Signal for GBP/USD on May 13-16, 2022: buy above 1.2207 (2/8 Murray - oversold) Posted: 13 May 2022 08:56 AM PDT
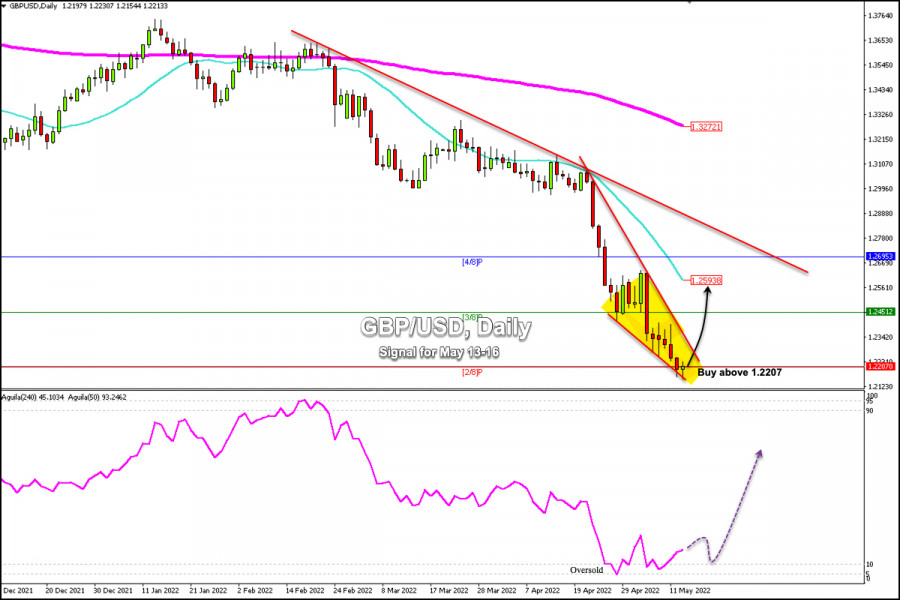
Early in the American session, the British pound (GBP/USD) is showing signs of exhaustion and oversold conditions. After reaching the low of 1.2154, a strong technical rebound is observed which could be a sign of the end of the downtrend. Gloomy UK growth data releases, combined with market risk aversion, keep the downward pressure on the pair intact. According to the daily chart, we can see that the GBP/USD pair is bouncing and consolidating above 2/8 Murray (1.2207). A close on daily charts above this support could signal the start of a strong technical bounce and could reach 21 SMA at 1.2593. On the daily chart, we can see the formation of a falling wedge pattern. A break above 1.2250 and a close above this level on the daily chart could confirm the acceleration of the upward movement and could signal a change in trend in the short term. The equity market is showing a positive bias, which is a sign that investors are changing their perception of risk. This factor could favor the British pound and it could reach the resistance level at 1.26 and up to the top of the bearish channel formed on February 14. Our trading plan for the next few hours is to buy GBP/USD above 1.2207 with targets at 1.2250 and 1.2593 (21 SMA). The eagle indicator is in the oversold zone showing a positive signal. It is likely that in the coming days the British pound can recover part of its losses and might reach the area 4/8 Murray around 1.2695. The material has been provided by InstaForex Company - www.instaforex.com |
| Trading Signal for GOLD (XAU/USD) on May 13-16, 2022: buy above $1,802 (strong support - oversold) Posted: 13 May 2022 07:54 AM PDT
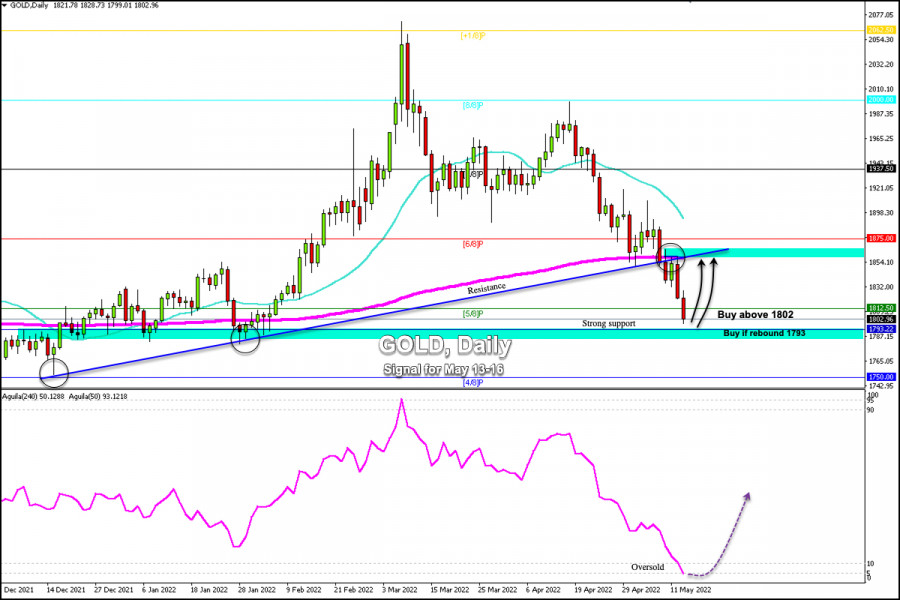
Early in the American session, gold is printing lower lows, reaching the level of 1,799.01. Gold had found some support around 5/8 Murray at 1,812. However, bearish pressure continued to prevail and pushed the price towards the psychological level of 1,800. At this time, we note that gold is trading around 1,802. However, the downside pressure is likely to continue and the metal may reach the weekly support at 1,793. XAU/USD is going for the fourth weekly decline in a row and there is some probability of a strong technical rebound in the coming days. In the event of a further bearish bias and a daily close below 1,800, the next strong support appears at this year's low near 1,793. The negative bias is expected to persist. However, the eagle indicator has reached the key level of 5 points which represents an extremely oversold price. According to this indicator, there is likely to be an imminent bounce in the next few hours, only if gold consolidates above 1,800. According to the daily chart, we can see that gold has broken an uptrend channel formed on December 14, 2021, at around 1,860. Below this level, gold accelerated lower and reached a low of 1,800. Currently, the price is generating signs of exhaustion and overselling. In the coming days, Gold is likely to remain above the strong support of 1,793 or above 1,800. We can expect a recovery towards 1,832 and to the top of the uptrend channel around 1,854 (200 EMA). Our trading plan for the next few hours is to buy around 1,802 or in case of a technical bounce towards 1,793 that will also be a buy signal, with targets at 1,830 and 1,854. The eagle indicator is showing a sign of an imminent bounce which supports our bullish strategy. The material has been provided by InstaForex Company - www.instaforex.com |
| Trading plan for Ripple on May 13, 2022 Posted: 13 May 2022 07:08 AM PDT
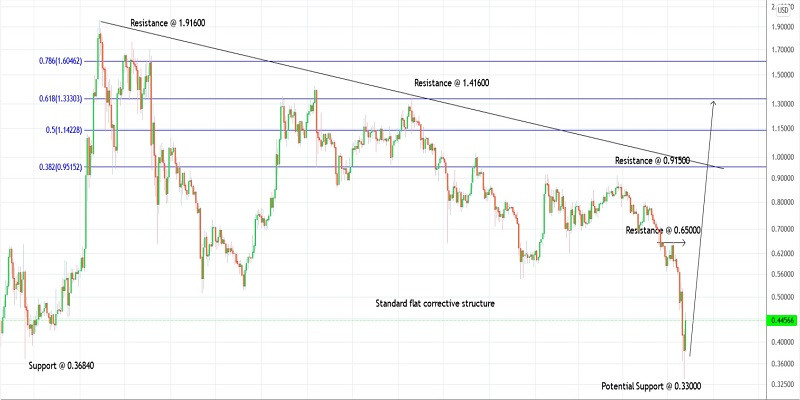
Technical outlook:Ripple might have been ale to print a meaningful bottom around the $0.33300 mark, just below its February 2021 low registered around $0.36800 mark. It looks like bulls will be inclined to hold prices above the $0.33300 mark for the next several weeks. Possiblity also remains for a push through all-time highs above the $1.91600 mark. Ripple is now producing an Engulfing bullish candlestick pattern, in-line with expectations, indicating a potential push towards initial resistance seen around $0.65000 mark. The crypto has raised through $0.46300 mark on Friday and has now eased off slightly through $0.45000 mark at this point in writing. Bulls are looking in control and eyeing above $0.65000 level near term. Ripple could rally through the Fibonacci 0.618 retracement of the drop between $1.91600 and $0.33300 levels, which is seen through $1.33300 level as projected on the chart here. Since the above drop looks corrective, potential remains for a continued rally through all-time highs above $1.91600 levels going forward. Trading plan:Potential rally through $1.33300 against $0.33000 Good luck! The material has been provided by InstaForex Company - www.instaforex.com |
| Trading plan for Ethereum on May 12, 2022 Posted: 13 May 2022 06:47 AM PDT
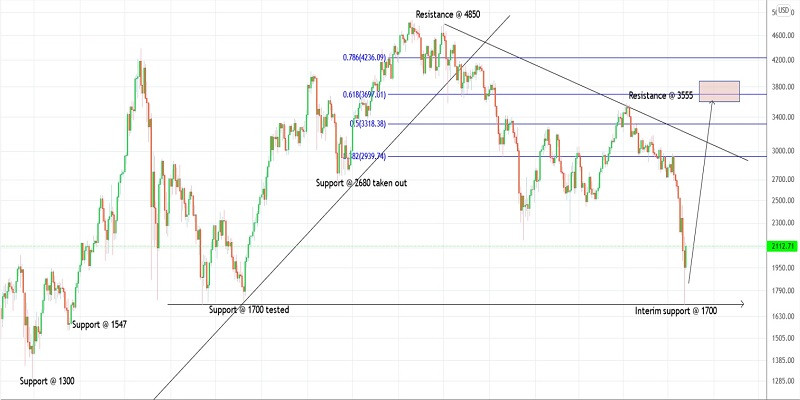
Technical outlook:Ethereum now seems to have carved a meaningful bottom around the $1,700 mark on Thursday and is expected to hold above this level in the next trading sessions. Please note that bears have managed to take out its July 2021 lows, indicating a much deeper correction ahead. But before the next leg lower, bulls appear poised to produce a meaningful pullback. Ethereum has moved through $2,140 before easing off a bit as it is seen to be trading close to the $2,100 mark at this point of writing. The crypto is producing a significant Engulfing Bullish candlestick pattern on the daily chart and hence potential remains for an extended rally going forward. Ethereum bulls are now targeting the $2,900 and $3,500-3,600 zone in the next several trading sessions. Also note that the Fibonacci 0.618 retracement of the entire drop between $4,850 and $1,700 is seen through $3,690 mark as projected on the chart here. Bears might be back in control thereafter. Trading plan:Potential rally towards $3,600 against $1,500 Good luck! The material has been provided by InstaForex Company - www.instaforex.com |
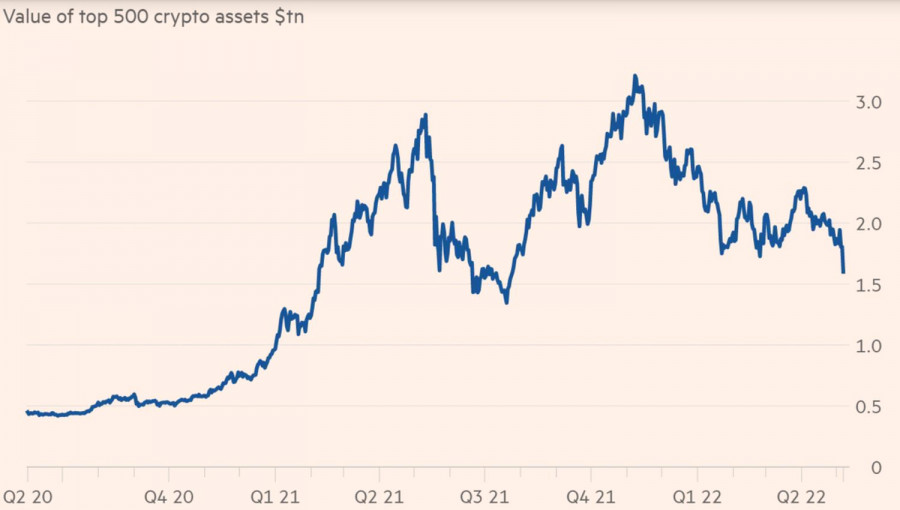
| Posted: 13 May 2022 06:35 AM PDT Bitcoin collapsed to the lowest mark since December 2020. This sharp price action assured investors that the flagship cryptocurrency is not as lucrative as it seemed. Those who used to consider the crypto to be a goldmine are now thinking about how to cut losses. What seemed to be a great opportunity to hit the jackpot is tuning into heavy losses. The bitcoin magic was about its stunning rally. So, crypto fans jumped on the bandwagon, reckoning lofty profits that they could have gained if they had bought tokens at the dawn of the crypto market. For its history of more than 10 years, the crypto market has never closed below the lowest level of the previous year. 2015 looks to be a failure because for the most part of the yearBTCUSD traded below the bottom of 2014. Eventually, the token closed the year above this level. 2022 is sure to be an exception from the rule. Amid the COVID pandemic and mind-blowing stimulus programs conducted by the US Fed, bitcoin managed to set an all-time high of more than $69,000. However, as soon as it became clear that cheap liquidity would leave the market, the number one cryptocurrency was hurt by massive sell-offs. BTCUSD quotes have lost about 56% of their value from the levels of November peaks, and the capitalization of the 500 largest digital assets, led by Bitcoin, has shrunk from almost $4 trillion to $1.2 trillion. Market capitalization of digital assets
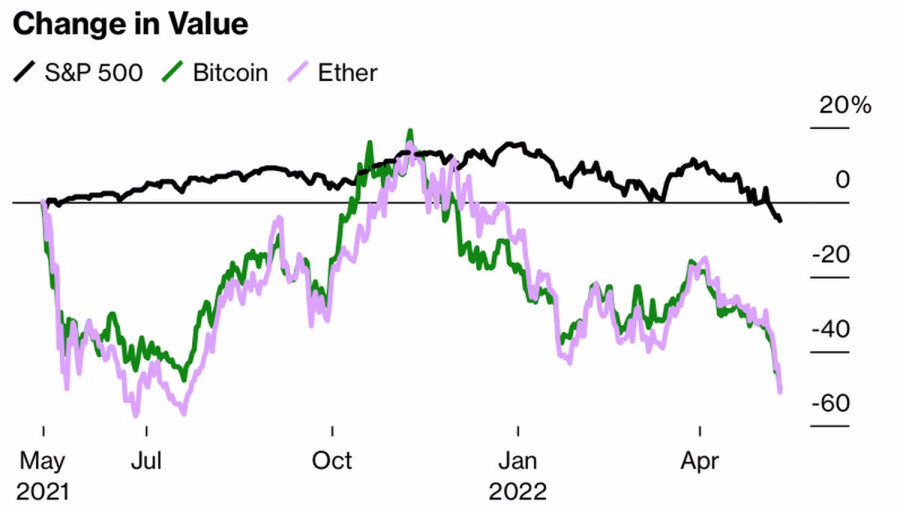
At thesame time, the shares of American companies, whose activities were related to the crypto market, also faced heavy losses. The market value of the 25 largest issuers, including Block, Coinbase Global, and Robinhood Markets, contracted by $200 billion. In essence, the normalization of the Fed's monetary policy has led to the fact that bitcoin has turned from a magical asset into a normal asset, the value of which fluctuates depending on monetary policy, the state of the economy, and capital market conditions. A similar story happened with gold, which, after the end of the gold standard era, first developed a stunning rally and then entered into its trading range and continues to trade sideways. The precious metal used to be a magical asset for the baby boomer generation, just as it was with the flagship cryptocurrency sector and the millennial generation. Dynamic of S&P 500, bitcoin and Ethereum
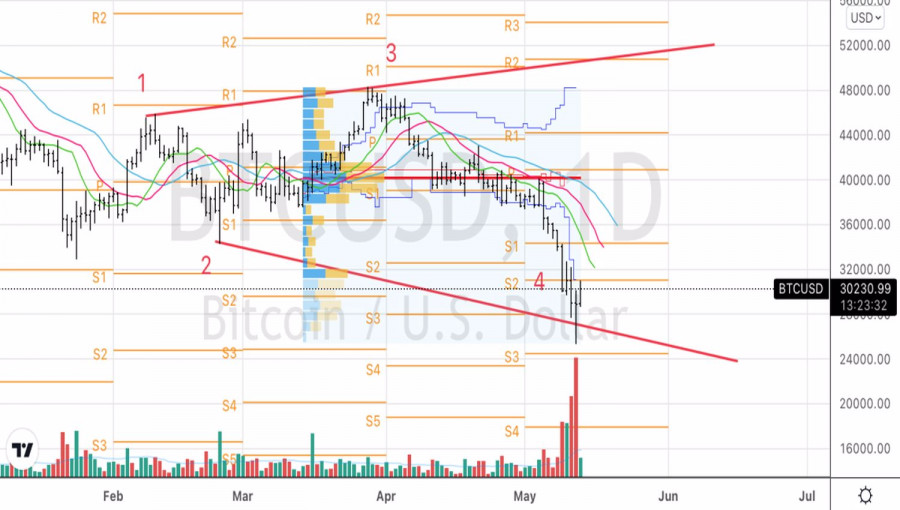
In May,bitcoin was hit with a double whammy by the Fed's focus on aggressive monetary tightening and the fact that collateralized stablecoins, which should be pegged to the US dollar at a ratio of 1 to 1, unexpectedly unlinked from the US currency and sank below its value. TerraUSD set a bad example, and it turned out to be contagious even for the largest representative of the sector - Techer. Technically, on the daily BTCUSD chart, there is a pin bar formation on increased volumes. This is a signal that the bulls are ready to assert strength. A break of resistance at 31050, where both the lower line of the fair value and the pivot level are located, may become a signal for short-term purchases. Daily chart of bitcoin
|
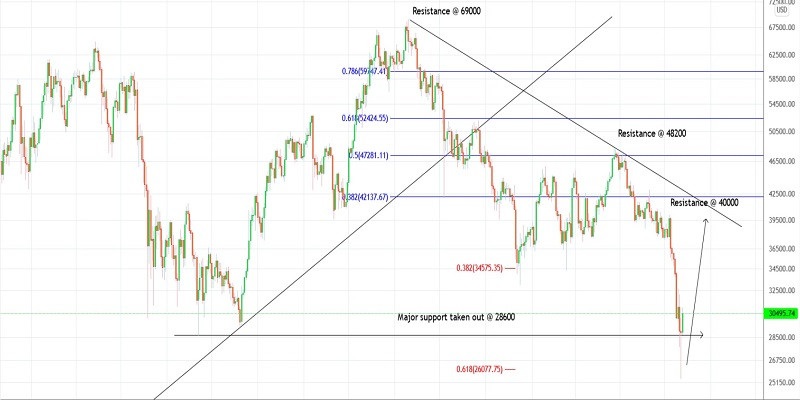
| Trading plan for Bitcoin on May 13, 2022 Posted: 13 May 2022 06:29 AM PDT
Technical outlook:Bitcoin seems to have carved an intermediate bottom around the $25,500 mark on Thursday. The crypto has reversed sharply since then as expected and has raised through the $30,900 high intraday. It is also carving a significant Morning Star candlestick pattern on the daily chart indicating a continued rally going forward. Bitcoin is seen to be trading close to $30,500 at this point in writing and is expected to push through the $40,000 mark in the next several trading sessions. Please note that $40,000 is initial price resistance followed by $48,200; while interim support is now seen around the $25,500 level respectively. Bitcoin has now carved a meaningful downswing between the $69,000 and $25,500 levels. Ideally, the crypto should retrace the entire drop at least towards the Fibonacci 0.618 level, which is seen through $52,400 as marked on the chart here. Traders would remain poised to initiate fresh long positions from current levels. Trading plan:Potential rally towards $42,000 and $52,000 against $20,000 Good luck! The material has been provided by InstaForex Company - www.instaforex.com |
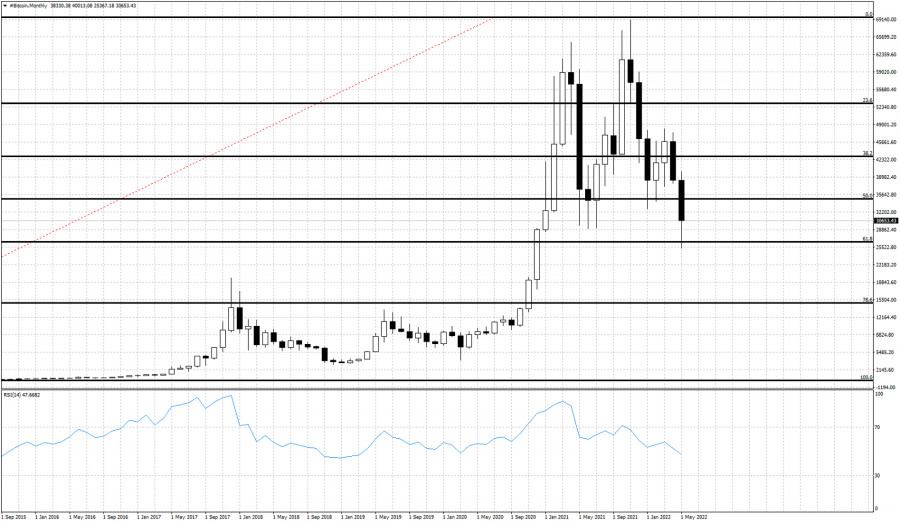
| Analysis on Bitcoin current market conditions. Posted: 13 May 2022 06:19 AM PDT Bitcoin is trading again above $30,000 after falling as low as $25,000. Short-term trend remains bearish as price continues making lower lows and lower highs. Price has retraced more than the 61.8% of the entire upward move but price remains above the 61.8% level.
On a monthly basis staying above $26,000 is very important. Respecting the 61.8% Fibonacci retracement is key. At 61.8% retracement levels we usually see trend reversals. It is too early to call a major low for Bitcoin, but we are certainly at a price junction where such a reversal is possible. Traders need to pay close attention to shorter term time frames to try and identify the reversal sooner. As long as price is below $40,000 we are pretty sure that bears will remain in control of the trend. The material has been provided by InstaForex Company - www.instaforex.com |
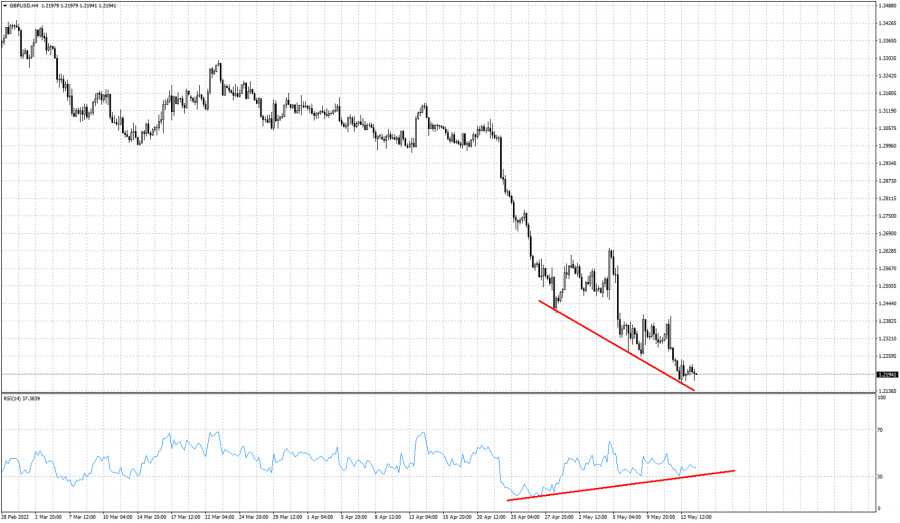
| GBPUSD justifies at least a short-term bounce. Posted: 13 May 2022 06:15 AM PDT GBPUSD remains in a bearish trend making lower lows and lower highs. However there are some signs that the downtrend is weakening and usually when we see such signs, a bounce follows. GBPUSD justifies a bounce from current levels if not a bigger reversal.
Red lines- bullish divergence The RSI is not making lower lows as price does. This is a bullish divergence in the 4h our chart. This is not a reversal signal. This is only a warning to bears. A bounce towards 1.2380 is justifies and could be seen over the next couple of sessions. Traders need to be cautious. GBPUSD is declining since January. A strong bounce higher to correct the entire downward move is very probable. The material has been provided by InstaForex Company - www.instaforex.com |
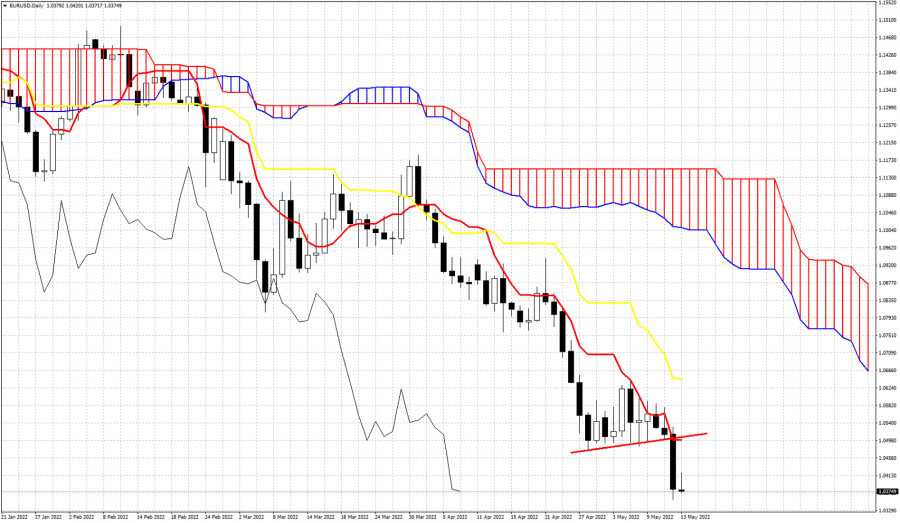
| Ichimoku cloud indicator analysis on EURUSD for May 13, 2022. Posted: 13 May 2022 06:11 AM PDT EURUSD remains in a bearish trend. Price continues making lower lows and lower highs as price is still below the cloud. In Ichimoku cloud terms, trend remains bearish with no sign of a reversal.
We use the Ichimoku cloud indicator to identify trend on a daily basis and the key resistance levels. First important short-term resistance level is at 1.0498 where we find the tenkan-sen (red line indicator). Bulls will need at least to break above this level in order to get the first sign of a possible reversal. Until then any upward bounce is considered as a short-term relief to the bearish trend. Next upside target and key resistance is at 1.0645 where we find the kijun-sen (yellow line indicator). If price breaks above this indicator, then we should expect EURUSD to move higher towards the Kumo (cloud). The material has been provided by InstaForex Company - www.instaforex.com |
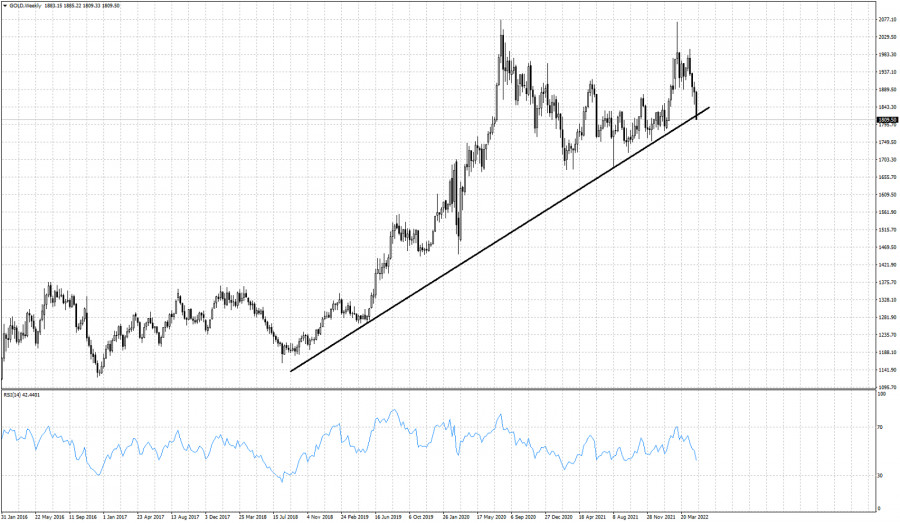
| Posted: 13 May 2022 06:07 AM PDT Gold price has reached our second target of $1,825 and is now trading around $1,810. Trend remains bearish. Price is trading slightly below the major weekly trend line support. Bulls need to step in and push price higher. If price bounces from current levels, then we have confirmation that this is a support area. Also using the Ichimoku cloud indicator we get similar conclusions.
|
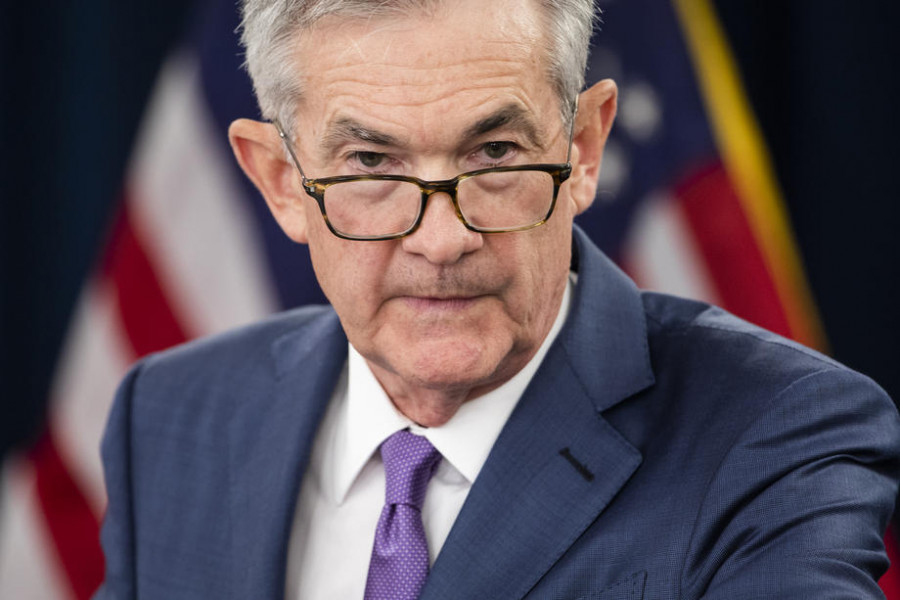
| Powell: soft economic landing may be challenging Posted: 13 May 2022 05:39 AM PDT The US dollar maintains its winning streak versus risky assets. There are plenty of reasons for the greenback's rally. The main is the Fed's readiness to act more aggressively if necessary. Some Analysts believe that the central bank may hike the key rate by 75 basis points this summer. Today, Fed Chairman Jerome Powell warned that the Fed's fight against inflation may trigger some economic problems. Nevertheless, the regulator is poised to curb soaring inflation. Powell also said that the Fed cannot guarantee a soft economic landing. It needs to continue to actively raise interest rates to combat inflation, which has already hit a four-decade high. With a tight labor market that pushes up wages, it will be hard to avoid a recession that often follows aggressive policy tightening. "So it will be challenging, it won't be easy. No one here thinks that it will be easy," Powell said. "Nonetheless, we think there are pathways ... for us to get there."
Yesterday, the Senate voted overwhelmingly to give Jerome Powell a second term. Seven months ago, President Joe Biden supported his candidacy for the post of Fed Chairman. His main priority for the second term is to curb inflation. In April, it hit 8.3% year-on-year, below the surge recorded in March. Last week, the Fed increased its benchmark rate by half a percentage point after a quarter-point rate hike in March. As I have noted above, traders expect that the central bank will raise the interest rate by another half a percentage point in June and continue to hike rates until the end of the year. Some analysts do not rule out the possibility of a more aggressive rate increase by 0.75% if the CPI index for May rise again. During a press conference last week, Powell made several hawkish remarks, which hinted at a 75 basis point rate increase at the next meeting. The US dollar climbed significantly amid such statements against its counterparts. "So a soft landing is, is really just getting back to 2% inflation while keeping the labor market strong," he pointed out. Not long ago, Powell was widely criticized for a slow response to inflation. Economists reckon that the Fed should have raised rates earlier. They are also puzzled why the regulator maintains the bond-buying program. Demand for risky assets is quite low amid the Fed's hawkish stance on monetary policy. Technical indicators also confirmed it. After the euro/dollar pair dropped below 1.0360, it tried to erase losses but failed. Expectations of the ECB's shift to a more aggressive policy are also bearish for the euro. Christine Lagarde said that the regulator may hike key rates in July this year. In the short term, it is better to open positions with the support level of 1.0370 in focus. Bulls may take control again if they protect this level. If not, bears are likely to push the pair to new yearly lows of 1.0340 and 1.0290. The euro may also start a correction. However, the pair should consolidate above 1.0420. Only after that, a breakout of 1.0460 may take place. In this case, the pair may rise to 1.0520 and 1.0580. GBP bulls have recently defended 1.2170. Yet, the situation may change quite soon. The Bank of England hinted that it may take a pause in its monetary policy tightening cycle. If so, traders should brace for another major sell-off of the pound sterling. In the short term, buyers will probably try to push the price to 1.2240. Only consolidation above this level will trigger an upward correction. However, I advise selling the pound sterling after each rebound within the trend. A breakout of 1.2240 will push the pair to 1.2280 and 1.2330. A breakout of 1.2170 will strengthen the bear market, opening the way to new lows of 1.1220 and 1.2070. The nearest support level will be 1.2030. The pound sterling is likely to drop to this level if the UK economy contracts even more. The material has been provided by InstaForex Company - www.instaforex.com |
| Trading plan for Silver on May 13, 2022 Posted: 13 May 2022 05:11 AM PDT
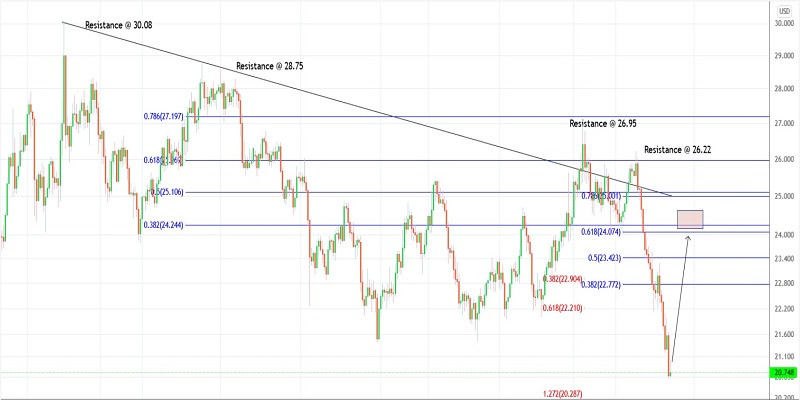
Technical outlook:Silver prices continued to drop on Thursday carving fresh lows around $20.60 levels. The metal is not too far from the lows and remains vulnerable for yet another drag lower through $20.30 levels as shown on the chart here. Bulls might be preparing to come back into control soon but need to hold prices above $20.60 mark near term. Silver has already carved a meaningful downswing between $26.22 and $20.60 levels now. Ideally prices are expected to produce a counter trend rally anytime soon, pushing prices through $24.10 levels at least if not further. Immediate price resistance is now seen through $23.30, followed by $26.22, $26.95 and higher. A break above $23.30 is now needed to release any near term downside pressure and resume its counter trend rally. Also note that the fbonacci 0.618 retracement of the above drop is seen passing through $24.07 levels, which should provide strong resistance. Bears would be inclined to come back in control thereafter. Trading plan:Potential rally towards $24.00-10 levels against $20.00 Good luck! The material has been provided by InstaForex Company - www.instaforex.com |
| Trading plan for Gold on May 13, 2022 Posted: 13 May 2022 04:54 AM PDT
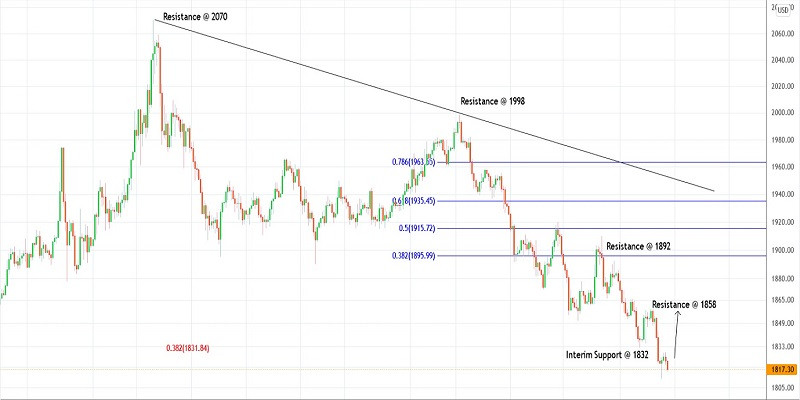
Technical outlook:Gold prices slipped through $1,810 in the early Asian session on Friday before pulling back sharply. The yellow metal pushed through $1,828 thereafter and found resistance. It is pulling back lower again and seems to have found support close to the $1,815-16 levels at the time of writing. Bulls might be inclined to resume higher from here. Gold is now facing immediate price resistance around $1,858 as bulls prepare to take that out in the near term. If the metal unfolds accordingly, bulls would assert themselves to be back in control. Intermediate support is now shifted through the $1,810 mark and ideally prices should remain well capped higher. Gold has carved a meaningful downswing between $1,998 and $1,810 in the past several trading sessions. The metal is now expected to produce a corrective pullback through $1,892 and $1,935 going forward. Traders might be preparing to initiate fresh long positions from here with risk below the $1,810 mark. Trading plan:Potential rally through $1,892 and $1,935 levels against $1,810 Good luck! The material has been provided by InstaForex Company - www.instaforex.com |
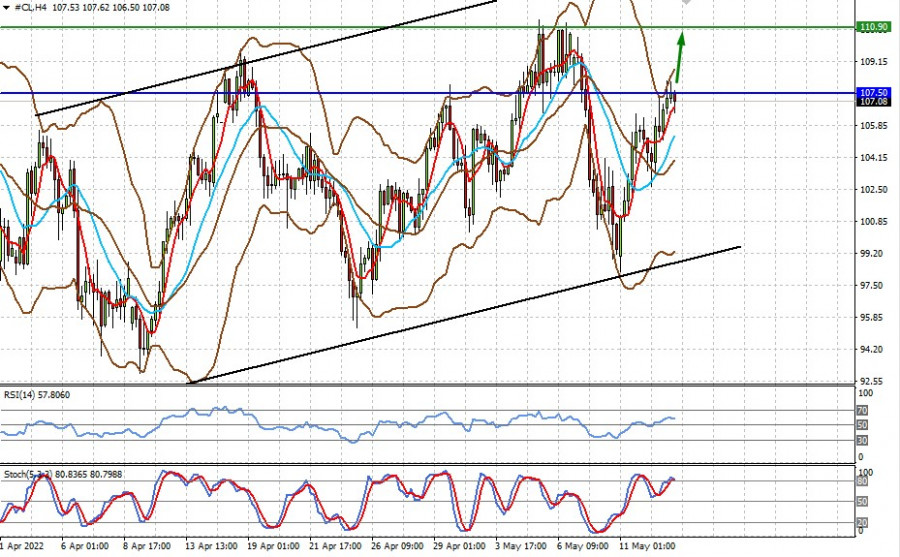
| Technical review for WTI: prices will rise again Posted: 13 May 2022 04:52 AM PDT Although prices dipped after reaching the local high of 108.00, the trend in the oil market remains bullish as growing risk appetite and current geopolitical tensions will support oil, especially amid fears of supply shortage. technical picture: The quote is currently above the middle line of the Bollinger indicator, above the SMA 5 and SMA 14. The relative strength index (RSI), meanwhile, is above 50%, but indicates a weakening of growth, while the stochastic indicator is in the overbought zone. Possible dynamics: An increase above 107.50 will most likely lead to a further rise to 110.90.
|
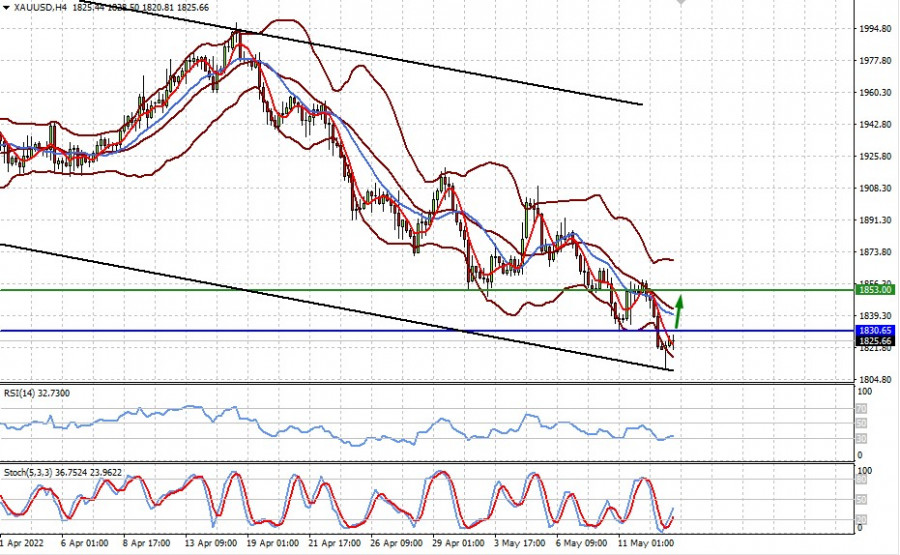
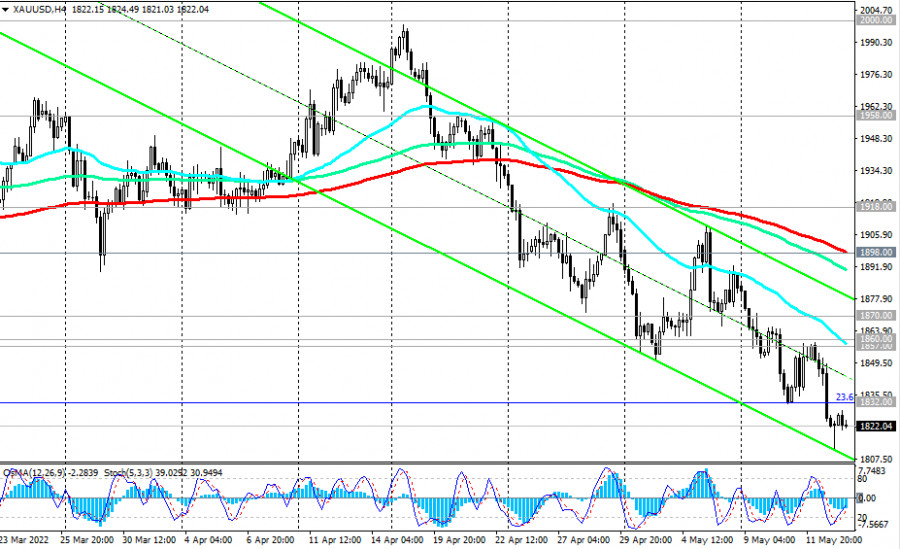
| Technical review for XAU/USD: there is a chance for growth, but it will be limited Posted: 13 May 2022 04:44 AM PDT Spot gold found support at 1810.00, after falling yesterday. Growth was mainly driven by the growing demand in stock markets, as well as the weakening in dollar. It is likely that investors have already taken into account the possible 0.50% rate hike of the Fed in June, which may lead to the closing of short positions in the stock markets and profit-taking in dollar. That situation will provoke a local strengthening in gold. technical picture: The quote is below the middle line of the Bollinger indicator, above the SMA 5, but under the SMA 14. Meanwhile, both the relative strength index (RSI) and stochastic indicator are out of the oversold zone and are rising. Possible dynamics: Climbing above 1830.65 will prompt a further growth to 1853.00.
|
| US premarket on May 13: stock market recovering and Twitter dropping by 20% Posted: 13 May 2022 04:43 AM PDT US stock index futures rose slightly on Friday, but investors are still not ruling out that the bear market may continue, so they are acting with quite a bit of caution. Dow Jones Industrial Average futures increased by 242 points or 0.76%. Futures on the S&P 500 jumped by 1% and futures on the Nasdaq-100 gained 1.73%. At the end of yesterday's trading, there was quite a struggle, as the inflation data released this week clearly indicated the need for further interest rate hikes, but the question is whether the Federal Reserve needs to act more aggressively, or whether the best option would be to raise rates according to the approved plan.
The S&P 500 and Dow Jones indices rebounded from their intraday lows on Wednesday, but still closed lower. The S&P index declined by more than 18% from its all-time high. The bear market will officially start when the losses are over 20%, so there is still a chance for a bailout. The Nasdaq index added less than 0.1% on Wednesday, but that did not save it, as the tech index is already maintaining a bear market, down more than 29% from its all-time high. Loss-making tech stocks continue to drag the entire sector down. Some experts are talking about the bursting of the tech sector bubble, which has been heavily overbought on the back of the Fed's ultra-soft monetary policy over the past two years since the coronavirus pandemic began. Now one of the reasons investors have struggled in recent months is high inflation and the Federal Reserve's attempts to curb rising prices by increasing rates. The market growth in March after the first interest rate hike in the US was completely diminished by a sudden fall in April. The May rate hike of 0.5% at once is also painful and it is possible that we may see another aggressive hike of 0.75% in June. Of course, there are some signs of market stabilization as Treasuries feel more or less steady. However, many investors expect that the market may have to decline further. As for economic data, April import prices and a preliminary analysis of consumer confidence in May will be released on Friday. Premarket
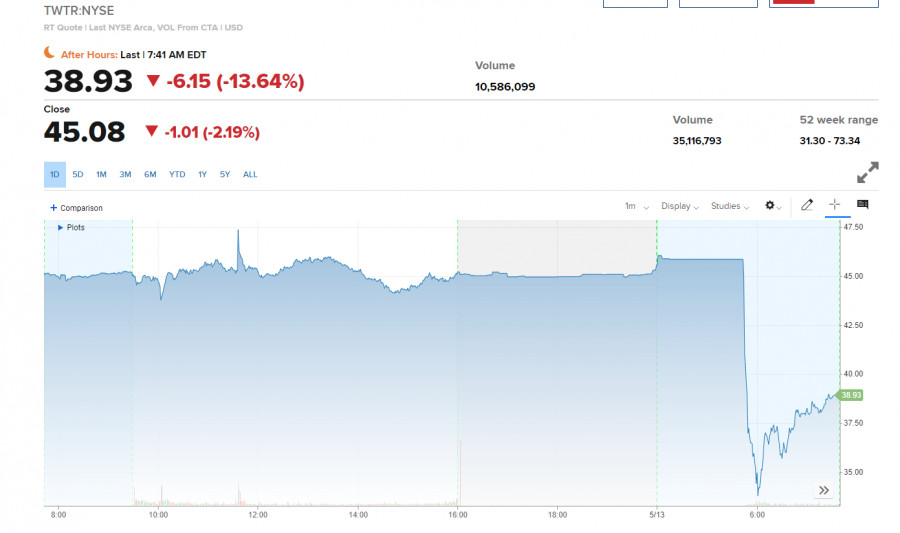
Twitter shares fell by nearly 20% in the premarket after Elon Musk announced that the takeover deal had been temporarily suspended. The main reason for suspending the deal is false information about the number of fake accounts on the platform. Until a clear analysis and detailed information are provided, we will not see progress on the deal. As for the technical picture of the S&P 500 With a good start to the day, bulls may take a break at the end of the week in an attempt to find the bottom. While the asset is trading above $3,964, bulls need to protect this level. It may be tested immediately after the release of the data on the US economy during the regular session. If traders protect $3,964 and reach above this level, it may strengthen their confidence, counting on an upward correction. However, it is too early to talk about hitting the bottom. A consolidation above $4,005, the nearest resistance level, will allow the asset to return to $4,037 and touch $4,069. In the case of pessimism and more talks on high inflation and the need to curb it, we are likely to see a major sell-off below $3,964. A decline below that level would quickly push the index to a low of $3,924. If you miss this level, it is better to postpone buying the trading instrument until it reaches a low of $3,882. The material has been provided by InstaForex Company - www.instaforex.com |
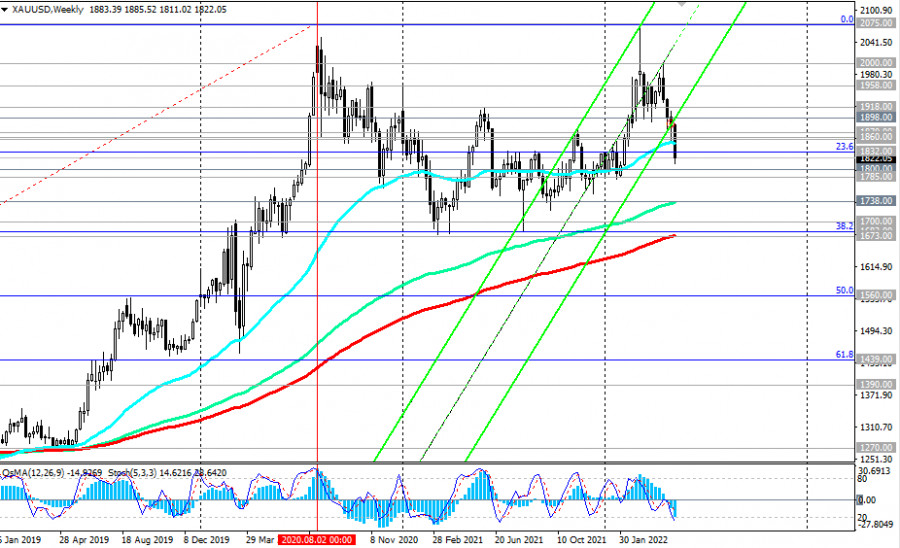
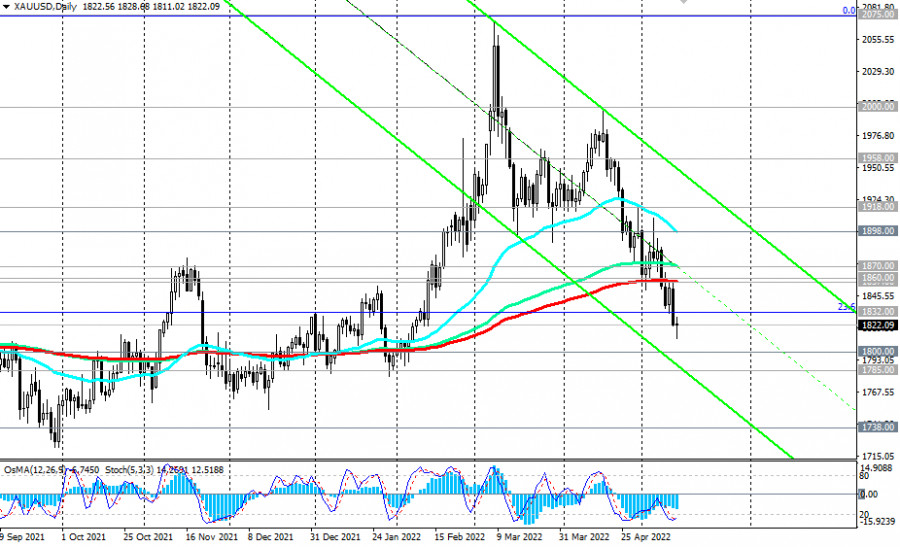
| XAU/USD Technical Analysis and Trading Tips on May 13, 2022 Posted: 13 May 2022 04:43 AM PDT As suggested in the previous review of this pair, in an alternative scenario, and after the breakdown of the 1851.00 support level, XAU/USD will continue to decline towards the recent balance line passing through the 1800.00 mark. This scenario turned out to be working, and the price is moving, as assumed, towards the 1800.00 mark. The recommendation (Sell Stop 1869.00. Stop-Loss 1902.00) came true and the first downside targets at 1858.00, 1851.00, 1832.00 were achieved. Let's not guess whether the price will reach the levels of 1800.00 and 1785.00, but again we will build our trading plan, assuming two scenarios for the development of events.
XAU/USD is trading near the 1821.00 mark, moving inside descending channels. The lower limit of the descending channel on the daily chart is between 1800.00 and 1785.00. If the downward trend continues, and everything is heading towards this, then the 1800.00 and 1785.00 marks are likely to become the nearest downward targets.
The signal for the implementation of this scenario will be a breakdown of the local support level and today's low of 1811.00. The breakdown of the support levels of 1800.00 and 1785.00 will strengthen the negative dynamics of XAU/USD, sending it towards the key long-term support levels of 1738.00 (144 EMA on the weekly chart), 1682.00 (38.2% Fibonacci retracement to the growth wave from December 2015 and the level of 1050.00), 1675.00 (200 EMA on the weekly chart). In turn, their breakdown will increase the risks of breaking the long-term bullish trend of XAU/USD.
In an alternative scenario and after the breakdown of the resistance level of 1857.00 (200 EMA on the daily chart), XAU/USD will return to the bull market zone. A break of the resistance level of 1870.00 (144 EMA on the daily chart) will confirm the revival of the long-term bullish trend. The signal for the implementation of this scenario will be a breakdown of the resistance level of 1832.00 (local highs and the 23.6% Fibonacci retracement level). Support levels: 1800.00, 1785.00, 1738.00, 1700.00, 1682.00, 1675.00 Resistance levels: 1832.00, 1857.00, 1860.00, 1870.00, 1898.00, 1918.00, 1958.00, 2000.00, 2070.00, 2075.00 Trading Tips Sell Stop 1809.00. Stop-Loss 1834.00. Take-Profit 1800.00, 1785.00, 1738.00, 1700.00, 1682.00, 1675.00 Buy Stop 1834.00. Stop-Loss 1809.00. Take-Profit 1857.00, 1860.00, 1870.00, 1898.00, 1918.00, 1958.00, 2000.00, 2070.00, 2075.00 The material has been provided by InstaForex Company - www.instaforex.com |
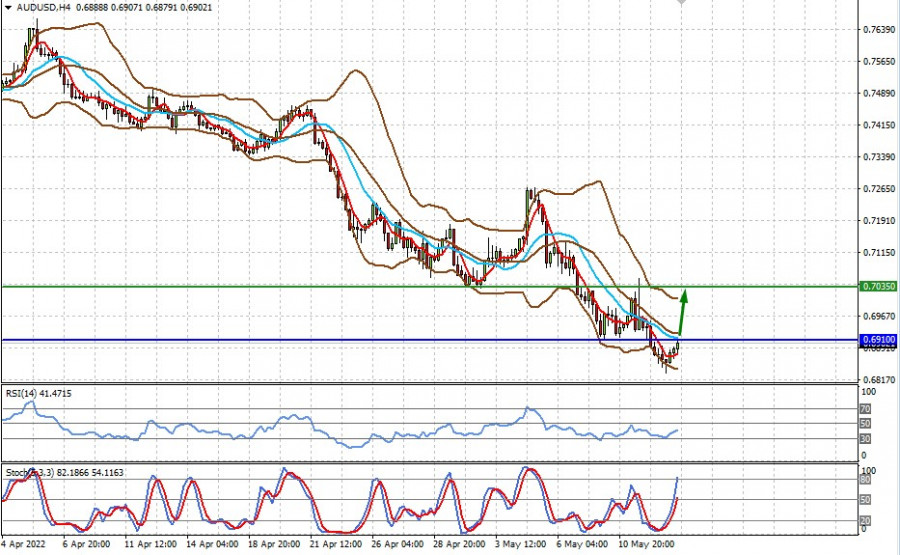
| Technical review for AUD/USD: price is likely to increase, but will be limited Posted: 13 May 2022 04:39 AM PDT AUD/USD is recovering from yesterday's decline, thanks to the growing demand in stock markets and the local weakening in dollar. It appears that investors already factored into prices the expected 0.50% rate hike of the Fed in June, which may lead to the closing of short positions in the stock markets and profit-taking in dollar. technical picture: The quote is below the middle line of the Bollinger indicator, above the SMA 5, but below the SMA 14. Meanwhile, both the relative strength index (RSI) and stochastic indicator are out of the oversold zone and are rising. Possible dynamics: A rise above 0.6910 will lead to a local rebound to 0.7035.
|
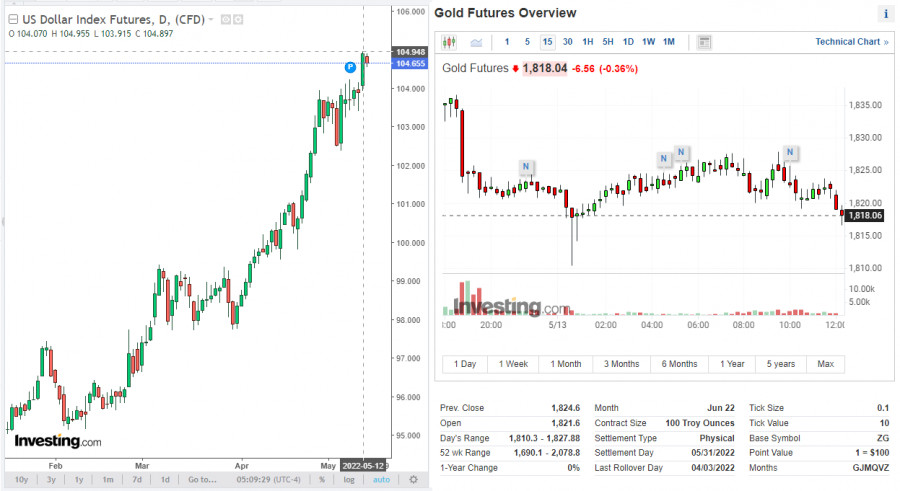
| XAU/USD heading towards recent balance at 1,800.00 Posted: 13 May 2022 04:38 AM PDT On Thursday, after hitting a new high of 104.95 that was last seen in January 2003, the US dollar index is declining today, at least at the start of the session. At the time of publication, the DXY futures were trading near 104.65. Besides, some traders probably took profit on long positions on the US dollar on the last trading day of the week. The market also paid attention to the macroeconomic data from the US showing that inflation has slowed down in April. Thus, the consumer price index (CPI) rose by +0.3% in April (+8.3% in annual terms), exceeding the forecast by +0.2% and +8.1% respectively. Although growth was better than expected, it still slowed down from 1.2% and 8.5% in March. This was reported by the US Bureau of Labor Statistics on Wednesday. On Thursday, the BLS released a report on the US producer price index showing that the PPI fell from 11.5% to 11.0% in April (in annual terms). The core producer price index (core PPI) declined from 9.6% to 8.8% in April (in annual terms). The data turned out to be worse than expected (10.7% and 8.9% respectively) and lower than in the previous month. The results suggest that the Fed's aggressive policy has proven to be effective. Nevertheless, inflation in the US continues to rise, albeit at a slower pace. Fed Chairman Jerome Powell confirmed on Thursday that the central bank's main purpose is to regain control over inflation.Powell once again said that if the economic situation developed in line with expectations, then he would consider it appropriate to raise interest rates by 50 basis points at the next two meetings. "If things come in better than we expect, then we're prepared to do less. If they come in worse than we expect, then we're prepared to do more," Powell said. But since inflation is still running near 40-year highs, the Fed is likely to stick to a more aggressive approach in the future. Yesterday, the Senate approved Jerome Powell for a second term as Federal Reserve Chairman. This is another confirmation that the Fed will continue to actively fight accelerated inflation. As long as it remains at its peak levels in the past 40 years, a further rate hike shall be expected. Since the difference in the monetary policies of the Fed and other major central banks will only increase, the US dollar and, accordingly, DXY is set to rise further. It may soon break through the 105.00 level and head towards the 110.00 mark. This is where the US dollar index futures were trading 20 years ago.
Meanwhile, as the US dollar is gaining ground, gold and, accordingly, the XAU/USD pair is depreciating. As you know, gold produces no return and is mainly used by investors as a hedging tool against risks (inflationary, geopolitical, economic). However, the quotes of the precious metal are extremely sensitive to changes in the monetary policy of the world's largest central banks, primarily the Fed. When interest rates rise, gold prices tend to decline as the cost of purchasing and holding gold increases. In the current situation, investors seem to consider the Fed's policy first before investing in this precious metal. They even downplay geopolitical and inflationary risks and prefer the greenback as a safe-haven asset. At the time of writing, XAU/USD was trading near the 1,821.00 level, moving inside the descending channels. The lower boundary of the descending channel is located between 1,800.00 and 1,785.00 on the daily chart. The last time XAU/USD was seen near these levels was in February 2022 when the price surged to a multi-year high of 2,070.00 shortly after. If the downtrend continues, which seems very likely, the next downward targets for gold will be the levels of 1,800.00 and 1,785.00.
|
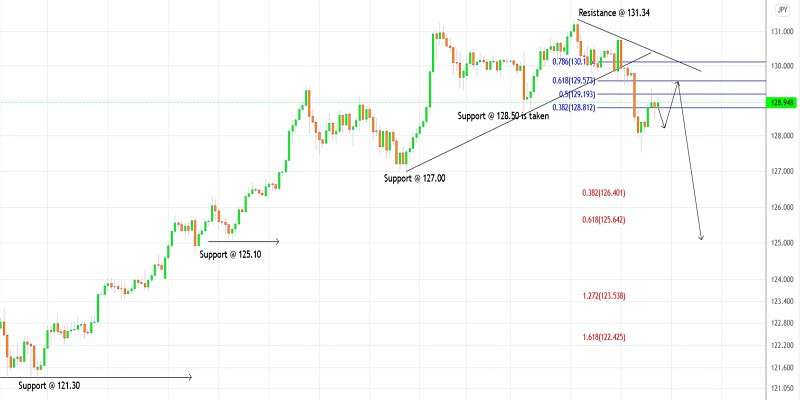
| Trading plan for USDJPY on May 12, 2022 Posted: 13 May 2022 04:37 AM PDT
Technical outlook:USDJPY might have carved a formidable top around 131.34 this week as prices are slipping to initial support seen at 128.50. The currency pair has broken below its immediate trend line support and also taken out the initial price at 128.50 carving a clear downward cycle. Prices have pulled back to 129.00 as expected and could reach 129.50-60 soon. USDJPY has carved a meaningful lower degree downswing between the 130.80 and 127.51 levels in the past two trading sessions. Ideally, the pair is retracing the above drop. The potential remains for a test of 129.50 before resuming lower again. The currency pair is facing an immediate price resistance at 130.80 and pullbacks should remain capped lower. Also, note that the Fibonacci 0.618 retracement of the recent drop is passing through 129.57 levels. The high probability remains for a turn lower if prices manage to reach there as bears remain poised to be back in control thereafter. The downside target potential in the near term is towards 125.60 and 122.40 levels respectively. Trading plan:Potential drop through 122.50 against 132.00 Good luck! The material has been provided by InstaForex Company - www.instaforex.com |


| You are subscribed to email updates from Forex analysis review. To stop receiving these emails, you may unsubscribe now. | Email delivery powered by Google |
| Google, 1600 Amphitheatre Parkway, Mountain View, CA 94043, United States | |


Comments