Forex analysis review
Forex analysis review |
- May 30, 2022 : EUR/USD daily technical review and trading opportunities.
- May 30, 2022 : EUR/USD Intraday technical analysis and trading plan.
- May 30, 2022 : GBP/USD Intraday technical analysis and significant key-levels.
- Bitcoin heading for new highs as expected
- USD/CAD: downside continuation activated
- Trading Signal for BITCOIN (BTC/USD) on May 30-31, 2022: buy above $29,565 (21 SMA - symmetrical triangle)
- GBP/USD: attention at resistance area
- Trading Signal for GBP/USD on May 30-31, 2022: buy above 1.2610 (200 EMA - rising wedge)
- EURUSD upward campaign gains momentum
- Trading Signal for EUR/USD on May 30-31, 2022: buy above 1.0742 (21 SMA - uptrend channel)
- USD/JPY: falling wedge reversal pattern
- JPMorgan experts believe in blockchain
- GBP/USD: plan for US trade on May 30. Buyers of GBP may break 1.2663
- Gold bearish below 1,826 static resistance
- Key Asian stock indices up by 0.6–2.2%
- EUR/USD. Preliminary results of the EU summit, the growth of German inflation and COVID-relief in China
- AUD/USD Technical Analysis and Trading Tips on May 30, 2022
- Forecast for GBP/USD on May 30. Bull traders everywhere are thinking about new purchases
- AUD/USD: growth towards 0.7240, 0.7270
- EUR/USD ignores 1.0757 key resistance
- Dollar decline supports GBPUSD rally
- GBPUSD approaches short-term resistance as up trend is weakening.
- BTC update for May 30,.2022 - Breakout of the downside channel
- Technical analysis recommendations on EUR/USD and GBP/USD for May 30, 2022
- Analysis of Gold for May 30,.2022 - Breakout of the upside channel and potential for the bigger drop
| May 30, 2022 : EUR/USD daily technical review and trading opportunities. Posted: 30 May 2022 12:59 PM PDT
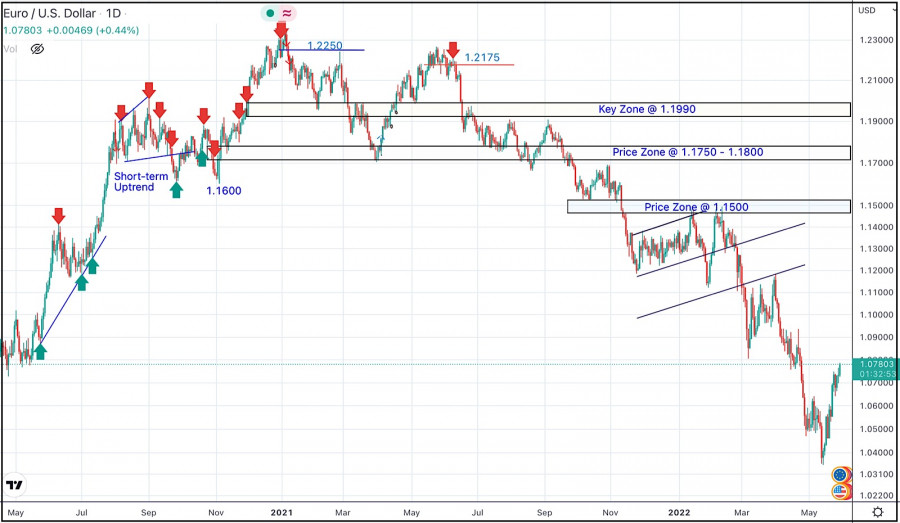
In late September, Re-closure below the price level of 1.1700 has initiated downside-movement towards 1.1500 where some recovery was witnessed. Shortly after, Price levels around 1.1700 managed to hold prices for a short period of time before another price decline took place towards 1.1200. Then the EURUSD has temporarily moved-up within the depicted movement channel until downside breakout occurred recently. Since then, the price zone around 1.1500 has applied significant SELLING pressure when a valid SELL Entry was offered upon the previous ascending movement towards it. Shortly after, the EURUSD looked oversold while approaching the price levels of 1.0800. That's where the recent upside movement was previously initiated. That's why, the recent movement towards 1.1200 was considered for another SELL Trade which is already running in profits now. The current ascending movement above 1.0600 enabled further advancement towards 1.0850 where bearish rejection can be applied The material has been provided by InstaForex Company - www.instaforex.com |
| May 30, 2022 : EUR/USD Intraday technical analysis and trading plan. Posted: 30 May 2022 12:59 PM PDT
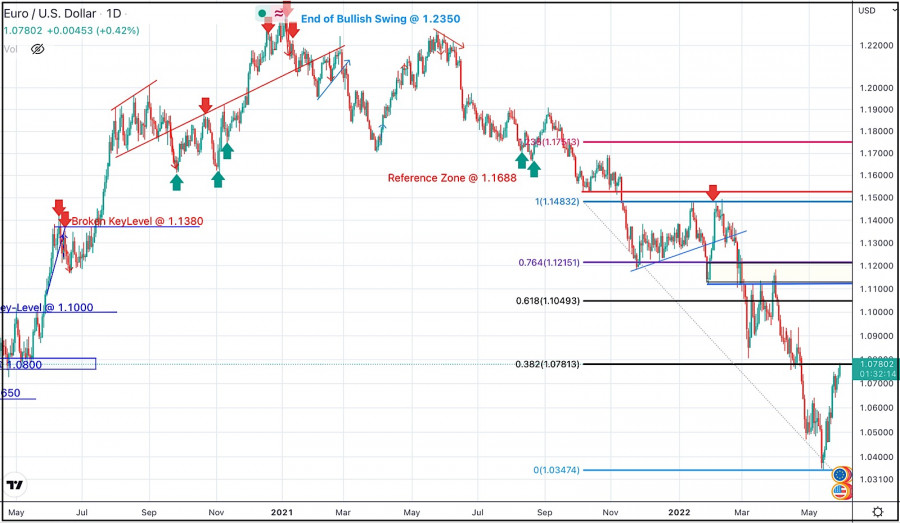
A short- term sideway movement was demonstrated within the highlighted zone around 1.1600 before quick bearish decline could occur towards 1.1200. On the other hand, the price zone around 1.1500 - 1.1600 remained a reference zone that applied significant bearish pressure upon two successive bullish visits before another bearish continuation sign was expressed. Hence, downside movement proceeded towards 1.1000 then 1.0920 where short-term bullish pullback was initiated. The price levels around 1.1150 hindered further bullish movement before another bearish move was aggressively expressed towards 1.0500. Failure to persist below the newly-recorded LOW at 1.0350 enabled another bullish pullback towards 1.0800 where bearish trades can be offered. The material has been provided by InstaForex Company - www.instaforex.com |
| May 30, 2022 : GBP/USD Intraday technical analysis and significant key-levels. Posted: 30 May 2022 12:41 PM PDT
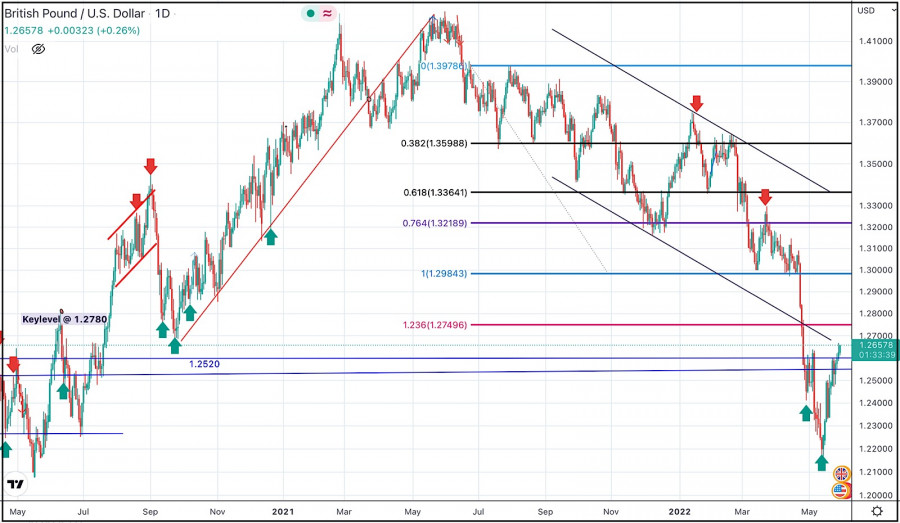
The GBPUSD pair has been moving within the depicted bearish channel since July. Sideway movement was expressed above 1.3600 while the price levels around 1.3730 - 1.3800 were considered as they offered significant bearish rejection. The short-term outlook turned bearish when the market went below 1.3600. This enhanced the bearish side of the market towards 1.3200 which brought the pair back towards 1.3600 for another re-test. Hence, the recent bullish pullback towards 1.3600 should have been considered for SELL trades as it corresponded to the upper limit of the ongoing bearish channel. Shortly after, Bearish persistence below 1.3360 enabled bearish continuation towards 1.2980 - 1.3000. Bullish rejection has arised many times around 1.3000 standing as a significant Daily Support. This happened before another bearish decline could take place earlier last week. Another bearish breakout below 1.2980 has enabled quick bearish extension towards 1.2600-1.2550 where some bullish recovery and a short-term sideway movement could be established before another downside movement was expressed. Previous bearish decline was expected to extend towards 1.2100 where bullish reversal could be expected. However, considerable bullish rejection was expressed around 1.2200. Currently, bullish breakout above 1.2550 is needed to abolish the short-term bearish scenario and may enable quick bullish advancement towards 1.2750, 1.3300 and probably 1.3600 if sufficient bullish momentum is maintained. Otherwise, the GBP/USD pair remains under bearish pressure to challenge the new low around 1.2150 again. Hence, any bearish reversal signs around 1.2550 should be considered for SELLING the pair. The material has been provided by InstaForex Company - www.instaforex.com |
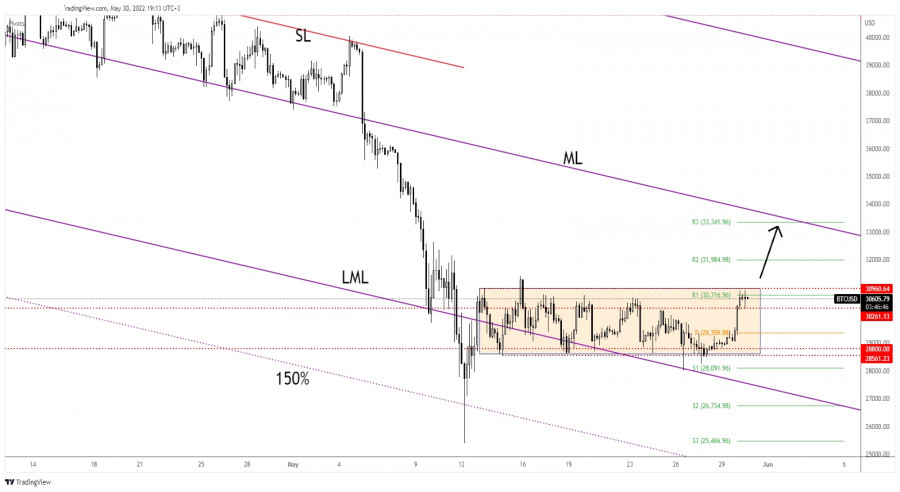
| Bitcoin heading for new highs as expected Posted: 30 May 2022 10:03 AM PDT The price of Bitcoin rallied after dropping as much as 28,003 in the last week. Now, it is trading at 30,580 at the time of writing. BTC/USD increased as much as 10.36% from last week's low of 28,003 to 30,903 today's high. The current rally helped the altcoins to grow as well. Still, a larger growth needs strong confirmation. In the last 24 hours, BTC/USD is up by 4.46% and by 0.48% in the last 7 days. BTC/USD Above 30,000 Psychological Level!
You knew from my analyses that BTC/USD could jump higher as long as it stays above the 28,800 - 28,561 area. I've told you that the false breakdown with great separation signaled exhausted sellers and a potential bullish momentum. Now, it stands above 30,261 broken resistance and below the immediate upside obstacle represented by 30,960. Escaping from the current extended range could bring new trading opportunities. BTC/USD Outlook!Making a valid breakout above 30,960 could activate further growth towards the median line (ML). This scenario could bring new buying opportunities. The material has been provided by InstaForex Company - www.instaforex.com |
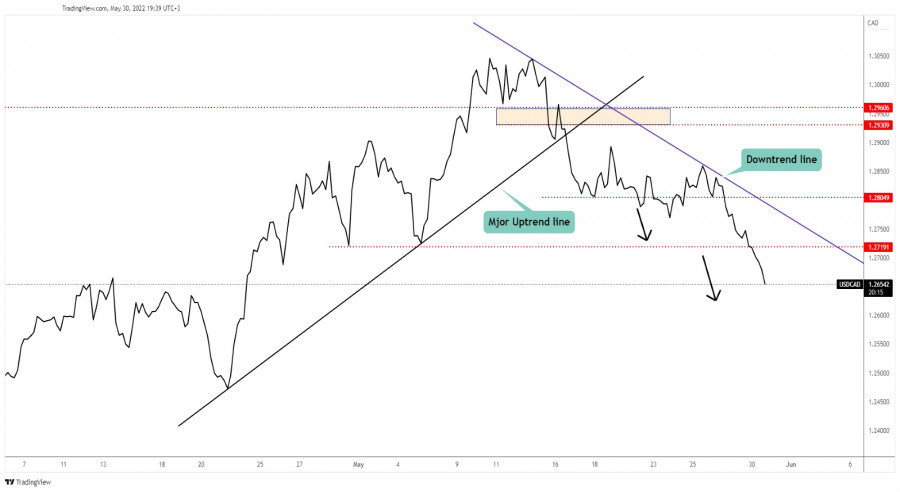
| USD/CAD: downside continuation activated Posted: 30 May 2022 10:02 AM PDT
USD/CAD Massive Drop!The USD/CAD pair is dropping like a rock and it seems unstoppable. You knew from my analyses that the price could drop deeper after falling below 1.2804 former low. In the short term, it has moved sideways before resuming its downside movement. Personally, I've drawn a downtrend line. The price could approach and reach fresh new lows as long as it stays under this line. The 1.2719 represented a static downside obstacle. Ignoring this level signals strong sellers. USD/CAD Trading Conclusion!USD/CAD activated more declines after dropping below 1.2719 former low. After its massive drop, we cannot exclude minor rebounds. A minor growth could help the sellers to catch a new downside movement. 1.2600 psychological level could represent a potential downside obstacle and target. The material has been provided by InstaForex Company - www.instaforex.com |
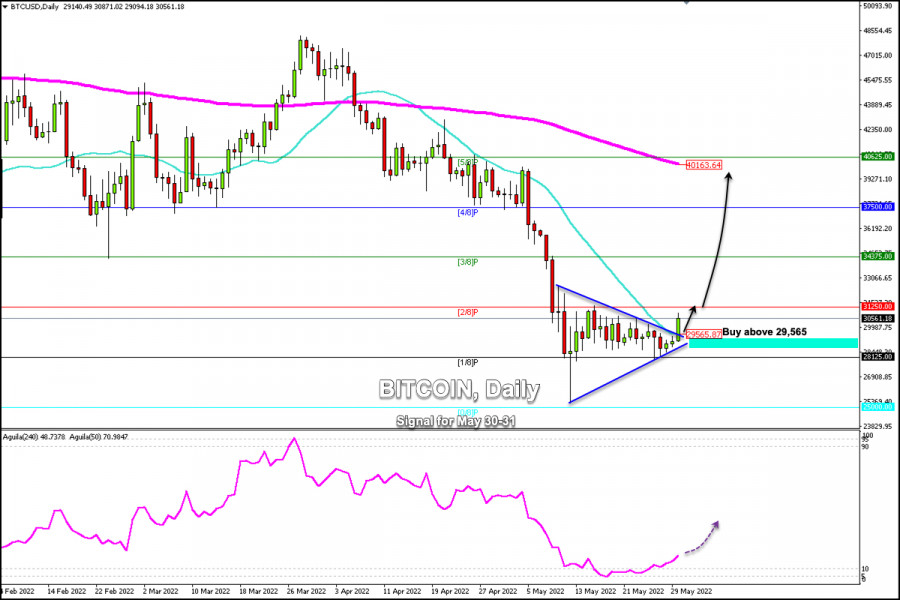
| Posted: 30 May 2022 09:29 AM PDT
BTC plummeted from an all-time high of $68,977 to $25,259 between Nov 07, 2021, and May 05, 2022, losing more than 60%. According to the weekly charts, the latest drop was supported by the 200 EMA located at 26,978. Meanwhile, a consolidation is observed in the form of lows and highs around the psychological level of 30,000. According to the daily chart, we can see that Bitcoin has formed a symmetrical triangle pattern that was broken earlier this week. Currently, it is trading above the 21 SMA located at 29,565 with a slightly bullish bias but strong resistance at 2/8 Murray around 31,250. If the trend of Bitcoin continues in the next few hours and it consolidates above 2/8 Murray around 31,250, this price action could encourage an upward movement and BTC could quickly reach 34,375 (3/8 Murray) and even move towards the EMA 200 around 40,163. The eagle indicator is giving a positive signal after having reached oversold levels on May 13. Currently, the signal could favor the recovery of Bitcoin which will give us an opportunity to buy in the next few hours while it remains above the psychological level of $30,000. The material has been provided by InstaForex Company - www.instaforex.com |
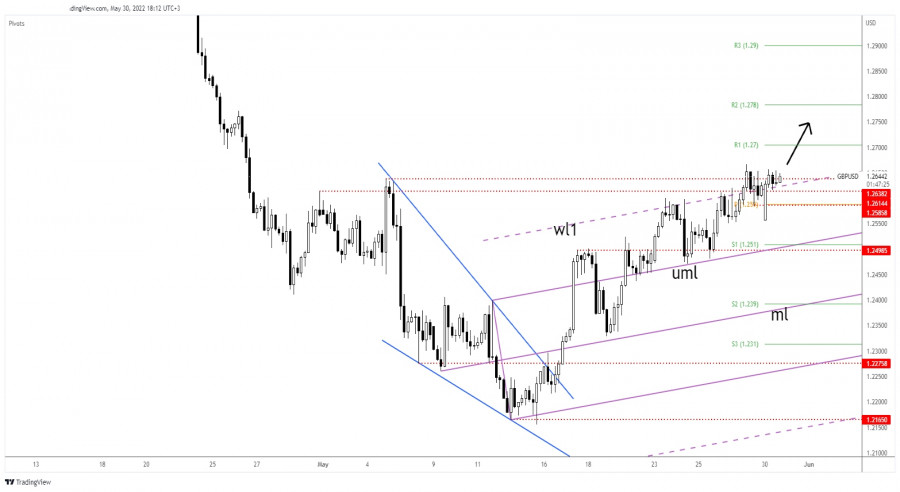
| GBP/USD: attention at resistance area Posted: 30 May 2022 08:56 AM PDT The GBP/USD pair rallied at the time of writing as the Dollar Index could come back down anytime despite the temporary rebound. You already know from my analyses that the pair is bullish and that we may have a long opportunity soon. Fundamentally, the US data came in mixed on Friday. The Revised UoM Consumer Sentiment, Prelim Wholesale Inventories, and Personal Income came in worse than expected. Personal Spending and Goods Trade Balance reported better than expected data, while the Core PCE Price Index came in line with expectations. At the time of writing, FOMC Member Waller's remarks about inflation and rate hike brought some volatility and strong moves. GBP/USD Upside Continuation In Cards!
GBP/USD registered only a false breakdown below 1.2585 immediate low and now it tries to jump towards fresh new highs. It challenges the 1.2638 former high which stands as a key resistance. I've told you that the bullish remains bullish after testing and retesting the 1.2498 level. Now, it has ignored the warning line (wl1) and the 1.2614 - 1.2638 area signaling strong buyers. GBP/USD Forecast!Closing and stabilizing above the 1.2638 followed by a new higher high, a bullish closure above 1.2666 may activate an upside continuation and could bring new long opportunities with potential targets at R1, R2, and R3. The material has been provided by InstaForex Company - www.instaforex.com |
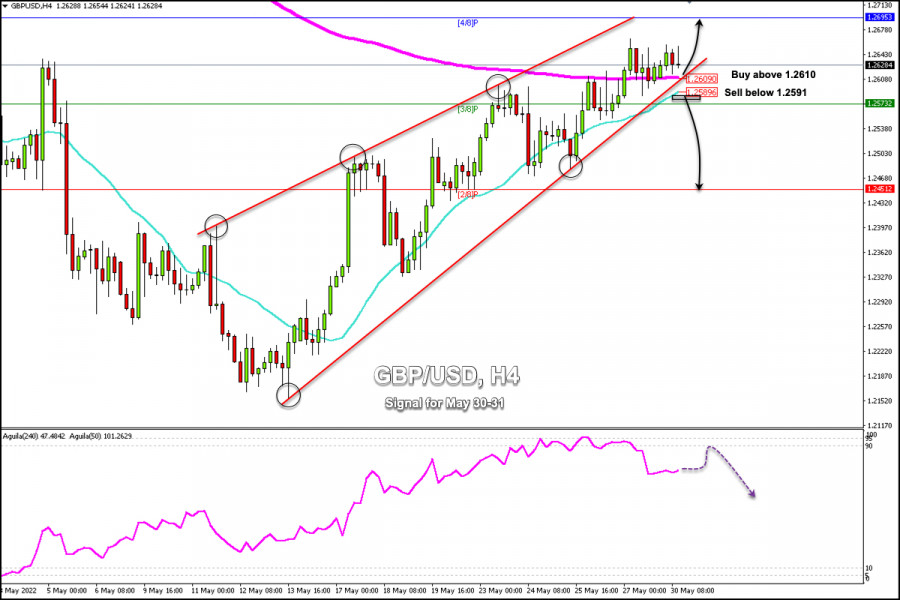
| Trading Signal for GBP/USD on May 30-31, 2022: buy above 1.2610 (200 EMA - rising wedge) Posted: 30 May 2022 08:49 AM PDT
Early in the American session, the British pound is trading above the 200 EMA located at 1.2609 and above the 21 SMA located at 1.2589. According to the 4-hour chart, we can see a strong bullish trend and GBP/USD is likely to hit 4/8 Murray at 1.2695 in the next few hours. At the fundamental level, some favorable data could support the British pound in its uptrend. In China, it has relaxed restrictions on both Shanghai factories and Beijing residents. This is good news, which weighs on the US dollar, which could encourage the upward momentum of GBP/USD in the coming days. On the other hand, since last week, we can see that the market sentiment has changed to positive which is reflected in the Wall Street indices. This means that investors prefer to invest in risky assets such as currencies, indices as well as cryptocurrencies, which leave behind the refuge asset that is the US dollar. At a technical level, according to the 4-hour chart, we can see that the British pound on May 25 has reached the overbought zone. A technical correction in the next few hours is expected towards 1.2609 or 1.2589, for a technical bounce which could resume the uptrend. On the contrary, with a close below the 21 SMA on the daily chart, we could expect a drop towards 2/8 Murray located at 1.2451. For this, we must wait for a consolidation and a break of the uptrend channel. We can also note that a rising wedge pattern is in progress. If it is confirmed by a break below 1.26. the price could accelerate a drop and could reach 61.8% around 1/8 Murray at 1.2329. Our trading plan for the next few hours is to buy the British pound as long as it remains trading above the 200 EMA located at 1.2610, with targets at 1.2661 and 1.2695 (4/8 Murray). The eagle indicator is giving a positive signal which supports our bullish strategy. The material has been provided by InstaForex Company - www.instaforex.com |
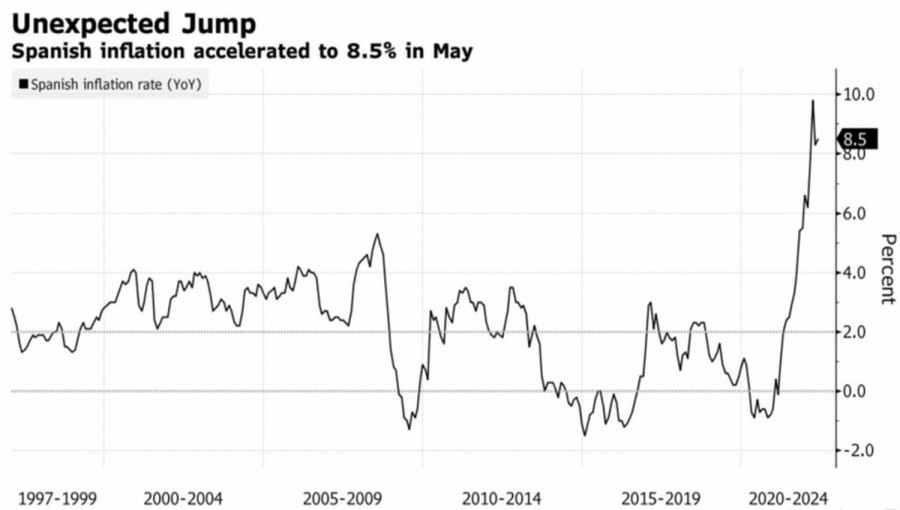
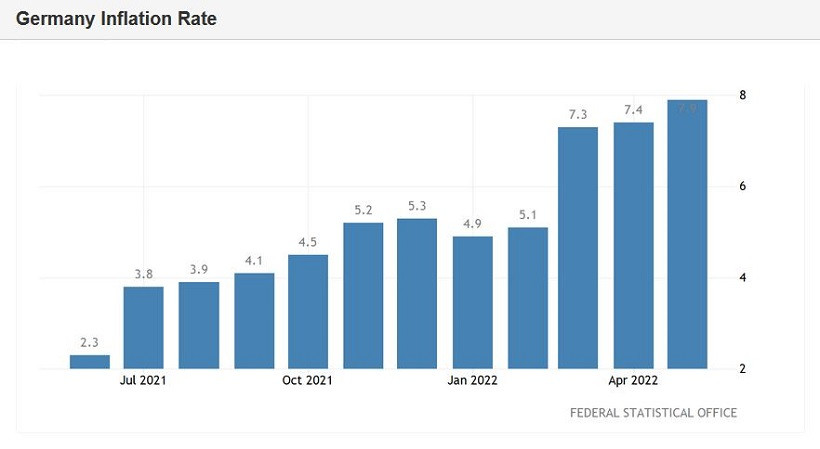
| EURUSD upward campaign gains momentum Posted: 30 May 2022 08:37 AM PDT The single European currency is tearing up and rushing, and yesterday's "doves" of the ECB are making titanic efforts to pacify buyers of EURUSD. Philip Lane, chief economist of the European Central Bank, said that the tightening of monetary policy will go gradually, and the increase in the deposit rate by 25 bps in July, and then by the same amount in September, is a kind of benchmark pace. However, when the euro locomotive has already gained momentum, it is very difficult to stop it. The rise of the main currency pair to 5-week highs was due to the general weakness of the US dollar, as well as the "hawkish" rhetoric of the ECB plenipotentiaries. First, ECB President Christine Lagarde gave food for thought about the imminent start of the process of monetary restriction, announcing the withdrawal of the deposit rate from the negative area by the end of the third quarter, now Lane confirmed her plan. And he did it more specifically than Lagarde, indicating exactly when and how much borrowing costs will increase. In the interval between the speeches of the head of the ECB and the chief economist, the "hawks" pulled the blanket over themselves. Austria's central bank chief Robert Holzmann insisted on raising the rate by 50 bps at once in July, arguing that any other solution would be weak. His colleague from the Netherlands, Klaas Knot, has made a big step dependent on incoming data. And if the Spanish inflation did not disappoint the EURUSD bulls, soaring from 8.3% to 8.5% in May, the German one managed to stay below 8%. And this circumstance can cool the ardor of euro fans. Dynamics of Spanish inflation
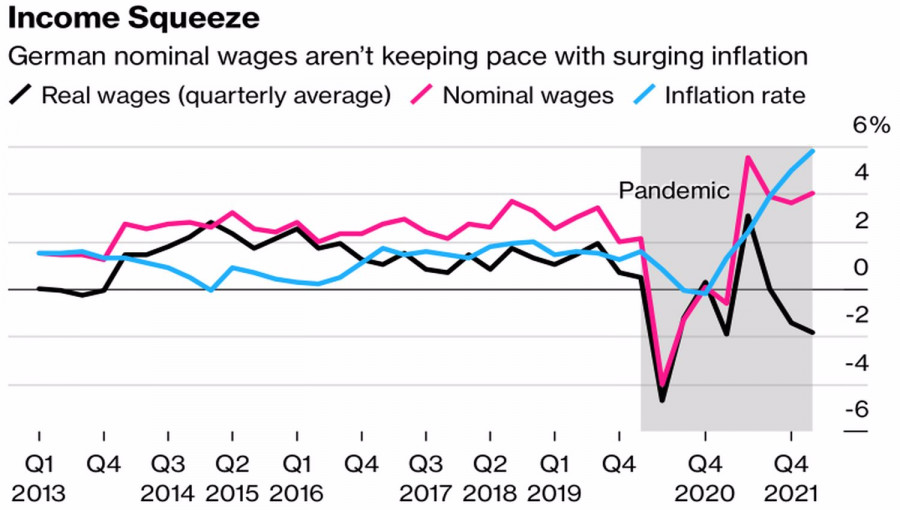
In my opinion, the upward movement of EURUSD is based on Greed. Investors received good news from the ECB, from China, which is gradually coming out of lockdowns, and from the main US stock indices, which rose by at least 6% by the end of the week by May 28. Improving global risk appetite is calling up the single European currency. Its fans have forgotten that the Governing Council's task is much more difficult than that of the FOMC. In Europe, a significant part of the increase in inflation is due to rising energy prices. Moreover, the process can be accelerated. The negotiated average wage in Germany fell by 1.8% in the first quarter. The nominal figure rose by 4%, but inflation grew even faster. German trade unions are demanding higher wages, while in the iron and steel industry we are talking about 8.2%. Dynamics of German inflation and wages
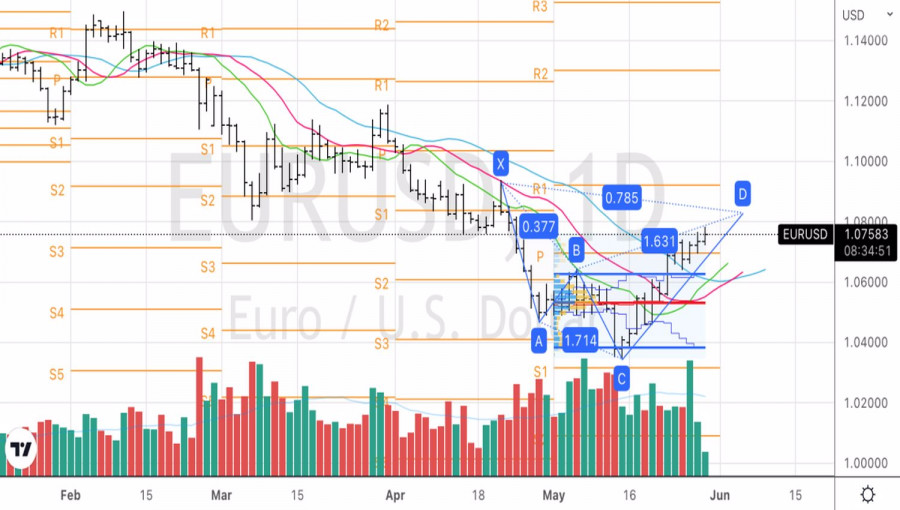
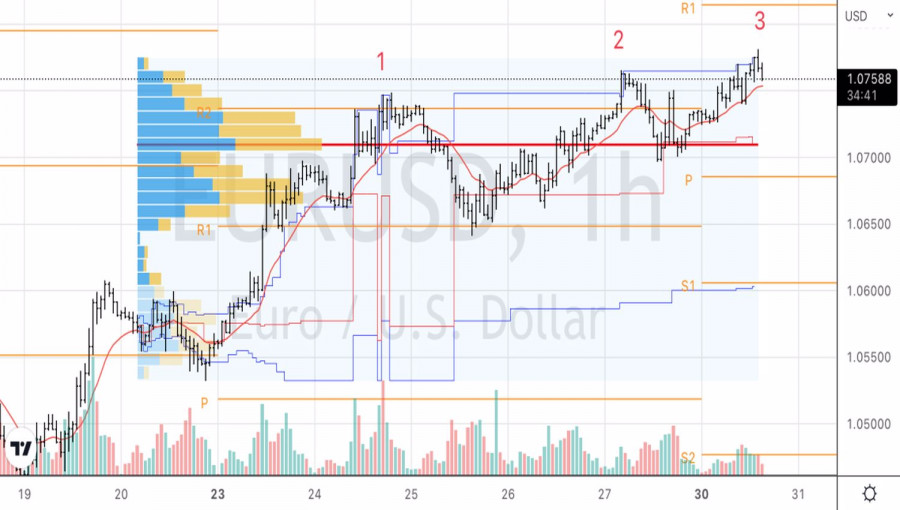
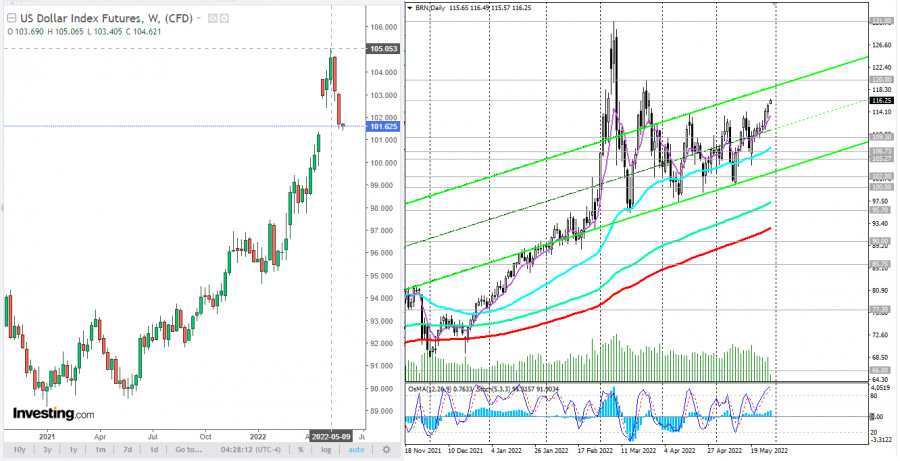
If an increase in labor costs is added to the energy crisis, inflation in the eurozone could jump to 10% or more. In such a situation, the ECB will either have to follow the path of the Bank of England, talking about a balanced approach, or aggressively raise rates. In the first case, the euro will fall; in the second, it most likely will grow. Technically, the upward movement of EURUSD in the direction of the target at 88.6% according to the Shark pattern and the pivot point at 1.083 continues. A rebound from resistance may be the basis for sales. There is a Three Indians pattern on the hourly chart. A fall below 1.0735 is a reason to open shorts. EURUSD, Daily chart
EURUSD, Hourly chart
|
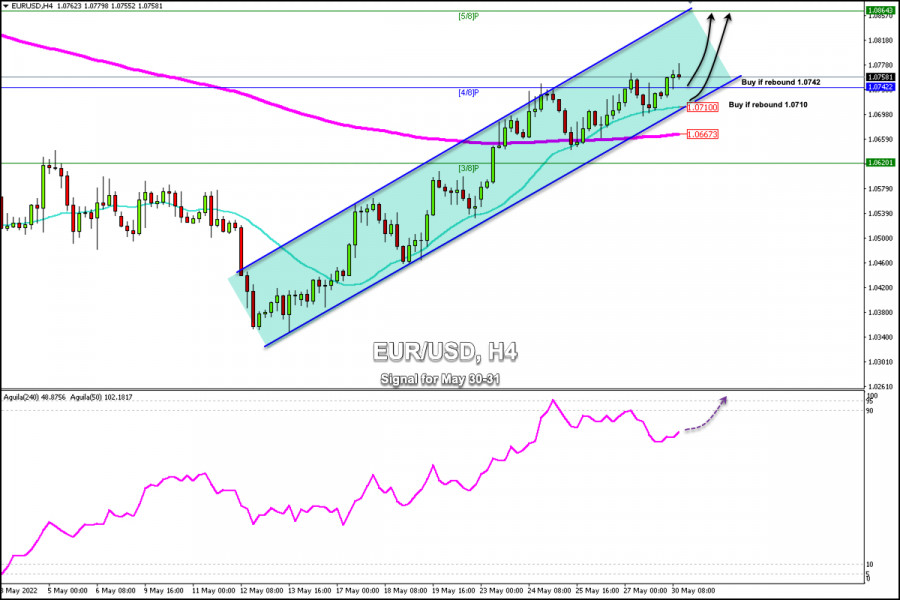
| Trading Signal for EUR/USD on May 30-31, 2022: buy above 1.0742 (21 SMA - uptrend channel) Posted: 30 May 2022 08:04 AM PDT
Early in the European session, the EUR/USD pair extended the bullish run and reached 1.07798, the highest level since April 25th. The pair remains in a strong uptrend supported by the 21 SMA, 200 EMA and because is trading within the bullish channel that remains intact. The euro is being helped by the persistent weakness of the US dollar. The US currency was affected last week by worse-than-expected local data and the latest FOMC meeting minutes, which suggest a possible pause in rate hikes after the increase in June and July. Early in the American session, the US dollar index is trading around 5/8 Murray, below the 200 EMA and the 21 SMA. If this downtrend continues, it is likely to benefit the euro which would lead it to reach the level of 1.8064 in the next few hours. According to the 4-hour chart, we can see an uptrend channel formed since May 12. This trend could continue if the euro consolidates above the 4/8 Murray in the coming hours or above the 21 SMA located at 1.0710. Last week, the overbought signals, according to the eagle indicator, reached the 1.0742 area. However, the technical correction set the stage for a new rally in EUR. EUR/USD is likely to reach 1.0864 in the coming days for a new overbought signal. The secondary trend is bullish and it is being supported by the 200 EMA at 1.0667. A sharp break on the 4-hour chart and a close below 1.0667 could mean a technical correction and the price could drop towards the 61.8% Fibonacci around 1.0498. A good area is to wait for 4/8 Murray at 1.0742 to buy, with targets at 1.0864 (5/8). On the contrary, if the technical correction pressure pushes the price down to the 21 SMA around 1.0710, it will be an opportunity to buy with targets at 1.0780. So, it will be an opportunity to buy with targets at 1.0780 and 1.0864 (5/8 Murray). The material has been provided by InstaForex Company - www.instaforex.com |
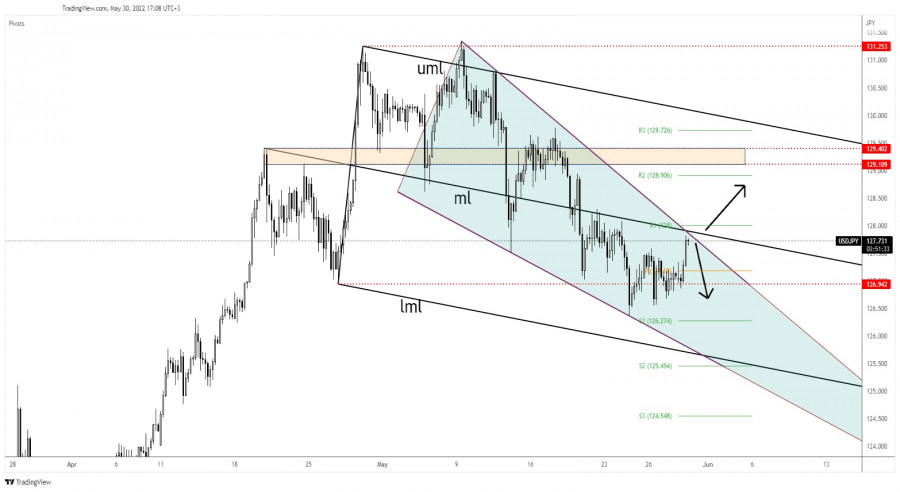
| USD/JPY: falling wedge reversal pattern Posted: 30 May 2022 08:02 AM PDT The USD/JPY pair rallied in the short term as the Dollar Index managed to rebound while the Yen was weakened by the Japanese Yen Futures drop. The price was located at 127.69 at the time of writing far above 126.36 last week's low. The currency pair went up, even though the US reported poor data last week. Tomorrow, the Japanese economic data could be decisive. Housing Starts could report a 2.5% growth, Consumer Confidence is expected at 33.9 points, Retail Sales could report a 2.6% growth, Unemployment Rate could remain steady at 2.6%, while the Prelim Industrial Production may report a 0.1% drop. The US CB Consumer Confidence may drop from 107.3 to 103.9, while the Chicago PMI and the HPI could come in worse compared to the last reporting period. USD/JPY At Resistance!
As you can see on the h4 chart, the price action developed a Falling Wedge pattern. Still, an upwards movement is far from being confirmed. Actually, the bearish pressure remains high as long as it stays under the downtrend line and below the median line (ml). Its false breakdowns below 126.94 former low signaled exhausted sellers. Now, it has rebounded, but it's premature to talk about a larger growth. Only a valid breakout above the near-term resistance levels could signal more gains. USD/JPY Outlook!Jumping, closing, and stabilizing above the 128.00 psychological level activate further growth. Failing to reach and retest the downtrend line and the median line (ml), or registering only false breakouts above these levels could announce a new sell-off at least towards the 126.94. Personally, I would like to see a new sell-off before the USD/JPY pair confirms the Falling Wedge pattern. The material has been provided by InstaForex Company - www.instaforex.com |
| JPMorgan experts believe in blockchain Posted: 30 May 2022 07:57 AM PDT While Bitcoin is stabilizing and investors expect the asset to hit the bottom, experts at JPMorgan are fueling audience interest by stating that the use of blockchain in finance will grow as the crypto sector grows. The bank said it not only wants to make sure this happens but also to start providing related services focused on cryptocurrency in the future. Currently, the investment bank is using blockchain for some type of settlement, allowing its clients to provide a wider range of assets as collateral and to trade outside of market hours. In addition to derivatives trading, JPMorgan said it planned to expand tokenized collateral to include stocks, bonds, and other most attractive assets. This shows that the financial giants, which recently rejected and opposed blockchain and digital money, are trying to catch up and make their commissions, as they have done for decades.
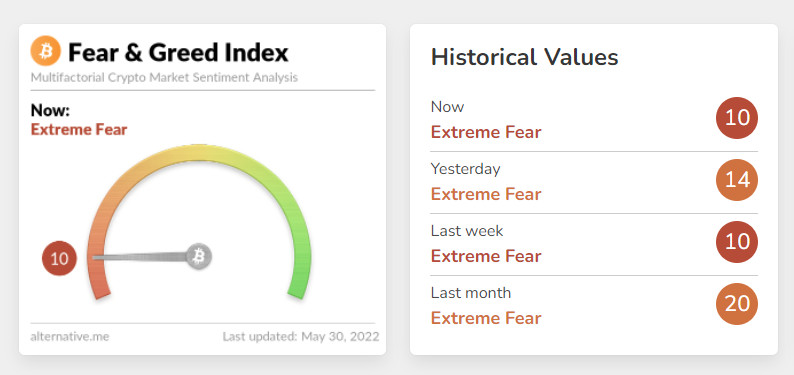
The head of JPMorgan Blockchain Launch and Onyx Digital Assets says that since the development of blockchain, the bank has had the idea of becoming a bridge connecting institutional investors with DeFi platforms in the crypto economy. The bank is expected to provide the first test accesses for a number of clients to touch the DeFi sphere in the near future. In February 2022, JP Morgan also announced the opening of the Onyx by JP Morgan. The bank has valued the meta-universe as a trillion-dollar revenue opportunity from advertising and social commerce. Although JPMorgan CEO Jamie Dimon is skeptical about Bitcoins and cryptocurrencies, he is optimistic about blockchain. "Decentralised finance and blockchain are real, new technologies that can be deployed in both public and private fashion, permissioned or not," Dimon said. Last week, economists at JPMorgan published a report on the outlook for Bitcoin and cryptocurrencies, saying BTC has "significant growth potential." Whether this speaks to the real premise that the big players have already bought in well enough, and now it's just a matter of building up a social benchmark and new users wanting to touch the world of cryptocurrency, time will tell, but the existing industry is already sufficiently developed to do so. While buyers of Bitcoin are actively looking for the bottom and are gradually returning to the market after the largest sell-off, buying back swing lows, the level of investor fear has dropped again to the value of 10 points - this year's low. The lower that figure is and the less the market reacts to it, the sooner Bitcoin will reach the bottom and start a new growth cycle, which could definitely push the asset to $80,000.
As for the short-term prospects, it is obvious that there are no buyers willing to buy at the highs, near the upper boundary of the sideways channel of $30,700.Bulls need to be active near $31,800 to develop the growth, but before that, we should try to return above $30,700, which has been repeatedly tested in the past few weeks. Only fixing above this level will quickly take the trading instrument back to $33,030, allowing investors to breathe out. A breakthrough of $29,850 and another consolidation below this level is likely to take the asset back to the low of $28,600, and there it can easily reach $27,660, where the large buyers were active last week. As for the technical picture of Ethereum The asset has touched the bottom and rebounded from it. The recent drop made investors nervous, as the trading instrument was one step away from reaching a new yearly low of $1,700. Currently, when the asset is fixed above $1,800, the target is located at the resistance of $1,899, and it will be difficult to pierce this level. It will be possible to speak about building an uptrend only after the breakthrough of $2,020, which will quickly return ETH to $2,146, and it will be a serious problem for traders there because it is very close to $2,295. Only fixing above this level may allow building an uptrend on the trading instrument with the prospect of reaching new highs in the area of $2,433 and $2,630. In the case, that the pressure on ETH persists, it is possible to buy the coin near support of $1,805. If this level is broken through, the trading instrument may collapse to $1,690, but it is unlikely that traders will buy the asset near the bottom. I advise counting on the new lows: $1,540 and $1,430, where the big players will be active again. The material has been provided by InstaForex Company - www.instaforex.com |
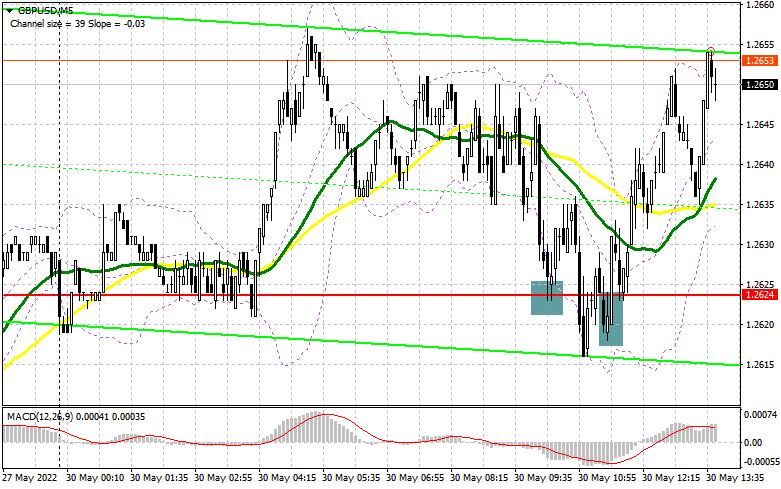
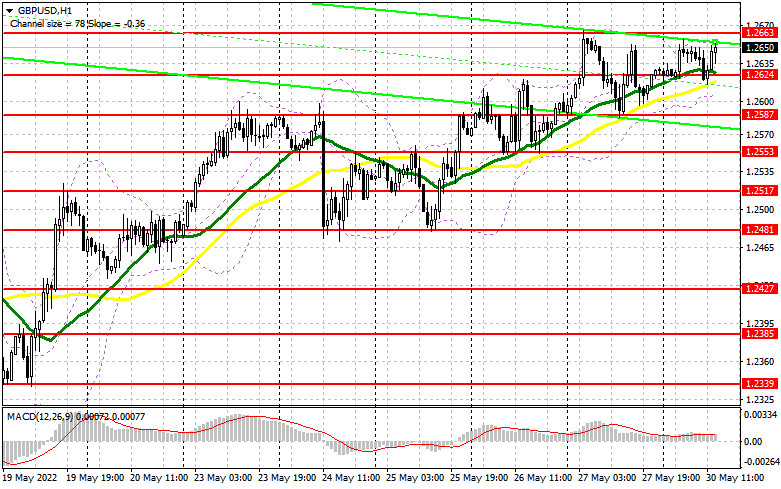
| GBP/USD: plan for US trade on May 30. Buyers of GBP may break 1.2663 Posted: 30 May 2022 07:14 AM PDT Earlier, I asked you to pay attention to the level of 1.2624 to decide when to enter the market. Let us take a look at the 5-minute chart to clear up the market situation. A decline and a false break of 1.2624 were quite expectable amid the absence of important macroeconomic data. As a result, traders got a perfect buy signal, which allowed the pair to climb by 30 pips. If you missed the first signal, you could have benefited from the second decline and a false break of 1.2624. From the technical point of view, the situation remained the same. Conditions for opening long positions on GBP/USD: Buyers are pushing the pound sterling to the upper limit of the triangle. The pair's direction depends on the break of this limit. The absence of macroeconomic reports and a federal holiday in the US may seriously affect the market volatility in the second part of the day. That is why I suppose that the British pound will hardly break the upper limit of the triangle and will enter a sideways channel of 1.2587-1.2663. Buyers should primarily protect the level of 1.2624. Only a false break of this level will give a long signal with the target at the weekly high of 1.2663. The pair may show a jump after it consolidates above 1.2663 and downwardly breaks it. In this case, the pound/dollar pair may reach new highs at 1.2709 and 1.2755, where it is recommended to lock in profits. A farther target is located at 1.2798. If the pound sterling declines and buyers fail to protect 1.2624, pressure on the pair will surge. In this case, it will return to 1.2587. Against the backdrop, it is better to be cautious when opening long positions. It will be wise to enter the market after a false break of this level. It is also possible to buy after a rebound from 1.2553 or lower – from 1.2517, expecting a rise of 30-35 pips within the day. Conditions for opening short positions on GBP/USD: Bears tried to break 1.2624, but all in vain. Nevertheless, at the end of the month, big players are likely to close their long positions, thus causing a correction. Bears should primarily protect the monthly high of 1.2663 and return to 1.2624. A false break of 1.2663 will create a perfect short signal with the target at 1.2624. A break and an upward test of this level will give an additional sell signal, allowing the pair to return to 1.2587 and then to 1.2553, where it is recommended to lock in profits. A farther target is located at a weekly low of 1.2517. However, even a break of this level will hardly stop the uptrend. It may just cool down buyers a bit. If the pound/dollar pair rises and bears fail to protect 1.2663, the price may surge. In this case, it is better to avoid short orders until the pair hits the next resistance level of 1.2709. There, it is possible to go short, but only after a false break. It is also possible to sell the asset after a bounce off the high of 1.2755 or higher – off 1.2798, expecting a drop of 30-35 pips.
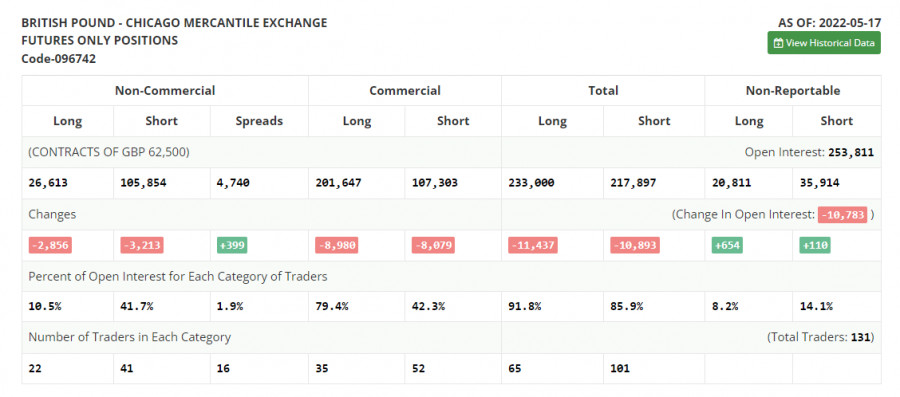
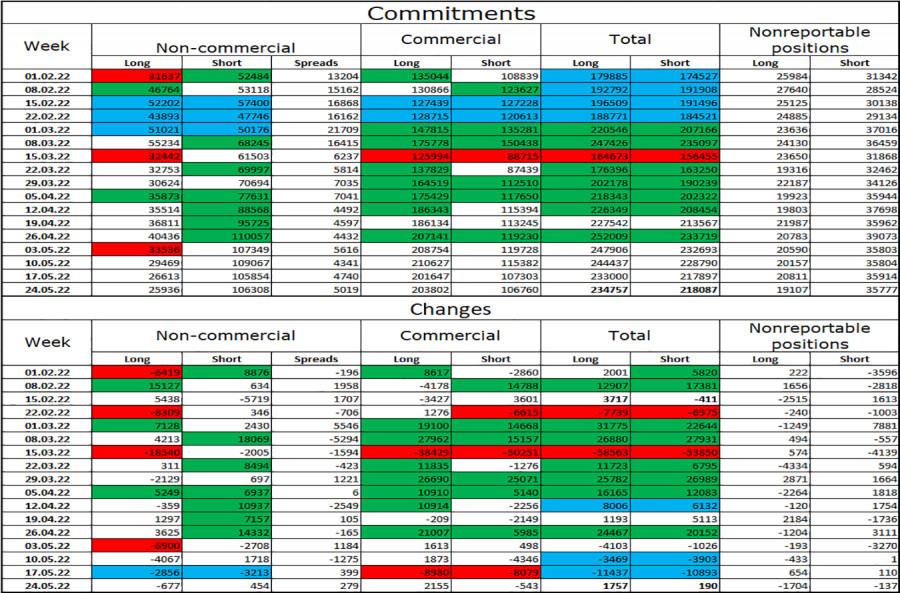
COT report According to the COT report from May 17, the number of both short and long positions dropped. This means that the market may reach the bottom and that traders are benefiting from attractive prices regardless of the uncertain situation in the UK. The fact is that the UK has faced several serious problems, including surging inflation and a slowdown in economic growth. Although the Bank of England is between two fires, Andrew Bailey emphasizes that the regulator will hardly stop raising the key interest rate in the near future. Meanwhile, the US Fed may change its mind. There are rumors that the US regulator is planning to pause the key interest rate hike as early as September. This will inevitably affect the US dollar. According to the COT report from May 17, the number of long non-commercial positions declined by 2,856 to 26,613, whereas the number of short non-commercial positions slumped by 3,213 to 105,854. As a result, the negative value of non-commercial net position decreased to -79,241 from -79,598. The weekly close price increased to 1.2481 from 1.2313.
Signals of indicators: Moving Averages Trading is performed slightly above 30- and 50-day moving averages, thus pointing to buyers' intention to push the pound sterling higher. Note: The period and prices of moving averages are considered by the author on the one-hour chart that differs from the general definition of the classic daily moving averages on the daily chart. Bollinger Bands If the pair grows, the resistance level will be located at the middle limit of the indicator at 1.2660. In case of a decline, the lower limit of the indicator located at 1.2610 will act as support. Description of indicators
|
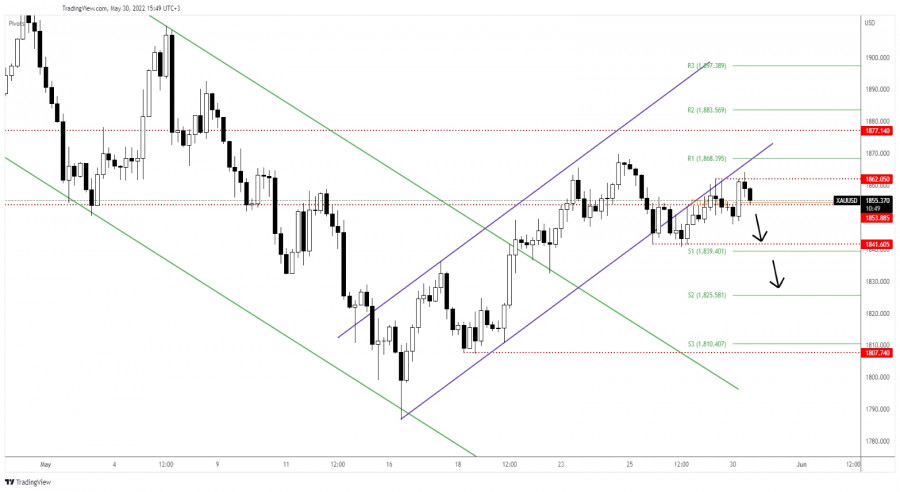
| Gold bearish below 1,826 static resistance Posted: 30 May 2022 06:49 AM PDT Gold is trading at 1,855 at the time of writing and it seems very heavy as the Dollar Index is trading in the green at 101.56 above 101.35 today's low. DXY's rebound could help the USD to appreciate, that's why the yellow metal could slip lower. The FOMC Member Waller's speech could bring some volatility later today. XAU/USD is still bullish after poor US economic data was reported last week. Tomorrow, the fundamentals will drive the price of Gold. XAU/USD Trading In The Red!
In the short term, XAU/USD is trapped between the 1,862 and 1,841 levels. As long as it stays under the 1,862 range's resistance, the yellow metal could come back down and it could activate a larger sell-off. Only a valid breakout above 1,862 and a new higher high could activate more gains and could invalidate the downside scenario. Gold Outlook!1,862 stands as immediate resistance, while 1,853 represents near-term support. Registering a valid breakout through one of these levels may bring new trading opportunities. A good buying opportunity could appear after jumping and stabilizing above the weekly R1 (1,868), while a good selling opportunity will be validated by a valid breakdown below 1,841. The material has been provided by InstaForex Company - www.instaforex.com |
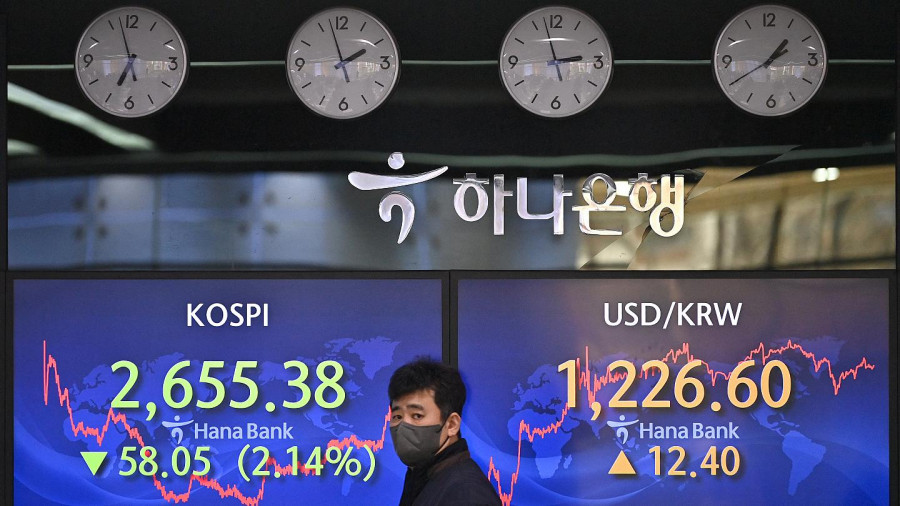
| Key Asian stock indices up by 0.6–2.2% Posted: 30 May 2022 06:44 AM PDT
Major stock indices in Asia posted an increase of 0.6-2.2%. The Chinese Shanghai Composite showed the lowest growth of only 0.6%, while Japan's Nikkei 225 advanced by as much as 2.19%. Other indices of the region posted gains within this range: China's Shenzhen Composite rose by 1.07%, Korea's KOSPI added 1.2%, Australia's S&P/ASX 200 advanced by 1.45%, and Hong Kong's Hang Seng Index increased by 2.08%. Investors' positive sentiment was mainly supported by a 1.8-3.3% rise in the US stock market. Over the past week, stocks have increased by 6% after declining for several months in a row. In addition, the Chinese authorities expect a swift recovery after the recent COVID-19 outbreak. Lockdown measures have already been eased in some regions. Thus, in Shanghai, city officials have announced an action plan consisting of 50 policy measures to boost the economy. They include state subsidies and tax incentives for business owners who were most affected by the quarantine measures. Among the components of the Hang Seng Index, the biggest gains were posted by Li Ning Co. (+10.2%), Haidilao International Holding Ltd. (+9.7%), Meituan (+7.8%), JD.com, and Anta Sports Products Ltd. (+5% and +4.5% respectively). Experts predict that consumption rates in China may surge after restrictive measures are lifted. The value of stocks in the tourism sector has already increased: Jinling Hotel went up by 10%, China Tourism added 3.8%, and Kweichow Moutai rose by 1.7%. Meanwhile, the Bank of Japan maintains its dovish stance on monetary policy and does not plan to raise interest rates despite rising inflation. The authorities stick to this policy to support the economy after the coronavirus pandemic. Among the components of the Nikkei 225 index, Sony was the biggest winner with a gain of 5%. Recruit Holdings was up by 6.7%, Fanuc rose by 4.5%, and CyberAgent Inc. gained 4.9%. Shares of other large companies in the country performed slightly worse, with SoftBank Group and Mitsubishi UFJ rising by just 0.4% and 0.2% respectively. Fast Retailing grew by 3.3% and Toyota Motor - by 2.4%. South Korea's largest companies, Samsung Electronics Co. and Hyundai Motor, recorded growth of 1.7% and 1.1% respectively. After LG Group announced that it would buy back 4% of its own shares worth 500 billion won ($400 million) by 2024, its share price immediately surged by 9.6%. Among the companies belonging to the S&P/ASX 200 index, Zip Co. was the leader as it added 11% at once. Other large companies also posted gains: Woodside Petroleum advanced by 4.3%, BHP rose by 2.5%, and Rio Tinto went up by 0.8%. After AGL Energy had abandoned the plan to split its business decisions, the value of its stocks decreased by 1.9%. Besides, the company announced that several executives will resign as soon as a replacement is found. The material has been provided by InstaForex Company - www.instaforex.com |
| Posted: 30 May 2022 06:34 AM PDT The euro/dollar pair is testing the resistance level of 1.0760 (the upper line of the Bollinger Bands indicator on the four-hour chart), after overcoming which traders will move to the next price barrier - the 1.0800 mark (the upper line of the Bollinger Bands on the daily chart). The current price increase is due to both the weakening of the dollar and the general strengthening of the single currency. Renewed risk appetite, a strong inflation report from Germany, and the preliminary results of the EU summit (in the context of the sanctions confrontation with the Russian Federation) - all these fundamental factors helped buyers of EUR/USD to test the above price threshold. The US currency was forced to retreat - there are no relevant arguments for the resumption of the southern trend. The market has already included a planned tightening of monetary policy (a 50-point rate hike in June and July) in current prices, while further prospects look vague, especially after the publication of the minutes of the last Fed meeting. But let's start with the German statistics. The data released today reflected a significant increase in inflation in Germany, which, as you know, is the "locomotive" of the European economy. All components of the release were released in the green zone. In annual terms, the overall consumer price index came out at around 7.9%, with growth forecast to reach 7.6%. This indicator has been growing consistently since February 2021, but in the spring of this year, it began to gain momentum sharply, exceeding the 7 percent mark and thereby updating the 48-year record. Every month, the indicator also exceeded the forecast values, ending up at 0.9% in May. The harmonized consumer price index similarly exceeded forecasts, both in monthly and annual terms. It is worth noting that German data quite often correlates with pan-European ones, so we can assume that the May inflation growth in the eurozone (the release is scheduled for May 31) will also be a breakthrough - once again. The EUR/USD pair was indirectly supported by political news. Today, it became known that the EU countries could not agree on an oil embargo on Russian oil. The ambassadors of the member states of the European Union did not agree on the sixth package of sanctions for Russia, which included a ban on Russian oil. The ambassadors of the EU countries gathered on Sunday before a special two-day EU summit, which will begin in Brussels tonight. As some experts have suggested, Hungary will agree to a proposal that includes a ban on Russian oil that is transported by sea, while preserving the supply of oil that is transported through the pipeline. The discussion of this issue with the Hungarian side was continued on Monday, but Budapest insisted on its position. It should be noted here that, according to Bank of America analysts, in the event of a sharp reduction in Russian oil exports, Brent may rise "significantly above" the $ 150 per barrel mark (today the price fluctuates in the range of 116-119). But according to the calculations of the Financial Times, the rejection of Russian energy resources will require the EU to spend approximately 195-200 billion euros. By the way, it is not only "black gold" that is getting more expensive: an abrupt increase in prices is recorded for both oil and gas, wheat, and non-ferrous metals. Therefore, today's (preliminary) results of the EU summit provided indirect support to the euro, since the Europeans de facto did not provoke a rally in the oil market. Concerns about stagflation eased somewhat (at least "at the moment"), and this fact allowed EUR/USD buyers to update the monthly high at 1.0780.The news from China also provided some support to the pair. Beijing and Shanghai are gradually lifting radical quarantine restrictions. In particular, the Chinese authorities have allowed 240 financial institutions in the 25-million-strong Shanghai to resume their work since June 1. Previously, almost 900 firms from about 1,700 large financial companies of the megalopolis were included in the "white list". However, despite the record growth of German inflation, as well as despite the increased craving for risky assets, buyers of EUR/USD could not even get close to the resistance level of 1.0800, let alone consolidate in the area of the 8th figure. Moreover, at the start of the American session, the pair returned to the 1.0760 mark. This suggests that traders doubt the prospects of the northern movement - they recorded profits as soon as they approached the border of the 8th price level.
In such conditions, longs look risky. Market participants have not yet decided on the vector of price movement. It's one thing to impulsively reach a certain level, and it's a completely different thing to hold the occupied positions, claiming further growth. As you can see, the resistance level of 1.0760 turned out to be "too tough" for EUR/USD bulls, so it is advisable to go into purchases only when the price is fixed above the target of 1.0800. But sales will be relevant if sellers can push through the support level of 1.0700 (the average line of the Bollinger Bands on the four-hour chart). At the moment, it is better to take a wait-and-see position, given the high degree of uncertainty - the pendulum can swing both towards the north and towards the south. The material has been provided by InstaForex Company - www.instaforex.com |
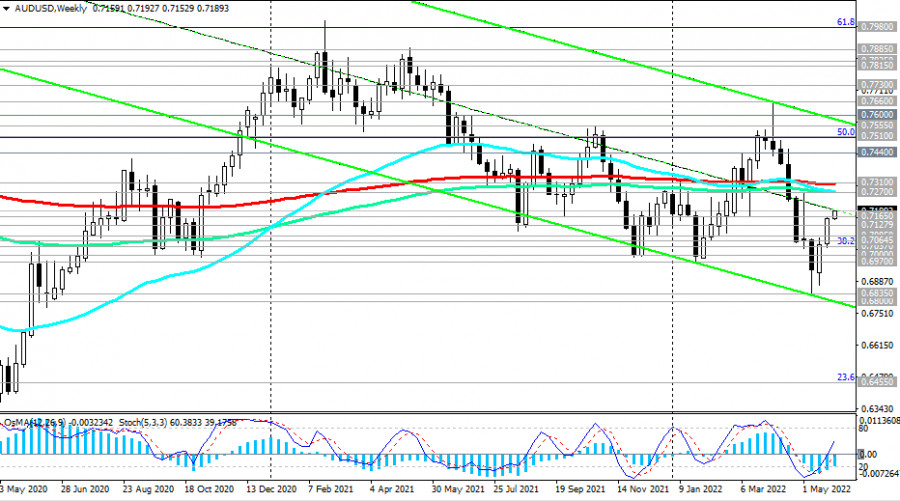
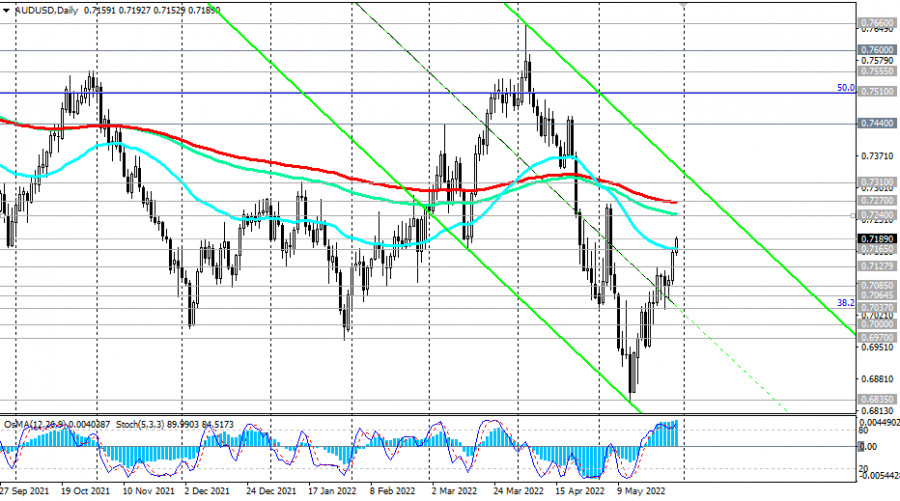
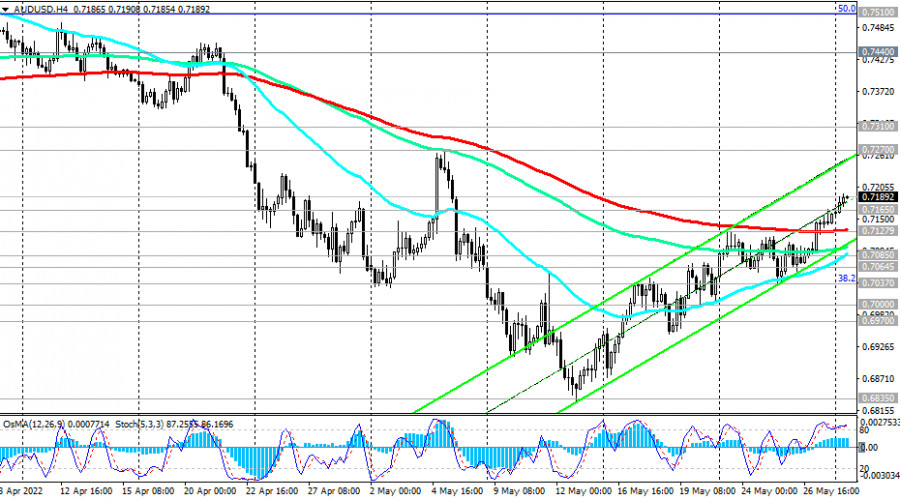
| AUD/USD Technical Analysis and Trading Tips on May 30, 2022 Posted: 30 May 2022 06:12 AM PDT As of this writing, AUD/USD is trading near 0.7190, up 32 pips from last week's closing price. The pair maintains positive momentum, tending towards key resistance levels 0.7240 (144 EMA on the daily chart), and 0.7270 (200 EMA on the daily chart).
Trading below these key resistance levels, AUD/USD remains in the bear market zone. Therefore, the breakdown of the important support level 0.7165 (50 EMA on the daily chart) will be the first signal for the resumption of short positions, and the breakdown of the important short-term support levels 0.7128 (200 EMA on the 4-hour chart), 0.7085 (200 EMA on the 1-hour chart) will be confirming.
In this case, AUD/USD will head deeper into the descending channels on the daily and weekly charts, the lower limit of which is near the 0.6800 mark.
In the alternative scenario, AUD/USD will continue corrective growth towards the resistance levels of 0.7240, 0.7270. Further growth and breakout of the key resistance level 0.7310 (200 EMA on the weekly chart, 50 EMA on the monthly chart) create prerequisites for growth to the long-term resistance level of 0.7600 (200 EMA on the monthly chart), which separates the long-term bull market from the bear market. A breakdown of the resistance level of 0.7650 (144 EMA on the monthly chart) may finally bring AUD/USD into the zone of a long-term bull market.
Support levels: 0.7165, 0.7128, 0.7085, 0.7064, 0.7037, 0.7000, 0.6970, 0.6800, 0.6450 Resistance levels: 0.7200, 0.7240, 0.7270, 0.7310, 0.7400, 0.7440, 0.7510, 0.7555, 0.7600, 0.7650 Trading Tips Sell Stop 0.7145. Stop-Loss 0.7210. Take-Profit 0.7128, 0.7085, 0.7064, 0.7037, 0.7000, 0.6970, 0.6800, 0.6450 Buy Stop 0.7210. Stop-Loss 0.7145. Take-Profit 0.7240, 0.7270, 0.7310, 0.7400, 0.7440, 0.7510, 0.7555, 0.7600, 0.7650 The material has been provided by InstaForex Company - www.instaforex.com |
| Forecast for GBP/USD on May 30. Bull traders everywhere are thinking about new purchases Posted: 30 May 2022 05:58 AM PDT
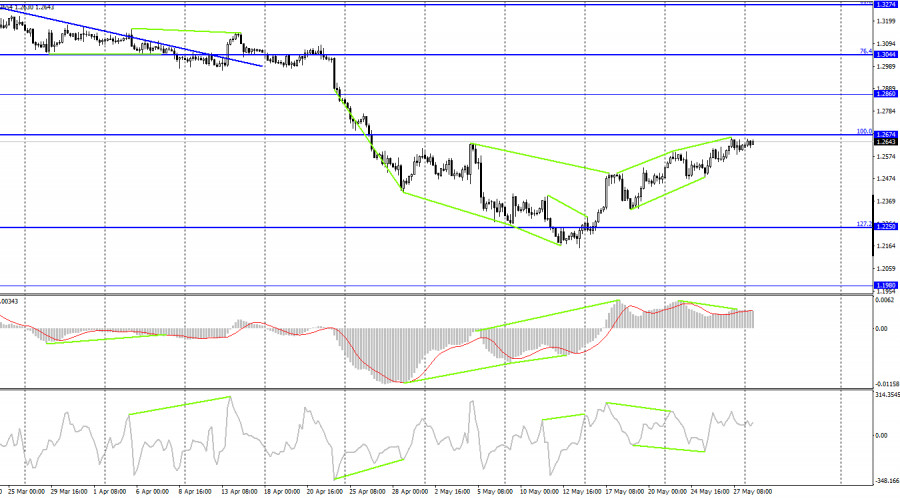
According to the hourly chart, the GBP/USD pair secured above the level of 1.2600, and then rebounded from it from above, which slightly increases the probability of further growth in the direction of the corrective level of 323.6% (1.2718). The upward trend corridor still plays an important role in determining the mood of traders and now characterizes it "as bullish". Nevertheless, in recent days, the pair has approached the lower line of this corridor, and this week bear trader may try to close under the corridor, which will work in favor of the US currency and a change in the mood of the players to bearish. In this case, the fall of the British dollar's quotes may begin in the direction of the Fibo level of 423.6% (1.2432). The pound has been moving in the same way as the European Union in the last two weeks. And it has as much news and support as a European. The euro has even more of them since the ECB started talking about raising the interest rate, and the Bank of England has already raised the rate four times, which did not help the pound in any way. I even assume that the factor of changing the rhetoric of the ECB and Christine Lagarde may have only a weak impact on bull traders. The graphical factor may have a greater impact on the growth of the euro and the pound. If you look at the daily chart, the growth of both currencies has been asking for a very long time. This week, there will be several important events that may even bring bears back to the market. First of all, we are talking about the report on the US labor market Nonfarm Payrolls. It will be released only on Friday, but on the eve of it, traders may already be slightly reducing their purchasing power. If the report is strong, it may give a new impetus to the US currency, which has not yet moved too far away from the level of 1.2146, where the fall of the British dollar ended last time. Thus, the downward trend may resume if there is closure under the corridor this week, and the information background will support the US currency. This conclusion is also true for the euro/dollar pair.
On the 4-hour chart, the pair performed a reversal in favor of the British after the formation of a "bullish" divergence at the CCI indicator. However, now the MACD indicator has formed a new "bearish" divergence, which allows us to count on a reversal in favor of the US currency and a slight drop in the direction of the corrective level of 127.2% (1.2250). The rebound of quotes from the corrective level of 100.0% (1.2674) will also work in favor of the beginning of the pair's fall, and closing above the level of 100.0% will increase the likelihood of further growth towards the next level of 1.2860. Commitments of Traders (COT) Report:
The mood of the "Non-commercial" category of traders has not changed too much over the past week. The number of long contracts in the hands of speculators decreased by 677 units, and the number of short contracts increased by 454. Thus, the general mood of the major players remained the same - "bearish", and the number of long contracts exceeded the number of short contracts four times as before. The big players continue to get rid of the pound and their mood has hardly changed over the past week. Thus, I expect that the pound may resume its decline over the next few weeks. Now the corridors on the hourly and 4-hour charts will be of great importance since such a strong discrepancy between the numbers of Long and Short contracts can also indicate a trend reversal. But there is no point in denying that speculators sell more than they buy. News calendar for the USA and the UK: On Monday, the calendars of economic events in the UK and America are empty. Today, the information background does not affect the mood of traders. GBP/USD forecast and recommendations to traders: I recommend selling the pound if there is a rebound from the level of 1.2674 on the 4-hour chart with targets of 1.2600 and 1.2432. Or if there is closure under the corridor on the hourly chart with the same goals. I do not recommend buying a pound yet, as a fall may begin in the next couple of days due to divergence on the 4-hour chart. The material has been provided by InstaForex Company - www.instaforex.com |
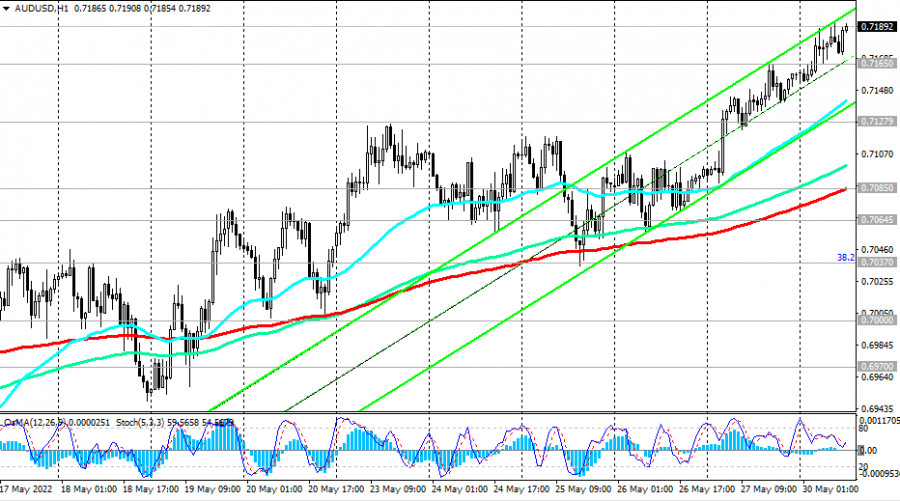
| AUD/USD: growth towards 0.7240, 0.7270 Posted: 30 May 2022 05:58 AM PDT The dollar index (DXY) is in no hurry to recover after ending the past week in negative territory for the second time in a row. As of this writing, DXY futures are trading near 101.62, 7 points below the closing price last Friday. It seems that market participants are still reserved about the idea of buying the dollar, and the upcoming increase of 0.50% interest rate at the next 2 Fed meetings is already taken into account in prices, according to Fed Chair Jerome Powell.
Meanwhile, prices for grains and other basic foodstuffs and energy products, which have resumed growth, are providing good support to major commodity currencies, such as the Canadian, New Zealand, and Australian dollars. Thus, futures for Brent oil are growing today for the 8th day in a row, reaching $116.25 per barrel, and 1000 cubic meters of natural gas in Europe are currently estimated at $1031, and Australia, as you know, is the largest exporter of liquefied gas, coal, iron ore, agricultural products. AUD/USD is trading near 0.7190 as of this writing, 32 pips above the closing price at the end of last week. The pair maintains positive dynamics, tending towards key resistance levels of 0.7240, 0.7270, also receiving support from the declining US dollar (against the backdrop of weaker macro data from the US, which increases the risks that the Fed will take a pause in the interest rate hike cycle after the July meeting). At the same time, economists note increased inflationary pressure in the Australian economy, which may force the Reserve Bank of Australia to tighten policy more aggressively. According to their forecast, in the 3rd quarter, the annual inflation rate in Australia will exceed 7%, which could force the RBA to raise the key rate to 2.75% by the beginning of next year, despite the weakening of economic activity and lower house prices. Thus, the likelihood of a repeated increase in the RBA rate by 50 basis points has increased, and this is a positive factor for the Australian currency. This week, a number of important macro statistics for Australia and the United States are expected to be published, which will be directly reflected in the AUD/USD dynamics. However, the focus of market participants this week will be the publication on Friday (at 12:30 GMT) of the monthly report of the US Department of Labor with data on the country's labor market for May. Thus, in the absence of negative news from Australia and the negative dynamics of the US dollar until Friday, the AUD/USD pair has every chance to come close to the above marks of 0.7240, 0.7270.
|
| EUR/USD ignores 1.0757 key resistance Posted: 30 May 2022 05:46 AM PDT The EUR/USD pair is trading in the green at 1.0770 at the time of writing and it seems determined to resume its growth as the Dollar Index remains bearish in the short term. DXY's deeper drop could force the greenback to depreciate versus its rivals. Today, the US banks will be closed in observance of Memorial Day, so the volume and volatility could be lower. Fundamentally, the Spanish Flash CPI rose by 8.7% beating the 8.4% growth expected, while German Import Prices surged by 1.8% less versus 2.1% estimates. Unfortunately for the USD, the US reported poor economic data in the last week, that's why the greenback remains sluggish. EUR/USD Bullish!
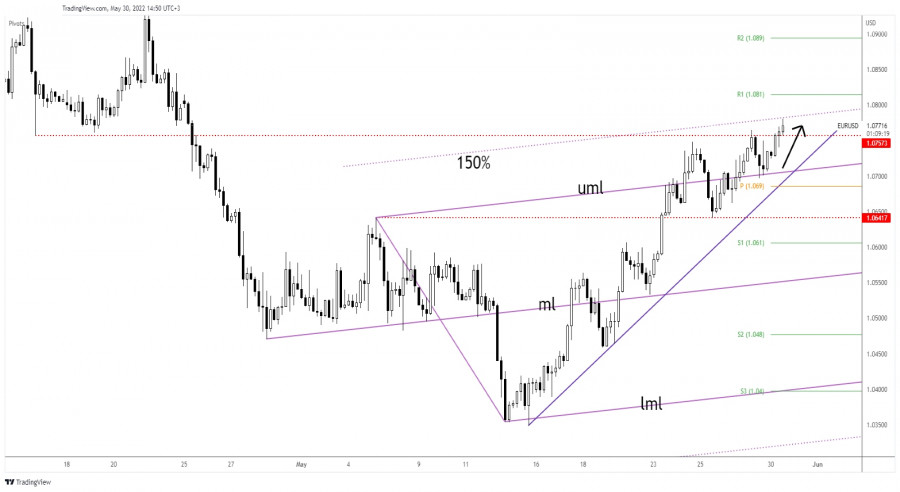
EUR/USD maintains a bullish bias as long as it stays above the uptrend line. It has resumed its growth after retesting the upper median line (uml). Now, it has managed to close above the 1.0757 key resistance and it has reached the 150% Fibonacci line which stands as a dynamic resistance. In the short term, it could try to confirm its breakout above the 1.0757 static obstacle. Still, only a valid breakdown below the uptrend line could invalidate an upside continuation. EUR/USD Outlook!Validating its breakout above 1.0757 may signal an upside continuation. So, stabilizing above this level and making a new higher high, jumping, and closing above 1.0780 could activate further growth and could bring new long opportunities. The material has been provided by InstaForex Company - www.instaforex.com |
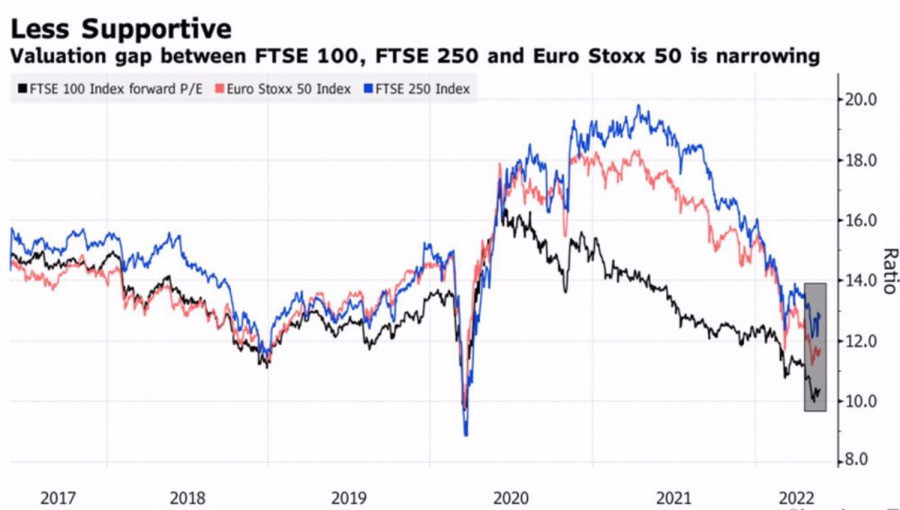
| Dollar decline supports GBPUSD rally Posted: 30 May 2022 05:44 AM PDT The two-week GBPUSD rally, at first glance, looks like an unconditional victory for the bulls, who found the strength to go on the counterattack and take the pair's quotes out of the two-year bottom. But the main reason for the correction of the pound against the US dollar is the weakening dollar, while neither internal macro statistics, nor the conjuncture of the sovereign securities market are able to lend a shoulder to the sterling. Expectations of a pause in the Fed's monetary restriction process and the resulting decline in US Treasury yields have turned the US dollar into a whipping boy. It is weakening against most major world currencies. At the same time, a 6% rally in the main stock indices in the United States during the week of May 28 and the lifting of a number of restrictions in China against the background of an improvement in the epidemiological situation in the country add fuel to the fire of a correction in the USD index from the area of 20-year peaks. The pound simply took advantage of the situation, although given the restrained rhetoric of the Bank of England, the slowdown in the economies of China and the eurozone, the energy crisis, and the crisis in the cost of living, as well as the resuscitation of the Brexit topic, according to Nomura, it should be trading near $1.2. Until recently, the GBPUSD bulls were supported by the FTSE 100, which has added more than 3% since the beginning of the year, which, against the backdrop of a 12% fall in the S&P 500 and more than 8% peak in the EuroStoxx 600, contributed to the flow of capital from North America and continental Europe to Britain. Alas, after the introduction of a 25% tax on excess profits of oil and gas companies, Bloomberg experts believe that the UK stock index has no growth potential, while its European counterpart is able to rise by 9% by the end of 2022. Dynamics of P/E for European stock indices
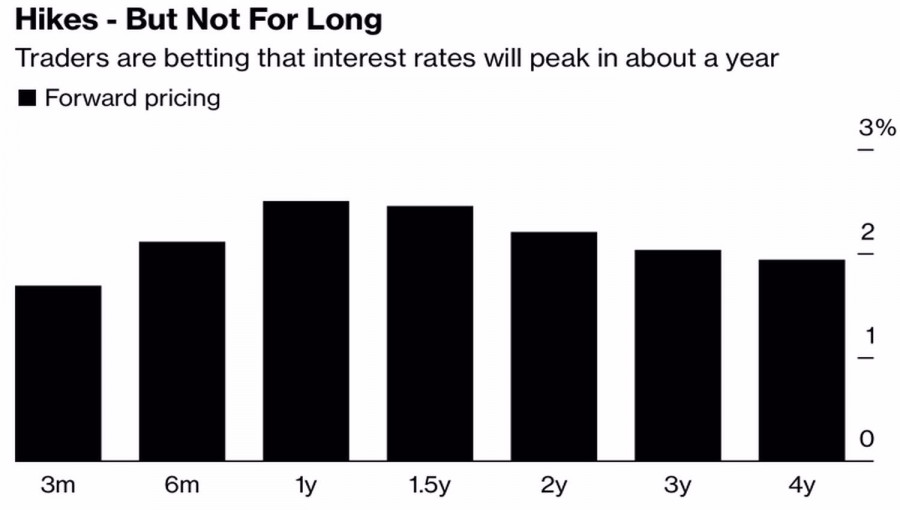
For Britain, which is struggling to close the hole in the current account, the inflow of capital into the local securities market is of fundamental importance. Therefore, the fall of the FTSE 100 will certainly have a negative impact on the pound. As soon as interest in the US dollar begins to return, it is the GBPUSD bulls that will be the first to be hit. Investors have now got it into their heads that the Fed, after two hikes in the federal funds rate in June and July, will pause in September. In fact, with financial conditions no longer tightening, Jerome Powell and his colleagues would rather continue what they started than stop. In addition, the futures market signals the desire of the Bank of England to sit on the sidelines. Futures contracts predict that the repo rate will peak in a year and then start to decline. Expected dynamics of the REPO rate
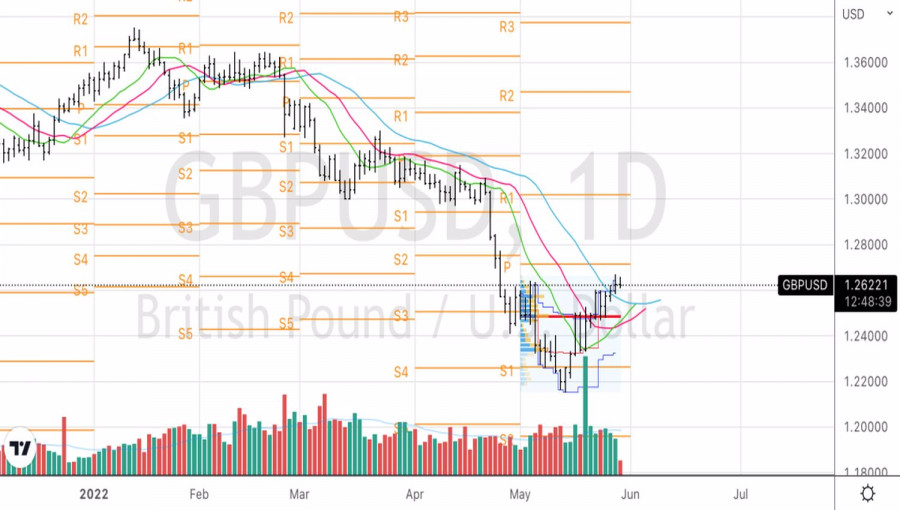
Technically, despite the fact that the previous idea of buying GBPUSD above 1.246 and then building up longs on a break of 1.26 worked out with a bang, I recommend gradually taking profits as the pair continues to rally and think about a reversal and return to the downward trend. The reason for selling may be a rebound from the resistance at 1.268, 1.2715, and 1.275. GBPUSD, Daily chart
|
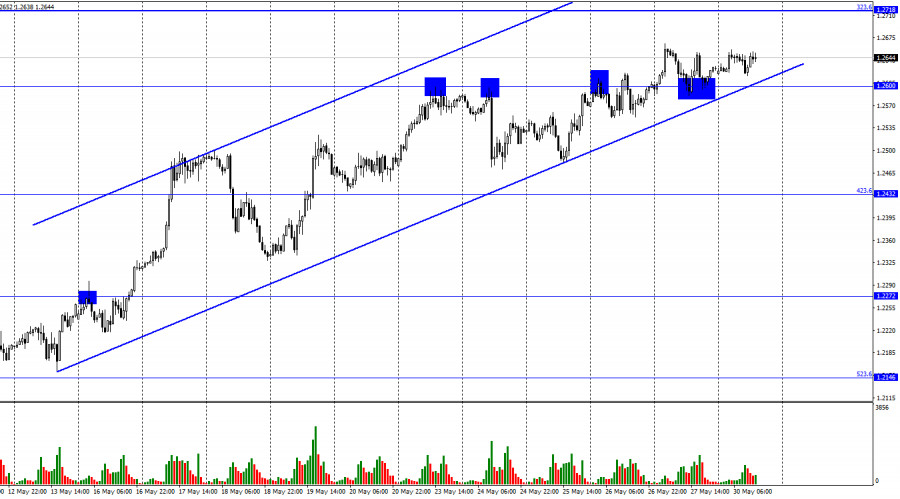
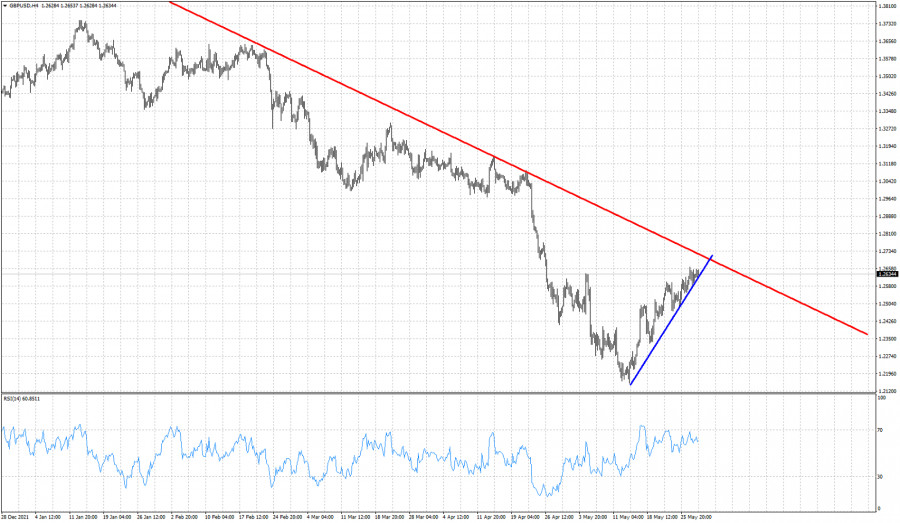
| GBPUSD approaches short-term resistance as up trend is weakening. Posted: 30 May 2022 05:25 AM PDT GBPUSD has reached very close to our target as price today is trading as high as 1.2656 solidifying an up trend with higher highs and higher lows since 1.2150. Price continues to respect the upward sloping blue trend line. GBPUSD is approaching resistance at 1.27-1.2720.
Blue line- short-term support Despite making higher highs, GBPUSD has started providing bearish divergence by the RSI. As long as price holds above the blue support trend line, bulls are in control of the short-term trend. The RSI has provided us with a bearish warning that we should not ignore. Combined with the fact that price is approaching the major resistance trend line, should make traders even more cautious, as the chances of a rejection and reversal have increased. Price has the potential to continue higher towards 1.27 before turning lower. The material has been provided by InstaForex Company - www.instaforex.com |
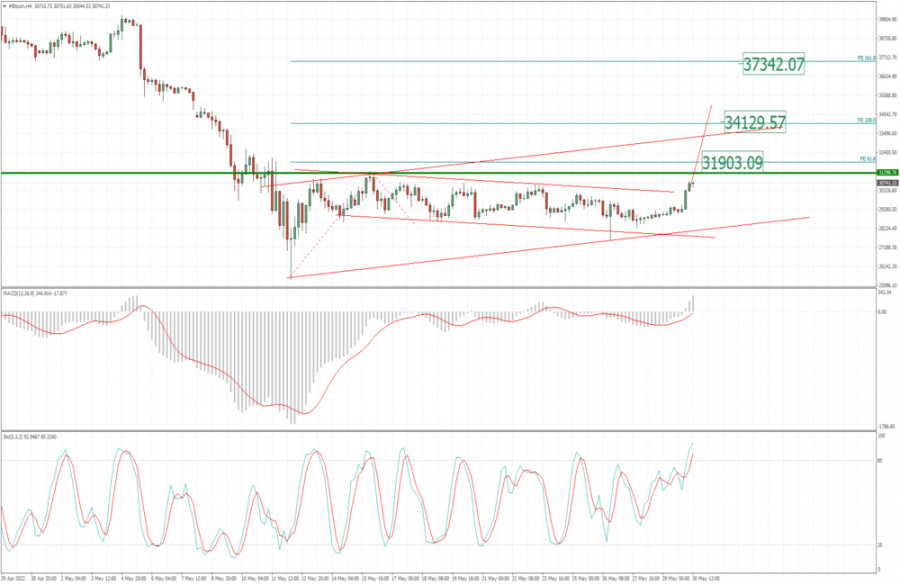
| BTC update for May 30,.2022 - Breakout of the downside channel Posted: 30 May 2022 05:25 AM PDT Technical analysis:
BTC has been trading upside today and there is the breakout of the downside channel in the background, which is good sign for further rise. Trading recommendation: Due to the breakout of the well-defined downside channel, I see potential for further rally and test of the upper references. Watch for buying opportunities on the intraday pullbacks with the upside objectives at the price of $31.900, $34.000 and $37.345. Stochastic oscillator is showing fresh bull cross, which is another sign for the downside movement. MACD is showing upside reading, which is good confirmation for further rally. Key support is set at the price of $25.500 The material has been provided by InstaForex Company - www.instaforex.com |
| Technical analysis recommendations on EUR/USD and GBP/USD for May 30, 2022 Posted: 30 May 2022 05:19 AM PDT EUR/USD
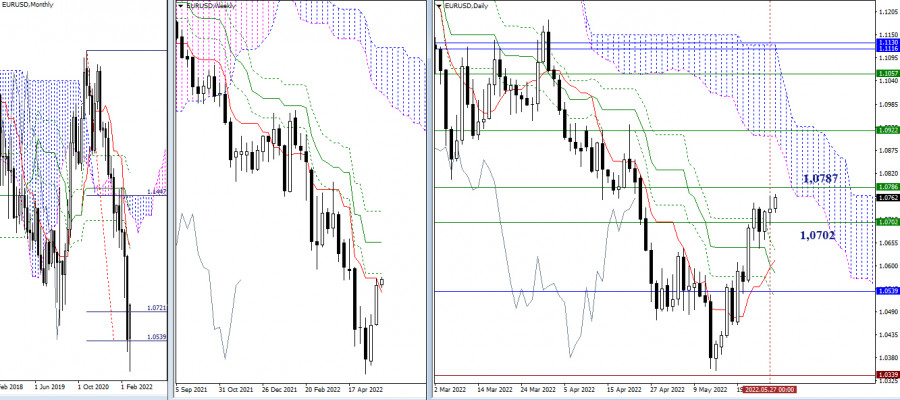
Higher timeframes Bulls ended last week very optimistically. Tomorrow we will close the month of May, so bulls need to keep their moods and positions. Otherwise, the formation of a rebound may begin from the met weekly resistances, which in turn may change or cancel the optimistic mood that is present now, aimed at continuing the implementation of the upward trend. Met weekly resistance today slightly changed their location. The weekly short-term trend has weakened its current opposition to bulls, dropping to the 1.0702 area. Weekly Fibo Kijun maintains its defense at the line of 1.0787. Overcoming will open up opportunities for a rise to the weekly medium-term trend (1.0922), which is now strengthening the daily cloud.
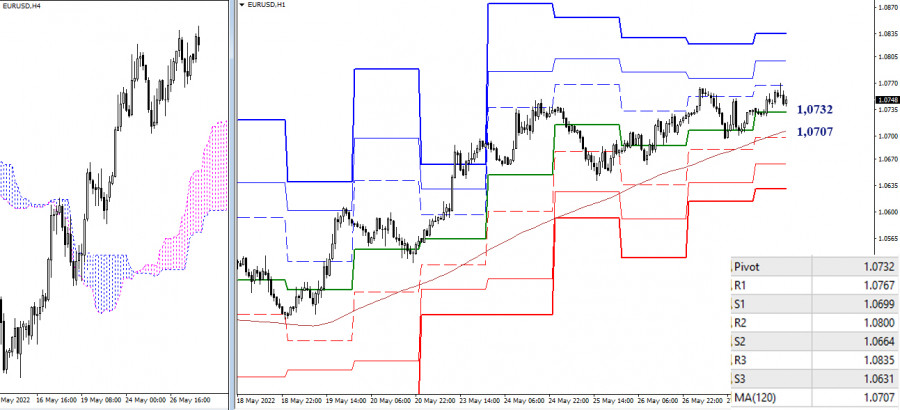
H4 – H1 On lower timeframes, the main advantage continues to be on the side of bulls. Today intraday they have already tested the first resistance of the classic pivot points (1.0767), further attention can be directed to the conquest of 1.0800 (R2) and 1.0835 (R3). The key levels of the lower timeframes today serve as supports: 1.0732 (central pivot point) and 1.0707 (weekly long-term trend). A breakdown and a reliable consolidation below can change the current balance of power in the lower timeframes and serve as the beginning of a change in the mood of the higher timeframes. Supports within the day are the classic pivot points located at 1.0699 – 1.0664 – 1.0631. *** GBP/USD
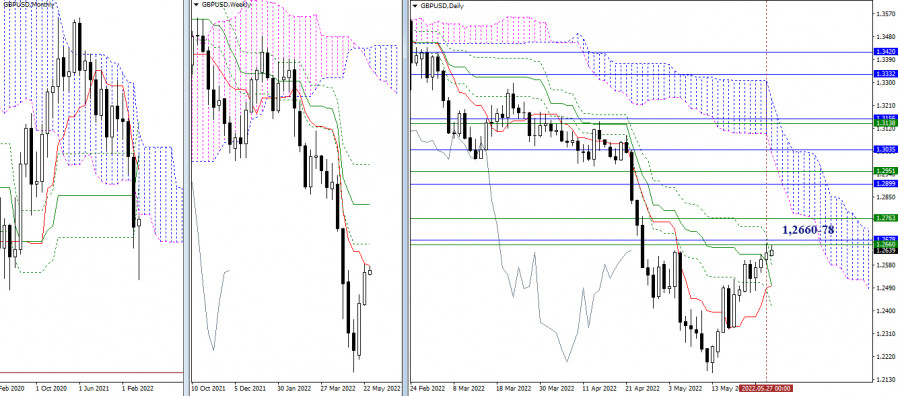
Higher timeframes Bulls ran into the resistance of the weekly (1.2660) and monthly (1.2678) levels. A breakdown and consolidation above 1.2660–78 will allow considering new prospects for bulls. The nearest reference point for further growth can be noted at the weekly boundary of 1.2764. Nevertheless, it should be noted that the strength of the met resistance levels is now able to slow down the current movement. With a decrease, support may be provided by the levels of the daily Ichimoku cross (1.2578 – 1.2497 – 1.2416).
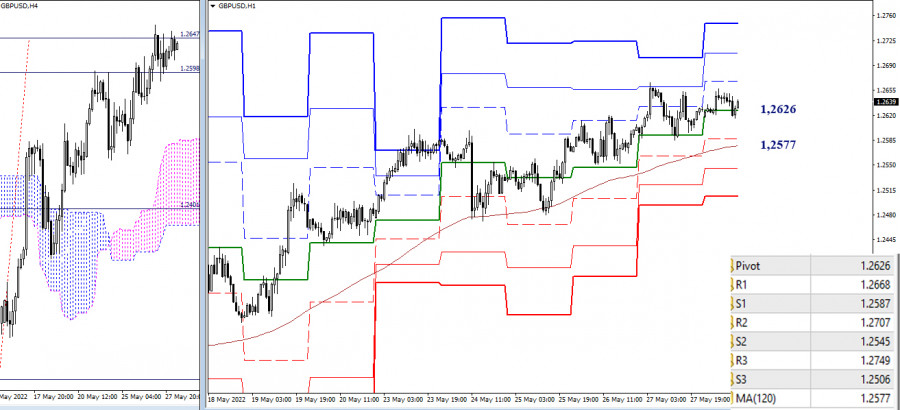
H4 – H1 In the lower timeframes, the advantage belongs to the bulls. Reference points for the rise within the day are 1.2668 – 1.2707 – 1.2749 (classic pivot points). The day before, the target for the breakdown of the H4 cloud (1.2647) was worked out, so the expectation of a corrective decline in the lower timeframes is also present. Key levels are forming support levels today at 1.2626 (central pivot point of the day) and 1.2577 (weekly long-term trend). Consolidation below and reversal of the moving average will change the current balance of power. ***' In the technical analysis of the situation, the following are used: higher timeframes – Ichimoku Kinko Hyo (9.26.52) + Fibo Kijun levels H1 - Pivot Points (classic) + Moving Average 120 (weekly long-term trend) The material has been provided by InstaForex Company - www.instaforex.com |
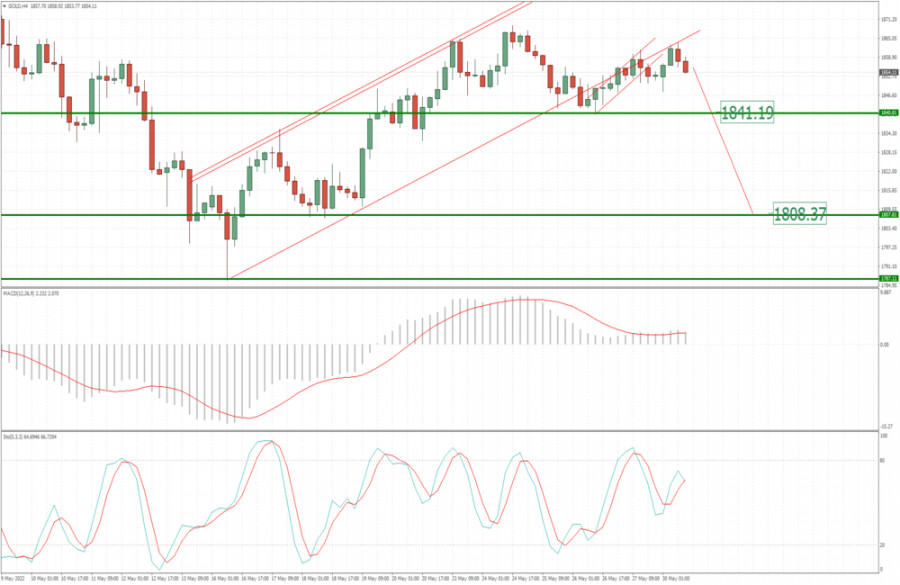
| Analysis of Gold for May 30,.2022 - Breakout of the upside channel and potential for the bigger drop Posted: 30 May 2022 05:17 AM PDT Technical analysis:
GoldF has been trading downside today and there is the breakout of the rising upside channel in the background and breakout of the mini channel, which is sign for me that sellers are taking control. Trading recommendation: Due to the breakout of the well-defined upside channel, I see potential for further downside movement. Watch for selling opportunities on the intraday rallies with the downside objectives at $1.841 and $1.808. Stochastic oscillator is showing fresh bear cross, which is another sign for the downside movement. Key resistance is set at the price of $1.862 The material has been provided by InstaForex Company - www.instaforex.com |


| You are subscribed to email updates from Forex analysis review. To stop receiving these emails, you may unsubscribe now. | Email delivery powered by Google |
| Google, 1600 Amphitheatre Parkway, Mountain View, CA 94043, United States | |


Comments