Forex analysis review
Forex analysis review |
- May 20, 2022 : EUR/USD daily technical review and trading opportunities.
- May 20, 2022 : EUR/USD Intraday technical analysis and trading plan.
- May 20, 2022 : GBP/USD Intraday technical analysis and significant key-levels.
- Trading Signal for GBP/USD on May 20-22, 2022: sell below 1.2500 (head shoulders pattern - 21 SMA)
- Ripple sellers in full control
- Trading Signal for EUR/USD on May 20-22, 2022: sell below 1.0575 (21 SMA)
- Bitcoin faces crypto winter
- Gold to reach buying zone
- USD/JPY: downtrend intact
- GBP/USD on May 20, 2022
- Trading Signal for Gold (XAU/USD) on May 20-22, 2022: buy in case of rebound $1,826 (21 SMA - overbought)
- Technical analysis of EUR/USD for May 20, 2022
- European stocks plummet by 1-2%
- Technical analysis of GBP/USD for May 20, 2022
- Trading plan for Ethereum on May 20, 2022
- EUR/USD rejected by 1.0593 key resistance
- Trading plan for Bitcoin on May 20, 2022
- Trading plan for Silver on May 20, 2022
- EUR/USD on May 20, 2022
- BTC update for May 20,.2022 -Sideways market, watch for breakout
- Trading plan for Gold on May 20, 2022
- Ichimoku cloud indicator analysis on EURUSD for May 20, 2022.
- Technical analysis on GBPUSD for May 20, 2022.
- EUR/USD analysis for May 20, 2022 - Rejection of the key pivot at 1.0600, potential for drop and downside continuation
- Trading plan for USDJPY on May 20, 2022
| May 20, 2022 : EUR/USD daily technical review and trading opportunities. Posted: 20 May 2022 02:12 PM PDT
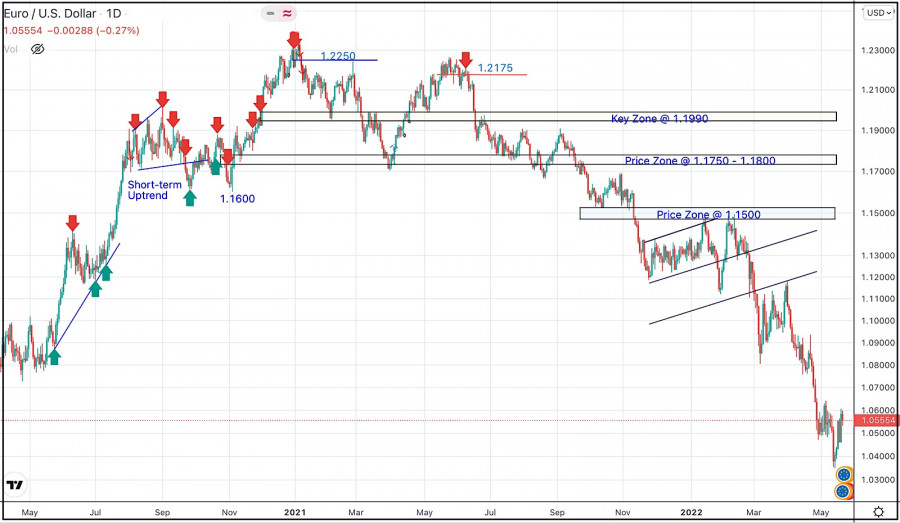
In late September, Re-closure below the price level of 1.1700 has initiated downside-movement towards 1.1500 where some recovery was witnessed. Shortly after, Price levels around 1.1700 managed to hold prices for a short period of time before another price decline took place towards 1.1200. Then the EURUSD has temporarily moved-up within the depicted movement channel until downside breakout occurred recently. Since then, the price zone around 1.1500 has applied significant SELLING pressure when a valid SELL Entry was offered upon the previous ascending movement towards it. Shortly after, the EURUSD looked oversold while approaching the price levels of 1.0800. That's where the recent upside movement was previously initiated. That's why, the recent movement towards 1.1200 was considered for another SELL Trade which is already running in profits now. For beginners, the current price levels are too low to have SELL trades around. Hence, intraday BUY trades are considered a better option. Any ascending movement above 1.0600 will probably enable more advancement towards 1.0700 and 1.0850. Otherwise, conservative traders should stay out of the market. The material has been provided by InstaForex Company - www.instaforex.com |
| May 20, 2022 : EUR/USD Intraday technical analysis and trading plan. Posted: 20 May 2022 02:11 PM PDT
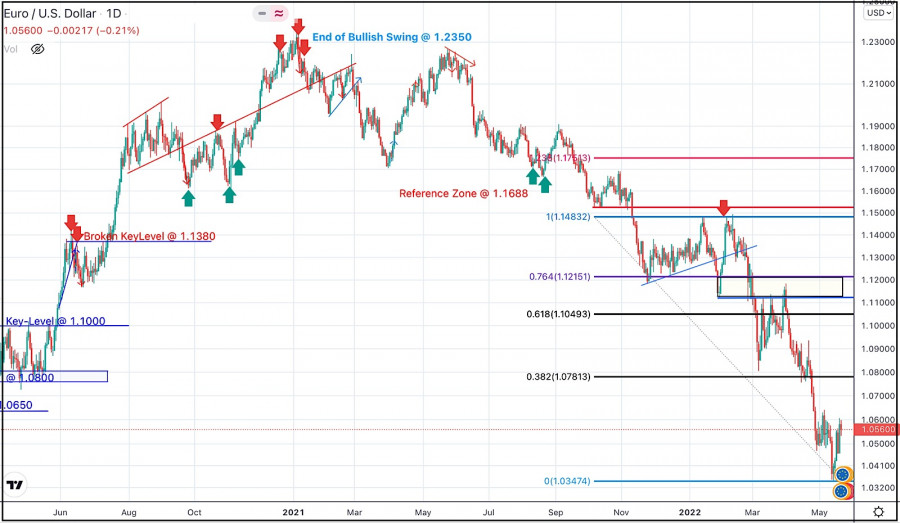
A short- term sideway movement was demonstrated within the highlighted zone around 1.1600 before quick bearish decline could occur towards 1.1200. On the other hand, the price zone around 1.1500 - 1.1600 remained a reference zone that applied significant bearish pressure upon two successive bullish visits before another bearish continuation sign was expressed. Hence, downside movement proceeded towards 1.1000 then 1.0920 where short-term bullish pullback was initiated. The price levels around 1.1150 hindered further bullish movement before another bearish move was aggressively expressed towards 1.0500. Failure to persist below the newly-recorded LOW at 1.0350 will probably enable another bullish pullback at least towards 1.0800 and probably 1.1150 where bearish trades can be offered. Until then, Intraday traders shouldn't have any BUY trades unless bullish persistence above 1.0650 is achieved first. The material has been provided by InstaForex Company - www.instaforex.com |
| May 20, 2022 : GBP/USD Intraday technical analysis and significant key-levels. Posted: 20 May 2022 02:10 PM PDT
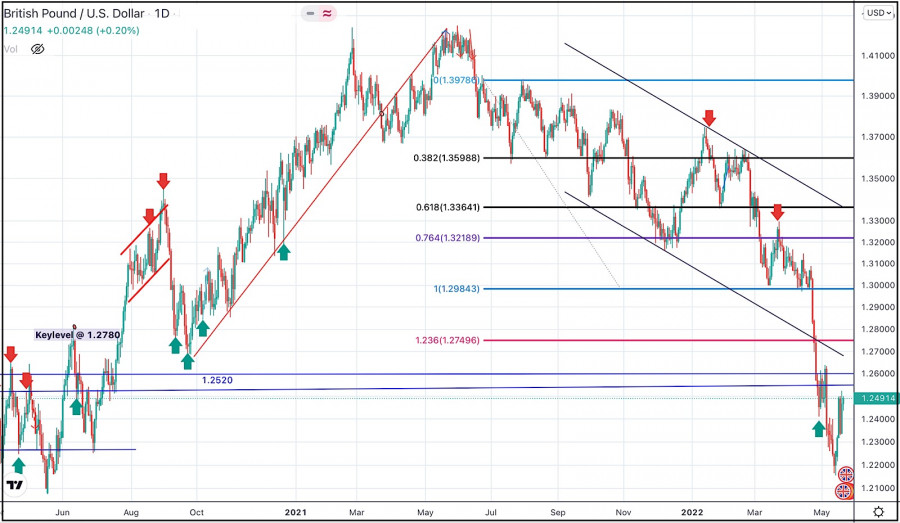
The GBPUSD pair has been moving within the depicted bearish channel since July. Sideway movement was expressed above 1.3600 while the price levels around 1.3730 - 1.3800 were considered as they offered significant bearish rejection. The short-term outlook turned bearish when the market went below 1.3600. This enhanced the bearish side of the market towards 1.3200 which brought the pair back towards 1.3600 for another re-test. Hence, the recent bullish pullback towards 1.3600 should have been considered for SELL trades as it corresponded to the upper limit of the ongoing bearish channel. Shortly after, Bearish persistence below 1.3360 enabled bearish continuation towards 1.2980 - 1.3000. Bullish rejection has arised many times around 1.3000 standing as a significant Daily Support. This happened before another bearish decline could take place earlier last week. Another bearish breakout below 1.2980 has enabled quick bearish extension towards 1.2600-1.2550 where some bullish recovery and a short-term sideway movement could be established before another downside movement was expressed. Previous bearish decline was expected to extend towards 1.2100 where bullish reversal could be expected. However, considerable bullish rejection was expressed around 1.2200. Currently, bullish breakout above 1.2550 is needed to abolish the short-term bearish scenario and may enable quick bullish advancement towards 1.2750, 1.3300 and probably 1.3600 if sufficient bullish momentum is maintained. Otherwise, the GBP/USD pair remains under bearish pressure to challenge the new low around 1.2150 again. Hence, any bearish reversal signs around 1.2550 should be considered for SELLING the pair. The material has been provided by InstaForex Company - www.instaforex.com |
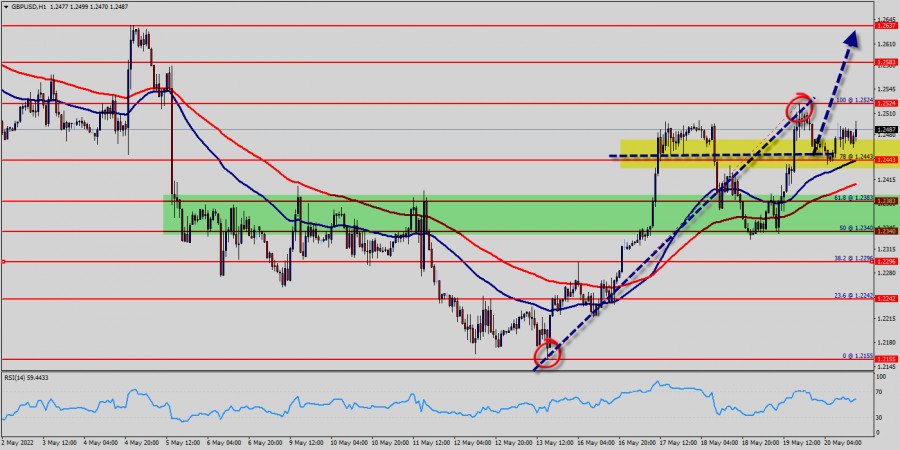
| Trading Signal for GBP/USD on May 20-22, 2022: sell below 1.2500 (head shoulders pattern - 21 SMA) Posted: 20 May 2022 09:11 AM PDT
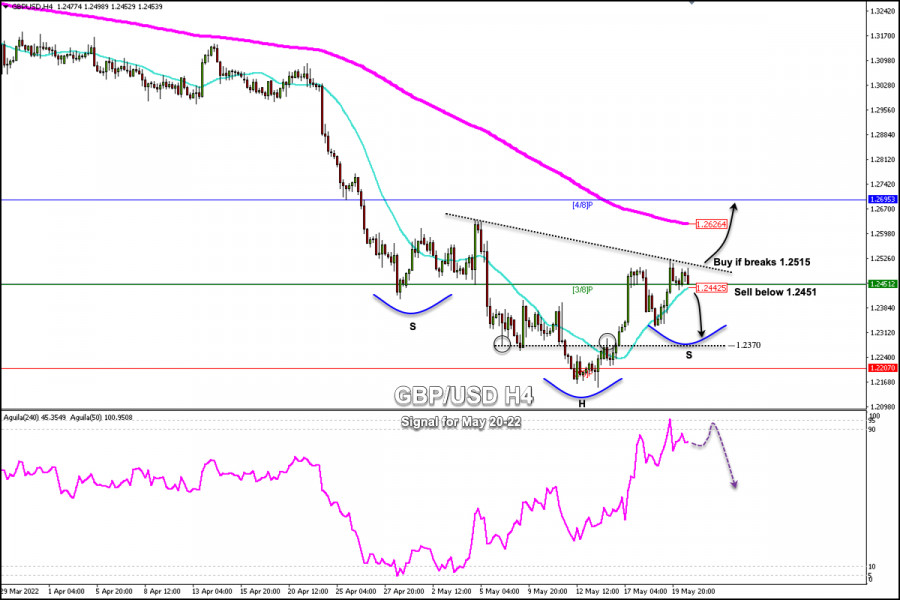
Early in the American session, the GBP/USD pair reached the resistance level of 1.2498. Since then, it is pulling back and is now testing the support 3/8 Murray at around 1.2451. Supported by the selling pressure around the US dollar, GBP/USD has extended its weekly rally and reached the psychological level of 1.2500 for the first time in two weeks. From the low of 1.2154, the British pound managed to recover. Now the outlook remains bullish in the short term, but it may be difficult to attract buyers if the pair fails to break above the barrier of 1.2515. It is prudent to wait for a strong bullish move if GBP/USD consolidates above 1.2515 on the daily chart. The GBP/USD pair could then rally to the area of 1.2626 (200 EMA) and could even hit 4/8 Murray at 1.2695. Conversely, a sharp break below the 21 SMA at 1.2451 could accelerate the bearish move and we could expect the price to continue falling towards the 1.2370 support. On May 19, the eagle indicator entered the extremely overbought zone. It is likely that in the next few hours there will be a technical correction to resume the upward movement. In case of failure to break the level of 1.2515, the pound could fall and reach the support of 1.2370 in the next few days. Since April 27, we can see the formation of the head & shoulders pattern on the 4-hour chart. This technical pattern could be confirmed, if the pound trades above the psychological level of 1.2515 with an ultimate target around 1.2939 (5/8 Murray). Our trading plan for the next few hours is to sell below 1.2451 or in case of a pullback towards 1.2500, it will be an opportunity to sell. Above 1.2515 we should avoid selling and the pound is likely to resume its upward move. The material has been provided by InstaForex Company - www.instaforex.com |
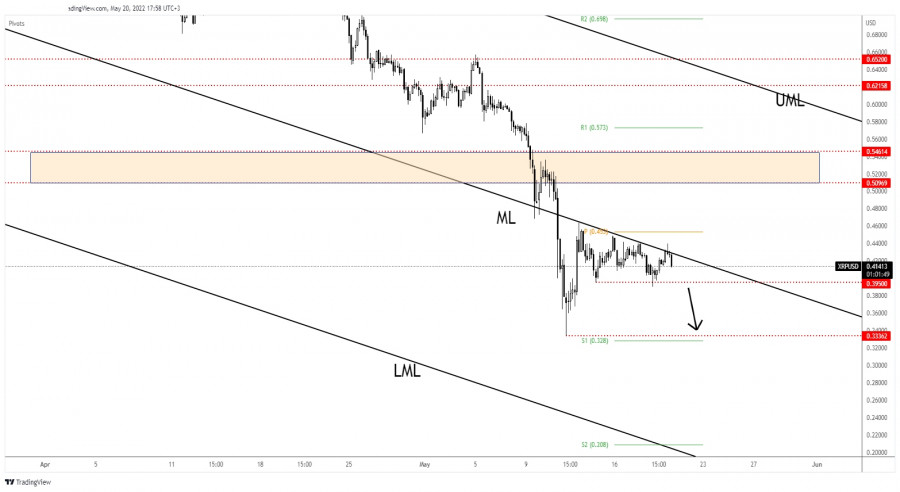
| Ripple sellers in full control Posted: 20 May 2022 08:26 AM PDT XRP/USD is trading in the red at 0.4113 at the time of writing. The altcoin found strong resistance and now it drops as the price of Bitcoin slips lower as well. Today, it has dropped by 6.95% from 0.4400 daily high to today's low of 0.4094. In the last 24 hours, XRP/USD is down by 0.09% and by 7.47% in the last 7 days. In the short term, BTC/USD is trading sideways, a deeper drop could force Ripple to approach and reach new lows. XRP/USD Downside Breakout!
Ripple retested the descending pitchfork's median line and now it is dropping like a rock. As you can see, the price made a false breakout through this dynamic resistance signalling strong sellers and a potential new sell-off. 0.3950 former low stands as a downside obstacle. A valid breakdown may signal more declines. As you already know, only a valid breakout above the median line (ML) could invalidate a further drop. XRP/USD Outlook!A valid breakdown below 0.3950 activates a potential sell-off towards 0.3336. This scenario could bring new selling opportunities. The material has been provided by InstaForex Company - www.instaforex.com |
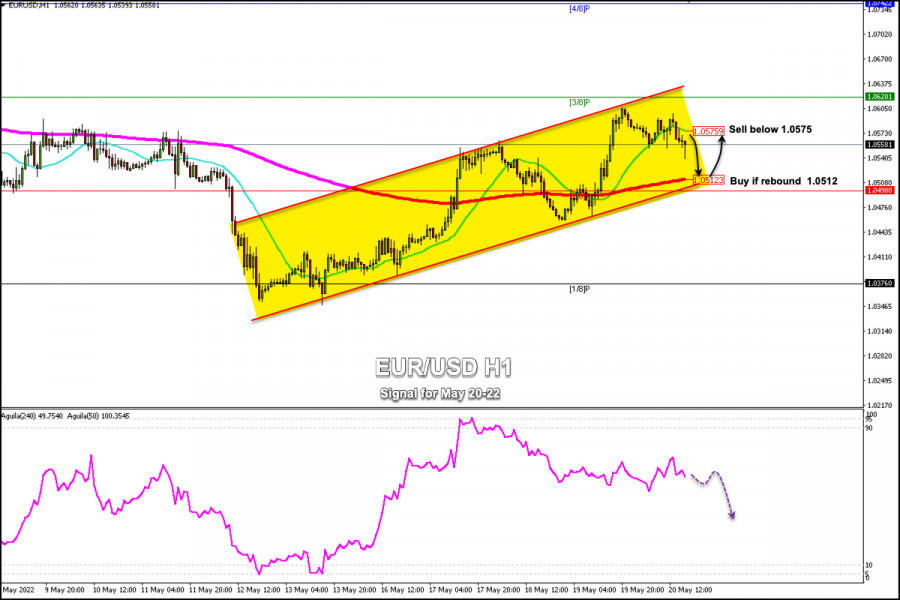
| Trading Signal for EUR/USD on May 20-22, 2022: sell below 1.0575 (21 SMA) Posted: 20 May 2022 08:10 AM PDT
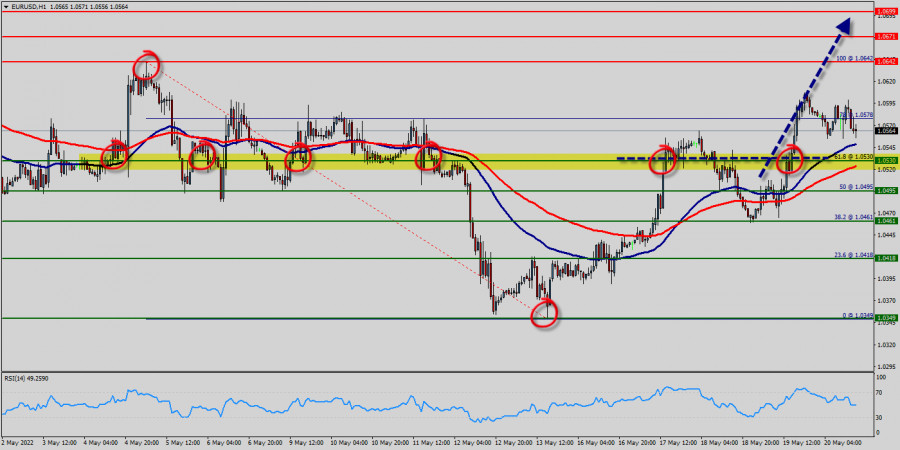
EUR/USD registered highs for the day at 1.0598 after finding support twice in the area of 1.0554. In the American session, the Euro is trading below the 21 SMA with a bearish bias and above the 200 EMA located at 1.0512. Selling pressure around the US dollar (USDX) supported the strong rally in the EUR/USD pair on Thursday. The sharp drop in 10-year Treasury yields weighed on USDX and investors turned to risk assets. The short-term technical outlook for the euro remains positive, although it will need to break and consolidate above 1.0600 to enable a further rally, with the next target at 4/8 Murray around 1.0742. If the euro cannot surpass 1.0600, it could lose momentum. The first support is at 1.0555 and then at 1.0512 (200 EMA) and 1.0498 (2/8) (short-term uptrend line). Below then comes 1/8 Murray at 1.0376. If the price is below this area, this would leave the Euro vulnerable and the currency pair could resume the main downtrend. In the coming days, the euro could find strong support around 2/8 Murray at 1.0498. As long as it remains above this level, the euro is likely to resume its short-term uptrend and could reach the area 1.0670 and 1.0742 (4/8 Murray). Our trading plan for the next few hours is to sell, only if the Euro consolidates below the 21 SMA located at 1.0575 or to buy in case of a technical bounce at the bottom of the uptrend channel around 1.0512 - 1.0498. The material has been provided by InstaForex Company - www.instaforex.com |
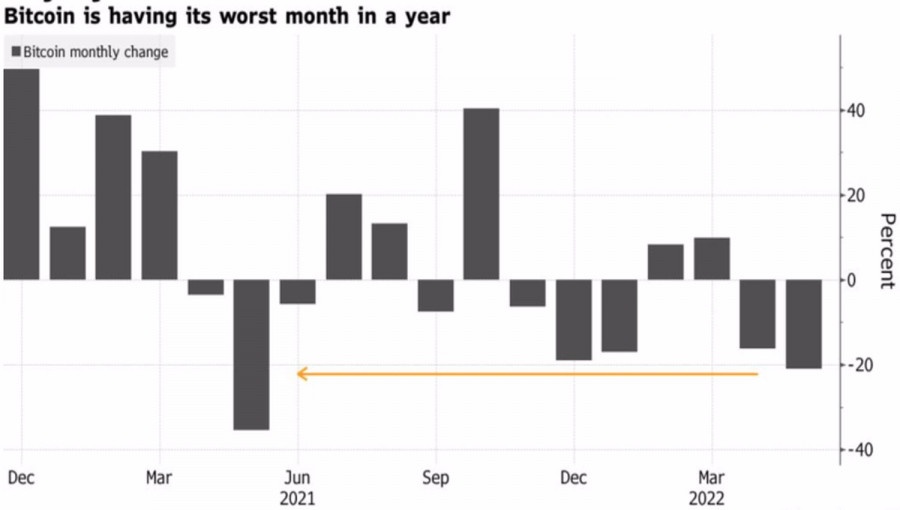
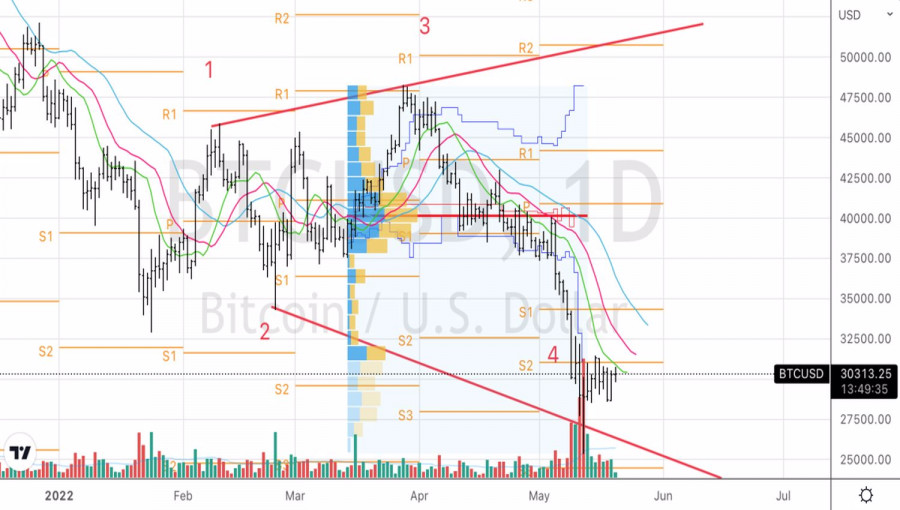
| Posted: 20 May 2022 07:44 AM PDT In contrast to the fact that spring is ready to give way to summer throughout the Northern Hemisphere, another winter is coming to the cryptocurrency market. The previous one lasted a very long time, from 2018 to mid-2020, when Bitcoin fell, then traded in consolidation. The scale of those collapses was even greater than at present, but now, due to the rapid growth of capitalization, they are much more noticeable. And yet, despite the pronounced "bear" market, BTCUSD buyers find reasons for optimism. While the Bloomberg Galaxy Composite Crypto Index sank 60% from its peak in November, Bitcoin lost less. It outperforms its peers due to its fame and liquidity. Because of this, it is considered the safest of all dangerous assets in the market. The worst month for Bitcoin in the last year was the result of falling US stock indices and problems with stablecoins, which began to cut their ties with the US dollar. Looking at this process, the likelihood of government regulation of this class of cryptocurrencies seems very high. As, however, are the chances of their complete replacement with a tool that will be supported by the government.Bitcoin Monthly Dynamics
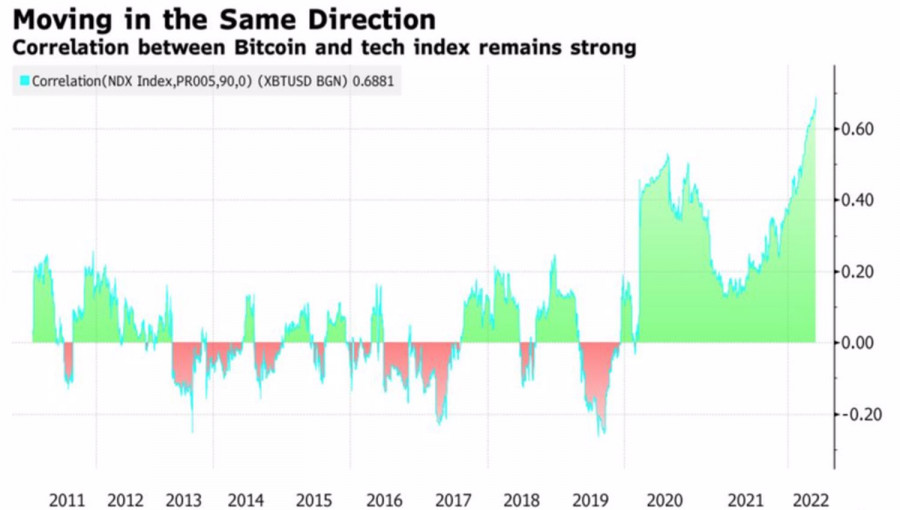
Bitcoin is a different story. Thanks to large institutional investors joining the trade in this asset and its derivatives, it has become part of the financial system. In terms of viability, this is good news for BTCUSD. However, in return, the leader of the cryptocurrency sector had to say goodbye to its uniqueness. Previously, it was perceived as a tool that allows you to diversify your portfolio. At the moment, it is a common risky asset. What's more, Bitcoin's skyrocketing correlation with the Nasdaq Composite allows it to be seen as an alternative to stocks. Bitcoin and Nasdaq Composite Correlation Dynamics
In this regard, the increased sensitivity of the leader of the cryptocurrency sector to the Fed's monetary policy becomes understandable. According to Reuters experts, the Fed will raise the federal funds rate by 50 bps in June (88 out of 89 respondents believe so), then another 50 bps in July (54 out of 89), and then reduce the rate to 25 bps. Only 18 economists expect the regulator to make a big move in September. As a result, borrowing costs will increase to 2.75% by the end of 2022, which is comparable to the derivatives market reading of 3%. High rates of monetary restriction are fraught with a slowdown in GDP. Few believe that the Fed will achieve a soft landing. Most experts, including the leaders of large companies, consider a recession inevitable. As a result, the Nasdaq Composite moved into the bear market, pulling Bitcoin into the abyss with it. Technically, the activation of the Broadening Wedge pattern is still possible, although the likelihood of such a scenario is fading every day. Even if the BTCUSD bulls manage to storm the resistance at 31,050, a break of 34,300, where point 2 is located, is required to form a reversal pattern. Recommendation: from short-term purchases, one should move on to medium-term sales. Bitcoin, Daily chart
|
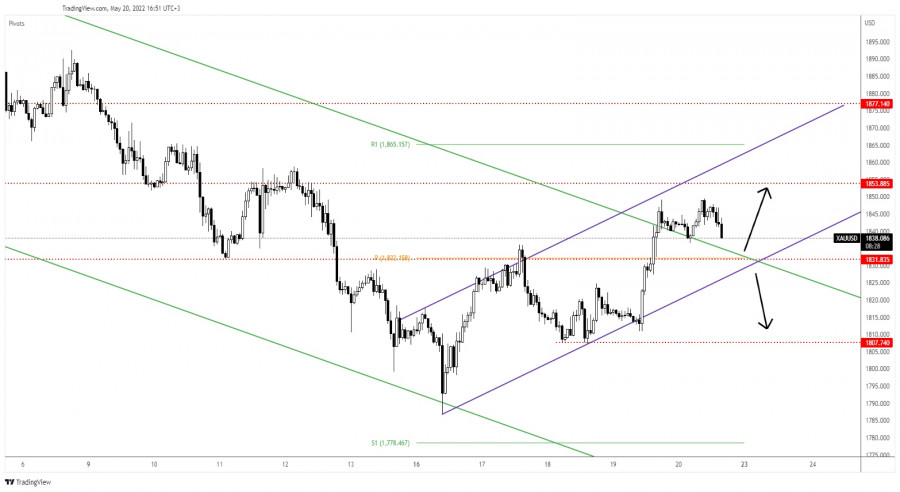
| Posted: 20 May 2022 07:37 AM PDT The price of Gold drops like a rock in the short term as the USD tries to appreciate again after its massive drop. The yellow metal was traded at the 1,838 level at the time of writing. After its amazing rally, a temporary decline is natural. In the short term, XAU/USD rallied only because the USD depreciated. USD's rally could push the yellow metal down again. Fundamentally, the US data came in worse than expected yesterday which was good for Gold. XAU/USD Up Channel!
XAU/USD jumped above the major downtrend line but it failed to close above 1,849 yesterday high signalling that the buyers are exhausted. Now, it could come back down to test and retest the downtrend line, the 1,831 key support, and the uptrend line which represents downside obstacles. Testing and retesting these downside obstacles, registering only false breakdowns may signal that XAU/USD remains bullish and it could develop a new leg higher. Technically, we have a strong confluence area at the intersection between the mentioned downside obstacles. XAU/USD Forecast!A valid breakdown below 1,831 and through the uptrend line may signal a new sell-off and it could bring new selling opportunities. Staying above the support levels, registering only false breakdowns through these levels and through the confluence area could announce a new bullish momentum. The material has been provided by InstaForex Company - www.instaforex.com |
| Posted: 20 May 2022 07:36 AM PDT
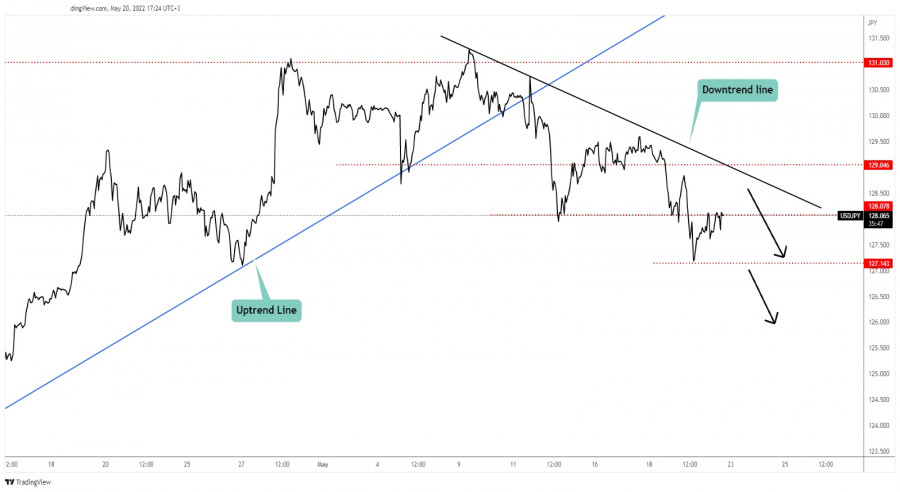
USD/JPY Minor Growth!The USD/JPY pair increased a little in the short term after reaching the 127.14 level. Now, it's trading at the 128.13 level. As long as it stays under the downtrend line, it could drop deeper anytime again. Technically, the downtrend line stands as an upside obstacle. 127.14 previous low is seen as a downside obstacle. Personally, I'll wait for the price to break above the downtrend line or below 127.14 before I'll take action on this pair. Jumping and stabilizing above the downtrend line may signal that the downside movement ended and that the USD/JPY pair could develop an upwards movement. USD/JPY Trading Conclusion!Dropping and staying below 127.14 downside obstacle (former low) may signal more declines. This scenario could bring new selling opportunities. The material has been provided by InstaForex Company - www.instaforex.com |
| Posted: 20 May 2022 07:25 AM PDT
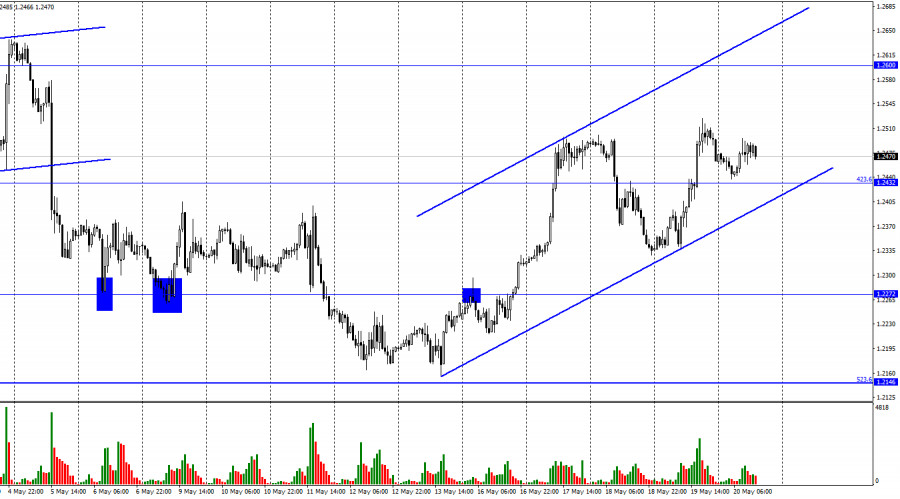
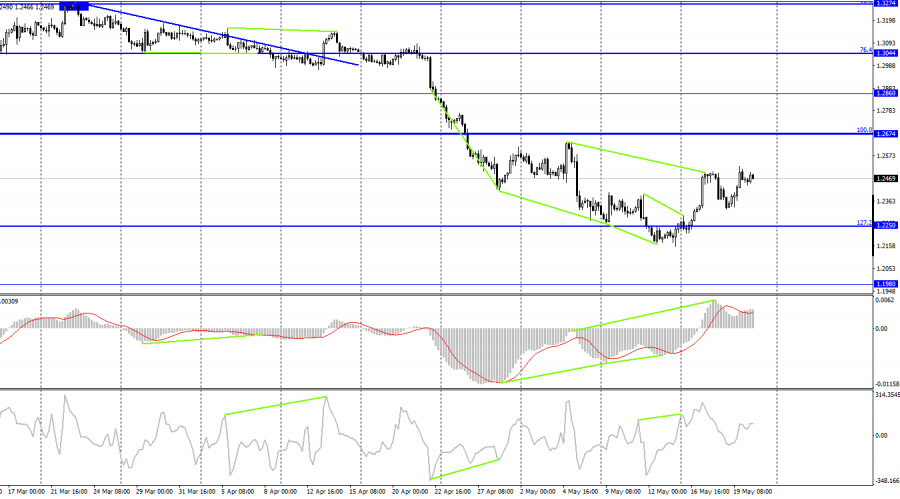
Hi, dear traders! According to the H1 chart, GBP/USD settled above the retracement level of 423.6% (1.2432) on Thursday. While the pair failed to extend its upside movement on Friday, it still remains above the 423.6% level. The ascending trend channel indicates traders are currently bullish. If GBP/USD settles below the trend channel, it could resume its fall towards 1.2272. There were a lot of key UK data releases this week, such as unemployment, average earnings, and inflation, as well as today's retail sales data. However, traders did not react to today's data release. Retail sales decreased by 4.9% YoY and increased by 1.4% MoM in April, exceeding expectations. While this data release was mostly positive, bullish traders still lost steam. GBP/USD is finishing this week in positive territory, but the pound sterling's position is still precarious. Traders are wary about inflation in the UK, which exceeds inflation in both the US and the eurozone. Furthermore, the Bank of England could even pause its monetary tightening course for several months. This week, GBP advanced thanks to strong macroeconomic data, which could fail to provide support for the pair next week. If GBP/USD manages to stay within the ascending channel, the uptrend would continue. Negative economic events could end the pound's upsurge.
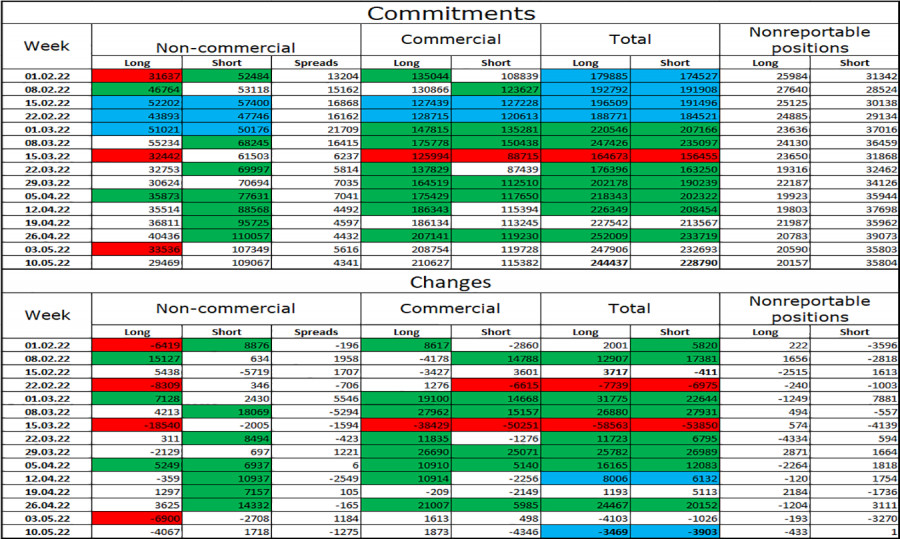
According to the H4 chart, the pair settled above the retracement level of 127.2% (1.2250). This allows GBP/USD to rise further towards the next Fibo level of 100.0% (1.2674). Earlier, the pair descended somewhat due to a bearish MACD divergence - it has since reversed upwards. There have been no emerging divergences today. Commitments of Traders (COT) report:
The mood of Non-commercial traders did not change significantly last week. Traders closed 4,067 Long positions and opened 1,718 Short positions, indicating that major market players are now increasingly bearish. The total number of open Long positions exceeded short ones fourfold (109,067 - 29,469), as market players lower their exposure to GBP. The pound sterling is likely to continue to descend over the next couple of weeks. However, the massive gap between net longs and net shorts suggests GBP could rally in the near future. US and UK economic calendar: UK: Retail sales with auto fuel (06-00 UTC). Traders have largely ignored the UK retail sales data. There are no important events in the US today. Outlook for GBP/USD: New short positions can be opened if the pair closes above the ascending trend channel, with 1.2272 being the target. Yesterday, traders were recommended to open long positions if GBP/USD closed above the retracement level of 423.6% on the H1 chart, with 1.2600 being the target. These positions can be kept open. The material has been provided by InstaForex Company - www.instaforex.com |
| Posted: 20 May 2022 07:15 AM PDT
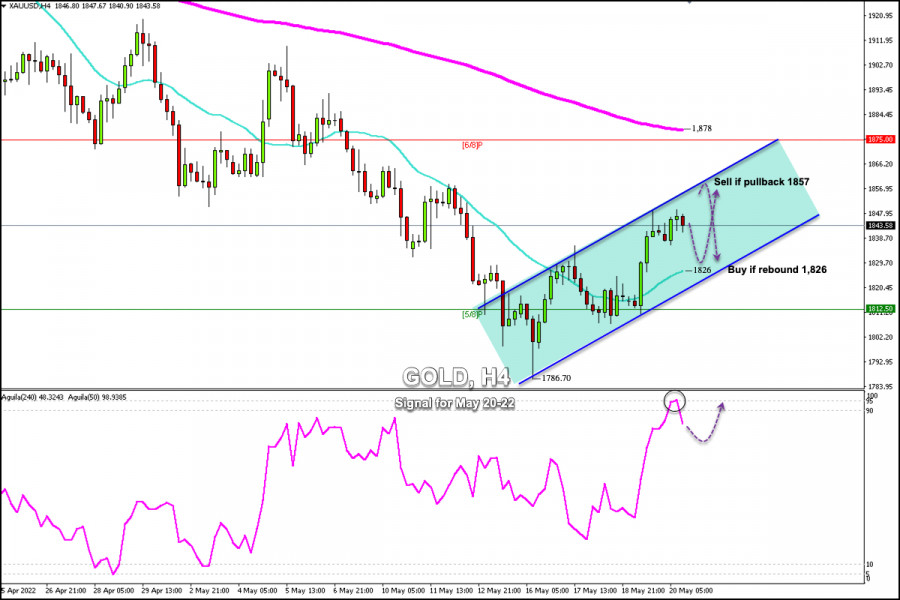
XAU/USD remains firm at the beginning of the American session and trades are approaching the area of 1,845. This week, gold had made a strong recovery and could close the first bullish week after four previous negative weeks. XAU/USD is being supported by increasing positive stock market sentiment reflected in major Wall Street indices, and US Treasury yields, which are correcting away from their highs. Gold has been trading inside an uptrend channel formed on May 16 when it hit a low of 1,786.70. On the weekly chart, gold has made a strong upward move of over $60. This is a positive sign. Gold is likely to continue its uptrend in the coming days and could reach the 200 EMA around 1,878. On the weekly and 4-hour charts, the metal is facing strong resistance around 1,875-1,888, where the 200 EMA is located. It will be a strong barrier for gold if it attempts to continue its uptrend. In case of a sharp break above 1,888, it could be a clear signal for a further bullish move and the price could quickly reach 7/8 Murray at 1,937 and even the psychological level of $2,000. On the contrary, the price could make a pullback towards the 200 EMA (1883) area on the weekly or H4 charts (1,878). If the price fails to break above it, we will have a clear signal to sell and gold could resume its main downtrend. Our trading plan for the next few hours is to wait for a technical bounce around the 21 SMA at 1,826 in order to buy with targets at 1,857. In case of a pullback to the top of the uptrend channel at around 1,857, it will be a signal to sell. The eagle indicator has reached the 95-point zone which represents the extremely overbought level. The metal could go through a technical correction in the next few hours and it could reach the support of 1,820. The material has been provided by InstaForex Company - www.instaforex.com |
| Technical analysis of EUR/USD for May 20, 2022 Posted: 20 May 2022 07:06 AM PDT
Overview : The EUR/USD pair faced resistance at the level of 1.0642, while minor resistance is seen at 1.0578. Support is found at the levels of 1.0530 and 1.0495. Yesterday, the EUR/USD pair continued to move upwards from the level of 1.0495. The pair rose from the level of 1.0495 to the top around 1.0590. But the trend rebounded from the top price of 1.0590 to close at 1.0560. In consequence, the EUR/USD pair broke resistance, which turned strong support at the level of 1.0495. Today, the level of 1.0495 is expected to act as major support. Hence, we expect the EUR/USD pair to continue moving in the bullish trend from the support level of 1.0530 towards the target level of 1.0600. If the pair succeeds in passing through the level of 1.0600, the market will indicate the bullish opportunity above the level of 1.0600 in order to reach the second target at 1.0642 to test the double top in the H1 time frame. However, the price spot of 1.0642 remains a significant resistance zone. Thus, the trend will probably be rebounded again from the double top as long as the level of 1.0642 is not breached. The material has been provided by InstaForex Company - www.instaforex.com |
| European stocks plummet by 1-2% Posted: 20 May 2022 06:57 AM PDT
European stocks declined yesterday. The European indicator StoxxEurope 600 fell by 1.37%. British FTSE 100 index lost 1.82%, French CAC 40 declined a little less by 1.26%. German DAX and Spanish IBEX 35 fell by about the same amount of 0.9% and 0.83% respectively. Italian FTSE MIB, which lost only 0.09%, lost less of all. The decline of European indices was expected and followed other world stock markets. Traders are looking to averse risks as they are still concerned about some of the events taking place in the world. Among them is the high inflation rate, which could lead to an economic downturn. The effects of inflation are also reflected in companies' quarterly reports. To a greater extent, rising prices have affected supplies and transportation costs. All this hurts the potential profits of companies. Thanks to the announcement of the 5-year extension of the employment contract with the current CEO of Thyssenkrupp, Martina Merz, the company's securities increased by 2.2%. Due to the reduction of losses in the first half of the year and increased revenues by EasyJet Plc, its share price rose by 0.1%. However, the company warned of impending cost increases in the second half of the year due to higher fuel prices and the strengthened US dollar. The UK Royal Mail showed an 8.8% drop in pretax profit to £662 million for the fiscal year that ended March 27. Meanwhile, operating profits rose by 8% to £758 million, but were not 7% below experts' expectations. Revenues for the first quarter increased by only 1%, contrary to analysts' forecasts. As a consequence of a weak quarterly report, the value of Royal Mail securities fell by 12.4%. At the same time, a significant increase in share prices was demonstrated by Homeserve with the shares going up by 10.2%. This was due to the announcement of the forthcoming major deal on its acquisition by Brookfield Asset Management Inc. for a total amount of £4.08 billion. Ambu AS also rose by 9.1%, as well as InPost SA, which added 7.1%. The share price of CNH Industrial fell by 1.9% and its subsidiary Iveco Group declined by 1.5%. The material has been provided by InstaForex Company - www.instaforex.com |
| Technical analysis of GBP/USD for May 20, 2022 Posted: 20 May 2022 06:53 AM PDT
The GBP/USD pair has broken resistance at 1.2443 which acts as a support this morning. The pair is moving between the levels of 1.2443 and 1.2524. As the trend is still above the 100 EMA, a bullish outlook remains the same as long as the 100 EMA is headed to the upside. Consequently, the level of 1.2443 remains a key resistance zone. Therefore, there is a possibility that the GBP/USD pair will move upwards above 1.2443, which coincides with a ratio 78% of Fibonacci retracement. The falling structure does not look corrective. In order to indicate a bearish opportunity above 1.2443, buy above this level with the first target at 1.2524. Moreover, if the pair succeeds to pass through 1.2524, it will move upwards continuing the bullish trend development to 1.2583 in order to test the daily resistance 2. However, if a breakout happens at 1.2383, this scenario may be invalidated. Also, it should be noted that the weekly pivot is seen at the level of 1.2343. But, the market is still in an uptrend for that we still prefer the bullish scenario. The material has been provided by InstaForex Company - www.instaforex.com |
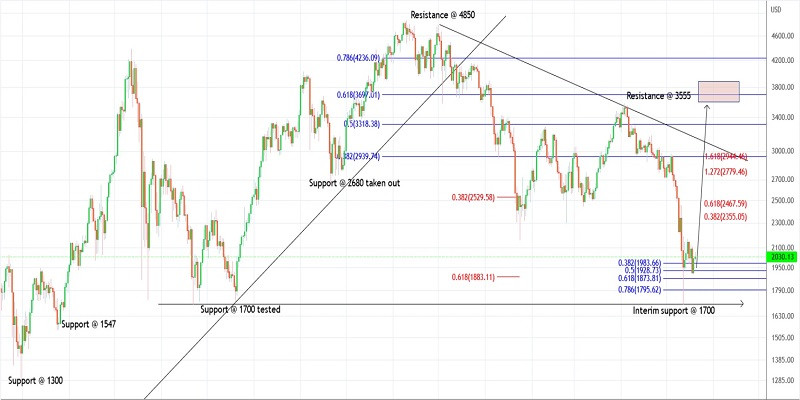
| Trading plan for Ethereum on May 20, 2022 Posted: 20 May 2022 06:49 AM PDT
Technical outlook:Ethereum dropped through $1,900 during the early Asian session on Thursday before finding support. The crypto developed a sharp rally thereafter closing the day higher at around $2,020, erasing all losses. Bulls have managed to carve a potential Engulfing Bullish candlestick pattern on the daily chart indicating further potential through $3,000 at least. Ethereum has been dropping since the $4,850 highs through the $1,700 low carved over the last week. As discussed earlier, one-year support has also been taken out around $1,700 leading to the counter-trend move. Bulls have been successful to produce the first leg higher of the proposed corrective phase between $1,700 and $2,165 earlier. Ethereum's drop through the $1,900 mark could be seen as the second wave of the overall corrective rally. If the above structure holds well, bulls will now be inclined to extend the rally towards $3,000 and $3,500 as the third wave unfolds. Traders might be preparing to hold long positions and add further against $1,700. Trading plan:Potential rally through $3,000 and $3,500 against $1,700, then lower Good luck! The material has been provided by InstaForex Company - www.instaforex.com |
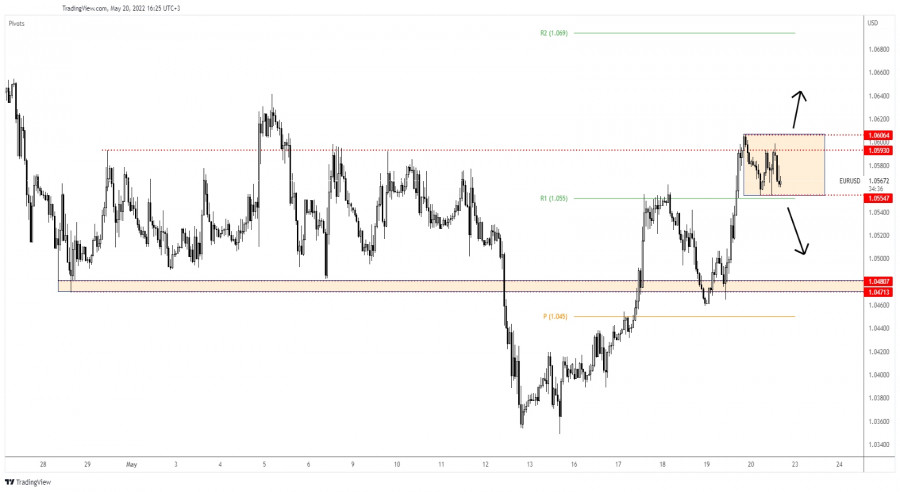
| EUR/USD rejected by 1.0593 key resistance Posted: 20 May 2022 06:46 AM PDT The EUR/USD pair is trading lower as the Dollar Index tries to rebound and recover after its sell-off. The pair was trading at the 1.0562 level at the time of writing. As you already know, the price registered a strong leg higher only because the DXY was in a corrective phase. Fundamentally, the Euro received a helping hand from the German PPI which rose by 2.8% versus 1.2% expected. Still, EUR/USD is dropping right now, having reached a major resistance level. It remains to see how it will react later after the Euro-zone Consumer Confidence is released. The economic indicator is expected to remain unchanged at -22 points. EUR/USD Range Pattern!
As you can see on the H4 chart, EUR/USD registered only false breakouts above the 1.0593 key level. In the short term, it's trapped between the 1.0606 and 1.0554 levels. Escaping from this pattern could bring new trading opportunities. Despite the last swing higher, the bias remains bearish as long as the price settles below the 1.0641 high. A bearish pattern here may signal a new sell-off. Staying below 1.0593 and making a valid breakdown from the current range could signal that the leg higher ended. EUR/USD Outlook!A valid breakdown below 1.0554 and through the R1 (1.0550), a new lower low could activate a new sell-off and could bring selling opportunities. 1.0480 - 1.0471 stands as a potential downside target. The material has been provided by InstaForex Company - www.instaforex.com |
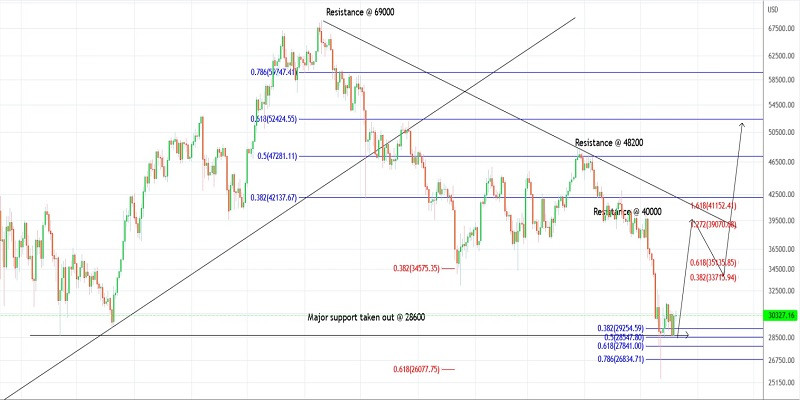
| Trading plan for Bitcoin on May 20, 2022 Posted: 20 May 2022 06:35 AM PDT
Technical outlook:Bitcoin had dropped through $28,600 late on Thursday before finding support. The crypto has produced a sharp rally since then, closing higher at around $30,500. Also, note that a classic Engulfing Bullish pattern is complete on the daily chart suggesting further upside against the $28,600 lows. Potential remains through $42,000 at least going forward. Bitcoin has carved a meaningful downswing between $69,000 and $25,500 earlier as seen on the above daily chart. The crypto is producing a counter-trend rally since then and is well poised to push through the $40,000 initial resistance as projected here. Once complete, we can expect the second wave lower within the overall corrective rally. Bitcoin could terminate the anticipated counter-trend rally toward the $48,000-50,000 area, which is close to the Fibonacci 0.618 retracement of the entire drop between $69,000 and $25,500. Traders might be prepared to open fresh long positions and also add further around current levels with a potential target of around $42,000 in the near term. Trading plan:Potential rally towards $42,000 and $50,000 against $20,000 Good luck! The material has been provided by InstaForex Company - www.instaforex.com |
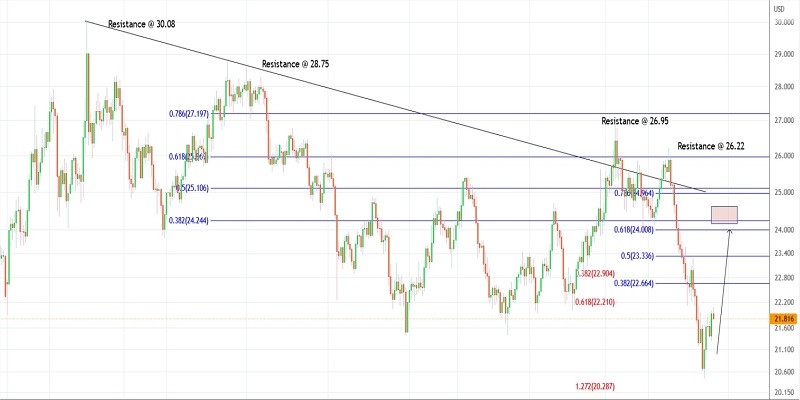
| Trading plan for Silver on May 20, 2022 Posted: 20 May 2022 06:21 AM PDT
Technical outlook:Silver has raised through the $22.10 mark on the intraday chart on Friday before pulling back. The metal is seen to be trading around $21.80 at this point of writing and might have found intraday support. Bulls might be preparing to hold the price above the $21.50 mark and attempt another rally towards the $22.30 mark in the near term. Silver prices have already reached the minimum requirement to confirm a much deeper rally ahead. Bulls have been successful in taking out initial resistance seen around the $21.95-22.00 zone on lower time frames (1 hour). It is quite possible for bears to take control from here and produce a meaningful corrective drop towards the $21.00-20 zone. On a larger time frame, Silver is poised to produce a counter-trend rally towards the $24.00-20 levels, which is the Fibonacci 0.618 retracement of the entire drop between $26.22 and $20.45. Traders might be prepared to hold long positions for a while against the $20.45 mark with a potential target towards $24.00-20. Trading plan:Potential rally through $24.20 against $20.00 and then lower. Good luck! The material has been provided by InstaForex Company - www.instaforex.com |
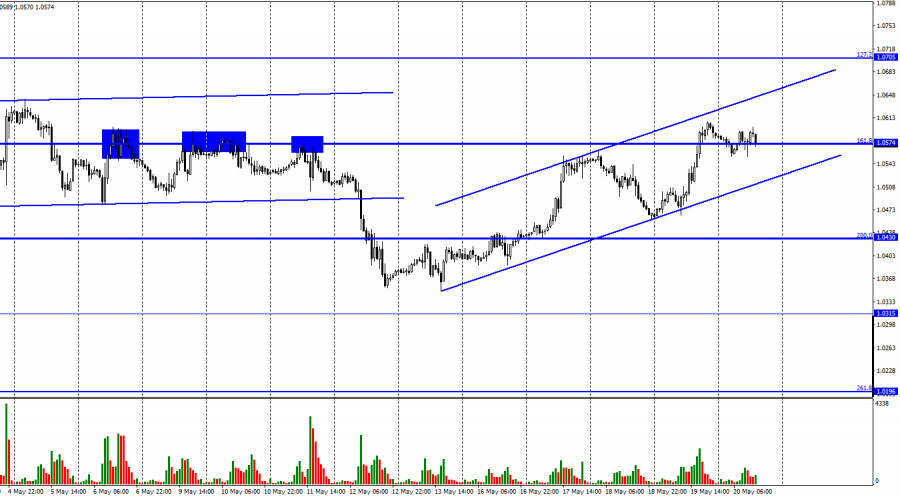
| Posted: 20 May 2022 06:18 AM PDT
Hi, dear traders! On Thursday, EUR/USD settled above the retracement level of 161.8% (1.0574). From there, it could continue to climb towards the next Fibonacci level of 127.2% (1.0705). The new ascending trend channel indicates traders are somewhat bullish on EUR/USD. However, it is not very wide, and the pair could settle below it, if EUR/USD moves downwards. The pair has not moved in any clear direction today. Despite efforts by bullish traders throughout the week, EUR/USD only managed to reach 1.0574. Trading volume is low today due to a lack of events on the economic calendar today. The pair is unlikely to move upwards next week, and there have been no events that could give it support this week. The geopolitical situation remains extremely volatile. The EU and the USA continue to impose more and more sanctions on Russia and supply Ukraine with weapons. Peace talks have come to a halt - both Moscow and Kyiv are uninterested in diplomacy. Ukraine is preparing for a counter-offensive this summer, while Russian forces are getting ready to defend occupied territories. The conflict is likely to continue until the end of 2022 at the very least. It is unclear, what could prompt a strong euro uptrend in this situation. The pair's reversal would be indicated by the current trend channel.
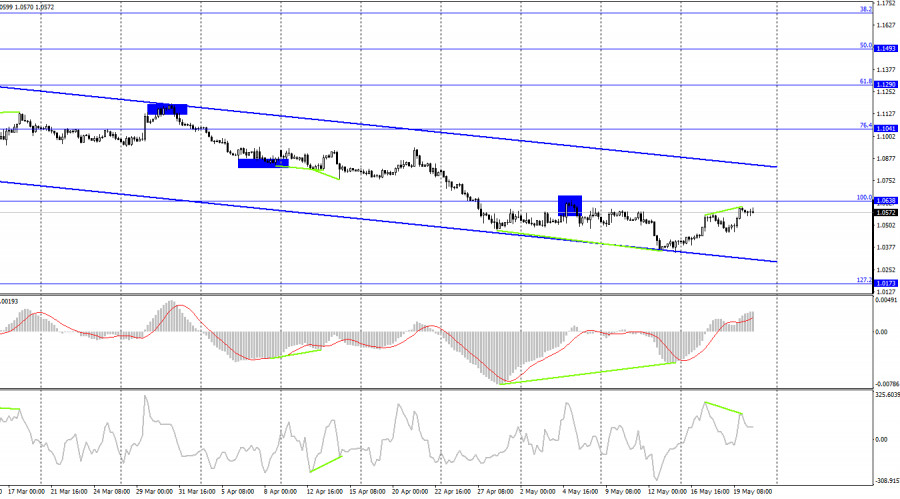
According to the H4 chart, EUR/USD continues to rise towards the retracement level of 100.0% (1.0638). The bearish CCI divergence indicates that the pair could resume its fall towards the Fibo level of 127.2% (1.0173). A bounce off the 100.0% level would also send the pair downwards. The mood of traders remains bearish, as indicated by the descending trend channel. Commitments of Traders (COT) report:
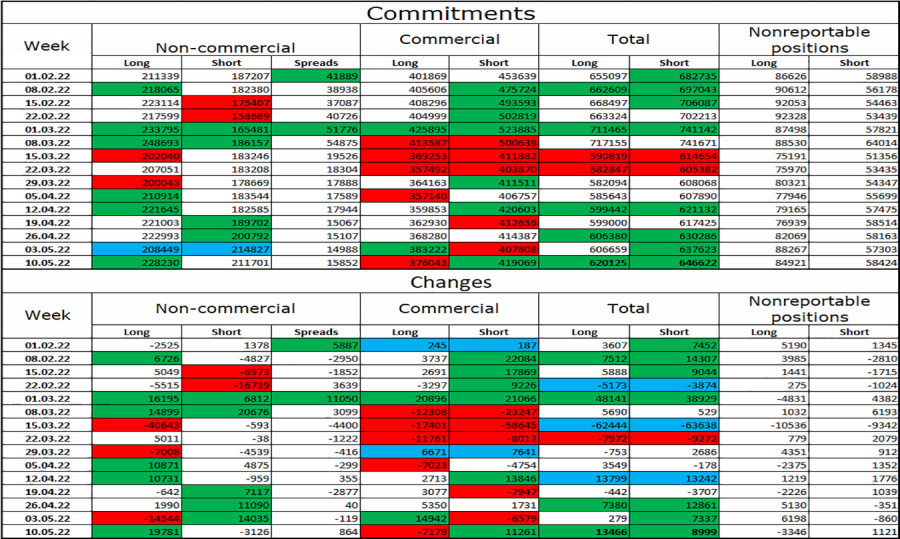
During the last week covered by the report, traders opened 19,781 Long position and closed 3,126 Short positions, indicating an increasingly bullish trend. The total number of opened Long positions is now 228,000 against 211,000 Short positions. The gap between them is very low. Over the past several months, traders were largely bullish on EUR, despite the euro's slump. The situation remains practically unchanged at this point. The expectations set by the COT report do not match the real situation in the market. US and EU economic calendar: There are no events in both the EU and the US today. Outlook for EUR/USD: New short positions can be opened if EUR/USD bounces off 1,0638 on the H4 chart, with 1.0430 being the target. Earlier, traders were recommended to open long positions if EUR/USD closed above 1.0574 targeting 1.0705. These positions can be kept open, because the pair did not close below 1.0574. The material has been provided by InstaForex Company - www.instaforex.com |
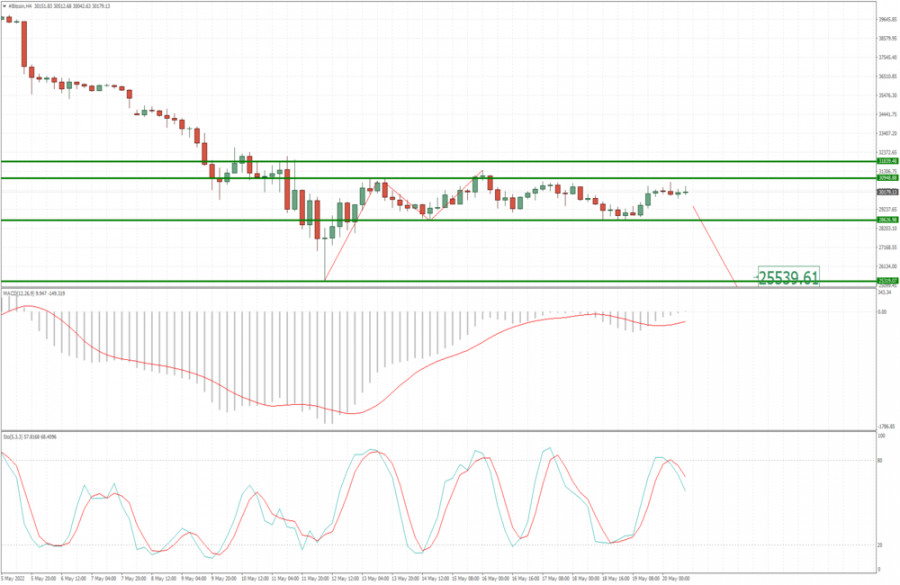
| BTC update for May 20,.2022 -Sideways market, watch for breakout Posted: 20 May 2022 06:16 AM PDT Technical analysis:
BTC has been trading sideways at the price of $30.200 in the well defined trading range. Watch for potential breakout to confirm further direction. Trading recommendation: If the price breaks the pivot low at $28.600, there is potential for bigger drop towards $25.540. Under this condition selling will be preferable. If the price breaks the pivot high at $32.500, there is potential for rally towards $34.200. Buying opportunities will be preferable under this condition. The material has been provided by InstaForex Company - www.instaforex.com |
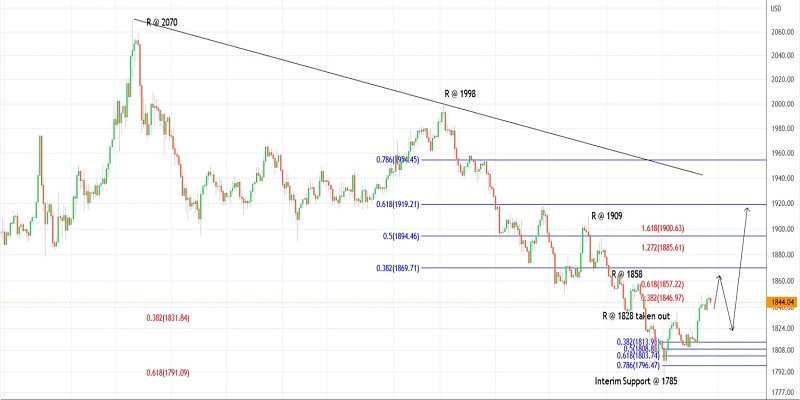
| Trading plan for Gold on May 20, 2022 Posted: 20 May 2022 06:06 AM PDT
Technical outlook:Gold prices rallied through the $1,849 high in the late New York session on Thursday before pulling back. The yellow metal has hit its initial Fibonacci extension around the $1,846-47 mark as projected on the 4H chart here.Since then, prices have drifted sideways within a potential expanded flat as bulls prepare to take on the next target around $1,857. Gold prices have the potential to push through $1,865 in the near term before producing a meaningful correction. Also, note that resistance around $1,858-60 would be taken out next as bulls are poised to remain in control. The yellow metal had carved a meaningful downswing between $1,998 and $1,786 earlier, which is being retraced now. Gold prices are potentially heading towards $1,865 and $1,920 in the next few trading sessions. Besides, note that $1,920 is close to the Fibonacci 0.618 retracement of the above drop. Bears will be poised to come back in control thereafter and continue dragging lower towards $1,676 and $1,450 going forward. Trading plan:Potential rally through $1,865 and $1,920 against $1,780, then lower. Good luck! The material has been provided by InstaForex Company - www.instaforex.com |
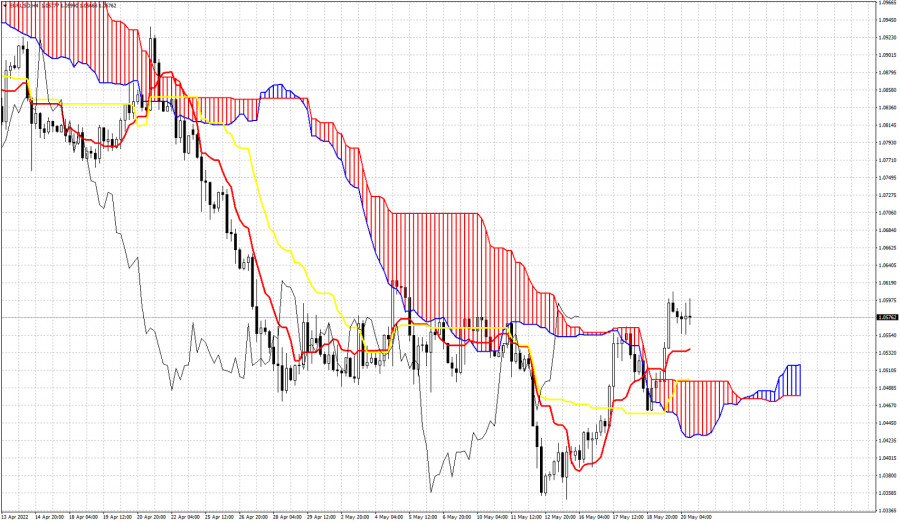
| Ichimoku cloud indicator analysis on EURUSD for May 20, 2022. Posted: 20 May 2022 06:04 AM PDT EURUSD provided a bullish breakout yesterday. Price broke out of the 4 hour Kumo. Bulls now need to defend the Kumo and keep price above the cloud. Support is found at 1.05 where we find the upper cloud boundary and the kijun-sen (yellow line indicator).
|
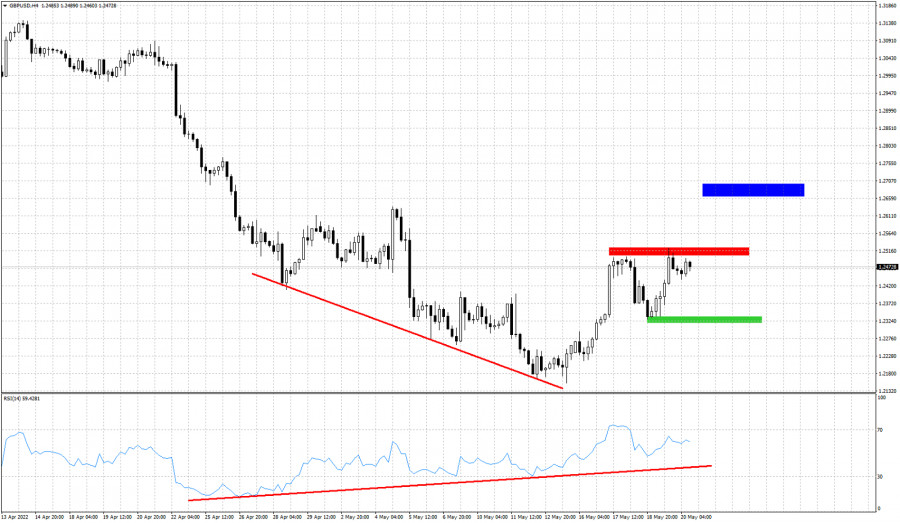
| Technical analysis on GBPUSD for May 20, 2022. Posted: 20 May 2022 05:57 AM PDT GBPUSD is trading around 1.2477. Price is below short-term resistance at 1.2515, but has already formed a higher low. This higher low gives hopes to bulls for an upward break out. If resistance is broken, we should then expect GBPUSD to rise towards 1.2670-1.2680.
Green rectangle- short-term support Red rectangle- resistance Blue rectangle- target if resistance is broken GBPUSD is challenging the red resistance. If broken we get a bullish signal and our target will be the blue rectangle. This bullish scenario is valid as long as price is above the green support area. The RSI bullish divergence we identified a few days ago provided the upward bounce we were expecting. Will GBPUSD continue higher? There are increased chances of this happening. The material has been provided by InstaForex Company - www.instaforex.com |
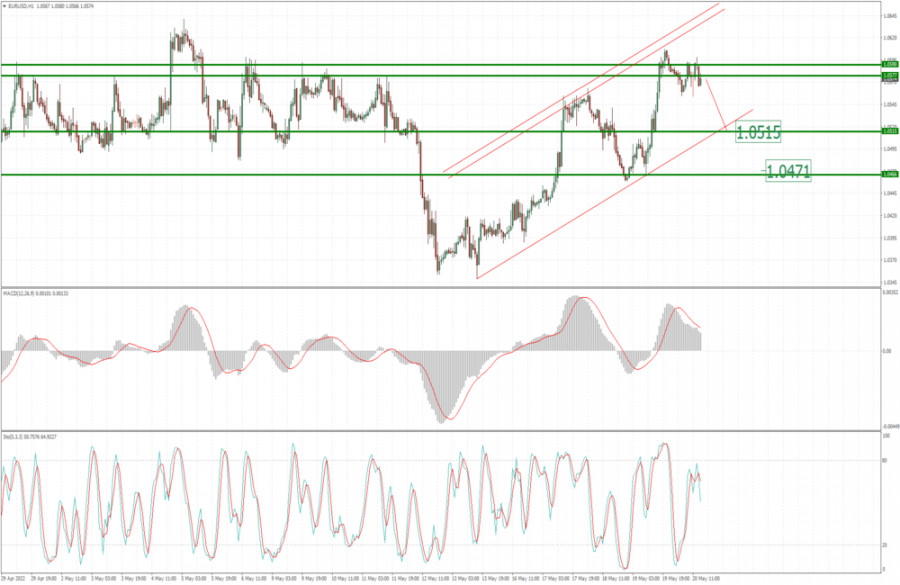
| Posted: 20 May 2022 05:55 AM PDT Technical analysis:
EUR/USD has been trading upwards yesterday but the price has reached the key pivot level at 1.0600 and I see potential for the downside movement. Trading recommendation: Due to the strong downside cycle on the daily time-frame in the background and potential for ABC upside correction completion, I see further downside movement. Watch for potential selling opportunities on the intraday rallies with the downside objectives at 1.0515 and 1.0470. MACD oscillator is showing divergence and potential for the downside rotation. The material has been provided by InstaForex Company - www.instaforex.com |
| Trading plan for USDJPY on May 20, 2022 Posted: 20 May 2022 05:49 AM PDT
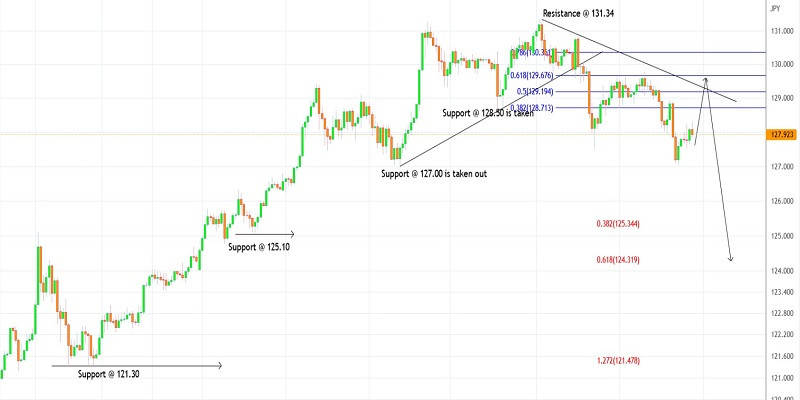
Technical outlook:USDJPY dropped through 127.00 during the New York session on Thursday, taking out initial support as marked on the 4H chart here. We have revised the wave structure and potential downside targets as bears asserted themselves and triggered a much deeper correction. The currency pair is expected to pullback through 129.60-70 in the near term. USDJPY has carved a meaningful downswing between 131.34 and 127.00 in the past few trading sessions. Ideally, the above drop should be retraced towards the 129.60-70 zone, which is also the Fibonacci 0.618 level as projected here. Bears will be poised to be back in control thereafter and drag through 125.00 mark. USDJPY is now facing strong resistance around 131.34 while the next-in-line support is seen at 125.10. Once the counter-trend rally is complete at 129.60, the currency pair is expected to turn lower through 125.00 and 124.00. Traders might book profits on short positions initiated earlier around 131.00 and look to sell higher again. Trading plan:Potential rally to 129.60 against 126.00, then lower again. Good luck! The material has been provided by InstaForex Company - www.instaforex.com |

| You are subscribed to email updates from Forex analysis review. To stop receiving these emails, you may unsubscribe now. | Email delivery powered by Google |
| Google, 1600 Amphitheatre Parkway, Mountain View, CA 94043, United States | |


Comments