Forex analysis review
Forex analysis review |
- Technical analysis of BTC/USD for May 06-07, 2021
- May 6, 2022 : EUR/USD daily technical review and trading opportunities.
- May 6, 2022 : EUR/USD Intraday technical analysis and trading plan.
- May 6, 2022 : GBP/USD Intraday technical analysis and significant key-levels.
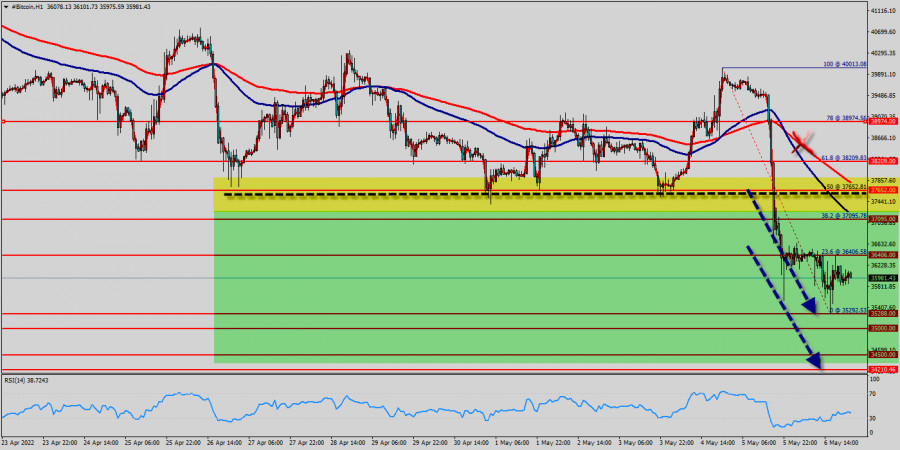
| Technical analysis of BTC/USD for May 06-07, 2021 Posted: 06 May 2022 03:24 PM PDT
BTC/USD decreased within an down channel. Closing below the Pivot Point ($ 37k) could assure that BTC/USD will move lower towards cooling new lows. the bears must break through $35,292 in order to resume the down trend. We expect to see a strong reaction off this level to push price down towards $35,500 before $35,292 support (Fibonacci retracement, horizontal swing low support). RSI (14) is seeing major resistance below 40% where a corresponding reaction could occur. This resistance has been rejected several times confirming the downtrend. Additionally, the RSI starts signaling a downward trend. Bitcoin dropped from the level of $37,095 to the bottom around $35,292. But the pair has rebounded from the bottom of $35,292 to close at $35,910. Today, the first support level is seen at $35,292, and the price is moving in a bearish channel now. Furthermore, the price has been set below the strong resistance at the level of $37,095, which coincides with the 38.2% Fibonacci retracement level. As a result, if Bitcoin is able to break out the first support at $35,292, the market will decline further to $ 35k in order to test the daily support 2. In the H1 time frame, the pair will probably go down because the downtrend is still strong. Consequently, the market is likely to show signs of a bearish trend. So, it will be good to sell below the level of $36,406 with the first target at $35,292 and further to $35,000 - $34,500. Notes : As we know that : 1 BTC ---> $ 35,938 approximately 1 ETH ---> $ 2,687 approximately So, 1 ETH ---> 0.0747 BTC. However, one Ethereum is only worth 0.0747 Bitcoin (May 07, 2022). Forecast (BTC/USD) : The volatility is very high for that the BTC/USD is still moving between $37,095 and $35,292 in coming hours. Consequently, the market is likely to show signs of a bullish trend again. Hence, it will be good to sell below the level of $ 37k and $ 36k with the first target at $35,292 and further to $34,500 in order to test the weekly support. However, if the BTC/USD is able to break out the daily resistance at $ 37k, the market will rise further to $ 40k to approach resistance 2 today. The material has been provided by InstaForex Company - www.instaforex.com |
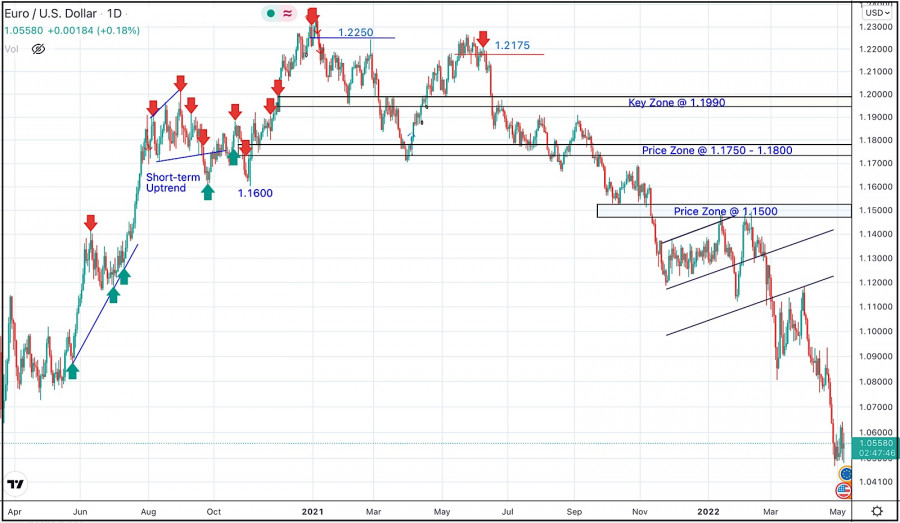
| May 6, 2022 : EUR/USD daily technical review and trading opportunities. Posted: 06 May 2022 11:21 AM PDT
In late September, Re-closure below the price level of 1.1700 has initiated downside-movement towards 1.1500 where some recovery was witnessed. Shortly after, Price levels around 1.1700 managed to hold prices for a short period of time before another price decline took place towards 1.1200. Then the EURUSD has temporarily moved-up within the depicted movement channel until downside breakout occurred recently. Since then, the price zone around 1.1500 has applied significant SELLING pressure when a valid SELL Entry was offered upon the previous ascending movement towards it. Shortly after, the EURUSD looked oversold while approaching the price levels of 1.0800. That's where the recent upside movement was previously initiated. That's why, the recent movement towards 1.1200 was considered for another SELL Trade which is already running in profits now. For beginners, the current price levels are too low to have SELL trades around. Hence, intraday BUY trades are considered a better option. Any ascending movement above 1.0600 will probably enable more advancement towards 1.0700 and 1.0850. Otherwise, conservative traders should stay out of the market. The material has been provided by InstaForex Company - www.instaforex.com |
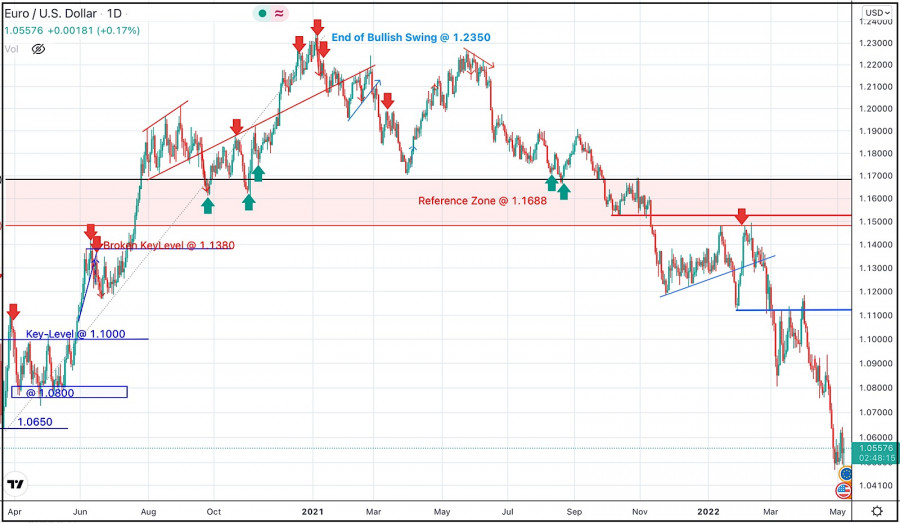
| May 6, 2022 : EUR/USD Intraday technical analysis and trading plan. Posted: 06 May 2022 11:19 AM PDT
A short- term sideway movement was demonstrated within the highlighted zone around 1.1600 before quick bearish decline could occur towards 1.1200. On the other hand, the price zone around 1.1500 - 1.1600 remained a reference zone that applied significant bearish pressure upon two successive bullish visits before another bearish continuation sign was expressed. Hence, downside movement proceeded towards 1.1000 then 1.0920 where short-term bullish pullback was initiated. The price levels around 1.1150 hindered further bullish movement and another bearish move was aggressively expressed towards 1.0500. Failure to persist below the newly-recorded LOW at 1.0500 will probably enable another bullish pullback at least towards 1.0800 and probably 1.1150. Until then, Intraday traders shouldn't have any BUY trades unless bullish persistence above 1.0650 is achieved first. The material has been provided by InstaForex Company - www.instaforex.com |
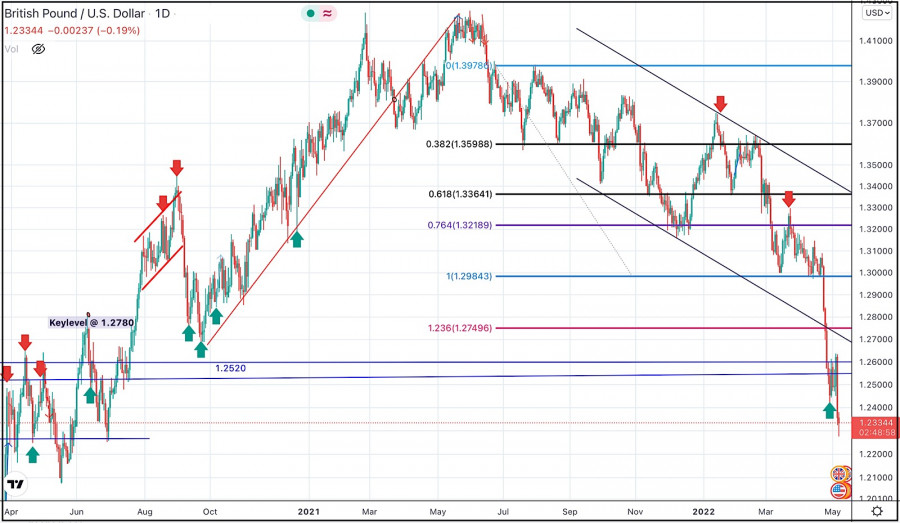
| May 6, 2022 : GBP/USD Intraday technical analysis and significant key-levels. Posted: 06 May 2022 11:18 AM PDT
The GBPUSD pair has been moving within the depicted bearish channel since July. Sideway movement was expressed above 1.3600 while the price levels around 1.3730 - 1.3800 were considered as they offered significant bearish rejection. The short-term outlook turned bearish when the market went below 1.3600. This enhanced the bearish side of the market towards 1.3200 which brought the pair back towards 1.3600 for another re-test. Hence, the recent bullish pullback towards 1.3600 should have been considered for SELL trades as it corresponded to the upper limit of the ongoing bearish channel. Shortly after, Bearish persistence below 1.3360 was needed to enable further downside continuation towards 1.2980 - 1.3000. Bullish rejection has arised many times around 1.3000 standing as a significant Daily Support where the previous consolidation range has arised. This happened before another bearish decline could take place earlier this week. Another bearish breakout below 1.2980 has enabled quick bearish extension towards 1.2600-1.2550 where some bullish recovery and probably a sideway movement can be anticipated. On the other hand, bullish breakout above 1.2750 is needed to abolish the short-term bearish scenario and may enable quick bullish advancement towards 1.2980, 1.3300 and probably 1.3600 if sufficient bullish momentum is expressed. The material has been provided by InstaForex Company - www.instaforex.com |
| You are subscribed to email updates from Forex analysis review. To stop receiving these emails, you may unsubscribe now. | Email delivery powered by Google |
| Google, 1600 Amphitheatre Parkway, Mountain View, CA 94043, United States | |


Comments