Forex analysis review
Forex analysis review |
- May 27, 2022 : EUR/USD daily technical review and trading opportunities.
- May 27, 2022 : EUR/USD Intraday technical analysis and trading plan.
- May 27, 2022 : GBP/USD Intraday technical analysis and significant key-levels.
- GBP/USD: valid breakout signals more gains
- Gold crashes as USD rallies
- US stock market closes with huge gains. US Federal Reserve accounts for positive news
- Technical analysis of GBP/USD for May 27, 2022
- Technical analysis of EUR/USD for May 27, 2022
- Trading Signal for Bitcoin (BTC/USD) on May 27-30, 2022: buy above $29,300 (21 SMA - range)
- Trading Signal for Dow Jones-30 (#INDU) on May 27-30, 2022: sell below 32,825 (2/8 Murray - 200 EMA)
- USDJPY remains vulnerable to more downside.
- Ichimoku cloud indicator analysis on Gold for May 27, 2022.
- Ichimoku cloud indicator analysis on EURUSD for May 27, 2022.
- Short-term Bitcoin analysis.
- EUR/USD on May 27, 2022
- Trading Signal for EUR/USD on May 27-30, 2022: sell below 1.0750 (4/8 Murray - overbought)
- Trading plan for Ethereum on May 27, 2022
- Key European indices rise by 0.56-1.78%
- Trading plan for Bitcoin on May 27, 2022
- Trading plan for Silver for May 26, 2022
- USD/CAD: technical analysis and trading recommendations for 05/27/2022
- Trading plan for Gold on May 27, 2022
- US premarket on May 27: US stock market likely to snap seven-week losing streak
- Major altcoins suffer losses
- GBP/USD: trading plan for US session on May 27 (morning trades analysis). Pound declines to level seen this morning
| May 27, 2022 : EUR/USD daily technical review and trading opportunities. Posted: 27 May 2022 10:21 AM PDT
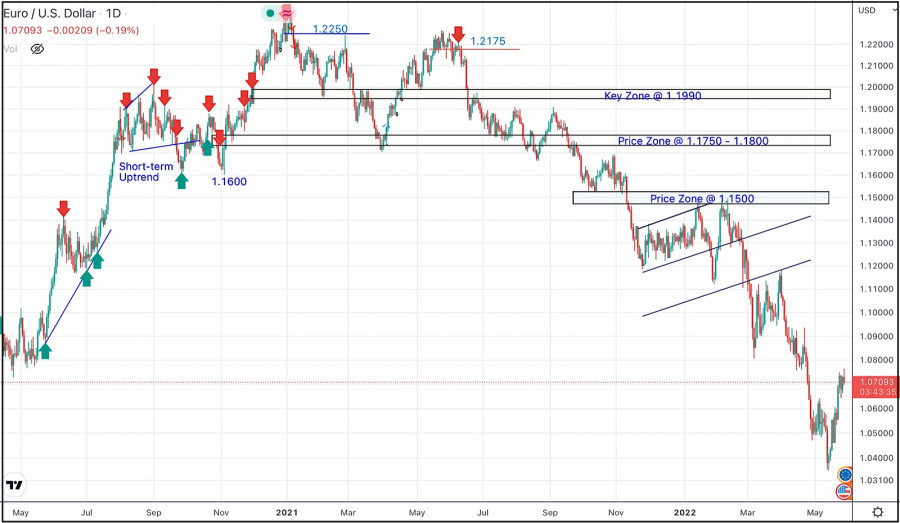
In late September, Re-closure below the price level of 1.1700 has initiated downside-movement towards 1.1500 where some recovery was witnessed. Shortly after, Price levels around 1.1700 managed to hold prices for a short period of time before another price decline took place towards 1.1200. Then the EURUSD has temporarily moved-up within the depicted movement channel until downside breakout occurred recently. Since then, the price zone around 1.1500 has applied significant SELLING pressure when a valid SELL Entry was offered upon the previous ascending movement towards it. Shortly after, the EURUSD looked oversold while approaching the price levels of 1.0800. That's where the recent upside movement was previously initiated. That's why, the recent movement towards 1.1200 was considered for another SELL Trade which is already running in profits now. For beginners, the current price levels are too low to have SELL trades around. Hence, intraday BUY trades are considered a better option. Any ascending movement above 1.0600 will probably enable more advancement towards 1.0700 and 1.0850. Otherwise, conservative traders should stay out of the market. The material has been provided by InstaForex Company - www.instaforex.com |
| May 27, 2022 : EUR/USD Intraday technical analysis and trading plan. Posted: 27 May 2022 10:20 AM PDT
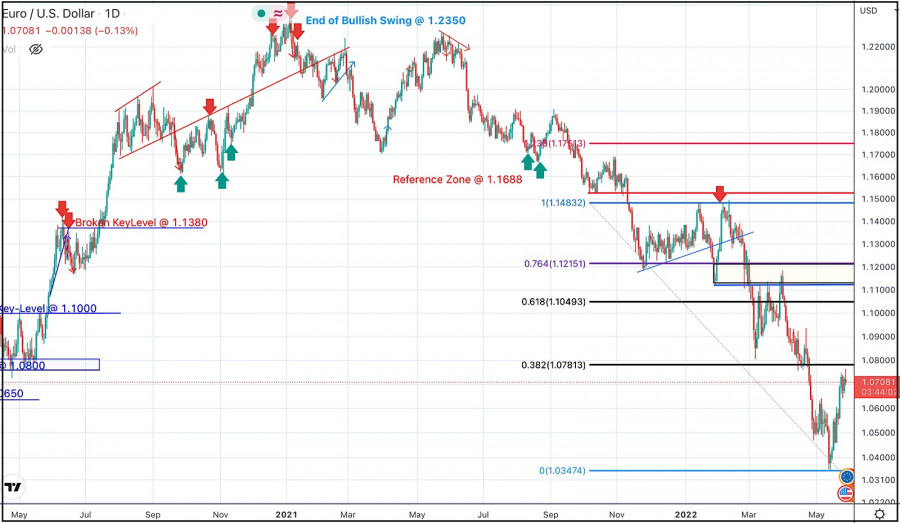
A short- term sideway movement was demonstrated within the highlighted zone around 1.1600 before quick bearish decline could occur towards 1.1200. On the other hand, the price zone around 1.1500 - 1.1600 remained a reference zone that applied significant bearish pressure upon two successive bullish visits before another bearish continuation sign was expressed. Hence, downside movement proceeded towards 1.1000 then 1.0920 where short-term bullish pullback was initiated. The price levels around 1.1150 hindered further bullish movement before another bearish move was aggressively expressed towards 1.0500. Failure to persist below the newly-recorded LOW at 1.0350 will probably enable another bullish pullback at least towards 1.0800 and probably 1.1150 where bearish trades can be offered. Until then, Intraday traders shouldn't have any BUY trades unless bullish persistence above 1.0650 is achieved first. The material has been provided by InstaForex Company - www.instaforex.com |
| May 27, 2022 : GBP/USD Intraday technical analysis and significant key-levels. Posted: 27 May 2022 10:20 AM PDT
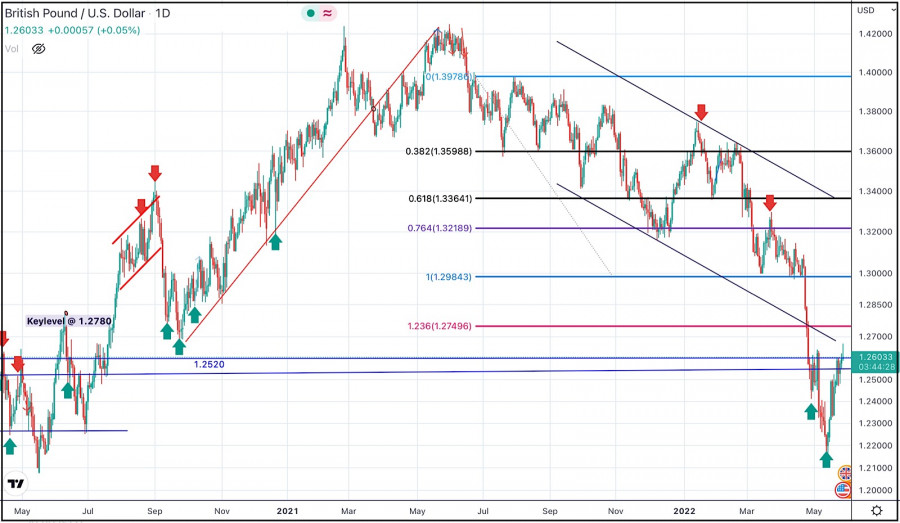
The GBPUSD pair has been moving within the depicted bearish channel since July. Sideway movement was expressed above 1.3600 while the price levels around 1.3730 - 1.3800 were considered as they offered significant bearish rejection. The short-term outlook turned bearish when the market went below 1.3600. This enhanced the bearish side of the market towards 1.3200 which brought the pair back towards 1.3600 for another re-test. Hence, the recent bullish pullback towards 1.3600 should have been considered for SELL trades as it corresponded to the upper limit of the ongoing bearish channel. Shortly after, Bearish persistence below 1.3360 enabled bearish continuation towards 1.2980 - 1.3000. Bullish rejection has arised many times around 1.3000 standing as a significant Daily Support. This happened before another bearish decline could take place earlier last week. Another bearish breakout below 1.2980 has enabled quick bearish extension towards 1.2600-1.2550 where some bullish recovery and a short-term sideway movement could be established before another downside movement was expressed. Previous bearish decline was expected to extend towards 1.2100 where bullish reversal could be expected. However, considerable bullish rejection was expressed around 1.2200. Currently, bullish breakout above 1.2550 is needed to abolish the short-term bearish scenario and may enable quick bullish advancement towards 1.2750, 1.3300 and probably 1.3600 if sufficient bullish momentum is maintained. Otherwise, the GBP/USD pair remains under bearish pressure to challenge the new low around 1.2150 again. Hence, any bearish reversal signs around 1.2550 should be considered for SELLING the pair. The material has been provided by InstaForex Company - www.instaforex.com |
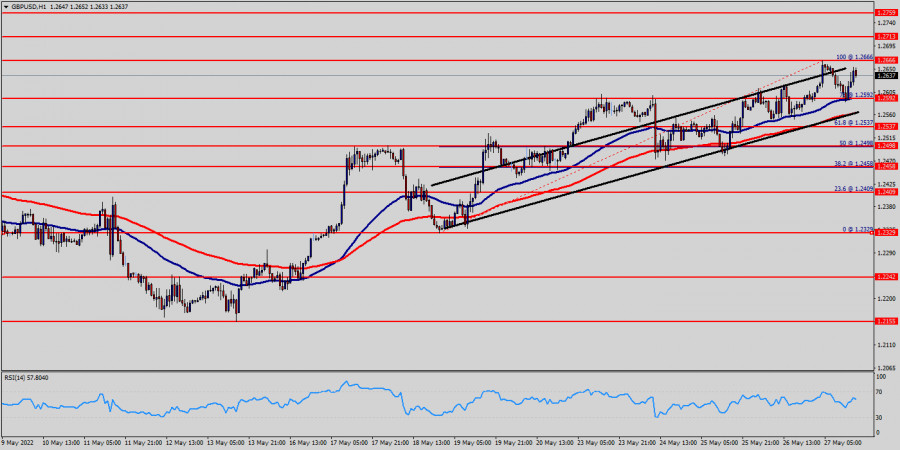
| GBP/USD: valid breakout signals more gains Posted: 27 May 2022 09:52 AM PDT The GBP/USD pair is trading in the red as the DXY's rebound lifted the USD. Still, as you already know from my analyses, the Dollar Index is in a corrective phase, so the bias remains bearish in the short term. Technically, the currency pair reached strong resistance, a valid breakout may signal further growth. Fundamentally, the US data came in mixed today. The Core PCE Price Index rose by 0.3% matching expectations, Revised UoM Consumer Sentiment came in at 58.4 points below 59.1 expected, while the Goods Trade Balance came in better than expected at -105.9B versus -114.8B estimates. Personal Spending rose by 0.9% beating the 0.7% estimates, while Personal Income registered only a 0.4% growth versus the 0.5% forecasted. GBP/USD At Resistance!
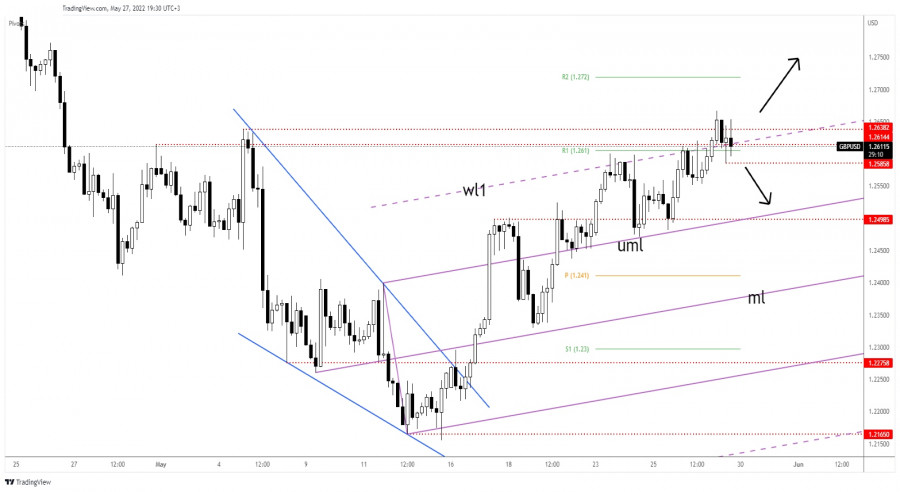
As you can see on the H4 chart, the GBP/USD pair jumped above the warning line (wl1) and above the 1.2614 - 1.2638 area but it has failed to stay above these upside obstacles. Still, the current retreat could be only a temporary one. It could still resume its growth as long as it stays above the 1.2585 immediate support. In the short term, the GBP/USD pair could try again to take out the resistance levels. The bullish pressure remains high after testing and retesting the 1.2498 level and the upper median line (uml). GBP/USD Outlook!Jumping and stabilizing above 1.2638 could confirm an upside continuation. A valid breakout and a new higher high could bring new long opportunities. On the other hand, dropping and closing below 1.2585 may signal a potential drop towards the upper median line (uml). The material has been provided by InstaForex Company - www.instaforex.com |
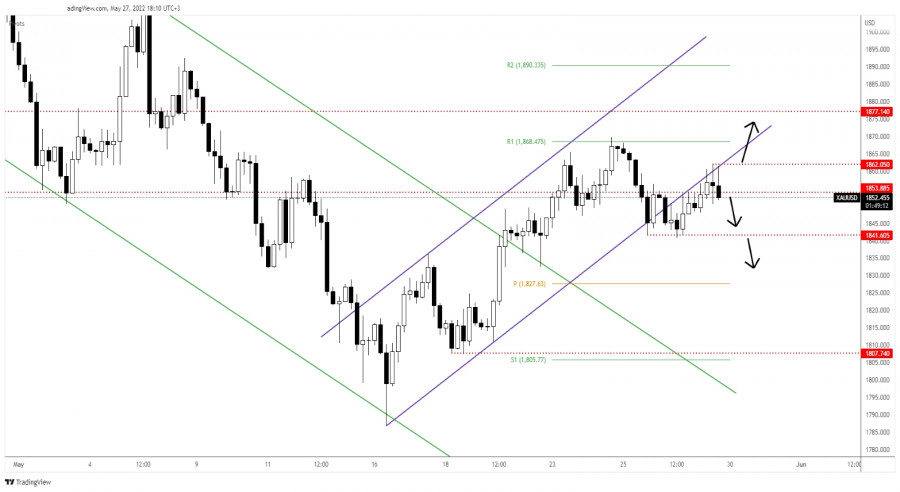
| Posted: 27 May 2022 09:09 AM PDT The price of Gold is trading in the red at 1,851.93 at the time of writing far below 1,862 today's high. It has dropped by 0.56% from today's high and it seems very heavy after failing to confirm an upside continuation. The yellow metal is dropping like a rock as the Dollar Index has managed to rebound after its last sell-off. USD's appreciation forces XAU/USD to drop. Fundamentally, the US data came in mixed, Core PCE Price Index rose by 0.3% matching expectations, the Goods Trade Balance came in at -105.9B versus -114.8B estimates, while the Revised UoM Consumer Sentiment dropped unexpectedly from 59.1 to 58.4 points. In addition, Personal Income came in worse than expected, while Personal Spending reported better than expected data. XAU/USD Uptrend Line Retest!
XAU/USD rebounded after failing to take out the 1,841 support. Now, it has tested and retested the broken uptrend line signaling that we may still have a larger drop. As you can see on the H4 chart, the price registered only false breakouts with great separation signaling exhausted buyers. Failing to stay above 1,853 may signal a potential sell-off towards the 1,841 key support. In my opinion, an upside continuation could be signaled by a new higher high, if the price jumps and closes above 1,862. Gold Forecast!A larger drop and a new selling opportunity could be confirmed by a valid breakdown below 1,841. So, only a new lower low could activate a larger drop and could help the sellers to catch new short opportunities. The material has been provided by InstaForex Company - www.instaforex.com |
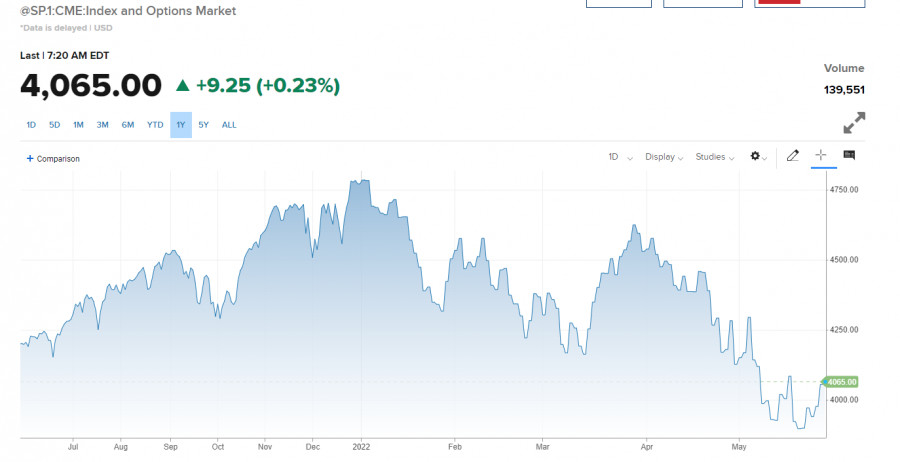
| US stock market closes with huge gains. US Federal Reserve accounts for positive news Posted: 27 May 2022 08:21 AM PDT At the close of Thursday's trading session, major US indexes recorded huge gains due to strengthening of the technology as well as consumer service sectors.
As a result, the Dow Jones Industrial Average rose by 1.61% to 32637.19 points and closed higher for the fifth straight trading session for the first time in two months. The S&P 500 broad market index gained 1.99% to 4,057.84 points, while the high-tech NASDAQ Composite surged by 2.68% to 1,740.65 points. Largest gains and declines The day before, shares of Boeing Co, Nike Inc and Home Depot Inc showed record gains among Dow Jones components. They advanced 4.65%, 4.38%, and 3.15% respectively. Stock of Merck & Company Inc (-1.54%), Verizon Communications Inc (-0.49%) and Johnson & Johnson (-0.09%) recorded a dramatic decline. They fell by 1.54%, 0.49%, and 0.09% respectively. Shares of Dollar Tree Inc (+21.87%), DXC Technology Co (+15.99%) and Dollar General Corporation (+13.71%) topped the list of gains among the S&P 500 index components in Thursday's trading. Stocks of Kraft Heinz Co (-6.10%), Medtronic PLC (-5.78%) and Centene Corp (-4.01%) made modest gains. The day before, the major gainers of the NASDAQ Composite index were shares of Creatd Inc, Apyx Medical Inc and Scisparc Ltd. They rallied 58.46%, 51.89%, and 41.10% respectively. Stocks of Avadel Pharmaceuticals PLC, NRX Pharmaceuticals Inc and OTR Acquisition Corp recorded a sharp decline. They plunged by 68.34%, 58.19%, and 36.64% respectively. Impact of corporate reporting VMware Inc, one of the largest US business software makers, gained 3.2% in Thursday's trading, while semiconductor maker Broadcom's stocks jumped 3.6%. Broadcom executives announced on Thursday that they would buy VMware for $61 billion. The payment will be made in stock and cash. Moreover, Broadcom will assume $8 billion of VMware's net debt. The day before, another reason for Broadcom's market capitalization growth was the publication of quarterly reports. According to the report, the company's net profit increased by 1.7 times in the second fiscal quarter. Airline carrier JetBlue Airways Corp. shares rose by 3.4%. Shares of Chinese Internet giant Alibaba Group Holding soared by 14.8% the day before. In January-March 2022, the company increased its revenue by 9%, while its net loss tripled. Software developer Splunk Inc stock added 4.9% on Thursday after the news came that the company's revenues had surged by 34% in February and April. The market capitalization of Williams-Sonoma Inc, a seller of kitchenware, jumped 9%. The company generated net income and revenue that exceeded market expectations in the first quarter of the current fiscal year. Department store chain Macy's Inc shares soared by 19.3%. In January-April, the company's net profit almost tripled. The stock price of graphics processor maker Nvidia Corp jumped 5.2% the day before. The company generated record revenue in its first fiscal quarter, while its net income fell by 15%. Stocks of cloud service provider Nutanix Inc plummeted by 23% despite the company reducing its net loss in February and April.Consequently, advancers (2,647) outnumbered decliners (555) on the NYSE. At the same time, the performance of 95 stocks remained unchanged. On NASDAQ, stock of 2849 companies gained, 982 companies lost ground and 217 firms closed at the level of the previous session. The CBOE Volatility Index formed on the basis of S&P 500 options trading indicators, declined by 3.07% to 27.50 points. The day before, the participants of the US stock market discussed the publication of the minutes of the FOMC meeting held on May 3-4. According to the document, the majority of the Fed's officials supported raising the interest rate by 50 basis points at the end of the next few meetings. After this news US investors calmed down as many of them feared a more significant increase in the discount rate. Therefore, with approaching summer and the corporate reporting season coming to an end, there are fewer negative factors that could cause a sharp decline in the US stock market. US financial markets will be closed on Monday due to the national holiday Memorial Day. The material has been provided by InstaForex Company - www.instaforex.com |
| Technical analysis of GBP/USD for May 27, 2022 Posted: 27 May 2022 07:35 AM PDT
The GBP/USD pair is going to continue to rise from the level of 1.2592 in the long term. It should be noted that the support is established at the level of 1.2592 which represents the 78% Fibonacci retracement level on the H1 chart. The price is likely to form a double bottom in the same time frame. Accordingly, the GBP/USD pair is showing signs of strength following a breakout of the highest level of 1.2635. Additionally, the RSI is still signaling that the trend is upward as it remains strong above the moving average (100). This suggests the pair will probably go up in coming hours. Accordingly, the market is likely to show signs of a bullish trend. So, buy above the level of 1.2635 with the first target at 1.2666 in order to test the daily resistance 1 and further to 1.2713. Also, it might be noted that the level of 1.2759 is a good place to take profit because it will form a new double top. On the other hand, in case a reversal takes place and the GBP/USD pair breaks through the support level of 1.2537, a further decline to 1.2409 can occur which would indicate a bearish market. The material has been provided by InstaForex Company - www.instaforex.com |
| Technical analysis of EUR/USD for May 27, 2022 Posted: 27 May 2022 07:26 AM PDT
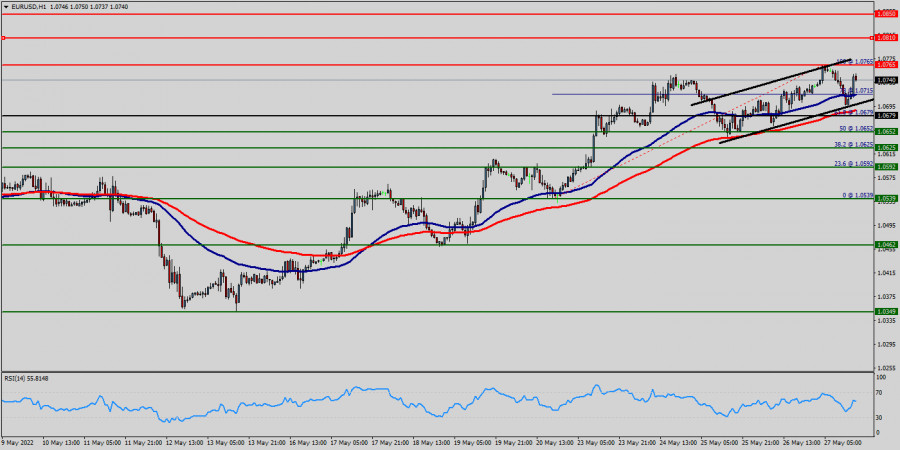
The EUR/USD pair has faced strong support at the levels of 1.0679 because resistance had become support on May 27, 2022. However, the strong resistance has been already formed at the level of 1.0765 and the pair is likely to try to approach it in order to test it again. If the pair fails to pass through the level of 1.0765 , the market will indicate a bullish opportunity above the new strong resistance level of 1.0765 (the level of 1.0765 coincides with a ratio of 100% Fibonacci). Moreover, the RSI starts signaling an upward trend, as the trend is still showing strength above the moving average (100) and (50). Thus, the market is indicating a bullish opportunity above the level of 1.0765 for that it will be good to buy at 1.0765 with the first target of 1.0810. It will also call for an uptrend in order to continue towards 1.0850. The daily strong resistance is seen at 1.0850. On the other hand, the stop loss should always be taken into account, for that it will be reasonable to set your stop loss at the level of 1.0625. The material has been provided by InstaForex Company - www.instaforex.com |
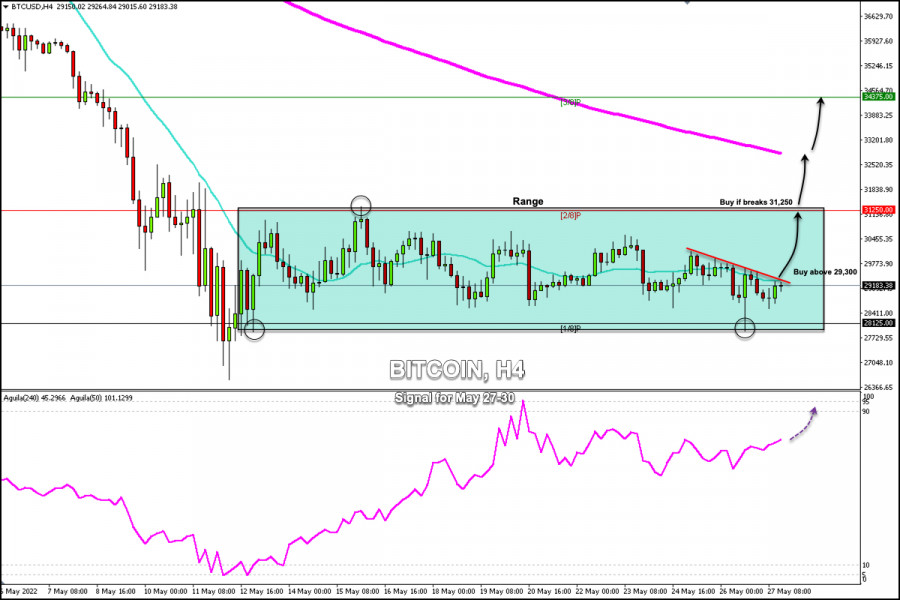
| Trading Signal for Bitcoin (BTC/USD) on May 27-30, 2022: buy above $29,300 (21 SMA - range) Posted: 27 May 2022 07:25 AM PDT
Early in the American session, the price of Bitcoin (BTC/USD) is trading at 29,183, recovering from the fall of May 26 that was as deep as 27,910. According to the 4-hour chart, we can see a downtrend channel formed since May 23. Besides, Bitcoin is trading below the 21 SMA which has become a strong resistance in the short term. If Bitcoin manages to break 21 SMA and the top of the bearish channel in the next few hours and consolidates above 29,300, it would mean a bullish advance so that the price could reach the top of the range around 2/8 Murray at 31,250. Conversely, as long as BTC trades below the 21 SMA at 29,200, we should avoid buying as it is likely to drop to the zone 1/8 Murray again around 28,125. On the other hand, in the event that Bitcoin breaks out of the range zone formed on May 12 and consolidates above 2/8 Murray, the bullish force could accelerate and BTC could reach 200 EMA at 32,700 and even 3/8 Murray at 34,375. Our trading plan for the next few hours is to wait for a break above 29,300 to buy, with targets at the psychological level of 30,000 and 2/8 Murray at 31,250. The eagle indicator is giving a positive signal which supports our bullish strategy. The material has been provided by InstaForex Company - www.instaforex.com |
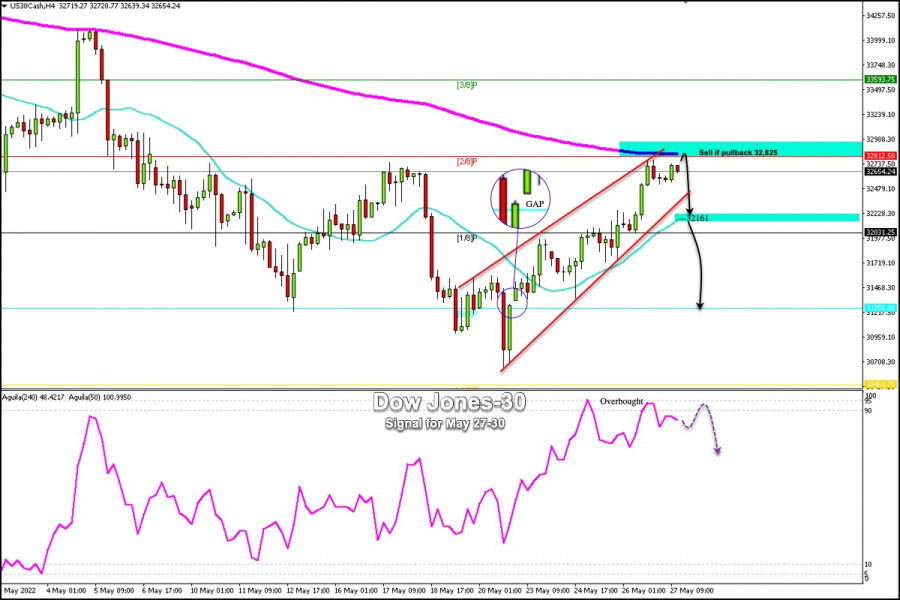
| Trading Signal for Dow Jones-30 (#INDU) on May 27-30, 2022: sell below 32,825 (2/8 Murray - 200 EMA) Posted: 27 May 2022 06:57 AM PDT
Dow Jones-30 Industrial Index (#INDU) is trading at around 32,654 with a strong uptrend but is facing strong resistance at 2/8 Murray and the 200 EMA converging at 32,812. Since the low of 30,635, the DJ30 has recovered over 2000 points and this will be the first weekly gain in eight weeks. Given that there was a strong recovery in the Dow Jones-30, it is likely that it is reaching an overbought zone. According to the eagle indicator, it is likely that as long as it continues to trade below the 200 EMA, a technical correction could happen in the coming days. Since May 17, the market sentiment changed which made investors turn to risk assets such as stock indices and currencies. However, the DJ30 market would be facing the overbought zone. So, a technical correction could follow next week. The main trend according to the daily chart remains down. As long as the index settles below 33,593 (3/8 Murray), it is likely to resume its downtrend in the short term. On the other hand, according to the 4-hour chart, we can see that the DJ30 has been trading with a bullish bias since May 20. The index could accelerate its uptrend if it consolidates and closes above 32,825 (2/8 Murray - 200 EMA) on the daily chart. In case of failure to break and consolidate through 2/8 Murray, it is likely to resume its downtrend and could drop towards the 21 SMA at 32,161 and could even hit 0/8 Murray at 31,250. Our trading plan for the next few hours is to wait for the DJ30 to test the zone 2/8 Murray or the 200 EMA to sell, with targets at the bottom of the uptrend channel or the 21 SMA around 32,161. Additionally, if the bearish force prevails and the price consolidates below 32,161, the index could accelerate its fall to cover the GAP left on May 23 at around 32,250. The material has been provided by InstaForex Company - www.instaforex.com |
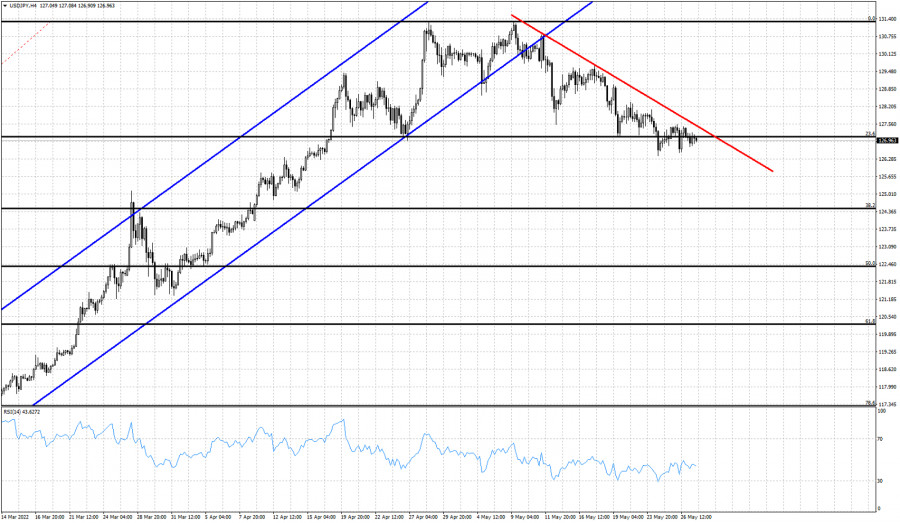
| USDJPY remains vulnerable to more downside. Posted: 27 May 2022 06:54 AM PDT USDJPY is trading around 126.97. Short-term trend is bearish as price is making lower lows and lower highs. Price continues trading below the key downward sloping resistance trend line. As long as this is the case, price will remain vulnerable to sellers. If bulls manage to break above 127.55 we will have a bigger upward breakout.
Blue lines- bullish channel (broken) Black lines- Fibonacci retracements Red line -resistance trend line USDJPY is vulnerable to a move towards the 38% Fibonacci retracement at 124.55. Currently at 126.90, if price breaks below 126.45 we will get a new bearish signal. On the other hand a break above 127.55 would push price higher towards 129-129.45. Currently we prefer to be neuetral if not bearish. The material has been provided by InstaForex Company - www.instaforex.com |
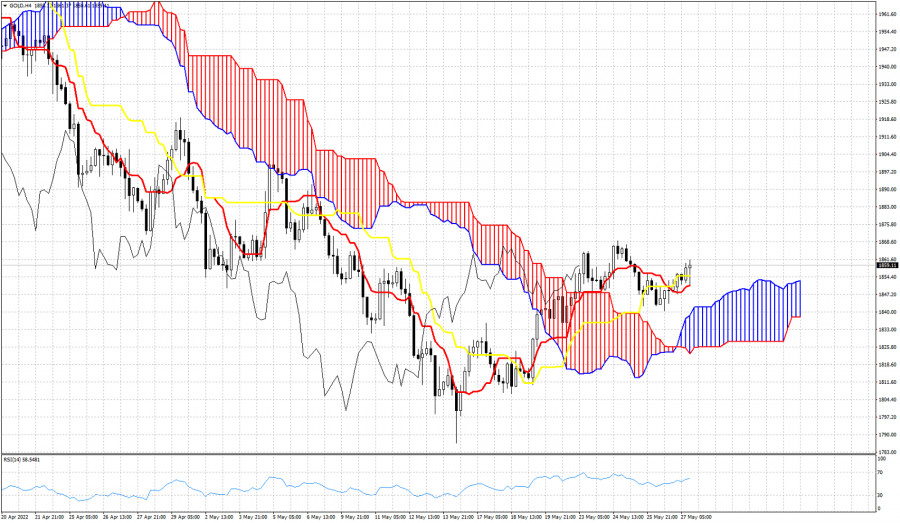
| Ichimoku cloud indicator analysis on Gold for May 27, 2022. Posted: 27 May 2022 06:49 AM PDT Gold bulls have managed to recapture the $1,850 level and price is once again above the tenkan-sen (red line indicator) and the kijun-sen (yellow line indicator). Gold price remains in a bullish trend according to the Ichimoku cloud indicator.
|
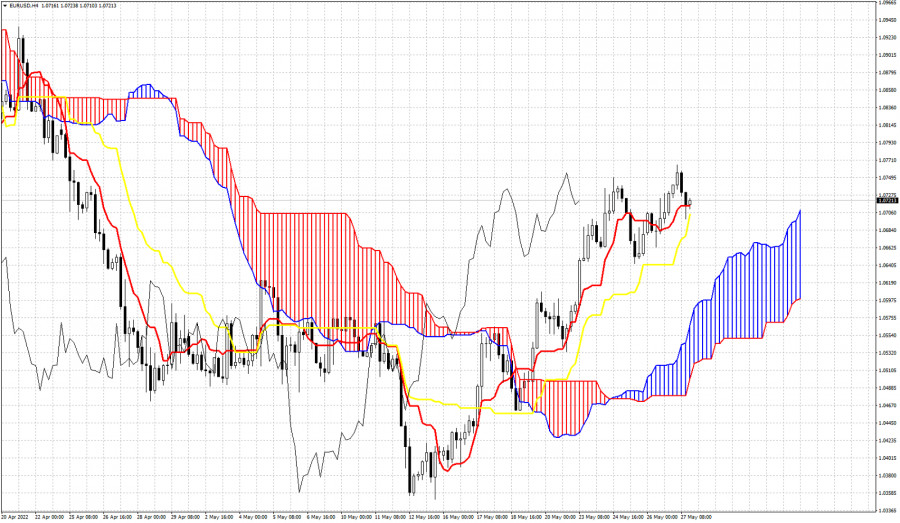
| Ichimoku cloud indicator analysis on EURUSD for May 27, 2022. Posted: 27 May 2022 06:45 AM PDT EURUSD remains in a short-term bullish trend according to the Ichimoku cloud indicator. In the 4 hour chart price is not only above the Kumo (cloud), but also above both the tenkan-sen and kijun-sen indicators.
|
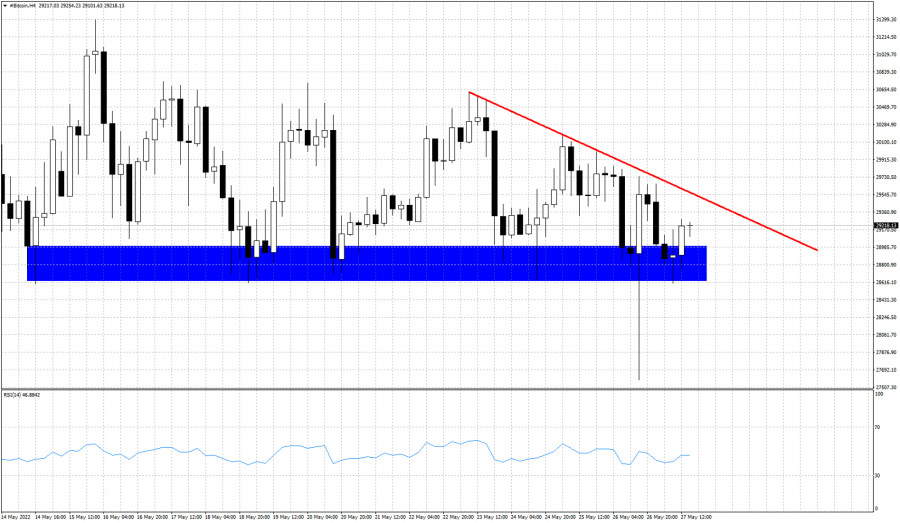
| Posted: 27 May 2022 06:40 AM PDT Bitcoin as expected made a break down below the short-term support zone, but it was short lived. Price bounced back up very fast but price continues to trade below short-term resistance. Price is above the horizontal support once again but at the same time it continues making lower highs.
Red line- resistance trend line Bitcoin broke below support and traded as low as $27,585, while our expectation was a move towards $25,000. Price has resistance at $29,600 where we find the red downward sloping resistance trend line. A second move below the blue horizontal support would be an added sign of weakness that will most probably lead to a move towards $25,000. The material has been provided by InstaForex Company - www.instaforex.com |
| Posted: 27 May 2022 06:12 AM PDT
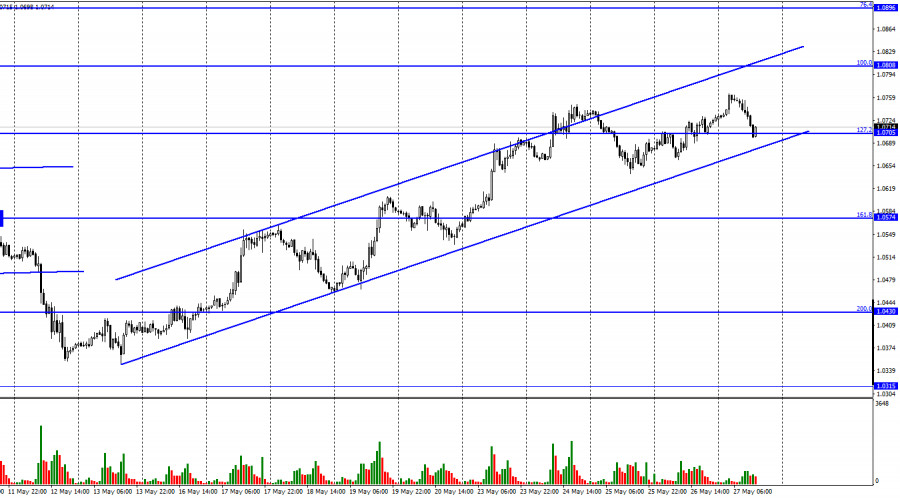
Hi, dear traders! On Thursday, EUR/USD continued to move upwards and closed above the retracement level of 127.2% (1.0705). However, the pair reversed downwards on Friday and fell to the bottom boundary of the trend channel. The ascending trend channel indicates bullish sentiments among traders. If EUR/USD settles below this channel, it could then fall towards the retracement level of 161.8% (1.0574). Over the past 2 weeks, the euro's situation has markedly improved. EUR/USD closed in positive territory almost every day. However, the recent upturn is very likely only a correction - these gains do not match economic reports. The daily chart shows that EUR has retraced upwards after a long downtrend. From time to time, these upward corrections are supported by data releases. Earlier, the euro ignored positive data during its downward trend of the past two months. Currently, the downturn could resume in the near future. Alternatively, the pair could enter a sideways trend. The rhetoric of the ECB and its president Christine Lagarde has become more hawkish recently. The regulator now plans to increase interest rates in summer and autumn of 2022. However, these increases are not particularly large, especially when compared with the Federal Reserve's plans to hike interest rates by 1% at its next two policy meetings. The euro receives very limited support from Lagarde and the ECB, which again indicates that EUR could once again fall in the near future. No events have influenced the trading session early on Friday, with traders opening both long and short positions.
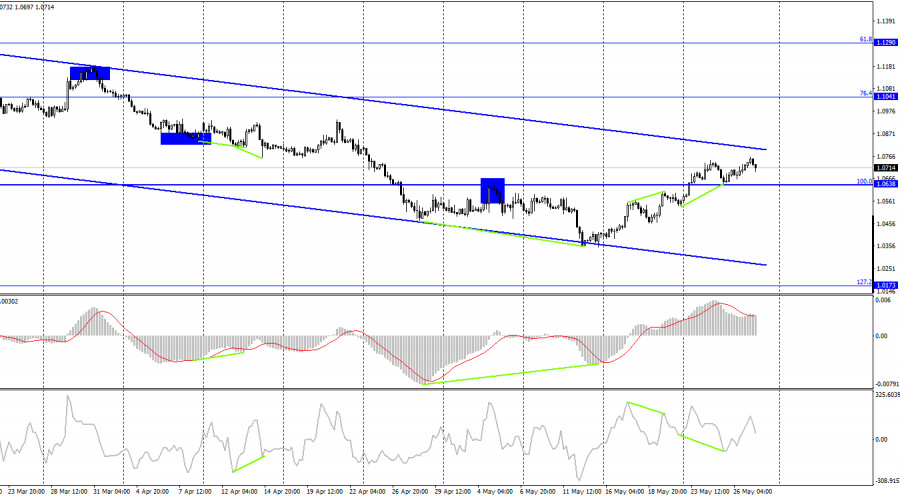
According to the H4 chart, the pair bounced off the retracement level of 100.0% (1.0638) upwards and formed a bullish CCI divergence. EUR/USD continues to move upwards towards the Fibo level of 76.4% (1.1041). However, the pair remains within its descending trend channel, indicating that trader sentiment remains bearish. As stated above, the pair's upturn could likely be a correction - EUR/USD remains in a downtrend on the H4 chart. Commitments of Traders (COT) report:
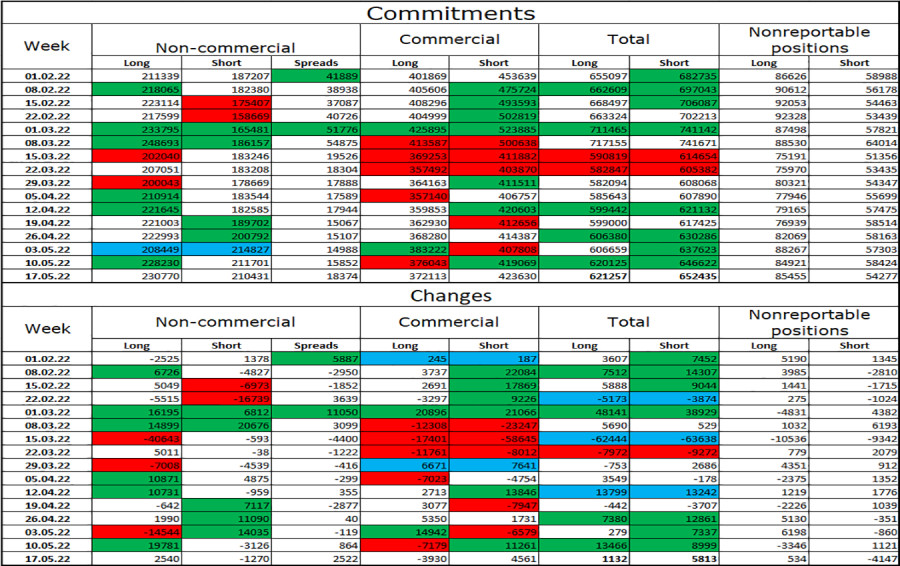
Last week, traders opened 2,540 Long positions and closed 1,270 Short positions, indicating an increasingly bullish sentiment in the market. The total number of open Long positions is not 230,000 against 210,000 Short positions. The gap between Open and Short positions is quite small and does not match the prolonged downward trend of EUR/USD. The European currency has been sliding down, despite the bullish trader sentiment. The situation remains roughly the same this week, with trader positioning not matching the actual situation in the market. US and EU economic calendar: US - Personal income data (12-30 UTC).US - Personal consumption expenditures (PCE) data (12-30 UTC).US - Goods trade balance (12-30 UTC). USD had advanced early on Friday before US data releases were published. These reports can slightly influence traders throughout the day. There are no economic events in the EU today. Outlook for EUR/USD: Traders are recommended to open short positions if EUR/USD closes below the trend channel on the H1 chart, with 1,0574 being the target. Long positions can be opened if the pair settles above the price channel on the H4 chart, targeting 1.1041. The material has been provided by InstaForex Company - www.instaforex.com |
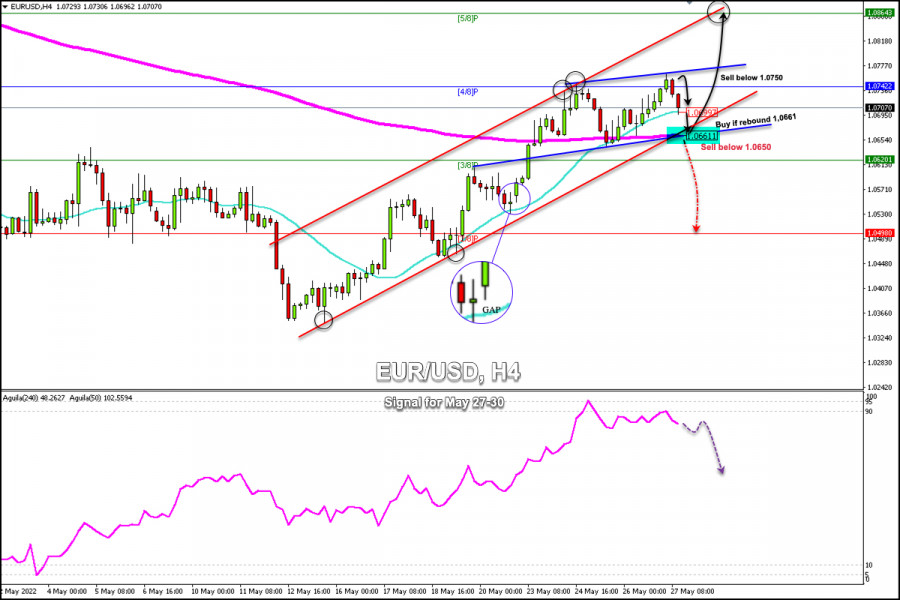
| Trading Signal for EUR/USD on May 27-30, 2022: sell below 1.0750 (4/8 Murray - overbought) Posted: 27 May 2022 05:57 AM PDT
Early in the American session, the Euro is trading below 4/8 Murray around 1.0707 after reaching a European session high of 1.0765, the highest level since April 25. EUR/USD is trading above the 21 SMA with a bullish bias but exhausted by resistance at 1.0742. The short-term trend according to the 4-hour chart remains bullish. Key short-term supports are seen at 1.0699 (21 SMA) and then at 1.0661 (200 EMA). A drop below the latter would leave EUR/USD vulnerable to further losses and the pair could hit 2/8 Murray at 1.0498. In the opposite direction, a firm return above 1.0750 and a close there on daily charts would support the Euro going towards 5/8 Murray around 1.0864. The positive change in risk sentiment seen since May 16 made the dollar lose interest. Currently, the dollar index is trading above 5/8 Murray at around 101.66. This fall in the dollar gave a strong upward momentum to the euro, but it could be in a phase of a technical correction for the next few days. According to the 4-hour chart, we can see that since May 12 the euro has been trading within an uptrend channel. Besides, the euro has found support above 1.0661(200 EMA) and 1.0699 (21 SMA). As long as the euro trades within the uptrend channel and above the 21 and 200 moving averages in the coming days, we could expect the trend to continue and the price could reach the resistance of 5/8 Murray at 1.0864. Since May 24, the eagle indicator has been giving an overbought signal. So, a technical correction is likely in the next few days so that the euro can resume its upward trend. Our trading plan for the next few hours is to wait for a pullback towards 1.0750 to sell, with targets at 1.0699 and 1.0661. In case of a technical bounce around the 200 EMA at 1.0661, there will be an opportunity to buy with targets at 1.0742 and 1.0864. The material has been provided by InstaForex Company - www.instaforex.com |
| Trading plan for Ethereum on May 27, 2022 Posted: 27 May 2022 05:41 AM PDT
Technical outlook:Ethereum dropped more than expected through the $1,710 low on Friday before bouncing back sharply. The crypto is seen to be trading close to $1,800 at this point in writing and is expected to continue higher towards $3,000 at least. It is seen to be carving a Pin Bar / Hammer candlestick pattern on the daily chart after bouncing off $1,710. Ethereum bulls are now looking determined to come back in control and produce a religious rally towards $3,000 and up to $3,500 in the next few trading sessions. The crypto is unfolding a corrective rally (potential standard flat) since the $1,700 lows and is expected to rally into its last wave higher towards the $3,500 mark. Ethereum is retracing its larger degree downswing between $4,850 and $1,700 and is expected to terminate it around the Fibonacci 0.618 retracement, which is seen at around $3,550 as seen on the daily chart. Traders might be preparing to add further longs now and carry on through $3,500 before reversing. Trading plan:Potential rally through $3,500 against $1,700 Good luck! The material has been provided by InstaForex Company - www.instaforex.com |
| Key European indices rise by 0.56-1.78% Posted: 27 May 2022 05:23 AM PDT
Key European indices went up 0.56-1.78%. The STOXX Europe 600 index showed modest gains, adding only 0.3%. Other indices rose rapidly: the German DAX increased by 1.59%, the French CAC 40 was up 1.78%. The British FTSE 100 slightly climbed by 0.56%. The Italian FTSE MIB rose by 1.22% and the Spanish IBEX 35 added 1.47%. At the same time, the Spanish indicator hit a record high for a year and a half. Investors' positive sentiment was caused mainly by the increase in the US stock indices, which added 2-3%. Oil prices also rose by 3-4%, while the euro appreciated against the dollar. Experts attributed the rise in US indicators to the publication of the Fed's minutes in May. The market participants were given signals to tighten the US monetary policy at a more moderate rather than aggressive pace. After the benchmark interest rate is raised by 50 points, the US regulator will first analyze the economic situation and its possible consequences. Then it will make a decision on a further interest rate increase. Meanwhile, the growing number of coronavirus cases in China and the ongoing Russia-Ukraine military conflict continue to have a negative impact on the global economic situation. It is predicted that economic growth of the EU countries will decrease by 2% in 2022 compared to the previous forecasts due to the above-mentioned reasons. US GDP is also expected to decline by 1.1%. Moody's has also changed its outlook for GDP growth in the EU members. For 2022, the agency downgraded its forecast from its March estimate of 2.8% to 2.5%. On the contrary, Moody's improved it from 2.2% to 2.3% for 2023. Ocado Group PLC and Zalando showed huge gains in the value of shares among the components of the STOXX Europe 600 index. Their stocks rose by 11.5% and 10.2% respectively. Other components of this index dropped significantly: Centrica Plc fell by 7.2%, United Utilities went down 6.6% and Fastighets AB Balder declined by 5.2%. Ted Baker PLC stock added 0.7% as it managed to reduce losses in the current fiscal year. The value of Johnson Matthey PLC shares decreased by 3.6% due to the pessimistic forecast for the next year. The material has been provided by InstaForex Company - www.instaforex.com |
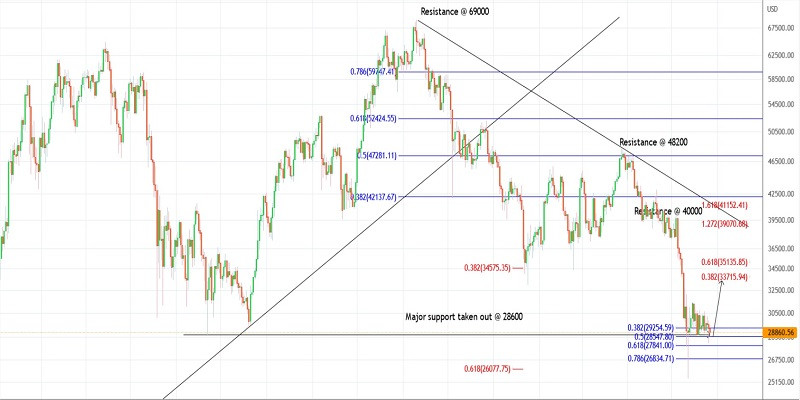
| Trading plan for Bitcoin on May 27, 2022 Posted: 27 May 2022 05:10 AM PDT
Technical outlook:Bitcoin finally dropped through the projected $28,000 mark on Thursday before bouncing back. The crypto remained shy by just 200 points to hit the Fibonacci 0.618 retracement as we were expecting. The wave structure still remains constructive for bulls in the near term as they prepare to push higher through $42,000 at least. Bitcoin has now completed its second wave within the proposed three-wave corrective rally, which began at the $25,500 lows. If the above structure holds well, prices would stay above $25,500 and unfold its third-wave rally towards $42,000 and the $48,000-50,000 area going forward. The potential remains through $52,000 before reversing lower. Bitcoin has carved its meaningful downswing between the $69,000 and $25,500 levels earlier. The same retracement is going on now. BTC is expected to test the Fibonacci 0.618 retracement of the entire drop, which is seen close to the $52,500 mark. We expect prices to rally in the short term and then reverse lower again towards $20,000 and beyond. Trading plan:Potential rally through $42,000, $48,000 against $20,000 Good luck! The material has been provided by InstaForex Company - www.instaforex.com |
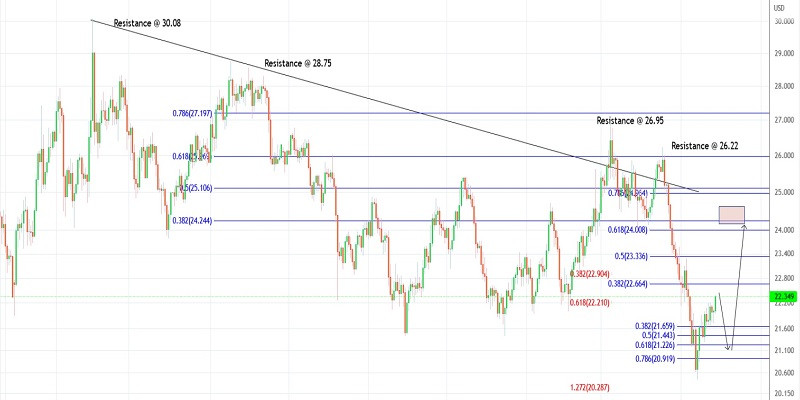
| Trading plan for Silver for May 26, 2022 Posted: 27 May 2022 04:57 AM PDT
Technical outlook:Silver prices rose to $22.38 intraday on Friday as the near-term potential remains towards $22.65. Please note that $22.65 is the Fibonacci 0.382 retracement of the entire drop between $26.22 and $20.45. A high probability remains for a bearish reaction if prices manage to reach there. Silver has been unfolding a counter-trend rally since the $20.45 low registered on May 13, 2022. The first wave of the corrective phase is now expected to terminate close to the $22.65 mark. Prices are expected to pull back through the $21.20-50 zone to produce the second wave of the corrective phase. Bulls will be inclined to terminate the last wave through the $24.00-20 zone as projected on the daily chart. Siver has already carved a meaningful bearish boundary between $26.20 and $20.45 as seen here. The metal is retracing now in the same fashion and prices are expected to reach the $24.00 mark, which is the Fibonacci 0.618 level of the drop. Also, the past support-turned-resistance is seen passing through the $24.00-10 zone, which is a potential reversal zone. Trading plan:Potential short-term drop through $21.50, then rally towards $24.00 Good luck! The material has been provided by InstaForex Company - www.instaforex.com |
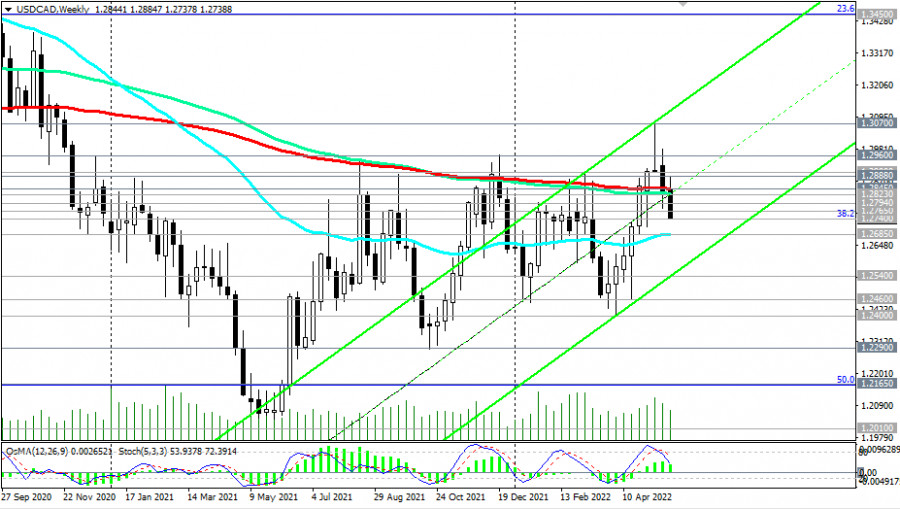
| USD/CAD: technical analysis and trading recommendations for 05/27/2022 Posted: 27 May 2022 04:42 AM PDT As we noted in our Fundamental Analysis today, the US dollar is weakening, and the Canadian dollar is strengthening, also receiving support from rising oil prices. Since June 2021, USD/CAD has been trying to fully restore the long-term trend, strengthening from lows near the 1.2000 mark, and repeatedly trying to break into the long-term bull market zone (above the key resistance level, EMA200 on the weekly USD/CAD chart).
At the beginning of the month, it almost succeeded. The price broke through the resistance level of 1.2845 (EMA200 on the weekly chart) and was able to strengthen to 1.3070 (the maximum since December 2020).
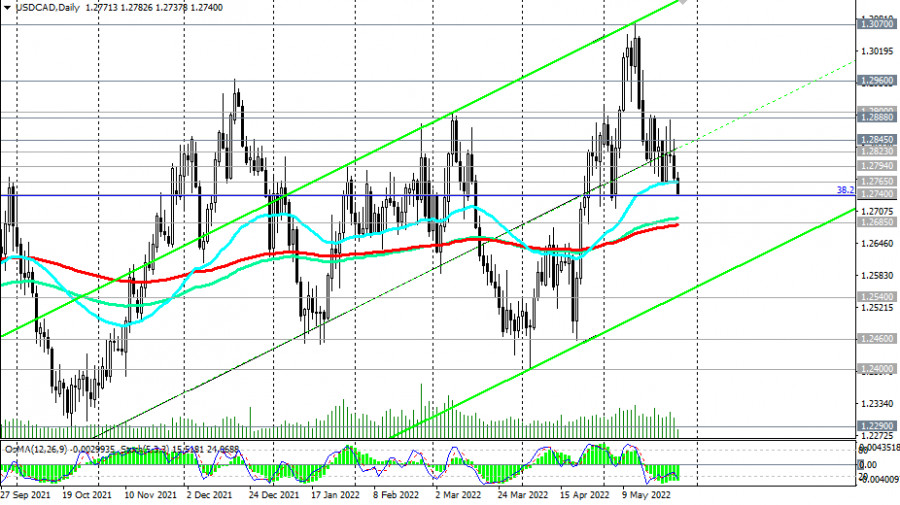
However, this week, USD/CAD has again fallen into the bear market zone, below the level of 1.2845. "USD/CAD is trading at the time of publication of this article near the 1.2740 mark, about 100 points below the opening price of this week and 30 points below the opening price of today." A breakdown of the support levels of 1.2740 (the Fibonacci level of 38.2% of the downward correction in the wave of USD/CAD growth from 0.9700 to 1.4600), 1.2685 (EMA200 on the daily chart) will open the way for it towards the key support level of 1.2540 (EMA200 on the monthly chart), the breakdown of which will finally return USD/CAD to the long-term bear market zone.
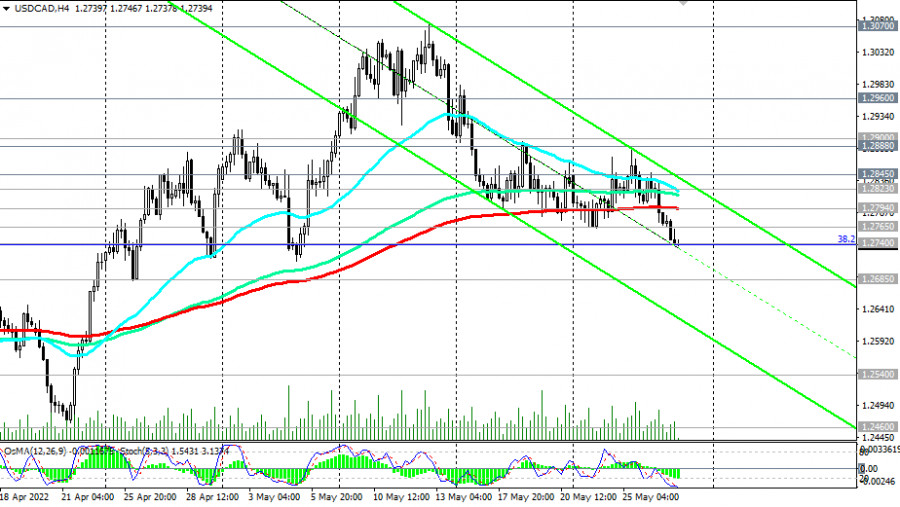
In an alternative scenario, the signal for purchases will be a breakdown of resistance levels 1.2765 (EMA50 on the daily chart), and 1.2794 (EMA200 on the 4-hour chart). And in this case, again, a new retest of the resistance level of 1.2845 is not excluded. Thus, a high level of volatility remains in the pair, providing a lot of trading opportunities. Support levels: 1.2740, 1.2700, 1.2685, 1.2600, 1.2540, 1.2460, 1.2400, 1.2290, 1.2165, 1.2010, 1.2000 Resistance levels: 1.2765, 1.2794, 1.2823, 1.2845, 1.2888, 1.2900, 1.2960, 1.3000, 1.3070, 1.3100 Trading Scenarios Sell Stop 1.2725. Stop-Loss 1.2810. Take-Profit 1.2700, 1.2685, 1.2600, 1.2540, 1.2460, 1.2400, 1.2290, 1.2165, 1.2010, 1.2000 Buy Stop 1.2810. Stop-Loss 1.2725. Take-Profit 1.2823, 1.2845, 1.2888, 1.2900, 1.2960, 1.3000, 1.3070, 1.3100 The material has been provided by InstaForex Company - www.instaforex.com |
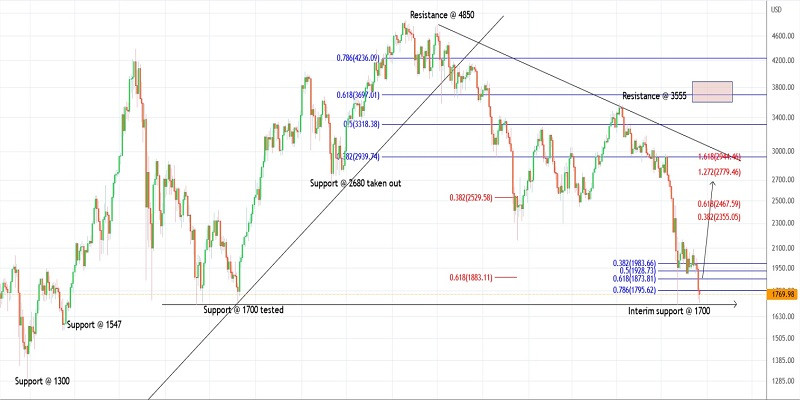
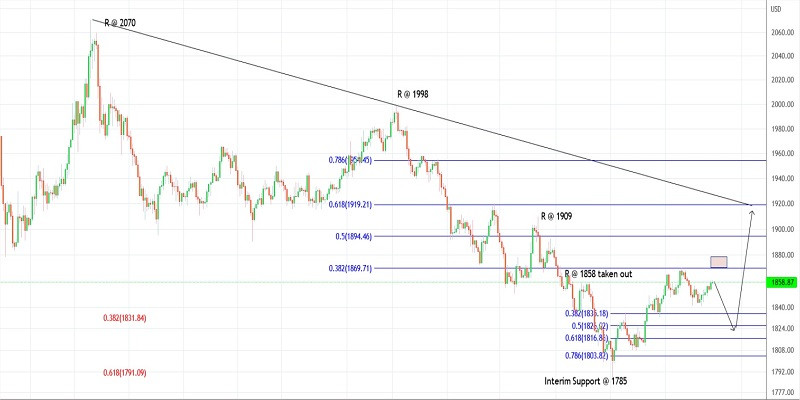
| Trading plan for Gold on May 27, 2022 Posted: 27 May 2022 04:41 AM PDT
Technical outlook:Gold prices climbed above $1m860 on Friday after bouncing off from the $1,840 lows on Wednesday. The yellow metal could be attempting to print another high around $1,880, marked with a pink rectangle here, before turning lower again. A failure to break above $1,870 will invite bears back to the market. Gold has been producing a counter-trend rally since the $1,786 lows earlier. If the metal is moving within a trading range, prices might drop through $1,815-20 from here and then produce a rally towards $1,920. In the case of a zigzag, prices would rally through $1,880 from here, before producing a corrective decline. Either way, the potential remains through $1,915-20 going forward. Gold has carved a larger degree downswing between $1,998 and $1,786 earlier. The above move is a retracement through a corrective wave. The price is expected to push through the Fibonacci 0.618 retracement of the above drop, which is seen through $1,920. A high probability remains for a bearish reversal thereafter. Trading plan:Potential short-term drop through $1,815-20, then rally towards $1,920 against $1,781 Good luck! The material has been provided by InstaForex Company - www.instaforex.com |
| US premarket on May 27: US stock market likely to snap seven-week losing streak Posted: 27 May 2022 04:34 AM PDT On Friday, US stock indices continued their rally initiated on May 24. Traders are trying to pare losses seen in the market over the past seven weeks. Thus, there is a likelihood that the market will end its losing streak and close the trading week with gains. The Dow Jones Industrial Average rose by 34 points, or 0.1%. The S&P 500 and Nasdaq 100 indices gained 0.3% and 0.4% respectively. Moreover, these indices are likely to end the week on a positive note. Over the week, the Dow Jones and the S&P 500 have been up 4.4% and 4% respectively.
Nevertheless, the Nasdaq Composite is still in bear market territory, while the S&P 500 has already attempted to move below the 20% level where it started its downtrend from. Yesterday, the Nasdaq remained 27.6% below its high, while the S&P 500 and Dow Jones were down 15.8% and 11.7% respectively. Many experts talk about a possible strong rebound. Indeed, the prevailing mood among investors is bullish. However, everything can change if the US Federal Reserve takes a more aggressive approach to surging inflation, or the US economy slows down even more significantly - as happened yesterday, following the release of the second estimate of first-quarter GDP in the United States. Today's macroeconomic calendar is full of important releases, including personal income and spending as well as the core personal consumption expenditures (PCE) index. Meanwhile, tensions between China and the US have escalated following Secretary of State Anthony Blinken's comments about Chinese President Xi Jinping. As a new challenge to Beijing, the US and Taiwan are planning to announce economic talks to deepen their trade and economic ties. Of course, Russia's military special operation in Ukraine is also a cause for investors' concern. The United States may announce a new package of aid for Kyiv as soon as next week that would include long-range rocket systems and other advanced weapons. British Prime Minister Boris Johnson also called for further military support for Ukraine by proposing sending the country advanced weapons such as multiple launch rocket systems. Johnson seems to care more about Ukraine than about his own country's economy. As you know, amid skyrocketing food and energy prices, inflation in the UK jumped to 9% on an annual basis last month, reaching its highest level in 40 years. Moreover, the Bank of England expects the consumer price index to exceed 10% at the end of this year. Thus, the cost of living crisis is gaining momentum in the UK.
Premarket Shares of Ulta Beauty rose by about 8% in premarket trading after the company reported better-than-expected quarterly performance results. Gap stock fell by almost 20% after the company slashed its profit outlook for the year. Analysts cut the firm's profit guidance for the full year as a steep decline in sales weighed on results for the fiscal first quarter. Shares of Zscaler Inc. advanced after the security software company reported better-than-expected performance results. S&P 500 technical analysis If bulls do not let the trading instrument go below $4,040, the nearest target will be the resistance level of $4,080. Its breakout will push the index up to the area of $4,116 and $4,157. In case market sentiment turns pessimistic amid Fed members' talks about high inflation and the need to combat it, and bulls' trading activity is subdued at $4,040, we will see a major sell-off to the levels of $4,013 and $3,975. The area of $3,858 can be seen as a more distant target. Traders are recommended to read the following articles: Forex Analysis & Reviews: Haruhiko Kuroda: Japanese yen is resistant to future Fed policy Forex Analysis & Reviews: Fed minutes show monetary policy to remain unchanged The material has been provided by InstaForex Company - www.instaforex.com |
| Posted: 27 May 2022 04:23 AM PDT On Thursday, bitcoin dived to $28,900 and eventually closed at $29,117. At the time of writing on Friday, BTC fell to $28,982.
Since Monday, bitcoin has tried to break out of the 7-week long downtrend, but remained near the $30,000 mark. The leading cryptocurrency lost about 60% since it surpassed $69,000 and reached an all-time high in November 2021. Crypto market lossesOver the past 24 hours, BTC lost about 2%. Howevre, major altcoins suffered more severe losses. STEPN's native token nosedived by 37.9% after its developer halted its services in China due to a demand from local authorities. STEPN is a move-to-earn lifestyle app which uses GPS and allows users to earn rewards in crypto by running, walking, or jogging outside. The company will stop providing GPS services to users in mainland China from July 15. Solana fell by 7.15% to $45. The altcoin lost more than 17% last week. Among other cryptocurrencies, Ethereum decreased by 6.16% to $1,847, BNB slumped by 5.03% to $311.86, Cardano declined by 4.59% to $0.487, and Dogecoin slid down by 4.83% to $0.0791. The best performing cryptocurrency was Chain, which jumped by 46.6% on Thursday. According to CoinGecko, the market cap of the cryptocurrency market decreased by 3.22% to $1.22 trillion yesterday. The Bitcoin Dominance Index reached 45.74%. Lengthy crypto downtren Since the beginning of 2022, the digital assets market dropped sharply as investors shifted away from risky assets. BTC lost about 37% since January, while Ethereum dived by 48%. The market cap of the cryptomarket declined to $1.3 trillion from $3 trillion in November 2021. The war in Ukraine and rising geopolitical tensions in Eastern Europe have pushed the crypto market downwards. Another bearish factor for crypto is the growing dominance of the United States in the digital assets market, reflecting the currency war between the US and China, which began in 2014. The US crypto dominance was reinforced by China's crypto ban in 2021 The Federal Reserve's monetary policy is also pushing the crypto market downwards. According to crypto market analysts, the Fed's interest rate hike has contributed to the downtrend. Investors are concerned that rising inflation would force the regulator to increase interest rates even higher in the future. Earlier, Fed chairman Jerome Powell stated that the US central bank plans to act decisively to bring inflation back to the target level of 2%, despite short term recession risks. In May, the Federal Reserve increased the key interest rate by 50 basis points to 0.75-1%. The US regulator hiked the rate by 25 basis points at its March meeting. It was the first back-to-back rate rise by the Fed since 2006 and the first 50 basis points increase since 2000 Light at the end of the tunnel? Despite bitcoin's woes, JP Morgan strategists estimated BTC's fair value at $38,000, which is 30% higher than its current price of about $29,000. Furthermore, JPMorgan classified digital assets and hedge funds as its "preferred" alternative asset classes. The bank's strategists also stated that BTC and digital assets have great upside potential after its recent fall. The material has been provided by InstaForex Company - www.instaforex.com |
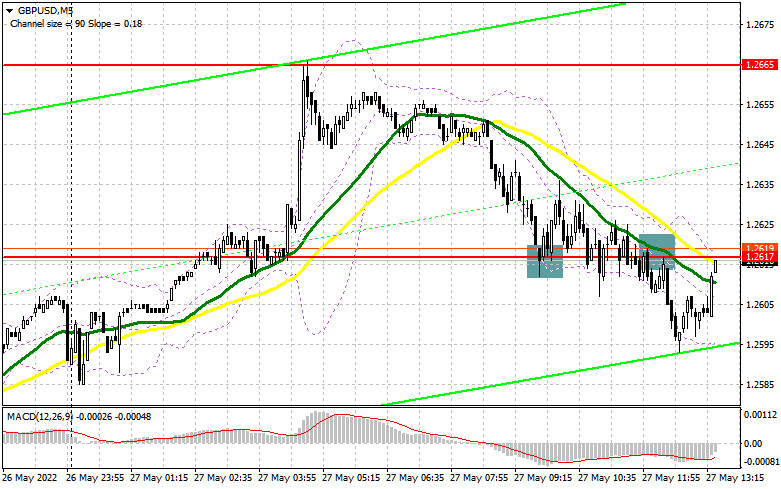
| Posted: 27 May 2022 04:08 AM PDT In my forecast this morning, I drew your attention to the level of 1.2617 and recommended entering the market from it. Let's have a look at the 5-minute chart and analyze where and how to enter the market. The decline and formation of the false breakout at 1.2617, against the background of the lack of important fundamental statistics, was not surprising. That created a good sell signal, but after the pair gained almost 20 pips, the pressure returned, and we saw the price testing 1.2617. As a result, the trade closed to the breakeven, and I waited for other signals. The pair fixed below 1.2617 and this gave the sell signal. However, I did not open short positions, as it was difficult to imagine what direction the pair would choose during such choppy trading. There was no distinct trend in the pair, so it had equal chances to go up or down. The pound has fallen down by 20 pips, but by the time of writing the article, it managed to recoup this downturn. Considering all the above, I decided to revise the technical picture.
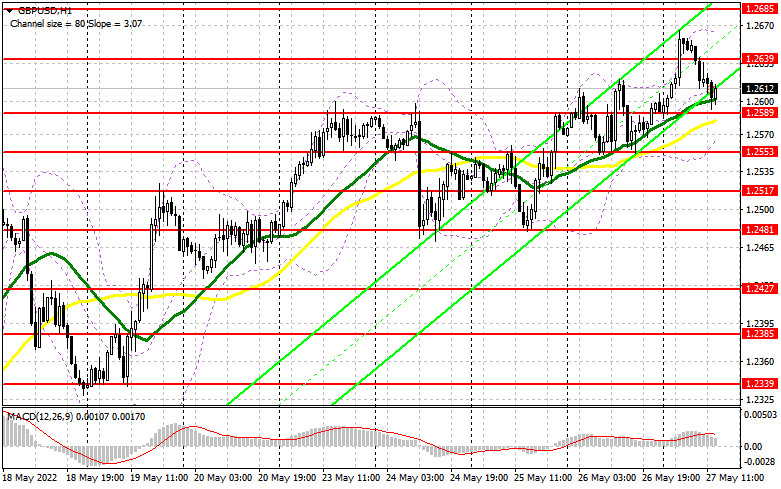
Long positions on GBP/USD: Currently, nothing threatens the pound's uptrend. Even if the pair declines below 1.2589, which is the bears' target now, nothing bad will happen. Quite a lot of fundamental statistics in the US may push the pound to test 1.2589. Only a false breakout at that level may give a signal for opening long positions with an aim to continue the bullish rally and reach the resistance of 1.2639. Weak data on personal spending and incomes in the US, as well as a sharp decline in the consumer sentiment index and the inflation expectations index from the University of Michigan, are needed for such a scenario. If bears show weak activity near 1.2639, the pair may surge. However, only after fixing above 1.2639 with the reverse top/bottom test, it is possible to open long positions with growth prospects to 1.2685 and hit 1.2722, where traders may lock in profits. The next target is located in the area of 1.2765. If the pound declines, bulls are weak at 1.2589, and the US data does not meet the forecasts, bulls may give up, and this is likely to increase pressure on the pair. Therefore, I would not recommend rushing to buy the pound. It is better to enter the market after a false breakout near 1.2553. You can also buy the pound on a rebound from 1.2517, or even lower near 1.2481, allowing an intraday correction of 30-35 pips. Short positions on GBP/USD: As can be seen on the chart, bears are gradually pushing the price to their targets and now they are counting on a breakthrough of 1.2589. I will also bet on a larger downward correction in the pair, so I am waiting for the appropriate sell signals. The release of the US data may be a reason for the pound to rise, as it promises weak readings. Therefore, a false breakout at 1.2639 may become a more suitable signal to open short positions. A breakthrough and a reverse bottom/top test of 1.2589 is likely to form an additional signal for the opening of short positions, which will quickly return the pound to the area of 1.2553, opening a direct way to 1.2517, where traders can take profits. The next target is located in the area of 1.2481, which is this week's low and a major support level. However, it is unlikely that this scenario will come true without good fundamental statistics in the US today. With the GBP/USD growth scenario and lack of activity at 1.2639, it is better to postpone opening short positions until the pair reaches the next major resistance at 1.2685. You can also open short positions there only in case of a false breakout. Selling the pound on the rebound can be possible from the high of 1.2722, counting on a pair's intraday downtrend by 30-35 pips.
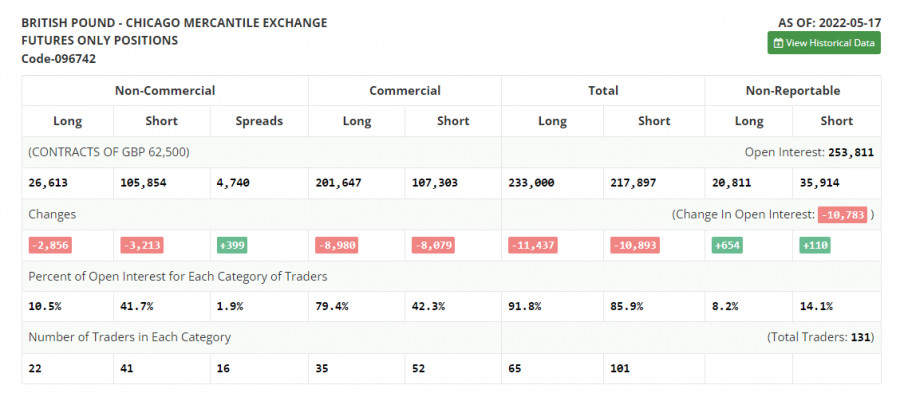
The COT (Commitment of Traders) report for May 17 logged a reduction of both long and short positions. However, short positions declined significantly. This suggests that the market may be gradually approaching the bottom and that traders appreciate quite attractive prices and despite the whole situation in the UK and the uncertainty, they are gradually taking a closer look at the market. Notably, the UK economy has a number of problems. Quite a difficult situation with inflation and slowing economic growth makes the Bank of England feel pressure from both sides. Even despite all the above, Governor of the Bank of England Andrew Bailey in a recent interview noted that the regulator was not going to give up raising interest rates in the near future. One can no longer say the same about the Federal Reserve's policy. There are rumors that the central bank is planning to "pause" the interest rate hike cycle as early as September this year, which is bound to have a negative impact on the US dollar and weaken the currency. The May 17 COT report showed that long non-commercial positions declined to 26,613 by 2,856, while short non-commercial positions declined to 105,854 by 3,213. This led to a decrease in the negative non-commercial net position to -79,241 from -79,598. The weekly closing price rose to 1.2481 from 1.2313.
|


| You are subscribed to email updates from Forex analysis review. To stop receiving these emails, you may unsubscribe now. | Email delivery powered by Google |
| Google, 1600 Amphitheatre Parkway, Mountain View, CA 94043, United States | |


Comments