Forex analysis review
Forex analysis review |
- GBPUSD: falling to parity is no longer a fairy tale?
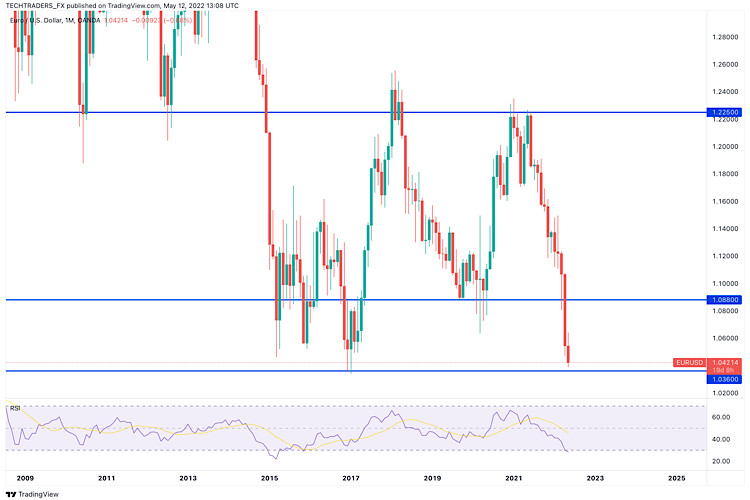
- May 12, 2022 : EUR/USD daily technical review and trading opportunities.
- May 12, 2022 : EUR/USD Intraday technical analysis and trading plan.
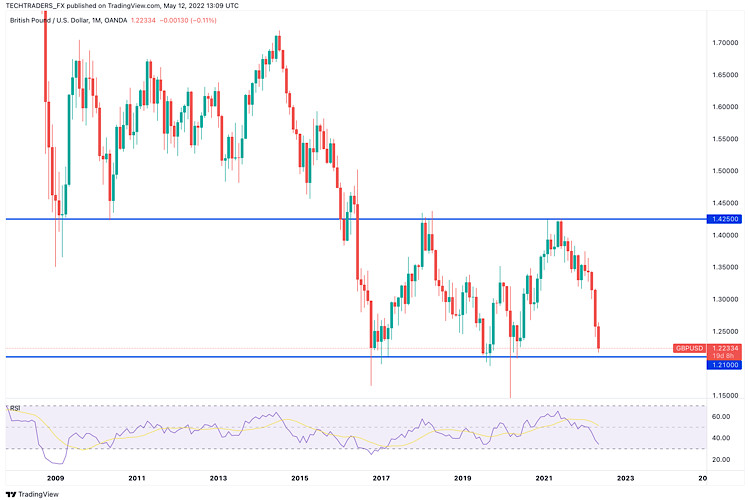
- May 12, 2022 : GBP/USD Intraday technical analysis and significant key-levels.
- Technical analysis of GBP/USD for May 12, 2022
- Technical analysis of EUR/USD for May 12, 2022
- ECB's late hawkish rhetoric pushes EURUSD towards parity
- Trading plan for Ripple on May 12, 2022
- Trading plan for Ethereum on March 10, 2022
- EUR/USD analysis on May 12. Everything is going according to plan, the wave marking is being worked out as it should.
- Trading Signal for USD/PY on May 12-13, 2022: sell below 128.12 (5/8 Murray - oversold)
- Trading plan for Bitcoin on May 12, 2022
- European stocks start trading session with large drop
- Trading plan for Silver on May 12, 2022
- Trading Signal for Gold (XAU/USD) on May 12-13, 2022: buy above $1,842 (-1/8 Murray - 61.8% Fibonacci)
- USA still faces galloping inflation and labor market problems
- EUR/USD Outlook on 12 May, 2022
- GBP/USD Analysis on 12 May, 2022
- EUR/USD analysis on May 12, 2022
- Trading plan for Gold on May 12, 2022
- Technical review for XAU/USD: price could decline again
- GBP/USD: analysis on May 12, 2022. UK GDP misses market forecast
- GBP/USD Technical Analysis and Trading Tips on May 12, 2022
- Technical review for GBP/USD: price will decline after a local recovery
- XRPUSD bulls fail to hold key support.
| GBPUSD: falling to parity is no longer a fairy tale? Posted: 12 May 2022 02:18 PM PDT In addition to the fact that the pound itself has a rather tense relationship with the US dollar, Britain's currency is also threatened by the policy of Britain itself. How serious is it? GBP/USD: falling to parity no longer a fairy tale?If we analyze the moments of history when the dollar bit off the pound hard, the government tried, but failed to protect the national currency both times. This at one time cost John Major, and even earlier Harold Wilson, the prime minister's chair and almost ruined Churchill's career. Now investors are again hotly discussing parity against the dollar after the movement of the British currency down today, May 12, after unfavorable GDP data for the first quarter. And, despite Johnson's desperate struggle with inflation against the background of the Russian-Ukrainian conflict, he is quickly losing political points in this unequal battle. What are the chances that the decline of the currency will stop in the near future, and what will be the consequences if this does not happen? We are sorting it out. Parity in the pastThere have been similar fluctuations in the past. After the abolition of fixed exchange rates in 1971 according to the Bretton Woods Agreements, the pound was already approaching the value of the US dollar. It happened in 1985. This case has entered all textbooks of economic theory as a situation provoked either by the words of a politician, or by the words of a newspaperman. That year, the Federal Reserve managed inflation by attracting funds from Britain. The smooth depreciation of the pound at some point turned into a steep peak. After Margaret Thatcher inadvertently warned the public that the market could really give global preference to the dollar over the pound, an article was published in the Times. In it, reporters indicated that Thatcher was ready to equate the pound to the dollar, portraying this as recognition and partial surrender. The markets reacted immediately. Since then, politicians have not ventured to speak about their concerns directly, and the pound has in its own difficult history an incident of a sharp fall against the dollar. In fact, Thatcher made every effort to protect the pound. So, the Bank of England began to promptly raise rates to protect the currency, and at some point the fall of the pound stopped at $ 1.05. More situations close to parity have not happened in the history of the GBP/USD pair. Only briefly did the exchange rate fall below $ 1.2 – immediately after the Brexit referendum in 2016 and in the first days of the pandemic two years ago. Now the situation risks repeating itself. On Wednesday, May 11, before the end of the London trading session, the pound was worth $ 1.2251 - a minimum it has not seen since May 2020, when the global economy was pierced by pandemic fear. As you know, rounded numbers are of great psychological importance in currency trading, so the next key level for the markets will be $ 1.20.Actually, after the historic fall of the pound in 1985, it fell below this critical mark for many only during the most severe political crisis due to Brexit and in the early days of the pandemic. Both of these cases are exceptional in themselves because of their large-scale and radical uncertainty about risks - risks at a level where it is difficult for markets to measure their scale in principle. This time it's easier, because such crises are cyclical for the economy. They are usually explained simply - the main problem of currency markets in difficult times - by fears that high inflation and weak economic growth will make it impossible to further strengthen the pound. And as in 1985, it is the words of the country's leadership and officials of the Bank of England that will be crucial in many ways. Soft rhetoric, tough measuresThis time, despite the measured words of the central bank, the GDP data for the first quarter provoked an attack on the pound. But even before that, the central bank of Britain allowed itself a frankly honest and bold statement that, most likely, the inflation rate in the country will exceed 10% and British production may well cover the basin of recession. The markets immediately accepted these words exactly as they accepted Paul Volcker's words 40 years ago that inflation was out of control of the government - a large-scale panic. What in the history of economics was dubbed later as the "Volcker moment". The most interesting thing in the current situation is that the loud statement of the Bank of England had the opposite effect in comparison with reality. Mark Chandler, chief market strategist from New York, notes that the Volcker moment "crushed" the pound: "You have to be careful what you wish for. They say that central banks raise rates until something breaks, and the Bank of England says that something is about to break." How did investors accept the bank's words? As a direct confirmation that the Bank of England has exhausted its resources and will no longer be able to interfere so actively in the exchange rate of the pound, raising the interest rate several times, and even by a significant difference. This does not mean that this is actually the case. But this is how investors accepted this message. Meanwhile, officials of the US Fed made a much more restrained and optimistic statement, directly indicating that it is able to raise rates many times before the end of the year without the unemployment rate increasing too much. Ironically, if you think about it a little, you will realize that the situation with multiple rate increases is exactly the opposite - very bad. Since multiple increases can only mean that they don't work every time. As for the interest rate itself, as we know at least from the recent history of Russia, it can rise to at least 20%. So the Bank of England is not really limited either in the number or in the volume of rate increases. Nevertheless, the markets managed to re-accept the information "on a broken phone", and the fire broke out. This is not an isolated case. The bond market as a whole shows that traders tend to believe the Fed more, but not the Bank of England, although, as we can already see, it is the latter's rhetoric that is more truthful and balanced. Typically, British securities offer higher yields than US Treasury bonds. This, in particular, works on the exchange rate of the pound, making British deposits more attractive. Alas, after the Brexit referendum, the island's bonds regularly trade below their US equivalent, and this weakens the pound. Usually the practice in such cases is to blame "foreign influence". So, Harold Wilson in 1968 accused the "gnomes of Zurich" of devaluing the pound. 24 years later, in 1992, George Soros, a hedge fund manager, became the scapegoat, publicly stating that the Bank of England would not be able to raise rates high enough to maintain the peg to the Deutsche mark. However, this time is also unique in its own way, since the rhetoric of central bank officials is dangerously mixed with the government's course to continue and deepen Brexit. The price of independenceIf you remember, the referendum in June 2016 led to a fall in the exchange rate overnight by more than 10%, causing even fears that the British economy would not survive. And although this did not happen, the pound did not manage to fully regain its positions. Since then, its June 2016 level has served as a kind of beacon for all traders. And to this day, the opinion that the UK's withdrawal from the European Union makes its currency more vulnerable prevails among international traders. Yes, there are economic arguments in favor of Brexit making the UK more vulnerable to restless investors, but political independence has a price, and it is also expressed in the exchange rate of the national currency. Nevertheless, the goals of the Brexit organizers to "regain control" have obviously not been achieved, and the current jump in the pound confirms that the UK now has less control over its currency. Moreover, economists reasonably believe that Brexit has directly increased the inflationary pressure that is now hitting the British economy. Forecasts and argumentsIan Harnett from the research company Absolute Strategy Research Ltd notes that standard quarterly surveys of enterprises about obstacles to their production work as a predictive indicator of inflation (actually, this is true not only for Britain). When the proportion of companies that expect a shortage of employees or other factors to reduce their production over the next three months increases, then the inflation rate tends to rise in the future in a year. This is because the demand for labor forces companies to raise wages, which they then shift prices to the buyer. If we take this CBI indicator as a basis, then everything looks very ominous, because right now it shows that the shortage of labor is the most serious since the stagflation of 1973. How much does Brexit have to do with this? The question is not idle, because Europe is the same for Britain as Mexico is for the United States. Before Britain left the union, the latter was a generous supplier of cheap labor to the UK - at the expense of poorer European countries such as Romania. In social terms, this eventually led to negative consequences, which led to the referendum (including), but also this factor restrained inflation and pushed the pound up. In the era of the pandemic, the CBI indicator once again reminded us that every coin has two sides. With this in mind, companies' attempts to adapt to the new immigration system will be defeated this year, as the pandemic has forced many emigrant workers from the EU to leave the UK. The result is an acute shortage of labor, although there is a chance to improve things at the expense of refugees from Ukraine. EffectsIf we consider the situation of a weak pound, parity against the dollar will make imports more expensive, which this year outweighs the bonuses from a strong pound for exports. In turn, this can make inflation in the UK truly frightening, and it is still difficult to understand what the UK can do about it. After the above, it is obvious that for now the fate of the pound remains in the hands of the US and the Fed policy. Now we have to ask the question: and will the dollar really be able to continue strengthening for a long time, and how long will the Fed be aggressive before facing its own macroeconomic constraints? The US position is unique. Many other countries around the world have varying amounts of national and corporate debts denominated in dollars. But, on the other hand, US multinational corporations do not like it when a strong dollar devours profits from exports, the level of which in the US, although it has decreased, is still very impressive. The last time the dollar rose so much, the Reagan administration came under enormous pressure from manufacturers to weaken the currency. Actually, her efforts were aimed at this by concluding the Plaza Agreement of 1985 on international interventions to limit the growth of the dollar and the pound eventually received an increase. This time, as then, parity will probably be avoided, but only because at some point a super-strong dollar will force international companies to lobby for this option in parliament. Of course, at another time, the Fed would have had a different lever as tax breaks and subsidies, but not in conditions of such strong inflation. The material has been provided by InstaForex Company - www.instaforex.com |
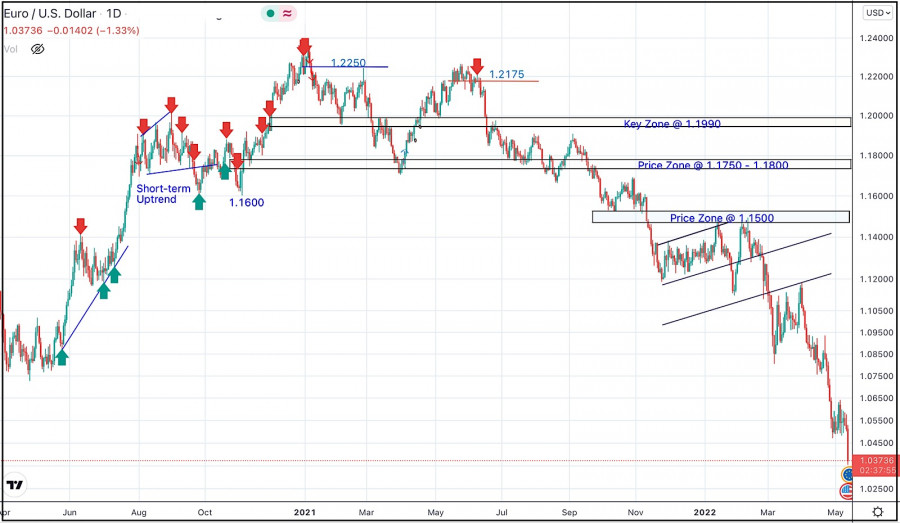
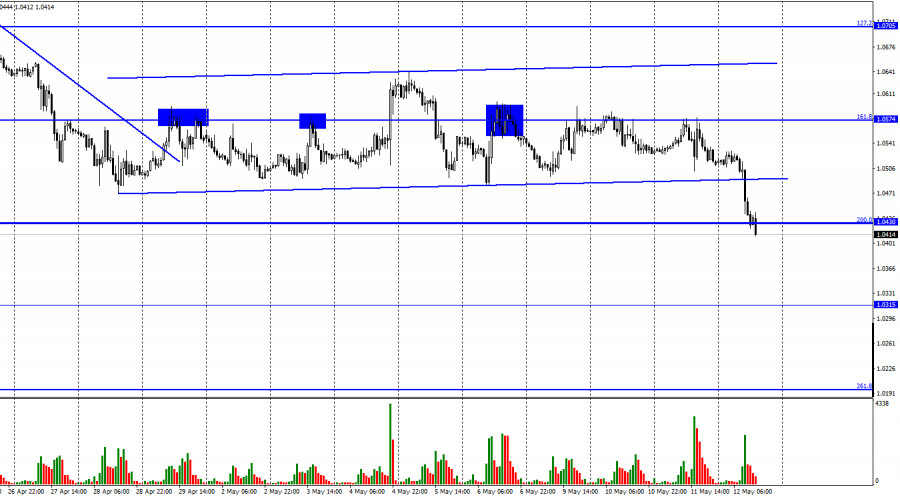
| May 12, 2022 : EUR/USD daily technical review and trading opportunities. Posted: 12 May 2022 11:31 AM PDT
In late September, Re-closure below the price level of 1.1700 has initiated downside-movement towards 1.1500 where some recovery was witnessed. Shortly after, Price levels around 1.1700 managed to hold prices for a short period of time before another price decline took place towards 1.1200. Then the EURUSD has temporarily moved-up within the depicted movement channel until downside breakout occurred recently. Since then, the price zone around 1.1500 has applied significant SELLING pressure when a valid SELL Entry was offered upon the previous ascending movement towards it. Shortly after, the EURUSD looked oversold while approaching the price levels of 1.0800. That's where the recent upside movement was previously initiated. That's why, the recent movement towards 1.1200 was considered for another SELL Trade which is already running in profits now. For beginners, the current price levels are too low to have SELL trades around. Hence, intraday BUY trades are considered a better option. Any ascending movement above 1.0600 will probably enable more advancement towards 1.0700 and 1.0850. Otherwise, conservative traders should stay out of the market. The material has been provided by InstaForex Company - www.instaforex.com |
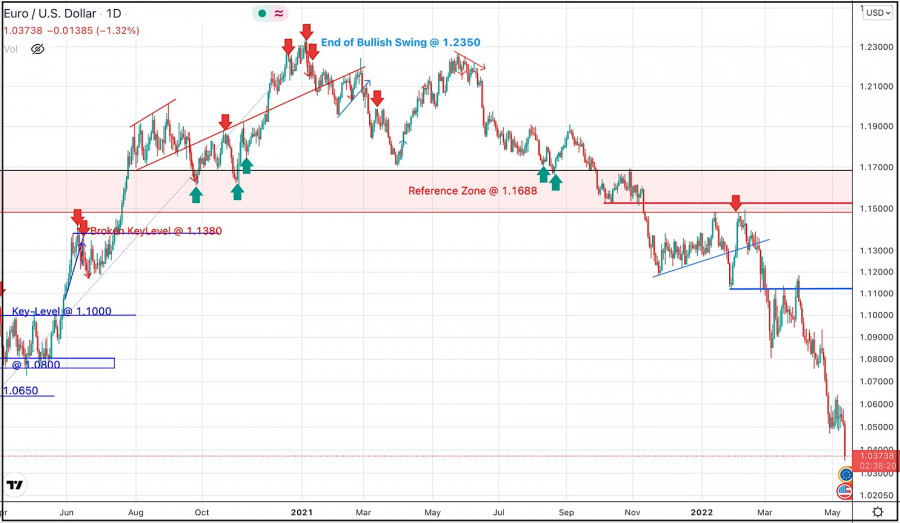
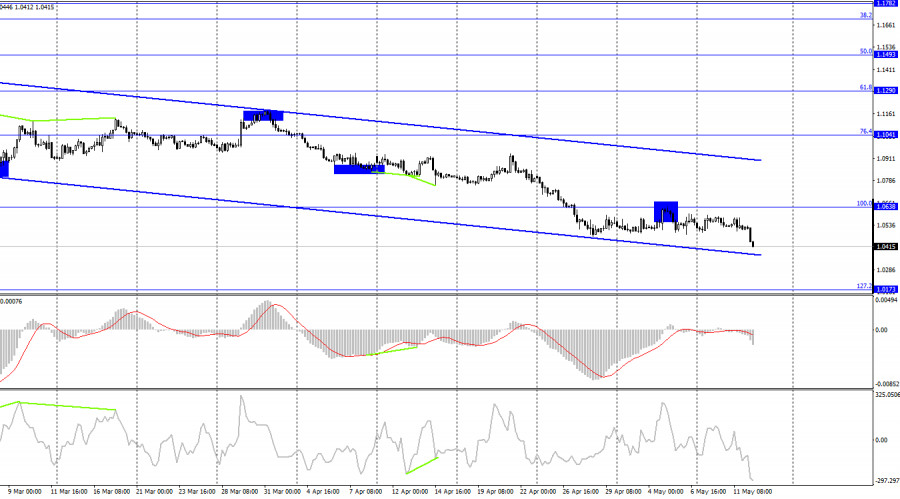
| May 12, 2022 : EUR/USD Intraday technical analysis and trading plan. Posted: 12 May 2022 11:30 AM PDT
A short- term sideway movement was demonstrated within the highlighted zone around 1.1600 before quick bearish decline could occur towards 1.1200. On the other hand, the price zone around 1.1500 - 1.1600 remained a reference zone that applied significant bearish pressure upon two successive bullish visits before another bearish continuation sign was expressed. Hence, downside movement proceeded towards 1.1000 then 1.0920 where short-term bullish pullback was initiated. The price levels around 1.1150 hindered further bullish movement before another bearish move was aggressively expressed towards 1.0500. Failure to persist below the newly-recorded LOW at 1.0350 will probably enable another bullish pullback at least towards 1.0800 and probably 1.1150. Until then, Intraday traders shouldn't have any BUY trades unless bullish persistence above 1.0650 is achieved first. The material has been provided by InstaForex Company - www.instaforex.com |
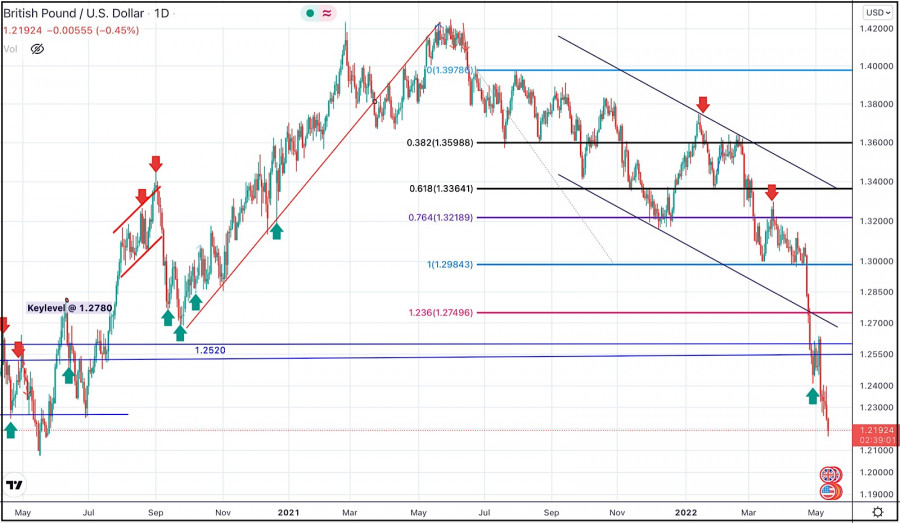
| May 12, 2022 : GBP/USD Intraday technical analysis and significant key-levels. Posted: 12 May 2022 11:28 AM PDT
The GBPUSD pair has been moving within the depicted bearish channel since July. Sideway movement was expressed above 1.3600 while the price levels around 1.3730 - 1.3800 were considered as they offered significant bearish rejection. The short-term outlook turned bearish when the market went below 1.3600. This enhanced the bearish side of the market towards 1.3200 which brought the pair back towards 1.3600 for another re-test. Hence, the recent bullish pullback towards 1.3600 should have been considered for SELL trades as it corresponded to the upper limit of the ongoing bearish channel. Shortly after, Bearish persistence below 1.3360 was needed to enable further downside continuation towards 1.2980 - 1.3000. Bullish rejection has arised many times around 1.3000 standing as a significant Daily Support where the previous consolidation range has arised. This happened before another bearish decline could take place earlier this week. Another bearish breakout below 1.2980 has enabled quick bearish extension towards 1.2600-1.2550 where some bullish recovery and a short-term sideway movement could be established. The current bearish decline is expected to extend towards 1.2100 where bullish recovery can be expected. Bullish breakout above 1.2400 is needed to abolish the short-term bearish scenario and may enable quick bullish advancement towards 1.255, 1.3300 and probably 1.3600 if sufficient bullish momentum is expressed. The material has been provided by InstaForex Company - www.instaforex.com |
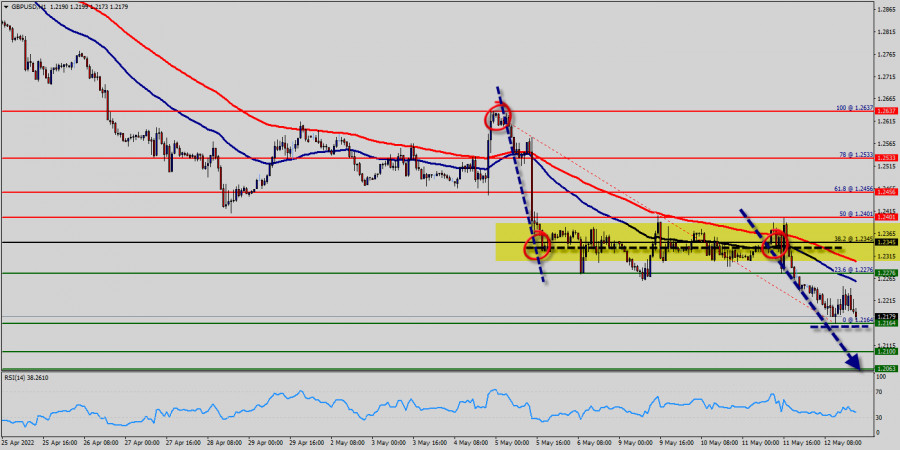
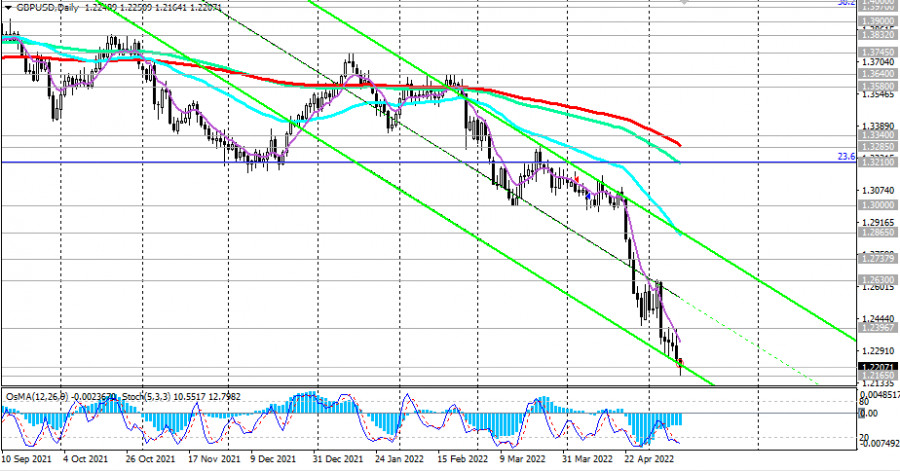
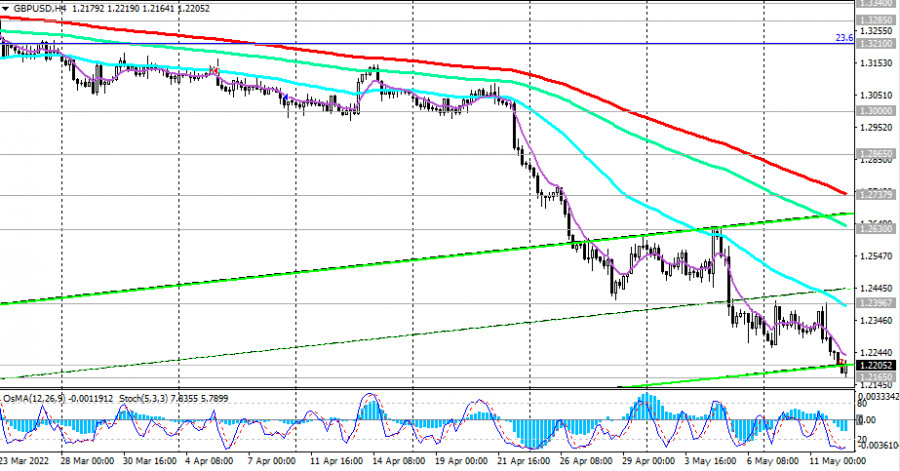
| Technical analysis of GBP/USD for May 12, 2022 Posted: 12 May 2022 11:04 AM PDT
The GBP/USD pair fell sharply from the level of 1.2276 towards 1.2164. Now, the price is set at 1.2185. The resistance is seen at the level of 1.2276 and 1.2345. Moreover, the price area of 1.2276/1.2345remains a significant resistance zone. Therefore, there is a possibility that the GBP/USD pair will move downside and the structure of a fall does not look corrective. The trend is still below the 100 EMA for that the bearish outlook remains the same as long as the 100 EMA is headed to the downside. Thus, amid the previous events, the price is still moving between the levels of 1.2276 and 1.2100. If the GBP/USD pair fails to break through the resistance level of 1.2276, the market will decline further to 1.2100 as as the first target. This would suggest a bearish market because the moving average (100) is still in a negative area and does not show any signs of a trend reversal at the moment. Amid the previous events, the GBP/USD pair is still moving between the levels of 1.2276 and 1.2100, so we expect a range of 1.76 pips. This would suggest a bearish market because the RSI indicator is still in a negative spot and does not show any trend-reversal signs. The pair is expected to drop lower towards at least 1.2063 so as to test the daily support 2. On the contrary, if a breakout takes place at the resistance level of 1.2345, then this scenario may become invalidated. The material has been provided by InstaForex Company - www.instaforex.com |
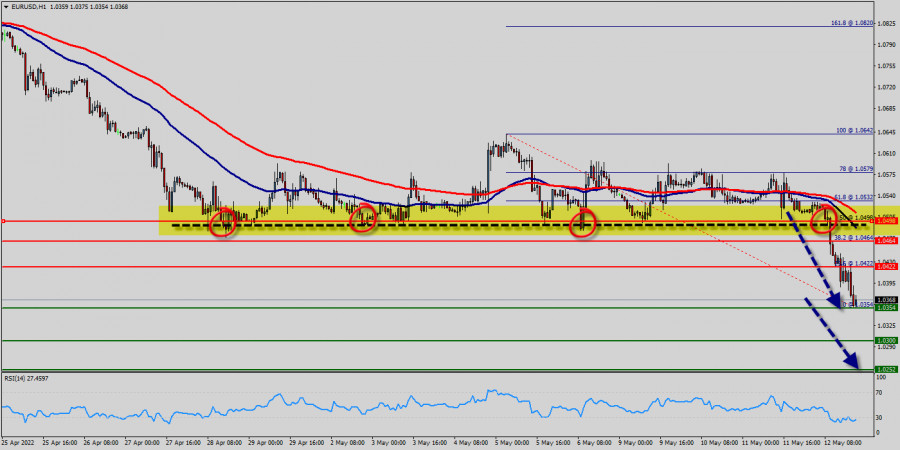
| Technical analysis of EUR/USD for May 12, 2022 Posted: 12 May 2022 10:46 AM PDT
Overview : As expected the EUR/USD pair continues to move downwards from the areas of 1.0422 and 1.0464 which coincides with a ratio of 38.2% Fibonacci on the H1 chart. Yesterday, the pair dropped from the level of 1.0464 to 1.0354, . Today, resistance is seen at the levels of 1.0422 and 1.0464. So, we expect the price to set below the strong resistance at the levels of 1.0464 and 1.0422; because the price is in a bearish channel now. Amid the previous events, the price is still moving between the levels of 1.0422 and 1.0354. In overall, we still prefer the bearish scenario as long as the price is below the level of 1.0422. Today, the first support level is seen at 1.0354, the price is moving in a bearish channel now. Furthermore, the price has been set below the strong resistance at the level of 1.0422, which coincides with the 23.6% Fibonacci retracement level. This resistance has been rejected several times confirming the veracity of a downtrend. Additionally, the RSI starts signaling a downward trend. This is confirmed by the RSI indicator signaling that we are still in a bearish trending market. The price is still below the moving average (100) and (50). Furthermore, if the EUR/USD pair is able to break out the bottom at 1.0354, the market will decline further to 1.0300 (daily support 2). The price will fall into a bearish trend in order to go further towards the strong support at 1.0252 to test it again. The level of 1.0252 will form a new double bottom. On the other hand, if the price closes above the strong resistance of 1.0498, the best location for a stop loss order is seen above 1.05025. The material has been provided by InstaForex Company - www.instaforex.com |
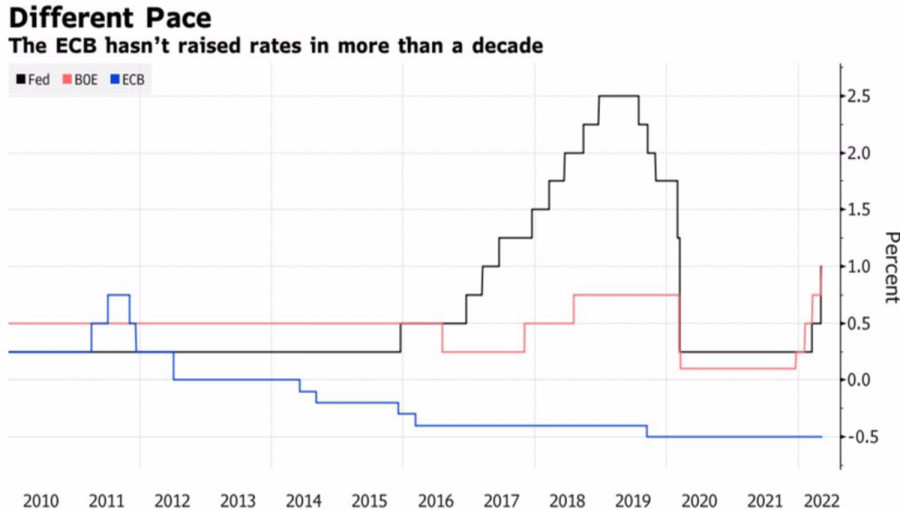
| ECB's late hawkish rhetoric pushes EURUSD towards parity Posted: 12 May 2022 08:14 AM PDT When, beginning in mid-spring, ECB officials began to speak with one voice about raising rates, I had one single question—isn't it too late to move? The euro is moving by leaps and bounds towards parity against the US dollar, which is bad news for both inflation and the economy as a whole. The Eurozone is a net importer of oil and gas, and the lower its currency is quoted, the more expensive the raw material. A new round of the energy crisis is another step towards a recession that is already looming on the horizon. In her last speech, ECB President Christine Lagarde noted that at the end of the second quarter, the quantitative easing program will be put to rest, after which it will take only a few weeks to raise the deposit rate. The start of monetary restrictions in July looks like a done deal, with the futures market setting expectations for higher borrowing costs at two more Governing Council meetings in 2022. Officials seem to like the plan. Bank of France Governor Francois Villeroy de Galhau, called the idea of moving the rate into a positive area this year from its current value of -0.5% reasonable, while his colleague from Hungary, Pierre Wunsch, called such a scenario a simple matter. The problem is that you can't fool the markets. There can be no talk of any aggressive monetary restriction in the eurozone, bled white by the energy crisis. Futures contracts signal borrowing costs rising to 1.25% by mid-2024. By that time, the Fed funds rate is likely to exceed 4%, and the different rates of tightening of monetary policy by the Fed and the ECB are forcing EURUSD to fall like a stone. Dynamics of the main rates of the world's leading central banks
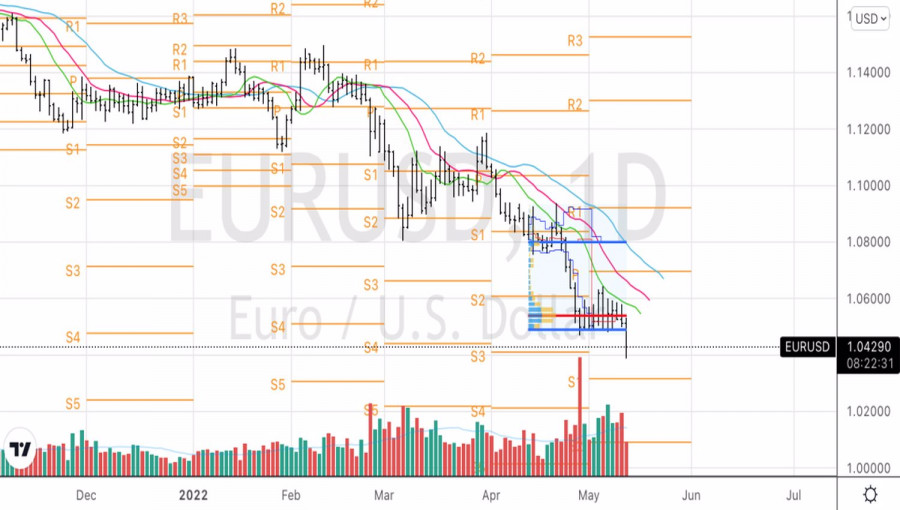
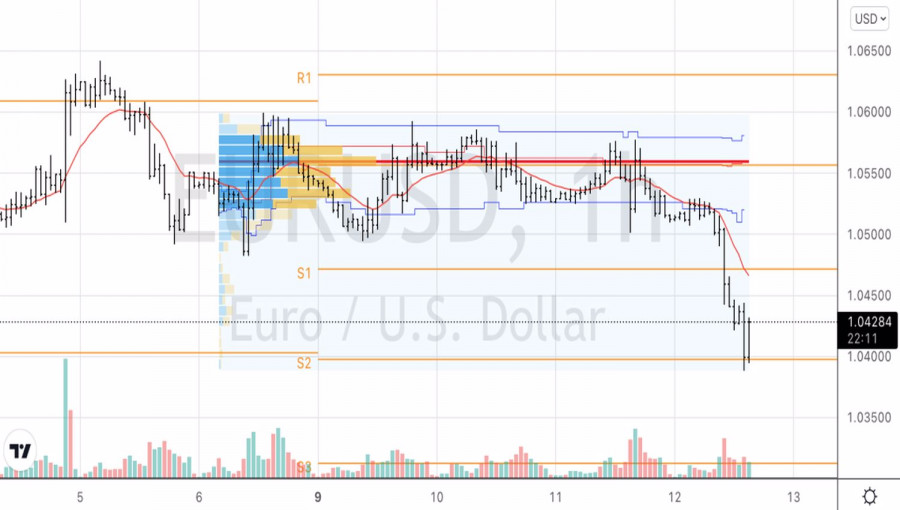
Personally, it is obvious that the European Central Bank, which has been sitting like a "dove" for a long time, turned on the "hawk" at full volume only because of the depreciation of the regional currency. Its weakening will certainly accelerate inflation and increase the cost of imported goods, including oil and gas, which will exacerbate the crisis in the cost of living in the euro area. At the same time, you need to understand that the ECB, unlike the Fed, has its hands tied. The eurozone economy is at risk of falling into recession even without monetary restrictions. If you finish it off by raising rates, then the decline will be as deep as in 2008 or in 2020. Lagarde and her colleagues must be extremely careful, and this caution prevents the EURUSD bulls. The situation is aggravated by the resuscitation of the Brexit theme. Britain insists that the Northern Ireland protocol not only kills trade in the region, but also leads to political confusion. London is threatening to cancel the deal with the EU unilaterally, raising the risks of a trade war and putting serious pressure on both the pound and the euro. Technically, on the daily chart, the EURUSD has finally left the 1.049–1.061 trading range. It is gratifying that recommended short entries on breaks of supports at 1.051 and 1.049 turned out to be fruitful. We keep short positions and periodically increase them on the rebound from 14-period EMA on the hourly timeframe. EURUSD, Daily chart
EURUSD, Hourly chart
|
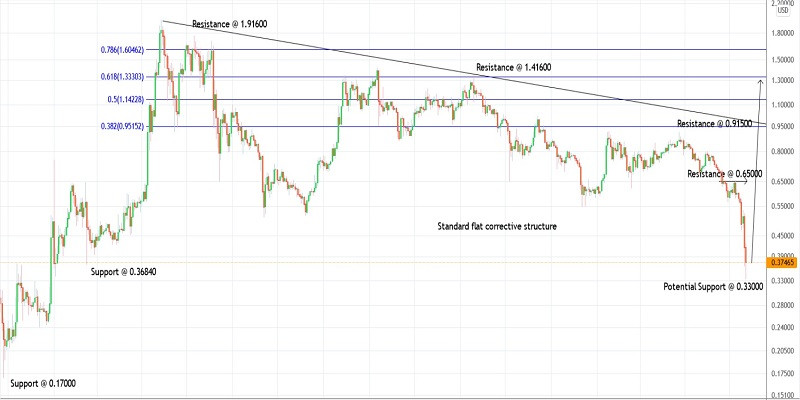
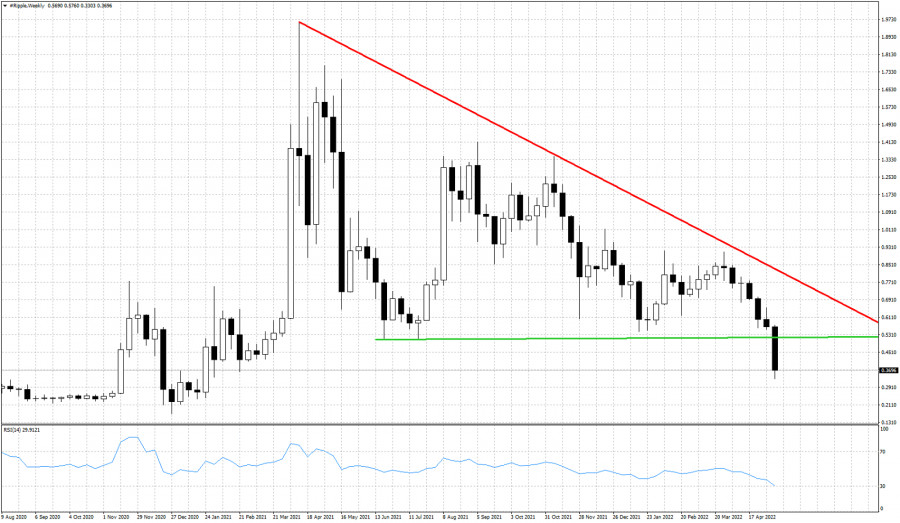
| Trading plan for Ripple on May 12, 2022 Posted: 12 May 2022 07:38 AM PDT
Technical outlook:Ripple has dropped to fresh swing lows close to $0.33350 on Thursday before finding support again. The drop has been in-line with projections but was slightly extended without changing the wave structure though. Bulls are poised to remain in control and push prices higher through the $1.30000 level going forward. Ripple has dropped just below its support from February 2021 around $0.36840 as marked on the daily chart here. Ideally, the price should produce a meaningful pullback at least through $1.31000. Please note that there is a high possibility that the price will move for an all-time high above $1.91600 going forward. It is pulling off the day's low and is trading close to the $0.37500 mark at the time of writing. Ripple has been declining since reaching the $1.91600 mark and the structure looks corrective until the recent lows are tested around $0.33350. If the above structure holds well, bulls would be keen to produce another rally which surpasses the $1.91600 mark. Either way, traders look poised to initiate fresh long positions from here. Trading plan:Potential rally through $1.30000 against $0.30000 Good luck! The material has been provided by InstaForex Company - www.instaforex.com |
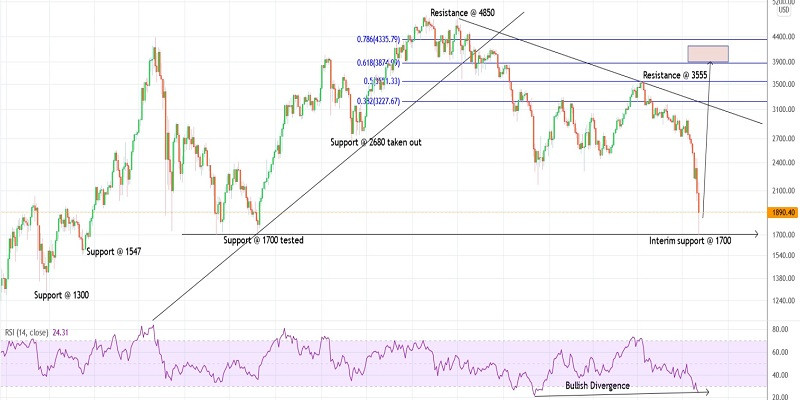
| Trading plan for Ethereum on March 10, 2022 Posted: 12 May 2022 07:16 AM PDT
Technical outlook:Ethereum dropped through formidable support at around $1,700 on Thursday, extending its drop as projected earlier. The crypto has now tested one-year support ($1,700) and is now pulling back sharply. It has regained the $1,900 handle at this point in writing as bulls are determined to come back in control holding above $1,700 going forward. Ethereum has now carved a meaningful larger degree downswing between $4,850 and $1,700, which should be ideally retraced up to the $3,900 levels going forward. Furthermore, major support has been tested at around $1,700 which calls for a pullback in the near term before the larger degree trend resumes lower. Finally, the RSI on the daily chart has produced a bullish divergence, which could be seen as a potential turning point. Ethereum faces immediate resistance around the $3,555 mark and bulls might be targeting to take that out in the next few trading sessions. Also note that $3,900 is the Fibonacci 0.618 retracement of the entire drop between $4,850 and $1,700, which is a strong resistance zone. Trading plan:Potential rally through $3,500 and $3,900 against $1,700 Good luck! The material has been provided by InstaForex Company - www.instaforex.com |
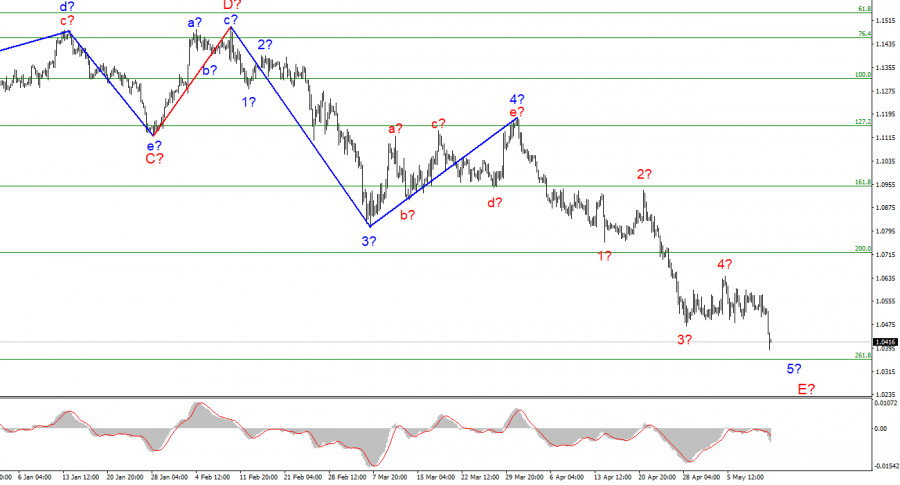
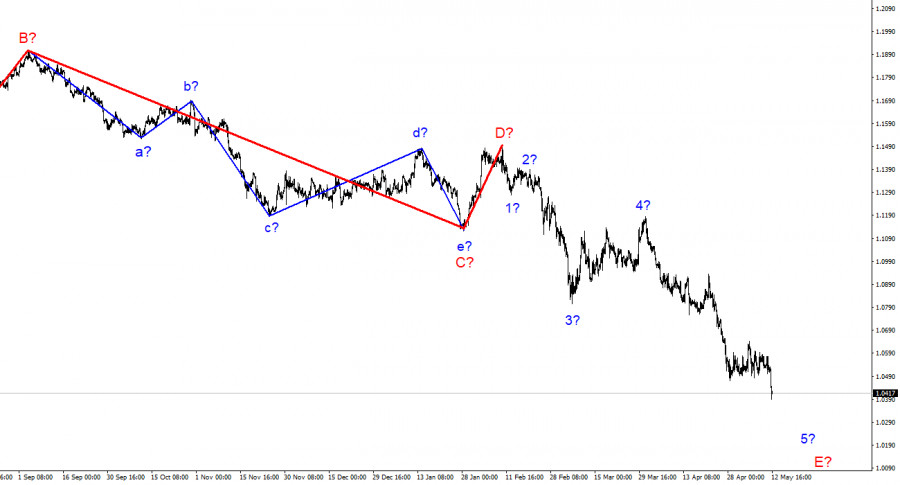
| Posted: 12 May 2022 07:06 AM PDT
The wave marking of the 4-hour chart for the euro/dollar instrument continues to look convincing and does not require adjustments. The instrument continues to build a descending wave 5-E, which is the last in the structure of the descending trend section. If this is true, then the decline in the quotes of the euro currency may continue for several more days, since this wave should turn out to be a five-wave in its internal structure. At the moment, four completed internal waves are visible inside this wave, so I'm counting on building another pulse wave. In the near future, the instrument may decline to the level of 1.0355, near which the construction of the current downward wave and the entire downward trend section may be completed. If the breakout attempt of 1.0355 turns out to be successful, the instrument will further complicate its wave structure and continue to decline. So far, the wave markup looks like in a textbook. Christine Lagarde strikes the euro currency again. The euro/dollar instrument declined by 100 basis points on Thursday. All thanks to ECB President Christine Lagarde. Yesterday, she announced that the regulator could start raising interest rates within the next few weeks after the completion of the APP incentive program. She had said the same words before, but each time it was like the first time. The market continues to sell euros as soon as it gets any reason to do so. Wave markup not only allows these actions but even supports them, so everything is fine. However, I cannot help but note that this rhetoric of Lagarde is not "terrifying" or "encouraging." Christine Lagarde gives a signal only that a rate hike in July, for the first time in 10 years, is not excluded. Unlike Luis de Guindos, she does not say that the rate may be raised in July. At the moment, rates are at record lows, and the ECB itself continues to stimulate the economy with the APP program, despite a high and continuing to rise in inflation. Therefore, by and large, Lagarde talks about a possible tightening of monetary policy, but the market hears only negative. In the current situation, I think we should pay more attention to the wave markup, as it looks very convincing now. If it is correct, then the decline of the instrument will be completed in the coming days. In addition, Christine Lagarde said that the ECB will complete asset purchases at the beginning of the third quarter of this year, but at the same time noted high risks for the European economy due to the Ukrainian-Russian conflict. Inflation in the EU continues to rise, but the risks to the economy are also growing. That is, the ECB may face the same situation that has already come to the United States, where GDP declined in the first quarter, and rates are actively rising despite this. Central banks are now on the verge of a serious choice, what to sacrifice: economic growth or inflation? From my point of view, both banks will try to balance between two evils, trying not to put their economy into recession and at the same time reduce inflation as much as possible. But what will come of it? And how will this affect the euro/dollar instrument? General conclusions. Based on the analysis, I still conclude that the construction of wave 5-E. If so, now is still a good time to sell the European currency with targets located around the 1.0355 mark, which corresponds to 261.8% Fibonacci, for each MACD signal "down". The construction of the proposed wave 4-5-E has already been completed.
On a larger scale, it can be seen that the construction of the proposed wave D has been completed, and the instrument regularly updates its low. Thus, the fifth wave of a non-pulse downward trend section is being built, which turns out to be as long as wave C. The European currency may still decline for some time. The material has been provided by InstaForex Company - www.instaforex.com |
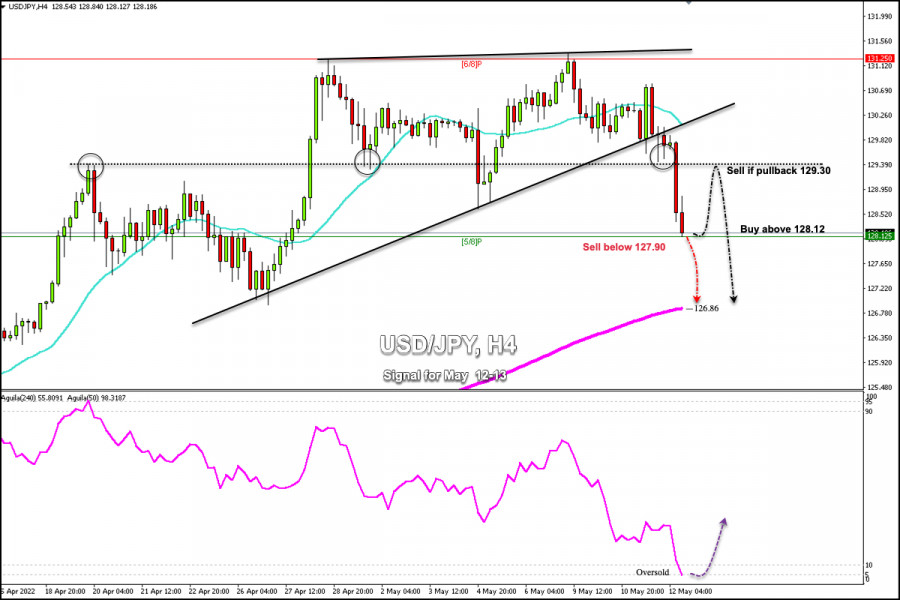
| Trading Signal for USD/PY on May 12-13, 2022: sell below 128.12 (5/8 Murray - oversold) Posted: 12 May 2022 07:05 AM PDT In the European session, USD/JPY fell below the psychological level of 130.00 and reached a two-week low at 128.12. At the time of writing, the pair is trading at 128.19 and above 5/8 Murray located at 128.12, with a strong bearish bias. Yesterday in our analysis we saw a strong oversold signal when the yen reached 130.80. We invite you to read our article and get some tips.
The Japanese yen fell after hitting 6/8 Murray at 131.34. From this level, USD/JPY embarked on a bearish sequence and the bias remains bearish. The price is likely to reach the level of 125.00 in the short term. The prevailing risk aversion sentiment, reflected by prolonged selling in equity markets, boosted safe-haven demand for the Japanese yen. Another factor supporting the yen's strength is the pullback in US Treasury yields, which put downward pressure on the USD/JPY pair. According to the 4-hour chart, we can see the formation of a rising wedge. This pattern was broken below the 21 SMA which means that the price could reach the 125.00 level in the short term and could even fall to 121.87 On the other hand, a sharp break below 5/8 Murray could accelerate the bearish move and the price could reach 200 EMA at 126.86. We must watch the 5/8 Murray level as a key point. In case the USD/JPY pair consolidates above this level, a pullback towards 129.30 could follow. Should it trade below 5/8, the downside pressure is likely to accelerate and we can expect a drop to 126.86. Our trading plan for the next few hours is to continue selling the Japanese Yen below 128.12 or in case of a pullback around 129.30. Our ultimate target in both cases is the area 126.86 (200 EMA). The material has been provided by InstaForex Company - www.instaforex.com |
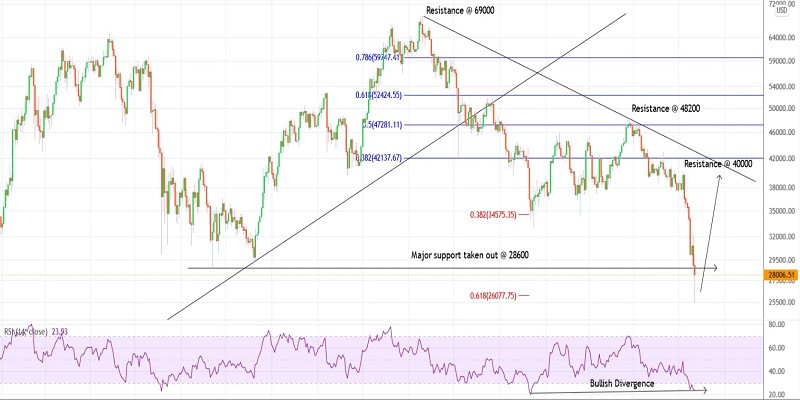
| Trading plan for Bitcoin on May 12, 2022 Posted: 12 May 2022 06:55 AM PDT
Technical outlook:Bitcoin dropped through fresh swing lows around $25,500 on Thursday, slightly lower than the projected low at $28,000. The crypto seems to have carved a major bottom at least for the near term and is raising back through $28,300 at the time of writing. Bulls might remain poised to target $42,000 and $52,000 going forward. Bitcoin is carving an effective Hammer/Pinbar candlestick pattern on the daily chart, which implies a potential reversal from here on. Furthermore, it has broken past a major past support around the $28,600 mark (July 2021), which implies a meaningful pullback ahead. Finally, the RSI on the daily chart is also producing a bullish divergence, enough grounds for a rally to materialize now. Bitcoin faces immediate resistance at $40,000, followed by $48,000 while interim support is at $25,000 now. Bulls will be eyeing to break above $42,000 first, confirming the corrective wave underway. Potential remains for the pullback to reach the $52,000 mark, which is the Fibonacci 0.618 retracement of the entire drop between $69,000 and $25,500 respectively. Trading plan:Potential rally through $42,000 and $52,000 against $20,000 Good luck! The material has been provided by InstaForex Company - www.instaforex.com |
| European stocks start trading session with large drop Posted: 12 May 2022 06:51 AM PDT On Thursday, the key European indices are steadily falling amid the financial statements of key corporations in the region and statistics. At the time of writing, the composite index of the leading companies STOXX Europe 600 decreased by 2.16% to 418.36 points. Since the beginning of 2022, this index has already lost more than 14%. UK investment firm Hargreaves Lansdown PLC lost 7.1% and Norwegian advertising company S4 Capital Plc declined by 7.4% being among the top losers of the STOXX Europe 600 components. The British FTSE 100 index plummeted by 2.04%, the French CAC 40 lost 1.78%, and the German DAX index declined by 1.76%.
Top gainers and losers The shares of French luxury goods manufacturers suffered maximum losses on Thursday. For example, Hermes lost 5%, while Kering and Louis Vuitton declined by 4.5%. The capitalization of the German energy company RWE AG dropped by 0.6%, despite the fact that its adjusted net profit more than doubled in the first quarter of this fiscal year. The securities of German industrial conglomerate Siemens Energy AG declined by 5%. In the second quarter of 2022, the company's net profit halved due to write-offs related to its Russian business. The capitalization of the German tour operator TUI AG grew by 2.6% on Thursday. Yesterday, the company's management announced plans to reach a profitable level by the end of the current fiscal year. The securities of the Italian banking group UniCredit rose by 0.8% on the news of preliminary talks on the sale of a subsidiary bank in Russia. The share price of the British aircraft engine manufacturer Rolls-Royce Holdings Plc increased by 0.4%. Recently, the company's management reported that the financial performance of Rolls-Royce at the beginning of this year is in line with the estimates. On Thursday morning, statistical data on the UK economy was published, which turned out to be lower than market forecasts. Thus, according to experts' preliminary estimates, in the first quarter, the country's gross domestic product increased by 8.7% in annual terms and by 0.8% in quarterly terms. Economists forecasted the growth of the index by 9% in January-March and by 1% in the past quarter. In March, the volume of industrial production in the country decreased by 0.2% as compared with February. At the same time, experts forecasted an increase of the index by 0.1% in monthly terms. An additional downward factor for the stock market in Europe on Thursday was also a strong drop in US stock exchanges, recorded at the end of the trading session on Wednesday. Yesterday's trading results Yesterday, European indicators showed a significant increase. Traders assessed corporate reports of local companies for the previous quarter as well as macroeconomic statistics. As a result, the composite index of the leading European companies STOXX Europe 600 rose by 1.74% to 427.59 points. The top results among STOXX Europe 600 components were shown by securities of the British company Homeserve, which provides repair services, which increased by 13.5%. Evotec SE, a German drug discovery and development company, dropped by 0.6%, Roche Holding, a Swiss pharmaceutical holding, declined by 6.9%, and Bayer AG, a German multinational chemical corporation, lost 6.2%. The companies were among the top losers among the components of the index. The key British FTSE 100 index rose by 1.44% on Wednesday, the French CAC 40 gained 2.5%, the German DAX increased by 2.17%, and the Italian FTSE MIB and the Spanish IBEX 35 added 2.84% and 2.13% respectively. The share price of German tour operator TUI AG rose by 5.6% yesterday. Earlier, the management of the company announced its plans to reach a profitable level by the end of the current fiscal year. ThyssenKrupp AG, Germany's largest steelmaker, soared by 11% after reporting second-quarter financial results that were the highest in a decade. The Swedish tobacco and cigar manufacturer Swedish Match jumped by 9% at the Stockholm trading. The reason for such a spectacular growth of shares was the announcement of the American Philip Morris about the purchase of Swedish Match for $16 billion. The capitalization of Germany's largest energy giant, E.ON SE, surged by 3.8% on Wednesday as revenues soared by 60% in the first quarter. The value of the securities of French railway train manufacturer Alstom SA fell by 5.2%. Even the company's strong corporate reports failed to push the stock upward. In 2022, Alstom SA's revenues rose by 76% thanks to a more than two-fold increase in orders. The share price of the German energy company Siemens Energy AG decreased by 5% the day before. In the second quarter of the current fiscal year, Siemens' net loss increased eightfold. On Wednesday, European investors focused on statistics for the region. According to the German Federal Statistical Office (Destatis), consumer prices in the country rose by a record 7.8% year-on-year in April. At the same time, the inflation rate in monthly terms amounted to 0.7%. The material has been provided by InstaForex Company - www.instaforex.com |
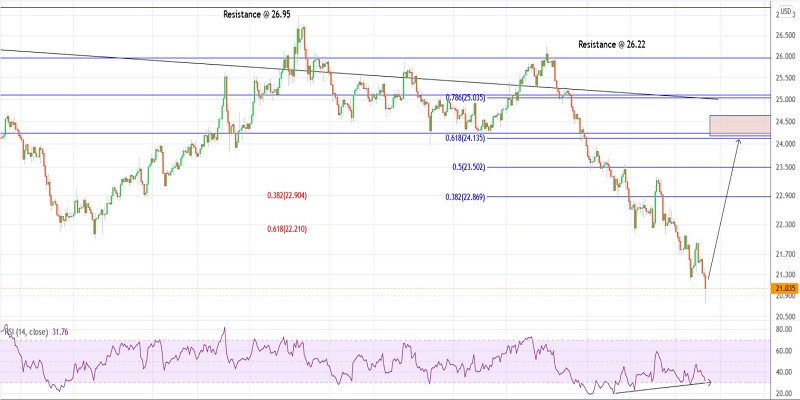
| Trading plan for Silver on May 12, 2022 Posted: 12 May 2022 06:28 AM PDT
Technical outlook:Silver prices dropped below $21.00 mark on Thursday and registered fresh swing low around the $21.75 mark before finding support again. The metal is quickly pulling back and seen to be trading around $21.15 levels at the time of writing. Bulls are looking poised to hold prices above $21.75 and push through the $22.00 initial resistance. Silver seems to have carved a meaningful downswing between $26.22 and $20.75 with the new low carved. Ideally, prices would pullback through $24.30-50 mark, before finding resistance again. Also note that the Fibonacci 0.618 retracement of the above drop is seen passing close to $24.10-20. A high probability remains for a bearish turn thereafter. Silver is facing immediate short term resistance at $22.00 and a break higher will confirm a meaningful bottom in place. Also note that 4H RSI is showing a bullish divergence as prices dropped to the $20.75 mark. This is potential reversal indication as traders prepare to initiate fresh long positions going forward. Trading plan:Potential rally through $24.30-50, against $20.00 Good luck! The material has been provided by InstaForex Company - www.instaforex.com |
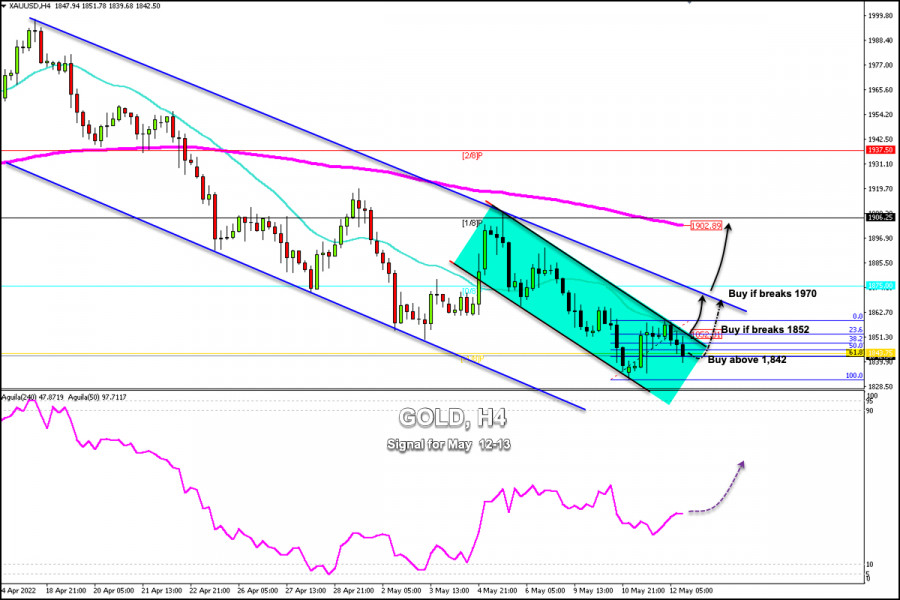
| Posted: 12 May 2022 06:22 AM PDT
Early in the American session, gold is falling, erasing part of the rebound from the low of 1,931. XAU/USD reached 1,858 in the Asian session, but then reversed direction and fell to 1,841. Gold falls as a result of further declines in the world stock markets and concerns about global growth. This puts downward pressure on commodity prices and strengthens the US dollar. According to the 4-hour chart, we can see that gold is trading at around 1,842. This level coincides with the 61.8% Fibonacci retracement (1,931-1,958). We can also see that gold is trying to consolidate above -1/8 Murray located at 1,843, an extremely oversold level. If gold continues to trade above this level in the next few hours, we could expect a recovery. Additionally, we can see that the 21 SMA is located at 1,852, just at the same level where the top of the short-term bearish channel is located. A sharp break above 1,852 and a close on the 4-hour chart could ease the downside pressure and gold could reach the level of 1,870. We can see on the 4-hour chart that since April 14 gold has been under downward pressure after approaching the psychological level of 2,000. A sharp break of this medium-term trend channel and a close on daily charts above 1,970 could mean a trend reversal and we could expect it to reach 200 EMA at 1,902 and could even reach 2/8 Murray at 1,937. Our trading plan for the next few hours is to buy gold at around the 61.8% Fibonacci level at 1,842, with targets at 1,852 and 1,870. The eagle indicator is giving a positive signal which supports our bullish strategy. The material has been provided by InstaForex Company - www.instaforex.com |
| USA still faces galloping inflation and labor market problems Posted: 12 May 2022 06:21 AM PDT Today's US PPI data release showcases rising inflation in the United States, which has not yet reached its peak. According to today's data, the producer price index jumped by 11.00% year-over-year, well above the forecasted 8.9% increase and upwardly revised 9.6% in March. Month-on-month, producer prices have increased by 0.5%, matching expectations. However, March's data was revised upwards to 1.6%. PPI futures did not react to the data release, reflecting the US market's focus on consumer price inflation. According to today's labor market data, 203,000 initial jobless claims were registered, exceeding the consensus forecast of 195,000. However, the report released the week before last was revised downwards to 202,000. Today's data releases show the US economy is likely to face serious issues for a long period of time. This would likely force the Fed to hike interest rates by at least 0.50% in June, giving support to USD and putting pressure on equities and commodities. The material has been provided by InstaForex Company - www.instaforex.com |
| EUR/USD Outlook on 12 May, 2022 Posted: 12 May 2022 06:17 AM PDT
EUR/USD has recovered modestly from the fresh multi-year low it set below 1.0400 earlier in the day. The data from the US showed that the Producer Price Index (PPI) edged lower to 11% on a yearly basis in April from 11.5% in March, causing the US Dollar Index to erase a portion of its daily gains. The EUR/USD pair currently trades a handful of pips above the 1.0400 threshold, but the daily chart suggests that the pair could still continue to fall. The pair has finally found some directional strength after a consolidative stage, and technical indicators reflect so, heading firmly lower near oversold readings. At the same time, the pair develops well below bearish moving averages, also reflecting prevalent selling interest. For the near term, and according to the 4-hour chart, the risk remains skewed to the downside. Technical indicators maintain their bearish slopes, despite being near oversold readings, while the pair gave up after repeatedly failing to advance beyond a mildly bearish 20 SMA. Renewed selling pressure below the aforementioned daily low exposes January 2017 multi-year low at 1.0339. Support levels: 1.0385 1.0340 1.0295 Resistance levels: 1.0470 1.0510 1.0550 The material has been provided by InstaForex Company - www.instaforex.com |
| GBP/USD Analysis on 12 May, 2022 Posted: 12 May 2022 06:16 AM PDT
GBP/USD has gained traction in the early American session and advanced toward the mid-1.2200s. The modest decline witnessed in the US April Producer Price Index (PPI) data seems to be causing the greenback to lose its appeal, helping GBP/USD rebound. GBP/USD returned below the descending trend line coming from May 5 after having recovered above it on Wednesday. Additionally, the last four four-hour candles closed below the 20-period SMA, highlighting the increasing bearish pressure. In case the pair fails to reclaim 1.2200 (psychological level, descending trend line), additional losses toward 1.2150 (static level from May 2020) and 1.2100 (May 15, 2020, low, psychological level) could be witnessed. On the other hand, 1.2250 (for support, static level from June 2020) and 1.2300 (psychological level, 20-period SMA) align as the next recovery targets if buyers manage to lift the pair above 1.2200. The material has been provided by InstaForex Company - www.instaforex.com |
| EUR/USD analysis on May 12, 2022 Posted: 12 May 2022 06:14 AM PDT
EUR/USD was trading in the range between 1.0500 and 1.0574 on Wednesday. However, today, the quotes continued to fall and settled below the sideways channel under the 200.0% Fibonacci retracement level at 1.0430. Now, the euro is heading towards the level of 1.0315. In general, the European currency has been declining for a year and a half, with the last few months being the hardest ones. Of course, the Ukrainian-Russian conflict has considerably undermined the position of the euro. However, I would like to remind you that the worst-case scenario for the European economy has not yet come true. Who knows what happens when Europe faces the consequences of the military conflict in Ukraine. Besides, the policies of the Fed and the ECB are completely opposite, or at least it has been so until recently. For instance, some ECB officials are now talking about a possibility of a rate hike in July this year. Even so, such hawkish comments do not support the euro in any way as it keeps moving lower. According to the CPI report released yesterday, inflation in the US showed some signs of a slowdown. Previously, running inflation supported the US dollar as traders expected the Fed to take aggressive steps. At the moment, the inflation rate is declining but the greenback is still on top. From my point of view, the euro/dollar pair has been largely oversold. Regardless of whether there is a driver or not, the euro is falling anyway, while the dollar is strengthening. Apparently, traders tend to completely downplay most of the economic reports and events as well as geopolitical factors. No important news has been received from Ukraine for several weeks, and there has been no progress from both sides. It would be ridiculous to suggest that the euro will keep plunging until the conflict in Ukraine is resolved.
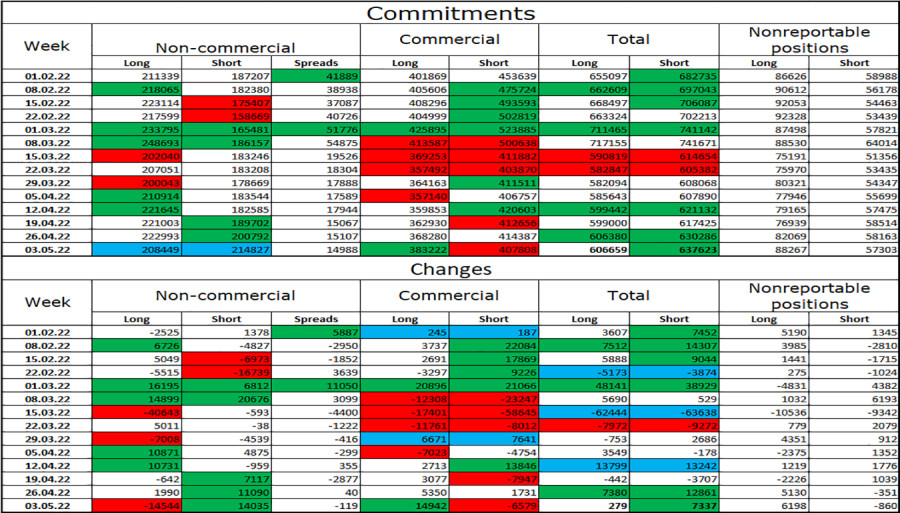
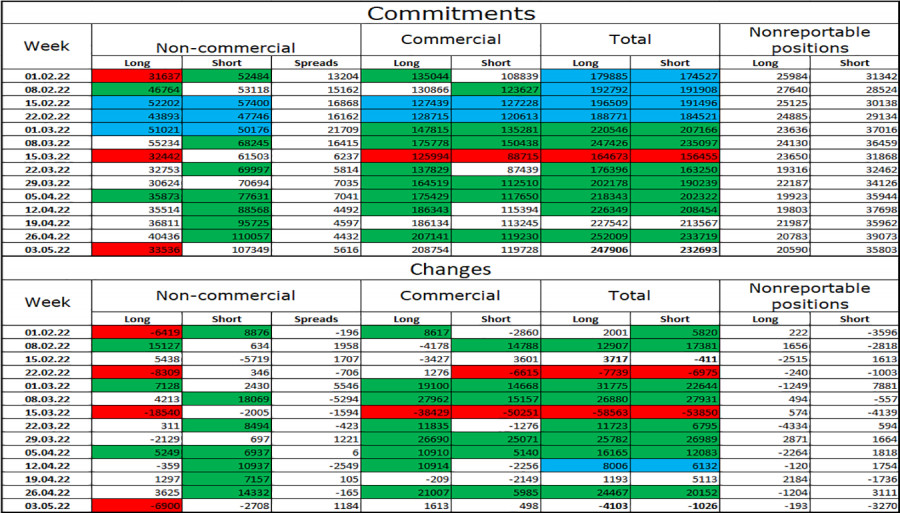
On the 4-hour chart, the pair bounced off the 100.0% Fibonacci retracement level at 1.0638 and reversed, thus supporting the US currency. So, the price continues to fall towards the next retracement level of 127.2% at 1.0173. The descending channel confirms that the market sentiment remains bearish. Consolidation above the level of 1.0638 will suggest growth to the upper boundary of the descending channel. Commitments of Traders (COT) report:
Last week, traders closed 14,544 long contracts and opened 14,035 short contracts. This means that the bullish sentiment of the big market players has weakened significantly, and this will be the third week in a row. The total number of long contracts stands at 208k and short contracts - at 214k. For the first time in quite a long time, the non-commercial category of traders is bearish on the pair, while the euro continues to fall against the dollar. For several months in a row, the COT data suggested that the euro should recover soon. That is why I cannot say for sure that everything became clear now. Such factors as the ongoing conflict in Ukraine, escalation of tensions between Europe and Russia, new sanctions, and the weakness of the ECB's position have a very strong impact on the market. Economic calendar for US and EU:United States - Initial Jobless Claims (12-30 UTC). On May 12, the economic calendar has only one important event to show both in the US and the EU. One report is unlikely to shape traders' sentiment, so there will be no information background today. EUR/USD forecast and trading recommendations: I recommended selling the pair in case the price rebounds from the level of 1.0574 on H1 and heads towards the lower boundary of the sideways channel. However, the pair dropped below the channel and stayed under the level of 1.0430. Therefore, traders should keep their short positions open. It is better to wait before buying the pair as the downward movement is really very strong. The material has been provided by InstaForex Company - www.instaforex.com |
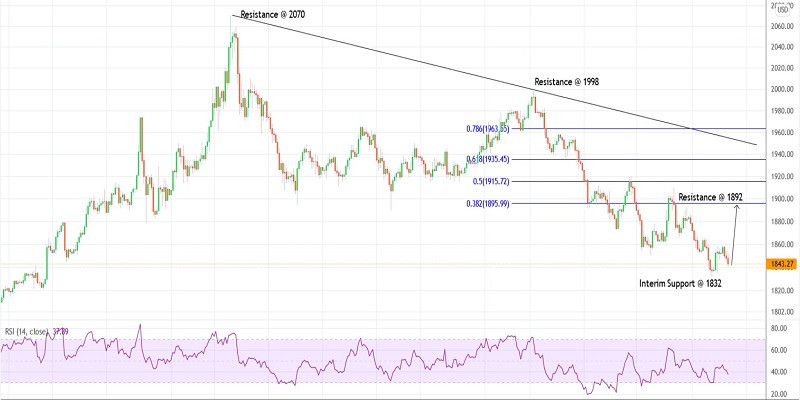
| Trading plan for Gold on May 12, 2022 Posted: 12 May 2022 06:03 AM PDT
Technical outlook:Gold prices rallied through $1,858 in the early hours on Thursday before pulling back. The yellow metal seems to have found support at just around $1,840 in the past hour and is expected to resume its rally soon. Bulls are looking poised to push through $1,892 in the near term and hold prices above the $1,832 interim support. Gold has carved a meaningful lower degree upswing between $1,832 and $1,858 as seen on the 4H chart here. Furthermore, the yellow metal has retraced lower through the $1,840 mark as well, which is the Fibonacci 0.618 retracement of the above rally (not shown here). If the above structure holds well, bulls would resume higher anytime soon. Gold prices are ready to retrace to a larger-degree downswing between $1,998 and $1,832. The Fibonacci 0.618 retracement of the above drop is passing through the $1,935 mark as presented on the chart. The high probability remains for bears to come back in control if prices manage to push through the $1,935-40 zone going forward. Trading plan:Potential rally towards $1,892 and $1,935 against $1,830 Good luck! The material has been provided by InstaForex Company - www.instaforex.com |
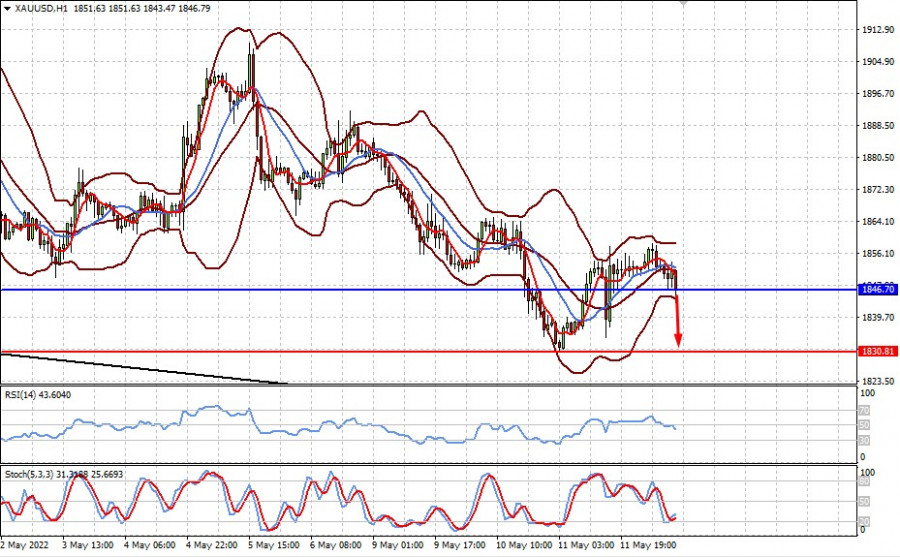
| Technical review for XAU/USD: price could decline again Posted: 12 May 2022 05:53 AM PDT Gold is under pressure because the latest report on US inflation is likely to force the Fed to keep on increasing interest rates aggressively, which supports dollar. Technical picture: The quote is currently below the middle line of the Bollinger indicator, under the SMA 5 and SMA 14. The relative strength index (RSI) is also below 50% and is declining. Possible dynamics: Dipping below 1846.70 will prompt a further fall to 1830.80.
|
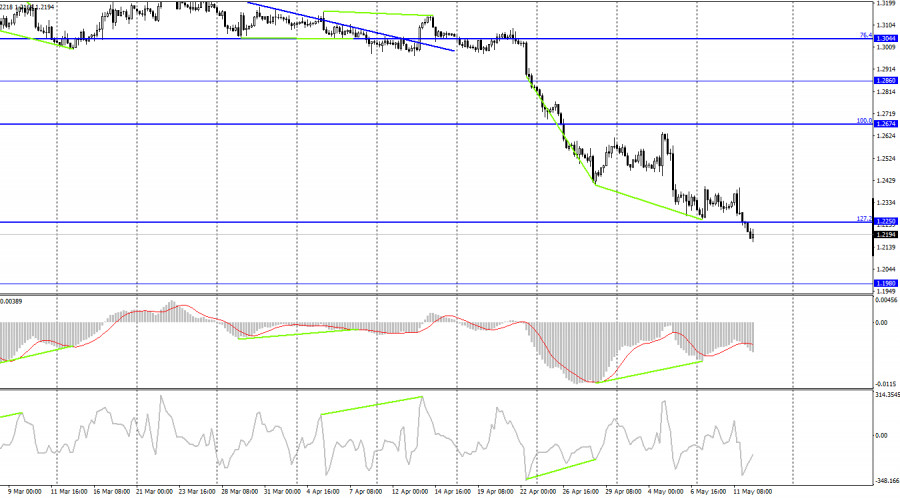
| GBP/USD: analysis on May 12, 2022. UK GDP misses market forecast Posted: 12 May 2022 05:52 AM PDT
Hello, dear traders! According to the H1 chart, GBP/USD was volatile on Wednesday. Eventually, it managed to settle below 1.2272. The quote bounced off this level thrice in the past four days. The price is now moving to the 523.6% retracement level of 1.2146. A rebound from this level might lead to the strengthening of the pound. However, it would be unwise to go long during such a steep fall. The quote may well drop below 1.2146. Today, there was a strong fundamental background in the UK, with several important macro releases coming out. The British economy expanded by 0.8% in the first quarter, below market forecasts of 1%. On a monthly basis, GDP contracted by 0.1%. Industrial production dropped by 0.2% m/m and rose by 0.7% y/y. In this light, the pound had every reason to go down today. However, if taking a closer look at the chart, it would become clear that the fall started yesterday and continued today. Generally speaking, the price went down long before the release of macro statistics in the UK. It is possible to assume that some large traders were aware of macro results in advance. However, in that case, statistics lose all meaning for small traders because the movement is already over when it comes out. Anyway, the market is now in a rather complex and mixed situation. If not for these macro results, the conclusion would be the same as for the euro: GBP falls steeply although there is hardly any reason for it to extend the bear run. Still, there are some occasional causes for a plunge. In particular, the Bank of England is now considering the possibility of taking a break from raising interest rates. Such speculation is enough for the pound to nosedive again.
On the 4-hour chart, the pair consolidated below the 127.2% retracement level of 1.2250. Thus, the bear run might extend to 1.1980. Meanwhile, the MACD indicates there is an impending bullish divergence. It can help the pair somewhat advance. However, the previous bullish divergence allowed GBP to rise by just 130 points. Commitments of Traders (COT):
The sentiment of non-commercial traders dramatically changed last week. The number of long positions decreased by 6,900 and short ones dropped by 2,708. Overall, bearish sentiment grew. The number of long positions is now 3 times higher than that of short ones (107,349/33,536). Therefore, the general sentiment of large traders turned more bullish. The sell-off of the pound continues. In this light, GBP is likely to remain bearish for the next few weeks. However, such a wide gap between the number of Longs and Shorts may signal an imminent trend reversal in the market. It is also possible that the pound ends its prolonged bear move this week. Macro events in the United States and the United Kingdom: United Kingdom: GDP Growth Rate, Industrial Production (06-00 UTC).United States: Initial Jobless Claims (12-30 UTC). On Thursday, the UK has already seen the release of all the reports scheduled for the day. The pound has been bearish all day long. The macroeconomic calendar in the US contains no important events. Thus, the fundamental background is unlikely to somehow affect the market today. Outlook for GBP/USD: Short positions could be opened with the target at 1.2146 if the price closes below 1.3181. Long positions should be postponed today as the downtrend has resumed. The material has been provided by InstaForex Company - www.instaforex.com |
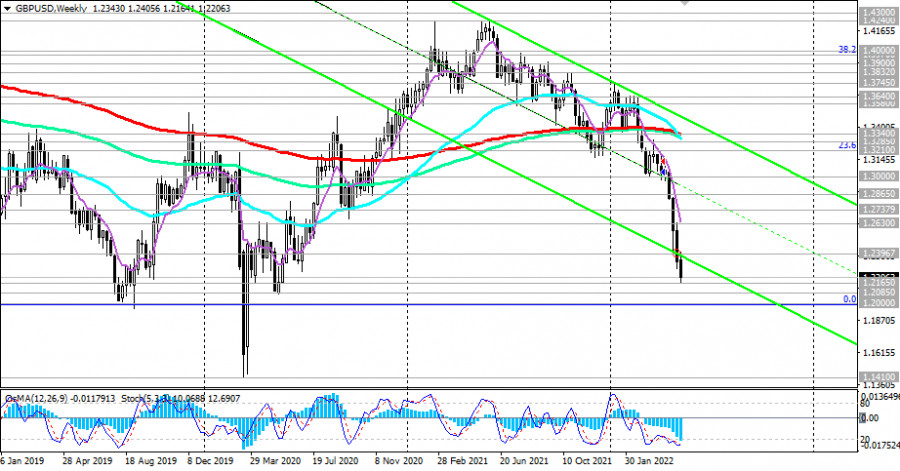
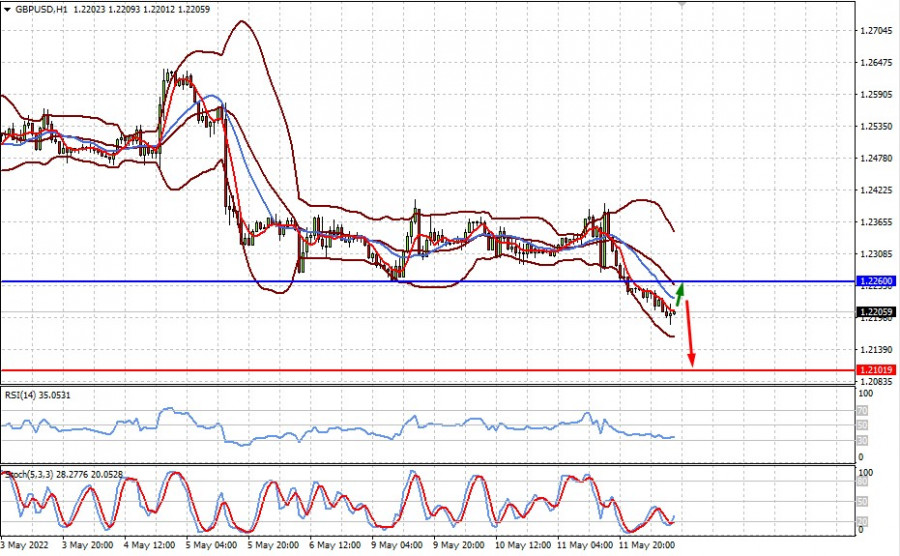
| GBP/USD Technical Analysis and Trading Tips on May 12, 2022 Posted: 12 May 2022 05:52 AM PDT The British pound fell to its lowest level in two years against the US dollar and hit a 7-month low against the euro following the release of UK GDP data.
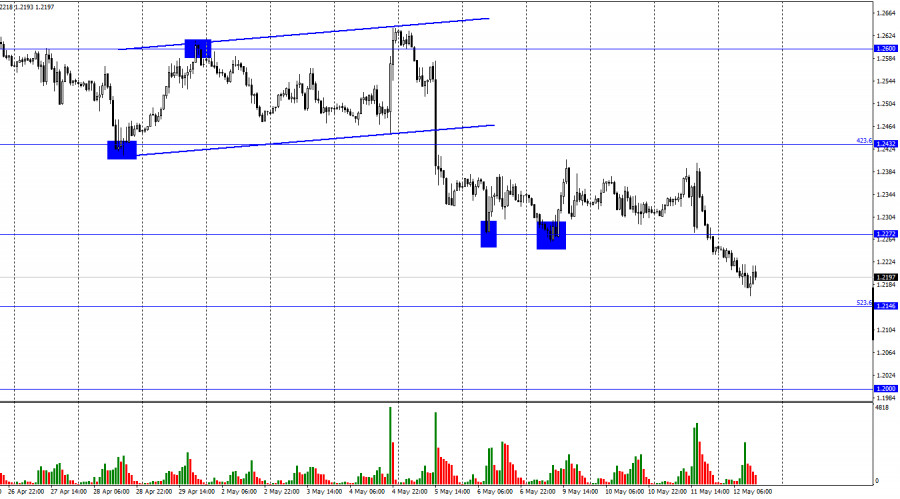
At the time of writing this article, GBP/USD was near 1.2207, 42 pips above today's low reached at the start of the European session. Last week, the price broke through the lower limit of the descending channel on the weekly chart (near 1.2396), and today it is testing the lower limit of the descending channel on the daily chart, passing through 1.2235, for a breakdown.
Thus, the dynamics of the decline is accelerating, and GBP/USD is moving towards the local support levels of 1.2085, 1.2000. In the review for 04/22/2022, we wrote that more distant targets for the GBP/USD decline are located at local support levels 1.2250, 1.2085, 1.2000 (the low in the GBP/USD decline wave that began in July 2014 near the level of 1.7200). It looks like our scenario is coming true.
In an alternative scenario, and after the breakdown of the resistance level of 1.2396, GBP/USD will resume growth. The target of this upward correction may be resistance levels 1.2630, 1.2738 (200 EMA on the 4-hour chart), 1.2865 (upper limit of the descending channel and 50 EMA on the daily chart), and 1.3000 (local resistance level).
However, only growth in the zone above the resistance levels of 1.3285 (200 EMA on the daily chart), and 1.3340 (200 EMA on the weekly chart) can reverse the situation, increasing the probability of GBP/USD growth in the long-term bull market zone, above the key resistance level of 1.4580 (200 EMA on the monthly chart and the 50% Fibonacci retracement to the decline of GBP/USDUSD in the wave that began in July 2014 near the level of 1.7200). Support levels: 1.2165, 1.2100, 1.2085, 1.2000 Resistance levels: 1.2396, 1.2630, 1.2738, 1.2865, 1.3000, 1.3210, 1.3285, 1.3340 Trading Tips Sell Stop 1.2160. Stop-Loss 1.2250. Take-Profit 1.2100, 1.2085, 1.2000 Buy Stop 1.2250. Stop-Loss 1.2160. Take-Profit 1.2300, 1.2396, 1.2630, 1.2738, 1.2865, 1.3000, 1.3210, 1.3285, 1.3340 The material has been provided by InstaForex Company - www.instaforex.com |
| Technical review for GBP/USD: price will decline after a local recovery Posted: 12 May 2022 05:46 AM PDT Pressure returned in GBP/USD after the UK reported a weak GDP data for the 1st quarter. Many became worried because the figure indicates that the economy is entering a recession. The divergence in the ratio of interest rates between the Fed and the Bank of England, as well as increased expectations of a more aggressive Fed rate hike in June, could lead to a further fall in the pair. technical picture: The quote is below the middle line of the Bollinger indicator, above the SMA 5, but below the SMA 14. The relative strength index (RSI), meanwhile, is below 50% but is moving up, while the stochastic indicator is showing a reversal above the oversold zone. Possible dynamics: The pair may correct to 1.2260 and then resume falling to 1.2100.
|
| XRPUSD bulls fail to hold key support. Posted: 12 May 2022 05:46 AM PDT XRPUSD has broken below the $0.50 support level. Like most cryptocurrencies, XRPUSD is not the exception. Price remains under pressure while price exits the long-term triangle pattern to the downside. In previous posts we warned traders many times that as long as price remains below the upper triangle boundary, bears would remain in full control.
Red line - major resistance On a weekly basis XRPUSD is attempting a major break down. Price is breaking below the $0.50 that was held in two previous occasions. Trend remains clearly bearish. With this week's break down we can not rule out a deeper move lower towards $0.15. Trend change on a weekly basis can be considered only if price breaks above the red downward sloping resistance trend line. Until then, bears are in control of the trend. The material has been provided by InstaForex Company - www.instaforex.com |

| You are subscribed to email updates from Forex analysis review. To stop receiving these emails, you may unsubscribe now. | Email delivery powered by Google |
| Google, 1600 Amphitheatre Parkway, Mountain View, CA 94043, United States | |


Comments