Forex analysis review
Forex analysis review |
- How to trade EUR/USD on May 16? Simple tips for beginners.
- Technical analysis of BTC/USD for May 15, 2022
- EUR/USD. Results of the week. New price horizons and the "ghost of parity"
- Germany is seriously concerned about the prospects of global famine worldwide
- The cost of natural gas in Europe has decreased, but the crisis does not let go
- The oil market and the pernicious US rate hike
- What will happen to gold: a gloomy forecast for next week
- GBP/USD outlook on May 13. British pound is weak to recover
- US stocks soared sharply on Friday, but once again ended the week in the red
- EUR/USD: How far can the dollar go?
- Key exchanges in Europe close the week in a confident positive
- Bitcoin shows an enchanting growth, but all the investors' attention is focused on the conflict in the stablecoin market
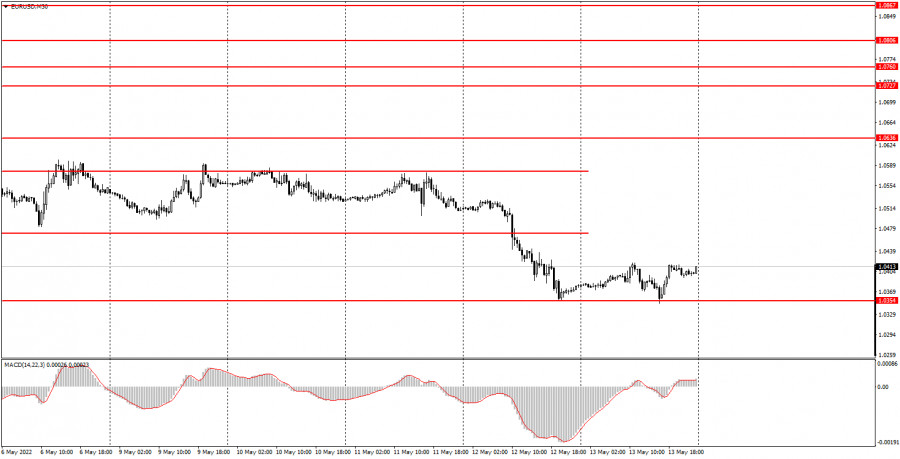
| How to trade EUR/USD on May 16? Simple tips for beginners. Posted: 15 May 2022 07:00 AM PDT Analysis of previous deals:30M chart of the EUR/USD pair
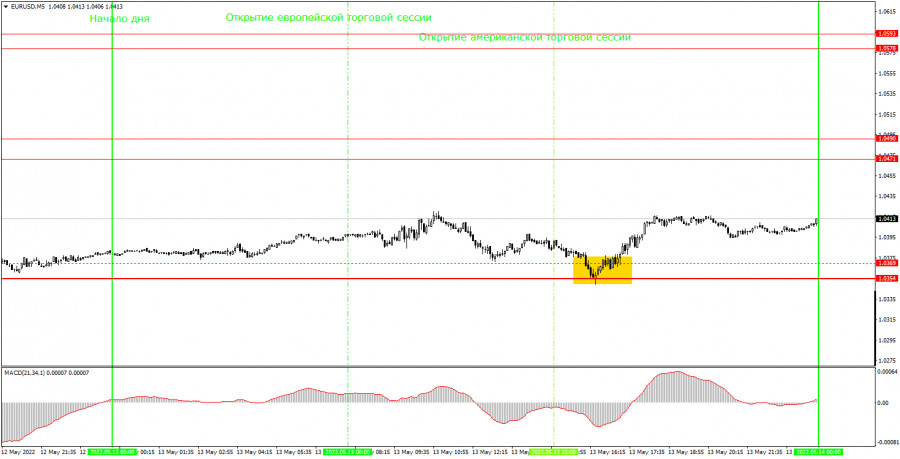
The EUR/USD currency pair tried to continue its downward movement on Friday, but failed to break through the level of 1.0354. Thus, most of the day there was, if not a flat, then almost a sideways movement. In fact, this moment should not mislead novice traders. The downward trend still continues. Just a couple of days ago, the pair was still inside the two-week horizontal channel, but even in that case, the downward trend remained. And this despite the fact that neither the trend line nor the downward channel on the 30-minute TF has been there for a long time. The trend is clearly visible on the 4-hour timeframe and higher. The European currency continues to be near its 20-year lows, and its stubborn unwillingness to start an upward correction says so far only one thing: it will continue to fall. Now in order for it to continue it should surpass the level of 1.0354. There were no important events in the European Union and the United States on Friday. Formally, traders worked out both the EU industrial production report and the US consumer sentiment index. After the first (disappointing) report, the euro fell in price by 30 points, and after the second (disappointing) report, it fell in price by 30 US dollars. The reaction, therefore, was weak, and the overall picture of the situation did not change. 5M chart of the EUR/USD pair
The technical picture on the 5-minute timeframe is still very simple. There are still few levels near which signals can be formed, so there are also few trading signals. Only one was formed on Friday - near the level of 1.0369, which by the end of the day transformed into the level of 1.0354 (Thursday's low). A rebound from this level is a signal for long positions, after which the price went up no more than 20 points. This was enough to at least set Stop Loss to breakeven. Therefore, the transaction was absolutely not unprofitable. It had to be closed manually in the late afternoon, so you could even make a profit of about 20 points. In general, volatility was rather weak, especially against the backdrop of movements in recent weeks and months. The pair continues to be "at the bottom" and so far, even on a 5-minute timeframe, it is not visible that it is trying to start forming at least a local upward trend. How to trade on Monday:The trend remains downward on the 30-minute timeframe, and the price has left the horizontal channel. Despite the fact that the two attempts to surpass the level of 1.0354 had failed, the euro may resume to fall almost at any moment. The market stubbornly refuses to correct the pair, and the foundation and macroeconomics cannot currently support the euro. On the 5-minute TF tomorrow it is recommended to trade at the levels of 1.0354, 1.0471-1.0490, 1.0578-1.0593. When passing 15 points in the right direction, you should set Stop Loss to breakeven. No important event or report scheduled for the European Union or the United States on Monday. However, this does not mean at all that the pair will stand in one place all day. Nevertheless, in recent weeks, volatility is quite high, and the trend is stable. With such input data, traders do not always need grounds for active operations in the foreign exchange market. Moreover, now everyone is guided by the rule "buy a dollar and you will be happy." Basic rules of the trading system:1) The signal strength is calculated by the time it took to form the signal (bounce or overcome the level). The less time it took, the stronger the signal. 2) If two or more deals were opened near a certain level based on false signals (which did not trigger Take Profit or the nearest target level), then all subsequent signals from this level should be ignored. 3) In a flat, any pair can form a lot of false signals or not form them at all. But in any case, at the first signs of a flat, it is better to stop trading. 4) Trade deals are opened in the time period between the beginning of the European session and until the middle of the American one, when all deals must be closed manually. 5) On the 30-minute TF, using signals from the MACD indicator, you can trade only if there is good volatility and a trend, which is confirmed by a trend line or a trend channel. 6) If two levels are located too close to each other (from 5 to 15 points), then they should be considered as an area of support or resistance. On the chart:Support and Resistance Levels are the Levels that serve as targets when buying or selling the pair. You can place Take Profit near these levels. Red lines are the channels or trend lines that display the current trend and show in which direction it is better to trade now. The MACD indicator (14,22,3) consists of a histogram and a signal line. When they cross, this is a signal to enter the market. It is recommended to use this indicator in combination with trend lines (channels and trend lines). Important speeches and reports (always contained in the news calendar) can greatly influence the movement of a currency pair. Therefore, during their exit, it is recommended to trade as carefully as possible or exit the market in order to avoid a sharp price reversal against the previous movement. Beginners on Forex should remember that not every single trade has to be profitable. The development of a clear strategy and money management are the key to success in trading over a long period of time. The material has been provided by InstaForex Company - www.instaforex.com |
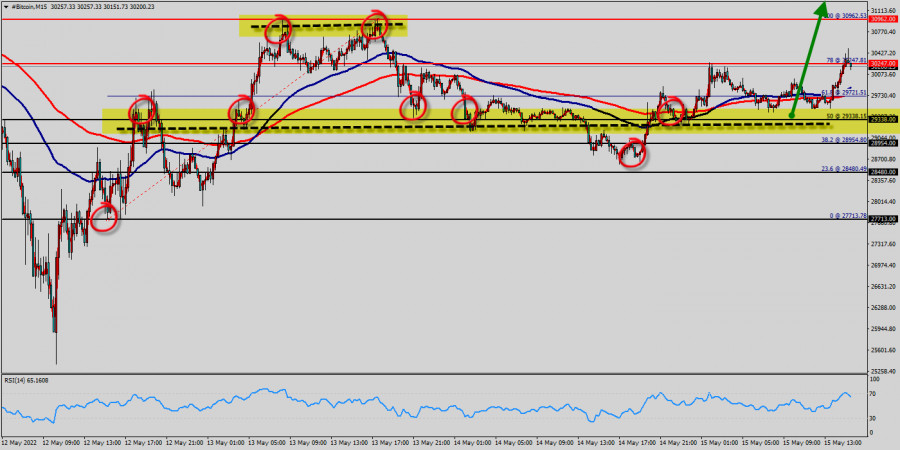
| Technical analysis of BTC/USD for May 15, 2022 Posted: 15 May 2022 06:57 AM PDT
Technical market outlook (Bitcoin): The BTC/USD was unable to increase and eventually broke to the downside. This resulted in a considerable liquidation cascade and a drop below the critical support level of $30,962. Bitcoin dropped strongly from the price of $30,962 to reach the bottom price at $27,713, but the trend rebounded from the lowest price to close at $30,101 (currently price). Bitcoin can stage a relief rally within the $30,962 to $27,713 range, but selling at resistance could still keep BTC in a strong bear trend. The bulls must set above the price of $29,338 in order to resume the up trend. Closing above the pivot point ($29,338 ) could assure that BTC/USD will move higher towards cooling new highs. BTC broke below the $30,247 support on May 12, 2022 and later slipped below the psychological level at $29,338. The bulls bought the dip to $27,713, which has started a relief rally. Right now, BTC has been set above the strong support at the price of $29,338, which coincides with the 50% Fibonacci retracement level. This support has been rejected three times confirming the veracity of an uptrend. The market is likely to show signs of a bullish trend around the spot of $29,338. Trading BTC/USD : Bitcoin The trend is still bullish as long as the price of $29,338 is not broken. Thereupon, it would be wise to buy above the price of at $29,338 with the primary target at $30,962. The volatility is very high for that the BTC/USD is still moving between $29,338 and $30,962 in coming hours. Consequently, the market is likely to show signs of a bullish trend again. So, it will be good to re-buy above the level of 30,962 with the second target at $31,500 and further to $32k in order to test the daily resistance 2. Then, the BTC/USD pair will continue towards the second target at $32,000 (a new target is around $32,000). Alternative scenario : The breakdown of $27,713 will allow the pair to go further down to the prices of $26,000 and $25,500. The material has been provided by InstaForex Company - www.instaforex.com |
| EUR/USD. Results of the week. New price horizons and the "ghost of parity" Posted: 15 May 2022 05:58 AM PDT The second week of May turned out to be significant for the EUR/USD pair: for the first time since 2017, traders were able to enter the area of the 3rd figure. The next trading five-day period again turned out to be on the bears' side, who lowered the price by another 200 points. Parity is more and more clearly visible on the horizon, although it is still too early to talk about its achievement. Ahead of the EUR/USD bears are the key support levels that were last tested 20 years ago, back in 2002. Therefore, bears will have a hard time in this price area, especially in the context of overcoming the boundaries of 1.0340 and (especially) 1.0300. Five years ago, the bears ran into this price barrier and reversed almost immediately. After that, the pair was already within the framework of a pronounced upward trend, rising to 1.2000 by December 31, 2017.
It is noteworthy that five years ago, the pair collapsed into the area of the third figure against the background of geopolitical instability and tightening of the Federal Reserve's monetary policy. The Fed gradually but consistently raised the interest rate, and European investors shuddered in anticipation of a repeat of Brexit, only now in French execution. In the spring of 2017, presidential elections were held in France, which, as you know, Emmanuel Macron won. However, a few months before this event, his victory was by no means decided. Marine Le Pen's rating was gaining momentum, and her anti-European rhetoric was gaining popularity. And here it should be noted that Le Pen of the sample of 2017 and 2022 are, in fact, two different politicians. At that time, she promised to withdraw the country from the EU and from the eurozone, whereas this year her election program has noticeably softened – Le Pen proposed only to reform the European Union "from within", without leaving the EU. As for the Fed's policy, the tightening process in the period 2015-2019 took place smoothly, steadily and in 25-point steps.To date, the EUR/USD pair is declining, at first glance, "by the same leaps and bounds": geopolitical instability + divergence of the positions of the Fed and the European Central Bank. However, the current conditions are more radical and pessimistic for the euro. Therefore, it is now impossible to draw conditional "red lines", assuming that the EUR/USD bears will stop in the area of 2017 support levels, not daring to storm the 2nd figure. No, in the current conditions, bears are quite capable of going further – they only need the appropriate information support for this. And, judging by the results of the past week, the fundamental background is developing just accordingly, contributing to the further decline of the pair. Firstly, the report on the growth of inflation in the United States did not disappoint. A formal slowdown in growth does not count. The overall consumer price index remained above the 8 percent mark, the core - above 6 percent. These are long-term records that allow the Federal Reserve to further tighten monetary policy at an aggressive pace. Actually, this factor is the second circumstance pushing the EUR/USD pair down. Last week, some Fed representatives (who have the right to vote this year) actually announced several rounds of a 50-point rate hike. We can speak with confidence about the June and July meetings. The September meeting is questionable, since here the members of the US central bank will evaluate the effectiveness of the measures already taken. If inflation does not slow down, the Fed will also raise the rate by 50 points at the September meeting. Also, a 75-point increase at one of the meetings is not excluded (again, everything depends on the further trajectory of the main inflation indicators) – Fed Chairman Jerome Powell did not categorically deny this scenario, noting only that the Committee members "do not actively discuss it." Thirdly, the EUR/USD pair is declining due to the passive-expectant position of the ECB. In fairness, it must be admitted that the "hawkish voices" from the ECB have been sounding louder lately, thanks to which the currency strategists of many large banks are revising their earlier forecasts. In particular, according to Goldman Sachs analysts, the ECB may raise interest rates by 25 basis points in July, after it decides at the June meeting to terminate its asset purchase program by the end of the second quarter. Experts also suggest that the ECB may consider a 25-point rate hike at the September meeting and in December. If we talk about longer-term prospects, here Goldman Sachs analysts predict four increases within the next year. It is noteworthy that the euro (especially paired with the dollar) actually ignores the tightening of rhetoric from the ECB representatives. Rare corrective pullbacks occur only due to profit-taking or due to the weakening of the greenback. While the euro is not able to influence the pair, strengthening its position. This suggests that the single currency is too vulnerable – against the background of the impending energy crisis, the sanctions confrontation with Russia and the protracted (and so far inconclusive) Russian-Ukrainian negotiations. Plus, there are risks of stagflation and recession. All these factors are pulling the euro to the bottom, leveling the optimism associated with the "hatching" tightening of the rhetoric of ECB members. Thus, there are no grounds for a reversal of the downward trend for the EUR/USD pair. At the same time, corrective pullbacks are quite possible, and moreover, they will be very useful in the context of opening short positions at a more favorable price. But here it is necessary to take into account the fact that further steps towards the 1.0300 mark and (especially) towards the second figure will not be an easy walk for EUR/USD bears. Here, the downward trend may stall for some time, playing out very broad corrective waves. Therefore, it is advisable to go into short positions not at the lowest price point (1.0350 and below), but when the next corrective wave fades, optimally – around 1.0450-1.0500. The material has been provided by InstaForex Company - www.instaforex.com |
| Germany is seriously concerned about the prospects of global famine worldwide Posted: 14 May 2022 10:16 PM PDT During a press conference following the meeting of the foreign ministers of the G7 countries, German Foreign Minister Annalena Berbock said that due to the armed conflict between Russia and Ukraine, the world is threatened with global famine. In addition, the German politician stressed that the consequences of the food catastrophe are already being felt, because today many states are facing serious problems in providing for the citizens of their countries. It was this topic, Berbock said, that was one of the key issues during the G7 meeting.
The German Foreign Minister considers the tense geopolitical situation in eastern Europe as the main reason for such a depressing situation. In connection with the Russian-Ukrainian conflict, difficulties are increasingly arising with the supply of raw materials and products, as well as prices for them are permanently increasing. According to the Minister of Foreign Affairs, the best solution to this problem could be the stabilization of the situation in Ukraine. In the event of the cessation of the military conflict on the territory of this state, Berbock said, world prices for grain and food would normalize in the shortest possible time. On Friday, commenting on the consequences of anti-Russian sanctions, Deputy Chairman of the Russian Security Council Dmitry Medvedev said that due to the restrictions imposed, the world may face a political, financial and food crisis, as well as severe hunger in individual states. According to Medvedev, there is a high probability of a tangible decline in all other areas of the old "American-centric" world.There has been a lot of talk about the delayed prospects of anti-Russian sanctions for the whole world before. So, at the end of March, UN Secretary-General Antonio Guterres warned that the military conflict in eastern Europe and restrictions on Russia threaten the whole world with global famine. Then the main reason for a possible food catastrophe, the Secretary General called a sharp increase in the cost of energy and fertilizers. The material has been provided by InstaForex Company - www.instaforex.com |
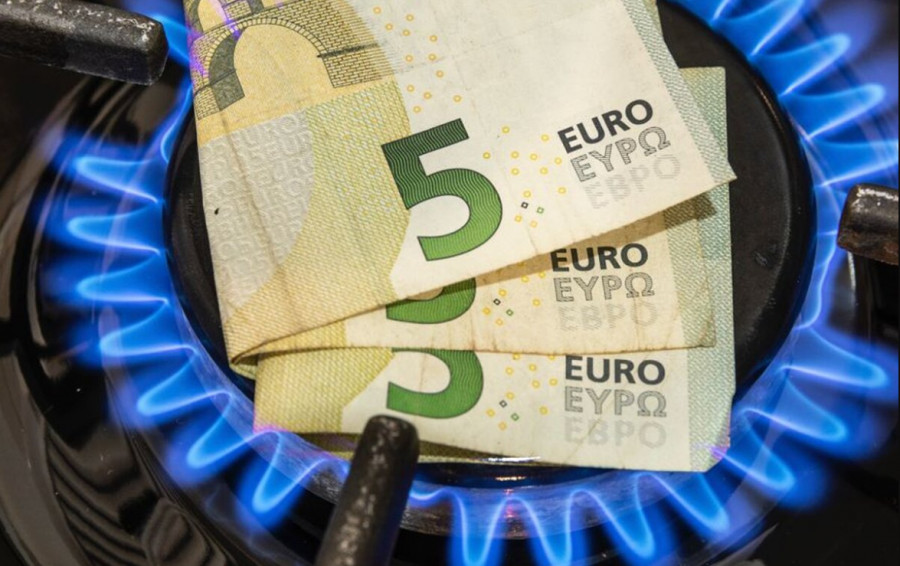
| The cost of natural gas in Europe has decreased, but the crisis does not let go Posted: 14 May 2022 10:16 PM PDT
According to the results of Friday's trading, gas prices in Europe decreased by 10% to the level of $1033.3 per thousand cubic meters. The price of June gas futures on the index of the largest European hub TTF has been falling since the opening of the trading session, since the morning the quotes were at $1118.4, 2.5% lower than the estimated price on Thursday. Yesterday, the quotes were dropping abruptly, towards the end of the trading session, the level of $1028 appeared, which turned out to be the lowest for the entire trading day. The military operation in Ukraine has become the driving force for a lightning-fast rise in gas prices in Europe. So, according to the results of February 23, the estimated price of the nearest futures was at $1038.6 per thousand cubic meters, and on February 24 it soared by almost 50%, to $1555.5. At the beginning of the first spring month, gas quotes updated record highs for four consecutive days due to the high probability of a ban on imports of Russian energy resources. The price record was reached on March 7, when the cost of natural gas at some point reached $3,892, and the final indicator of that day was the level of $2560. Later, the indicators of gas futures began to gradually decline, and on April 25, the lowest price for two months was fixed – $ 1027.1 per thousand cubic meters. After that, gas prices began to rise again and reached $1,370 per thousand cubic meters. A sharp increase in the cost of natural gas in Europe occurred against the background of Gazprom stopping energy supplies to Poland and Bulgaria on April 27. This decision of the Russian side was a response to the refusal of the leadership of these countries to comply with the new requirements of the Russian concern – to pay for natural gas in rubles. According to the new scheme, Gazprombank opens special currency and ruble accounts for settlements of foreign buyers for gas. The buyer transfers funds to the first account in the currency specified in the gas supply contract, the bank sells it on the Moscow Exchange. After that, rubles are credited to the account of the buyer of "blue fuel", and with the help of this account it will be possible to pay with the gas supplier – Gazprom. Stopping gas supplies from Russia turned Bulgaria into the fact that the local commission for the regulation of energy and water resources set a fairly high price for natural gas in May – all 13.73% higher than the previous cost. In addition, to date, information has been received from Gazprom's official representative Sergey Kupriyanov that the transit of Russian gas through the Sukhanovka gas measuring station (passes about a third of the gas transit through Ukraine to Europe) is no longer being carried out. At the same time, the company continues to supply gas through Ukraine in the volume confirmed by the Ukrainian side to the Sudzha gas measuring station. Kupriyanov told reporters that the stop of gas supply through Sokhranovka is due to the fact that the application for the entry of Russian gas was rejected. Trying to avoid difficulties in the energy sector, Moldova seeks to establish cooperation in the energy sector with Italy. Deputy Prime Minister of Moldova Nicolae Popescu wrote about this in his Telegram channel. He also noted that at a bilateral meeting with the Minister of Foreign Affairs and International Cooperation of Italy, Luigi di Maio, the possibilities of cooperation between the two European countries in the field of energy were discussed. Popescu stressed that the experience of Italy in developing initiatives that could strengthen the sustainability of his country is extremely important for Moldova. Austria is also looking for ways to resolve the difficulties that arise after the rejection of Russian blue fuel. The day before it was announced that the Austrian side intends to confiscate the largest gas storage facility in Salzburg from Gazprom. The Chancellor of the country threatened the leadership of the Russian concern that he would transfer the storage to other suppliers if Gazprom did not fill it with raw materials. Recall that back in March, the European Commission made sure that by November 1, 2022, gas storage facilities were at least 80% full. Operators lagging behind the specified plan under the new rules will not be able to pass certification and will lose ownership and even control over this infrastructure. The Austrian Chancellor said that as of today, storage facilities throughout Europe are being filled with might and main, but Gazprom's Haidach storage facility in Salzburg remains empty. Due to the uncertainty in the energy sphere in the period from April to May, the eurobloc countries this year began to increase gas reserves in their countries much more actively. Today, gas storage facilities in Europe are already 38% full, which is 16.72% more than in the same period last year. And Austria is still an outsider in this race, its result is only 22.99% occupancy. And it is "Heidach" that brings the Austrians, the capacity of this storage is approximately 30% of the total volume of all Austrian reserves. Therefore, the chancellor's anxiety is understandable, it remains only to wait for an official response from Gazprom. The material has been provided by InstaForex Company - www.instaforex.com |
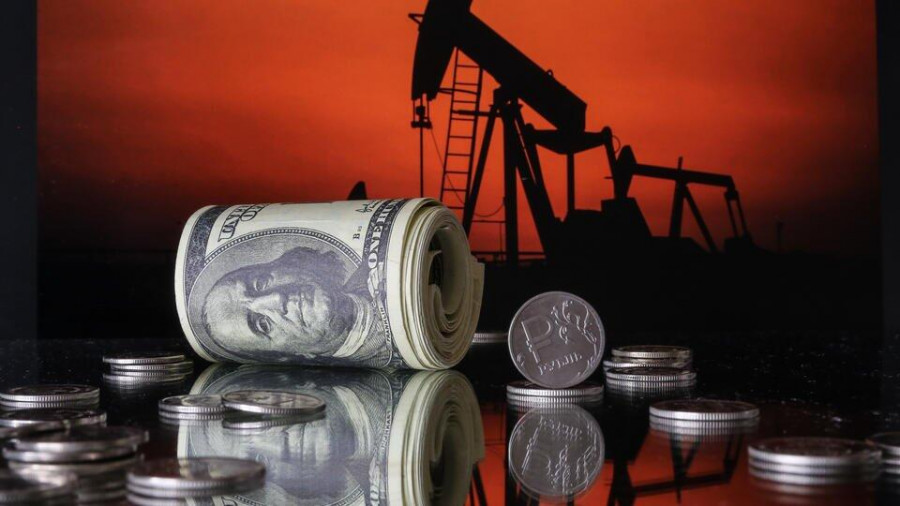
| The oil market and the pernicious US rate hike Posted: 14 May 2022 06:25 AM PDT
Oil rose in price on Friday, but ended the trading week in the red. The main catalysts for the movement of quotes are two multidirectional forces. Firstly, there is a high probability of the introduction by Western European countries of a full-scale embargo on Russian oil and the resulting concerns of traders about the supply of oil on the world market. This factor gives a great potential for an increase in oil prices in the light of the ongoing military conflict on the territory of Ukraine. Secondly, the prices of oil still cannot soar into space yet, since the largest consumer of oil today has serious problems with demand. China is experiencing high inflation and a strong slowdown in economic activity due to a new outbreak of coronavirus and severe restrictions. So, July futures for Brent crude oil on the London ICE Futures exchange by the time of preparation of the material rose by 2.80% on Friday, to the level of $110.46 per barrel. The price of the June WTI oil futures on the New York Mercantile Exchange rose by 2.90% by this time, reaching $109.21 per barrel. However, since the beginning of the week ended on May 13, Brent benchmark oil has lost 2.7% in price, and WTI oil has lost about 1%. Currently, the European Union is coordinating the sixth package of sanctions against Russia, which is primarily aimed at the phased introduction of an embargo on the import of Russian oil. In this regard, the International Energy Agency (IEA) reported that the decline in oil supplies from Russia to global shelves in the second half of 2022 will reach 3 million barrels of energy per day. According to the IEA, Russia's reduction in oil production in April by almost 1 million barrels per day led to a decrease in global supplies by 710,000 barrels, as a result, 98.1 million barrels entered the world market. Given these figures, it is not difficult to conclude that the planned embargo on the supply of Russian oil by the EU countries will definitely completely violate and necessarily shift global trade flows. This will cause a real panic in the market and extreme price volatility. As for the United States, it is not only high inflation, unprecedented for Americans over the past 40 years, that is putting a lot of pressure on consumers there. The US central bank is more determined than ever to implement a sharp increase in interest rates, because it sees no other ways to restore control over raging inflation. Analysts' comments are increasingly being heard that the tightening of the Fed's policy risks ultimately severely crippling the American economy. The Fed approved a rate increase of 25 basis points in March and 50 basis points in May. The market is confident that in June the central bank will raise rates by 75 basis points. However, in an interview published on Thursday, Fed Chairman Jerome Powell denied the likelihood of such an impressive rate change in the first summer month. Powell added that a 50 basis point increase in the next two meetings would be the most preferable solution. At the same time, he said that the drawdown of the American economy in the light of the rate hike will happen and it will depend not only on the central bank. In 2020, due to the coronavirus pandemic, US GDP fell by 3.5%, and in 2021 it could grow by 5.7%. The problem is that inflation is growing just as rapidly, if not even faster. The index of personal consumption expenditures rose by 5.8% in December compared to the same period last year. In March, this inflation indicator increased by 6.6% in annual terms. Both of these indicators indicate the highest rates of inflation since the 1980s. As for the consumer price index and the producer price index, they increased in April by 8.3% and 11%, respectively. The maximum allowable inflation rate for the US central bank is only 2%. Powell hinted that it is planned to raise the rate seven times this year. In 2023, it is possible that the rate adjustment will continue until the inflation rate returns to the target level of 2%. The policy promoted by the central bank will bring down considerable difficulties on consumers in the coming months. A couple of days ago, gasoline prices at gas stations in some regions of the United States were able to reach highs of $4.50 per gallon, and diesel prices jumped to above $6. The cost of diesel is the real economy. If its prices are above $6 per gallon, then they reduce part of the companies' profits. It is possible that a large-scale destruction of demand for diesel is coming. For example, there are already noticeably fewer Amazon trucks on the roads. At the same time, credit card costs have increased significantly, which indicates a sharp reduction in cash from consumers. Everything is also not rosy in China. Due to the coronavirus, the risks of introducing the same long-term hard lockdown in Beijing as in Shanghai are increasing. The world's largest oil-importing country reports depressing demand figures: for the period from January to April, imports of oil to China decreased by 4.8% (compared to the same period last year). However, it is worth admitting that in April alone, this indicator managed to grow by almost 7%. The material has been provided by InstaForex Company - www.instaforex.com |
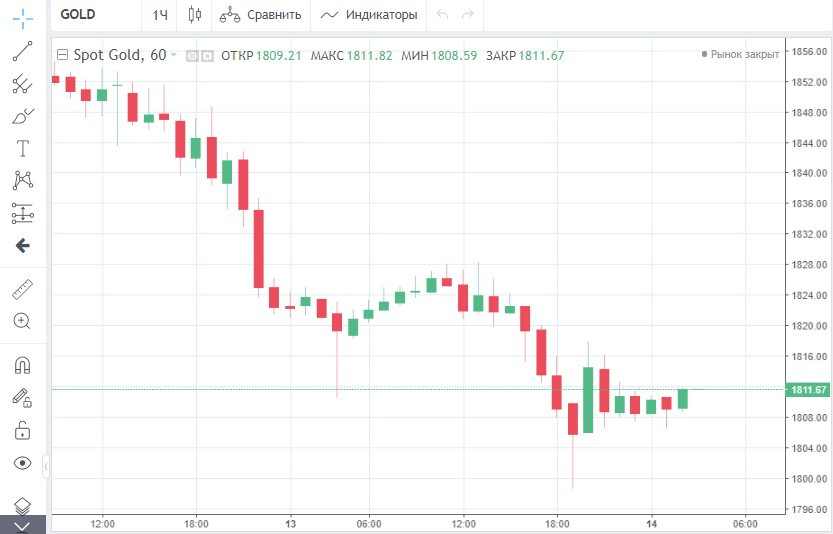
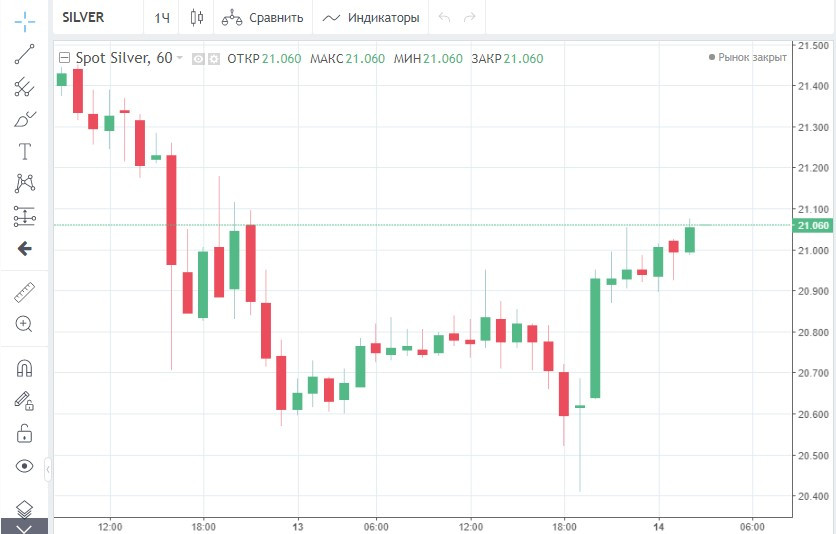
| What will happen to gold: a gloomy forecast for next week Posted: 14 May 2022 06:25 AM PDT
This has not happened since the beginning of February. Gold is trading dangerously close to the key mark of $1,800. And, judging by the growing demand for the dollar, bullion will maintain a downward trend in the near future. On Friday, the yellow asset continued the steep descent that started a day earlier. June futures fell by almost 1%, or $16.40, and closed the session at the lowest level since February 4 at $1,808.20.
At the end of the week, gold also showed a negative trend. Since Monday, the quotes have fallen by 3.9%, which was their worst weekly result in 11 months. Meanwhile, silver also reported serious losses for the seven-day period. The asset sank by more than 6% within five working days.
The pressure on the precious metals market was exerted by a strongly strengthened dollar. Following the results of the outgoing week, the US currency index rose by 0.9% against its main competitors. Despite Friday's decline, the greenback has firmly settled at the 20-year peak. Now the hawkish course of the Federal Reserve provides significant support to it. To calm the raging inflation, the US central bank has already raised interest rates twice this year. Moreover, the latest increase was the sharpest since 2000. Last week, the Fed increased the indicator by half a percentage point. The markets expect the same changes at the next two FOMC meetings: in June and July. However, there is an opinion that the central bank may raise rates even more sharply if inflation does not stop or slow down significantly in the coming months. The latest statistics on inflation in America showed that the consumer price index in April exceeded economists' expectations. Last month, the indicator reached 8.3% against the projected 8.1%. This indicates that the cost of living in the US is still very high and inflation has not yet peaked. It seems that the Fed will really have to act more aggressively to reduce the rate of price growth. This prospect contributes to the steady rise of the dollar. In addition, the greenback receives a strong growth momentum from anti-risk sentiment. This week, global stock markets were gripped by panic about the global recession. Investors are afraid that geopolitical tensions (the military conflict between Russia and Ukraine), as well as the maintenance of quarantine in China, will disrupt supply chains, which will lead to a slowdown in global economic growth. It would seem that the collapse of stocks against the background of an increased risk of recession should push gold up, but this rule does not work now. The dollar's appeal as a protective asset outweighs all the advantages of owning gold in a crisis. At this stage, most investors prefer the US dollar and actively sell the precious metal. Under the pressure of bears, gold prices fell below the 200-day smooth moving average this week, which indicates a strong downward trend for the instrument. The current movement of quotes near the $1,800 level exposes gold to a serious risk of a larger sell-off. If prices break through this key mark in the coming days, the bullion losses will be even more significant. The most gloomy forecast for next week is the price of $1,775 per ounce. There is also an optimistic scenario in which an overly oversold gold market can make a reverse rebound to $1,865, and then to $1,900. The precious metal risks to suffer greatly if the estimates of a more aggressive Fed rate hike. And continued volatility in all markets can support bullion in the short term. The material has been provided by InstaForex Company - www.instaforex.com |
| GBP/USD outlook on May 13. British pound is weak to recover Posted: 14 May 2022 02:55 AM PDT
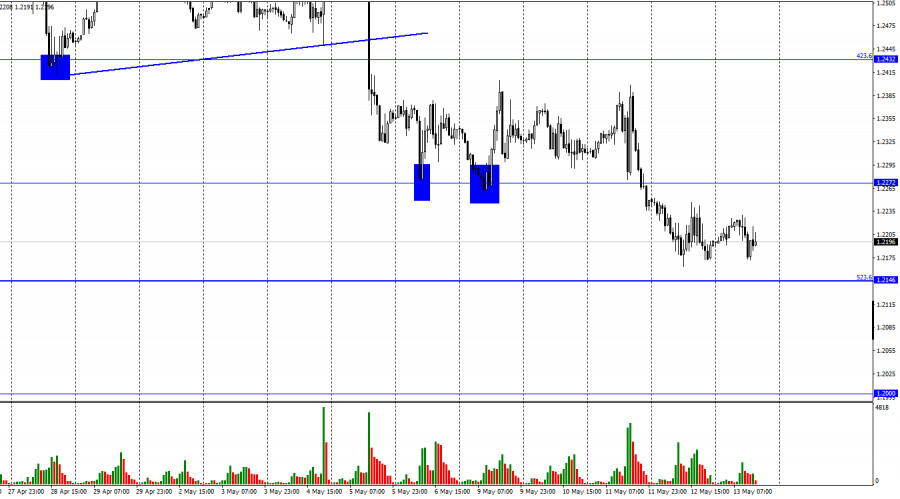
Hello, dear traders! On the hourly chart, the GBP/USD pair continued to decline on Thursday after it consolidated below the level of 1.2272 the day before. During Friday, the pair tried to rise. However, by the end of the day it had almost reached the correction level of 523.6% at 1.2146 again. Currently, it is difficult for the pound to find the level to start growing. Bear traders seize every chance to open new sales. Moreover, they ignore the positive news for the pound. The most shocking fact is that traders are passive regarding the Bank of England's monetary policy and unwilling to pay attention to statistics. Let's go into details. The Bank of England raised the interest rate four times up to 1%. The Fed raised the rate twice and also increased it up to 1%. The current situation seems to be identical, and the near future is uncertain. However, traders were selling off the pound when they heard about the British central bank's fourth rate hike. Besides, at the same time they were buying the dollar as the Fed raised the interest rate. There is no logic in their actions. Let's continue our analysis. The British GDP report was weak in the first quarter with the index of 0.8%, though traders were expecting it to be 1.0%. Notably, US GDP fell by 1.4% in the first quarter. That is, logic suggests that the pound should have grown slightly which can be seen on the chart. On the contrary, it keeps dropping. The pound has fallen nearly by 1100 points since March 23. Moreover, the largest bullish candlestick was 110 points. There are no two bullish candlesticks in a row on the daily chart during this period. That is, traders do not buy the pound at all. However, as analyzed above, sterling had at least two legitimate reasons for rising. Therefore, I draw the conclusion that the bull traders are waiting for the bears to maximize profits and start to leave the market. Then the new bullish trend is likely to start. Besides, it can result in the British pound's substantial rise. In this case, traders will ignore bearish factors for the British pound.
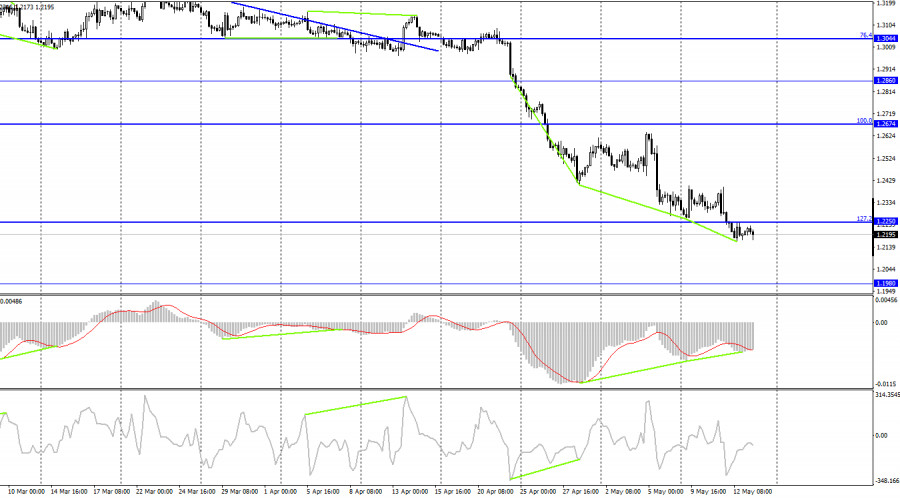
On the 4-hour chart, the GBP/USD pair has consolidated below the correction level of 127.2% at 1.2250. Therefore, the decline may continue towards the next level of 1.1980. At the same time, formation of a new bullish divergence in the MACD indicator may lead to the pair's slight growth. However, the previous bullish divergence resulted in the British pound's rise of 130 pips. Moreover, the pair should consolidate at least above 1.2250 to start growing. COT report:
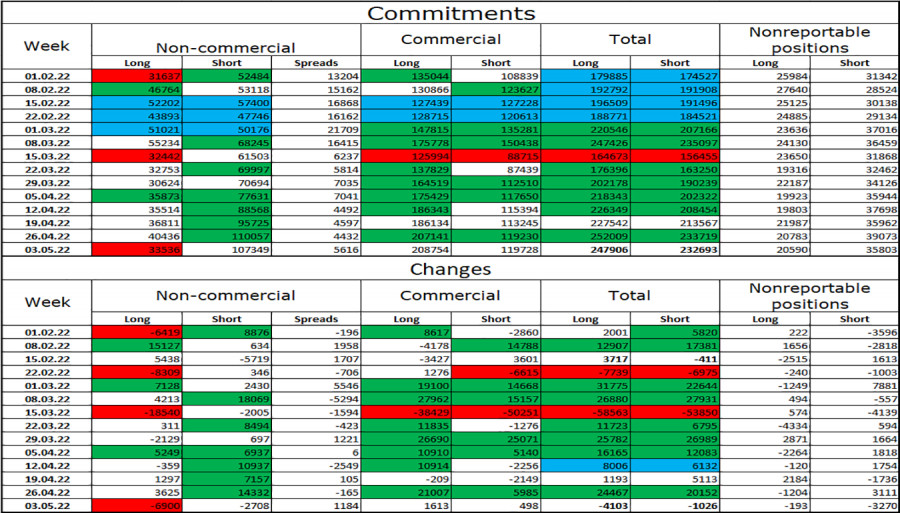
The sentiment of the non-commercial traders has changed dramatically again over the past week. The number of long contracts held by speculators fell by 6,900 units, while the number of short contracts decreased by 2,708 units. Thus, the general sentiment of major players became even more bearish. The ratio between the number of long and short contracts held by speculators corresponds to the current market situation. There are 3 times more contracts for longs than shorts (10,7349 against 3,536). The major players continue to sell off the British pound. Therefore, I expect that the pound might continue falling during the next weeks. Moreover, such a large gap between the number of long and short contracts may indicate the rapid change in the market trend. The British pound could end its long decline this week. US and UK economic news calendar: US - University of Michigan Consumer Sentiment Index (2 pm UTC). On Friday, the aggregate report was released in the UK and US. It was not a key report. Therefore, the news background will not influence traders' sentiment significantly during the day. GBP/USD outlook and recommendations for traders: I recommended selling the pound with a target of 1.2146 at a close below the level of 1.2272. Currently, these trades can be held. New sales are possible at a close below 1.2146 with a target of 1.2000. I do not recommend buying the pound now as the downtrend has resumed. The material has been provided by InstaForex Company - www.instaforex.com |
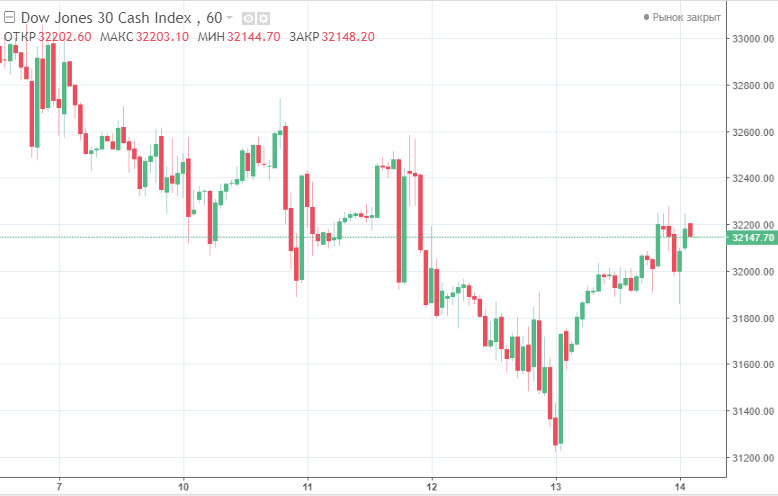
| US stocks soared sharply on Friday, but once again ended the week in the red Posted: 14 May 2022 01:20 AM PDT US stock indicators reported a steady growth at the close of trading on Friday. The best results were shown by the securities of the technological, oil and gas, as well as consumer services sectors. As a result, the Dow Jones Industrial Average gained 1.47%, the Standard & Poor's 500 gained 2.39% and the NASDAQ Composite gained 3.82%.
Despite Friday's strong results, all three leading US stock market indexes closed the outgoing week with spectacular declines. Thus, the DJIA index shows a decline for the seventh consecutive week, and the S&P 500 and NASDAQ Composite - the sixth. At the same time, the S&P 500 index has not recorded such a long series of declines for more than a decade. And if experts from Deutsche Bank, Germany's largest financial conglomerate, explain the April drop in US stock market indicators by investors' expectations of tightening the monetary policy of the US Federal Reserve and a drop in the price rate of government bonds, then analysts call market concerns about the prospects for global economic growth the main reason for the negative May dynamics. Rising and Falling Leaders The main favorites among the components of Dow Jones on the eve were the securities of Nike Inc (+4.74%), Salesforce.com Inc (+4.05%) and American Express Company (+3.58%). The leading outsiders here were Johnson & Johnson (-0.57%), Amgen Inc (-0.54%) and Merck & Company Inc (-0.46%).
Las Vegas Sands Corp (+15.06%), Wynn Resorts Limited (+13.17%) and Enphase Energy Inc (+11.96%) led the list of growth among the S&P 500 components following the results of trading on Friday. The leaders of the decline here were shares of Twitter Inc (-9.67%), DaVita HealthCare Partners Inc (-2.91%) and WestRock Co (-2.63%). ShiftPixy Inc (+154.87%), Polarityte Inc (+44.51%) and Veru Inc (+43.96%) showed the best results among the NASDAQ Composite components. Shares of LiqTech International Inc (-45.36%), Brilliant Earth Group Inc (-33.63%) and Tenon Medical Inc (-26.41%) topped the drop list here. As a result, on the NYSE stock exchange, the number of securities that increased in price (2604) exceeded the number of those that fell in price (640). At the same time, the indicators of 95 shares remained unchanged. On the NASDAQ stock exchange, quotes of 2,983 companies rose, 942 declined, and 169 closed at the level of the previous session. The CBOE Volatility Index, formed on the basis of options trading indicators on the S&P 500, decreased by 9.13% to 28.87 points.Factors influencing the market The focus of attention of stock market participants on Friday was the recent statements by Fed Chairman Jerome Powell regarding the further steps of the central bank to increase the base interest rate. On Thursday, Powell said that the central bank plans to act categorically to return the inflation rate in America to the two percent target. The Fed's decision, Powell said, will not be influenced even by the prospects of a decline in the country's economy in the short term. Anticipating investors' concerns about the Fed's succeeding decisions, Powell stressed that the central bank is not actively discussing raising the interest rate by 75 basis points at once. Recall that following the meeting last week, the Fed raised the key rate by 50 basis points, now its range is 0.75–1% per annum. Earlier in March, the US central bank raised the rate by 25 basis points. The last time the central bank raised the rate following the results of two consecutive meetings was back in 2006. At the same time, there has not been an increase in the indicator by 50 basis points at the same time since 2000. On Friday, it also became known that in the past month, the price indicator for goods and services imported into the United States soared by 12% in annual terms, while in monthly terms the indicator remained at the same level.The export price index rose in April by 0.6% compared to March and by 18% year-on-year. The material has been provided by InstaForex Company - www.instaforex.com |
| EUR/USD: How far can the dollar go? Posted: 14 May 2022 01:20 AM PDT
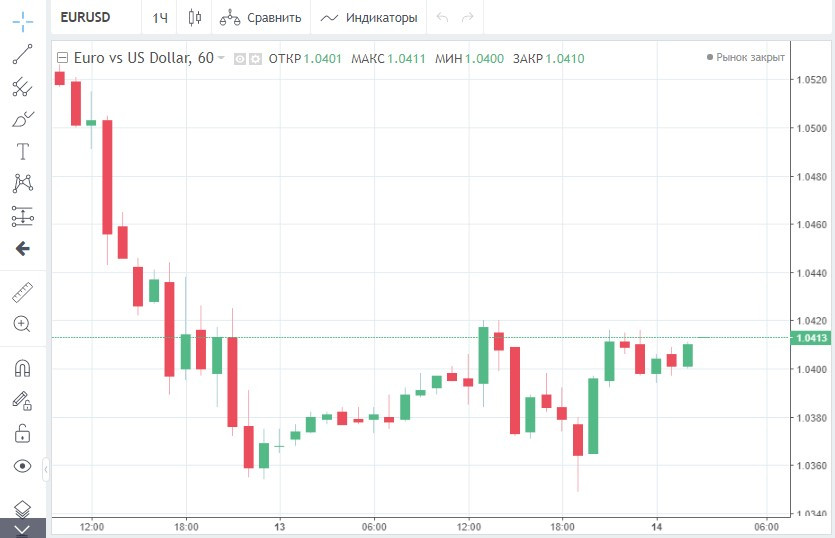
At the end of the week, the dollar again showed an advantage against the European currency. The EUR/USD pair looks extremely oversold right now, but there is still room to fall. This week, the dollar exchange rate reached a new 20-year peak – the level of 105.01. The last time the US currency traded at this level was back in December 2002. Anti-risk sentiment served as a springboard for the greenback. Concerns about a slowdown in global economic growth have been exacerbated by the crisis in Ukraine and the ongoing lockdown in China. This pushed investors to a big stock sell-off. In the past week, world stock indexes have shown an alarming drop, and the demand for a protective dollar has jumped sharply. Despite the fact that the dollar index fell slightly (by 0.143%, to 104.610) on Friday, the greenback ended the week with an increase.The dollar has already demonstrated its sixth weekly consecutive gain. This is its longest rally this year. Since January, the US currency has risen by 9%. The dollar's steady growth is facilitated by the tightening of the Federal Reserve's policy. Now the US central bank is several steps ahead of its main colleagues, who also decided to follow a hawkish path in order to reduce high inflationary pressure. While the Fed has already raised interest rates twice this year, the European Central Bank, at best, will start increasing the indicator only in July. Moreover, it is expected that the ECB will act at a less aggressive pace than the US central bank. Recall that last week, for the first time since 2000, the Fed raised interest rates by 50 bps at once. The Fed's determination is a key driver of the dollar's growth against the euro this year. This week, the EU monetary unit fell to 1.0348 against the greenback, the lowest level since January 3, 2017. On Friday, the EUR/USD pair managed to achieve a modest increase, as the dollar capitulated amid investors' return to risk. The euro rose 0.18% to 1.0398.
Nevertheless, at the end of the seven-day period, the single currency sank again, showing the fifth consecutive weekly decline. The EUR/USD pair looks very oversold right now, so a corrective decline in the dollar in the near future will be absolutely logical. However, both fundamental factors and the technical picture indicate a further strengthening of the US currency. Interest in highly profitable and volatile assets, such as stocks and cryptocurrencies, is noticeably fading, and the demand for a stable and reliable dollar is growing. Currently, the reluctance to take risks is reinforced by the growing tension in relations between Russia and Western countries. This week Finland announced that it was abandoning its neutral position and applied to join NATO. Its neighbor Sweden is preparing to take a similar step. If these Scandinavian countries join the alliance, the Kremlin has threatened to take retaliatory measures. Dmitry Medvedev, Deputy Prime Minister of the Russian Federation, warned about the risk of a direct conflict between Russia and NATO last week. Further pumping of weapons by Western countries of Ukraine may lead to an escalation of the confrontation. In addition to geopolitics, the dollar also receives support from macroeconomics. Despite the slowdown in annual price growth in April, Cleveland Fed President Loretta Mister said that inflation in the United States has not yet peaked. According to the official, if the data does not show improvement in the next few months, the Fed should be ready to consider a sharper rate hike in September. As for the technical indicators, they reflect a strong bearish momentum for the EUR/USD pair. It will continue to decline in the coming weeks. The daily chart shows that the pair is moving well below the firmly bearish moving averages. The nearest support level for it is 1.0339 (the lowest value since January 2017). The EUR/USD pair bottomed out at 1.0334 in January 2003. A break below this level can quickly bring it closer to 1.0200, which will increase speculation about parity. The material has been provided by InstaForex Company - www.instaforex.com |
| Key exchanges in Europe close the week in a confident positive Posted: 14 May 2022 01:20 AM PDT From the very morning on Friday, European stock indexes began trading with spectacular growth after a loud fall a day earlier. At one point, the aggregate indicator of the leading companies in Europe, the STOXX Europe 600, increased by 1.09% to 429.03 points. By the way, since the beginning of this year, the index has already lost about 14%. The securities of the Finnish energy concern Fortum Oyj (+10.1%) showed the highest results among the components of the STOXX Europe 600 on Friday. At the same time, the leading outsiders were the shares of the Belgian pharmaceutical company UCB S.A. (-12%).
The British FTSE 100 indicator grew by 2.04%, the French CAC 40 gained 1.19%, the German DAX rose by 1.06%, and the Italian FTSE MIB and the Spanish IBEX 35 strengthened by 0.94% and 1.09%, respectively. On Friday, the value of securities of the largest telecommunications company in Europe – Deutsche Telekom AG – increased by 0.7%. The main incentive for the rise in quotes was the financial statements of Deutsche Telekom AG published the day before: in the first quarter of the current financial year, the company's net profit more than quadrupled. The capitalization of the British outsourcing company Sage Group PLC is strengthening by 2.6%. According to the results of the first half of fiscal year 2022, the company reduced its pre-tax profit due to additional investments to accelerate growth. In addition, according to the results of the reporting period, Sage Group's organic operating profit exceeded preliminary market forecasts. The stock quotes of the Italian infrastructure company Atlantia SpA gained 0.4% of the value by the time of writing the material. In the first quarter of 2022, the company reported an increase in revenue and confirmed the forecast for the current year. As for the key reasons for the loud fall in the European stock market the day before, the main downward factor for its indices was investors' lingering concerns about a slowdown in global economic growth, further decisive steps by the US Federal Reserve and permanently rising inflation in America. Fed Chairman Jerome Powell said that the central bank plans to act categorically to return the inflation rate to the two percent target. The Fed's decision, Powell said, will not be influenced even by the prospects of a decline in the country's economy in the short term. Recall that following last week's meeting, the Fed raised the key rate by 50 basis points, now its range is 0.75–1% per annum. Earlier in March, the US central bank raised the rate by 25 basis points. The last time the central bank raised the rate following the results of two consecutive meetings was back in 2006. At the same time, there has not been an increase in the indicator by 50 basis points at the same time since 2000. An additional factor of pressure on the European stock market on Thursday was also the internal statistics for the region. Thus, according to the report of the National Statistical Office Insee, last month consumer prices in France increased by 5.4% in annual terms, which was the high since the beginning of the calculation of this indicator. The material has been provided by InstaForex Company - www.instaforex.com |
| Posted: 14 May 2022 01:20 AM PDT The value of bitcoin steadily grew at the auction on Friday, since the start of trading, the coin has already jumped by 8%, having won back serious losses of the previous day. On Thursday, the price of BTC collapsed to the lows of December 2020. The rate of the first cryptocurrency even dropped by more than 10% – to $25,400, but almost immediately after that it began to grow. As a result, the first cryptocurrency added 0.6% in price and closed the day at $28,600. By the way, since November last year, when bitcoin updated the historical record, soaring above $69,000, the cryptocurrency has already lost more than 55% in price.
A frightening roller coaster happened on Thursday with the quotes of the main competitor of the BTC – the Ethereum altcoin – which dropped sharply to $1,700, but later returned to the usual level above $2,000, ending trading with a 5.4% increase to $2,100. At the same time, the leading altcoins from the top ten by capitalization showed mixed dynamics: over the past day, the Cardano cryptocurrency lost 6%, and the XRP coin increased by 3.4%. Reasons for positive BTC Analysts call the long-awaited correction after a prolonged fall throughout the current week the main incentive for Friday's sharp rise in bitcoin. So, since Monday, the value of bitcoin has already fallen by more than 14% and has at one point balanced at $30,213.As proof of the high correlation of the value of cryptocurrencies and stocks, the April trading results of the flagships of both markets can be cited. So, in the past month, the high-tech NASDAQ Composite indicator lost more than 12%, which was the highest level of decline since 2008. At the same time, the value of bitcoin sank by 16.2% in April – the lowest indicator of this month since 2011. Earlier, the experts of the investment company Arcane Research have already stated that the correlation of BTC and technology securities has peaked since July 2020. May statistics Since the beginning of May, the value of the first cryptocurrency has decreased by almost 20%. If the main crypto asset maintains similar dynamics, then the final indicators of the current month may be the worst since last May, when the value of the BTC collapsed by 35%. Traditionally, the last month of spring is considered a good enough period for bitcoin. So, over the past 11 years, bitcoin has completed this month with an increase in seven cases and a fall in only four. The average May rise is about 27%, and the decline is 6%. If this May the first cryptocurrency decides to repeat the approximate dynamics of the past years, it may grow to $48,000 in a month or collapse to $32,000. Experts consider the rebound of the leading US stock indicators to be another important upward factor for the cryptocurrency market today. So, on the eve of the high-tech NASDAQ Composite stock index ended trading with a slight increase (+0.06%). At the same time, throughout the current week, this stock indicator showed a confident negative. By the way, analysts have increasingly begun to emphasize the high level of correlation between the securities market and virtual assets against the background of intense expectation by both markets of the consequences of the geopolitical conflict in eastern Europe and the next steps of the US Federal Reserve. Not a single Bitcoin Despite the spectacular roller coaster of the first cryptocurrency, in the outgoing week, all the attention of investors in the digital asset market is focused on the movement of stablecoins tied to the US dollar. In particular, to the Terra ecosystem. So, on Tuesday, TerraUSD (UST) quotes fell below $0.30, and on Wednesday the value of the Terra token itself dropped sharply by 97%. After the loud fall of TerraUSD, the operator put the blockchain on pause for several hours, and the assets of users were temporarily frozen. Against the background of such unexpected turbulence in the market, the value of UST and many other algorithmic stablecoins has lost parity against the US dollar. Later, the collapse of the Terra ecosystem was blamed on the large investment company BlackRock and the Citadel hedge fund. However, BlackRock management called the information that appeared in the media about the company's involvement in the conflict with UST rumors and stressed that it does not trade stablecoins, including UST. The head of the Singapore cryptocurrency company Terraform Labs, Do Kwon, proposed a plan to restore the UST stablecoin to its previous heights. However, in response to the rescue operation, the value of the Terra asset collapsed below $1, and the price of the UST stablecoin tested the $0.94 mark. The material has been provided by InstaForex Company - www.instaforex.com |


| You are subscribed to email updates from Forex analysis review. To stop receiving these emails, you may unsubscribe now. | Email delivery powered by Google |
| Google, 1600 Amphitheatre Parkway, Mountain View, CA 94043, United States | |


Comments