Forex analysis review
Forex analysis review |
- EUR/USD analysis for May 06, 2022 - Potential downside continuation
- Analysis of Gold for May 06,.2022 - Watch for potential breakout of channel
- BTC update for May 06,.2022 - First downside objective reached, potential for next at $32.850
- Technical analysis of GBP/USD for May 06, 2022
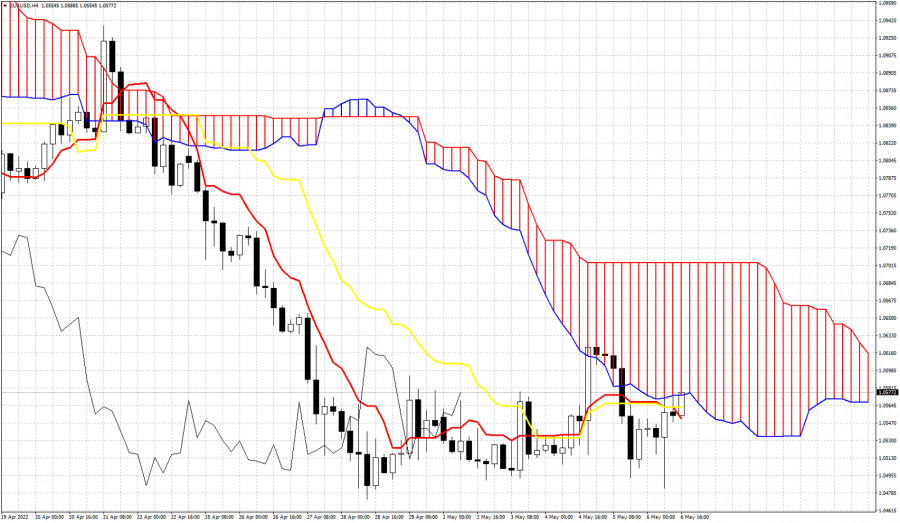
- Technical analysis of EUR/USD for May 06, 2022
- Ichimoku cloud indicator analysis on EURUSD, for May 6, 2022.
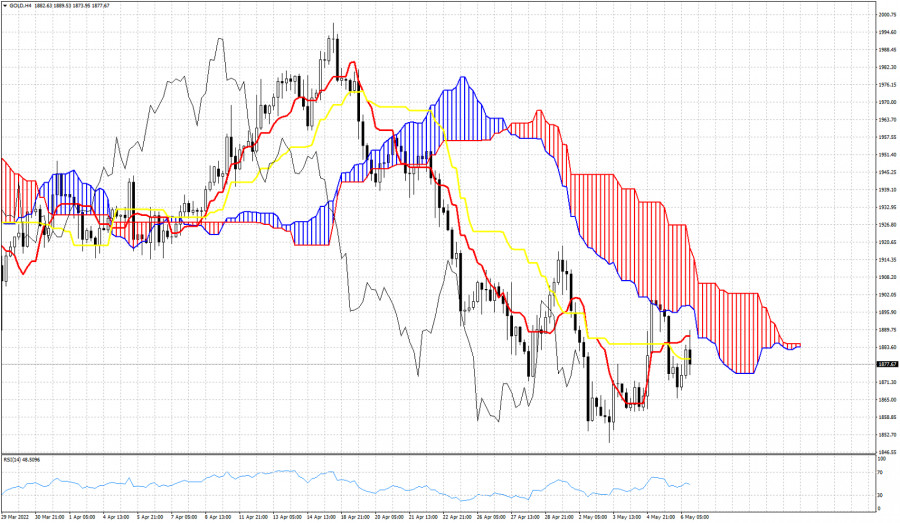
- Ichimoku cloud indicator analysis on Gold for May 6, 2022.
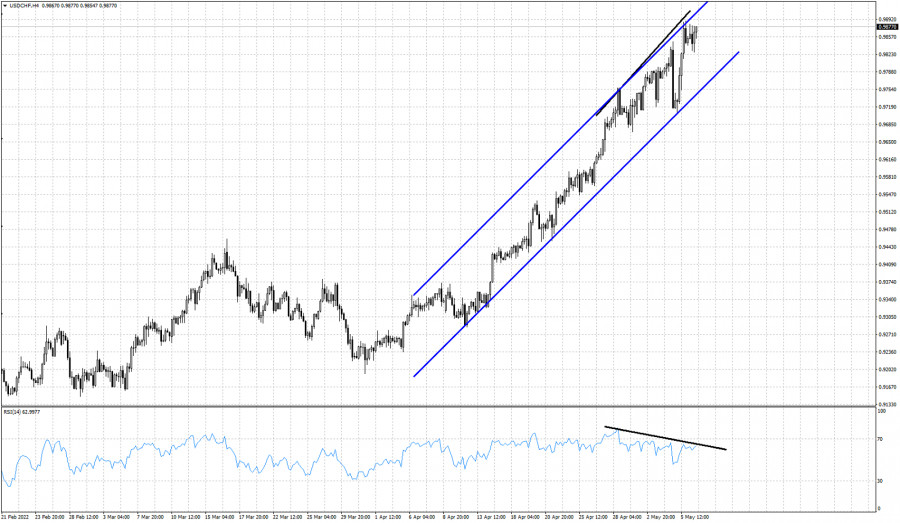
- Short-term pull back justified in USDCHF.
- Ichimoku cloud indicator analysis on Ethereum.
- GBP/USD: plan for the US session on May 6 (analysis of morning deals). Pound sellers take profit ahead of Non-Farm Employment
- EUR/USD: plan for the US session on May 6 (analysis of morning deals). The euro was again bought off from annual lows
- Crypto market drops sharply at end of week
- BTCUSD: Bearish dominance may end soon
- Technical review for USD/CAD: price could fall again
- Technical review for AUD/USD: price may bounce up
- Trading tips for EUR/USD
- Trading tips for gold
- US employment data can affect the markets
- US stock crash drags European indices down
- Trading plan for Ripple on May 06, 2022
- USD/CAD Technical Analysis and Trading Tips on May 6, 2022
- Video market update for May 06,,2022
- Trading plan for Ethereum for May 6, 2022
- Daily Video Analysis: Crude Oil, H4 Bullish Buying Opportunity
- Trading plan for Bitcoin for May 06, 2022
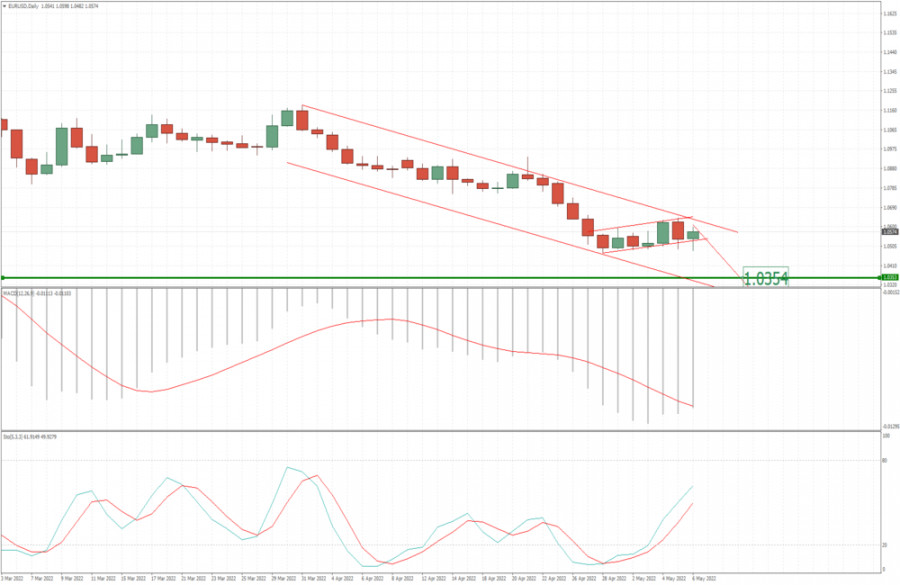
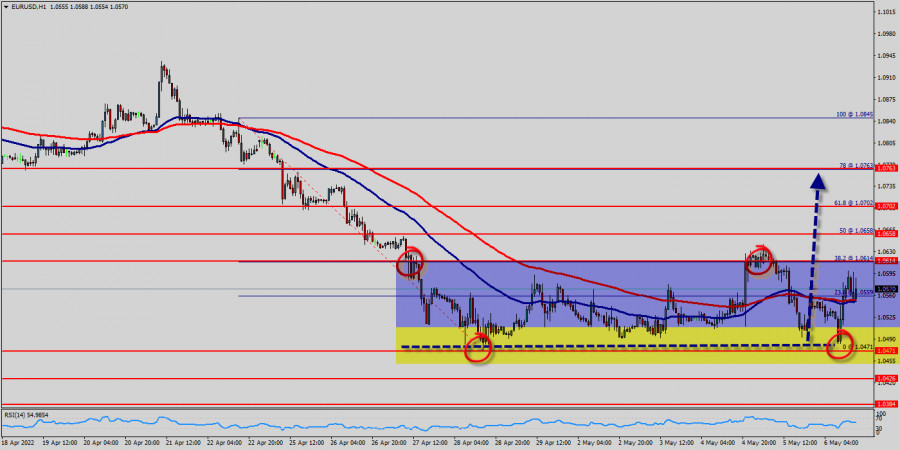
| EUR/USD analysis for May 06, 2022 - Potential downside continuation Posted: 06 May 2022 10:10 AM PDT Technical analysis:
EUR/USD has been trading sideways at the price of 1.0570 but I see potential for the downside continuation of the trend. Trading recommendation: Due to the potential bear flag in the background and downside trend, I see potential for further downside movement. Watch for potential selling opportunities in case of the downside breakout of channel Downside objective is set at 1.0350 MACD oscillator is showing negative reading, which is sign for further downside movement. Resistance is set at the price of 1.0640 The material has been provided by InstaForex Company - www.instaforex.com |
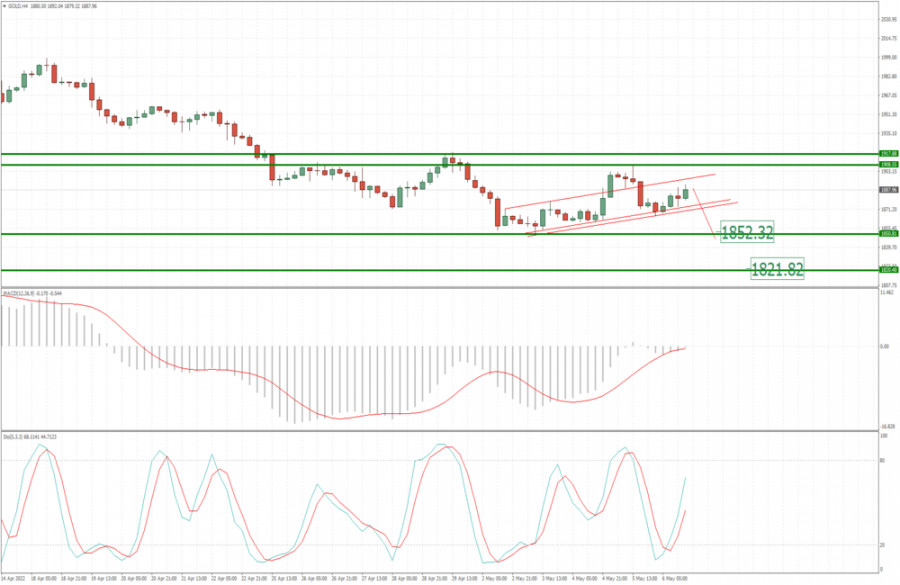
| Analysis of Gold for May 06,.2022 - Watch for potential breakout of channel Posted: 06 May 2022 09:59 AM PDT Technical analysis:
Gold has been trading sideways at the price of $1.887 and I see potential for the downside breakout. Trading recommendation: Due to the potential bear flag in the background and downside trend, I see potential for further downside movement. Watch for potential selling opportunities in case of the downside breakout of channel at $1.865. Downside objectives are set at $1.850 and $1.821. MACD oscillator is showing negative reading, which is sign for further downside movement. The material has been provided by InstaForex Company - www.instaforex.com |
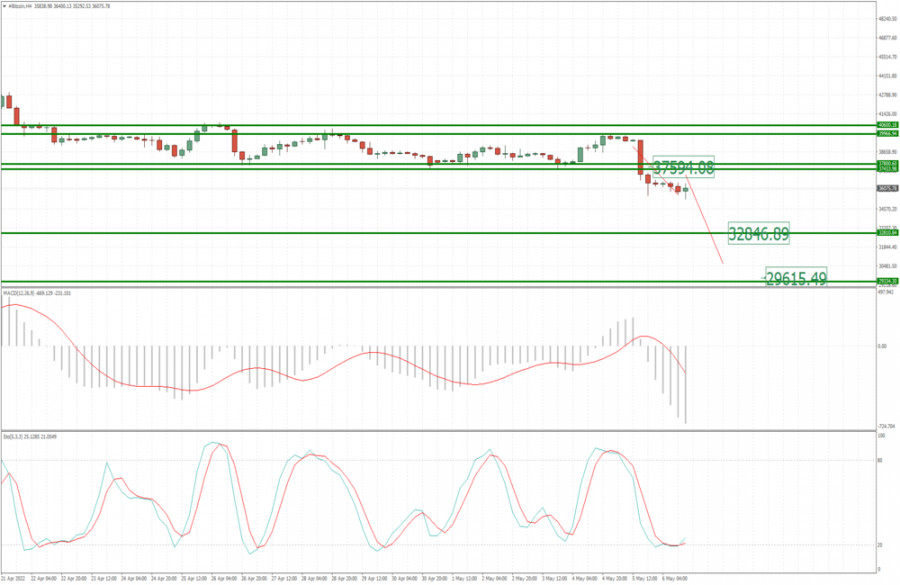
| BTC update for May 06,.2022 - First downside objective reached, potential for next at $32.850 Posted: 06 May 2022 09:54 AM PDT Technical analysis:
BTC has been trading downside as I expected. The price reached our first downside target at the $37.595. There is the downside breakout of consolidation and potential for further drop. Trading recommendation: Due to the breakout of the horizontal consolidation, I see potential for further downside continuation. Watch for potential selling opportunities on the intraday rallies with the downside objectives at $32.850 and $29.650. MACD oscillator is showing strong downside momentum, which is another confirmation that sellers are in control. Key resistance is set at the price of $40.000 The material has been provided by InstaForex Company - www.instaforex.com |
| Technical analysis of GBP/USD for May 06, 2022 Posted: 06 May 2022 07:12 AM PDT
Overview : The GBP/USD pair continues to move in a downtrend from the level of 1.2415 since yesterday. It should bear in mind that resistance has set at 1.2415. The GBP/USD pair has not made a significant movement from yesterday. The bias remains bearish in the nearest term testing 1.2277 or lower. If the trend can break the first target at 1.2277, the market will call for a strong bearish trend towards the next target at 1.2240 on the M30 chart. So, major resistance is seen at 1.2415, while immediate support is found at 1.2277. Additionally, it should be noted that the resistance coincides with the ratio of 38.2% Fibonacci (1.2415). Today, we guess that the pair will be traded lower in the early session and try to reach the first support at the level of 1.2277. The bias is neutral in the nearest term probably with a little bearish bias testing 1.2277 area, which needs to be clearly broken to the down side to keep the bearish scenario. A clear break below that area (1.2277) could lead the price to the downtrend zone in the nearest term testing 1.2240 (S2). Thence, we confirm the bearish scenario. Right now, the pair will probably go down because a downward trend is still strong and the RSI indicator is still signaling that the trend is downward. Therefore, it is a good idea to sell below the resistance of 1.2362 with the first target at 1.2277. If the GBP/USD pair is able to break the first target, then the pair will face a strong bearish bias towards the 1.2240 level. Otherwise, the breakdown of 1.2415 will allow the pair to go further up to the levels of 1.2457 and 1.2499. The material has been provided by InstaForex Company - www.instaforex.com |
| Technical analysis of EUR/USD for May 06, 2022 Posted: 06 May 2022 06:55 AM PDT
Overview : Yesterday, the EUR/USD pair reached a new minimum at the price of 1.0471 (bottom), but it rebounded to close at 1.0571 (move up to 100 pips). The EUR/USD pair will continue to rise from the level of 1.0571 in the long term. It should be noted that the support is established at the level of 1.0471 which represents the last bearish wave on the hourly chart. The price is likely to form a double bottom in the same time frame. Accordingly, the EUR/USD pair is showing signs of strength following a breakout of the highest level of 1.0571. So, buy above the level of 1.0571 with the first target at 1.0614 in order to test the daily resistance 1 and further to 1.0658. Also, it should be noticed that the double top is set at 1.0845. Additionally, the RSI is still signaling that the trend is upward as it remains strong above the moving average (100). This suggests the pair will probably go up in coming hours. Accordingly, the market is likely to show signs of a bullish trend. Also, it might be noted that the level of 1.0845 is a good place to take profit because it will form a double top. On the other hand, in case a reversal takes place and the EUR/USD pair breaks through the support level of 1.0471, a further decline to 1.0426 can occur which would indicate a bearish market. The material has been provided by InstaForex Company - www.instaforex.com |
| Ichimoku cloud indicator analysis on EURUSD, for May 6, 2022. Posted: 06 May 2022 06:48 AM PDT EURUSD is trading around 1.0570. Price moved as low as 1.0483 challenging the support levels we mentioned yesterday. So far price respects the key support area around 1.0480-1.0490. Cloud resistance is found at 1.0575 and bulls must surpass this level if they want to take control of short-term trend.
EURUSD is trying to re-enter the Kumo. This would turn trend to neutral. Price confirmed the key support at 1.0490 area by testing it and bouncing higher. Currently price is trading above both the tenkan-sen and kijun-sen indicators. These two indicators provide short-term support at 1.0550-1.0560. A 4 hour close below this support area would be a sign of weakness. The material has been provided by InstaForex Company - www.instaforex.com |
| Ichimoku cloud indicator analysis on Gold for May 6, 2022. Posted: 06 May 2022 06:43 AM PDT Gold price is trading around $1,874. In Ichimoku cloud terms, trend remains bearish despite the recent bounce towards $1,906 area. Price remains below the Kumo (cloud) and the recent rejection when price tested the cloud, is another sign that bears remain in control of the trend.
|
| Short-term pull back justified in USDCHF. Posted: 06 May 2022 06:40 AM PDT USDHCF remains in a bullish trend making higher highs and higher lows. Price remains inside the upward sloping channel since beginning of April, however the RSI has started providing us some warning signals for bulls.
Black lines- bearish RSI divergence The RSI is not making higher highs as price does. The RSI is making lower highs providing us with a bearish divergence. This is not a reversal. This is however a good indicator that the up trend is weakening and a pull back is justified. Support by the bullish channel is found at 0.9745. A break below this level will be a bearish signal and will increase chances of a bigger pull back. Until then bulls remain in control of the trend. The material has been provided by InstaForex Company - www.instaforex.com |
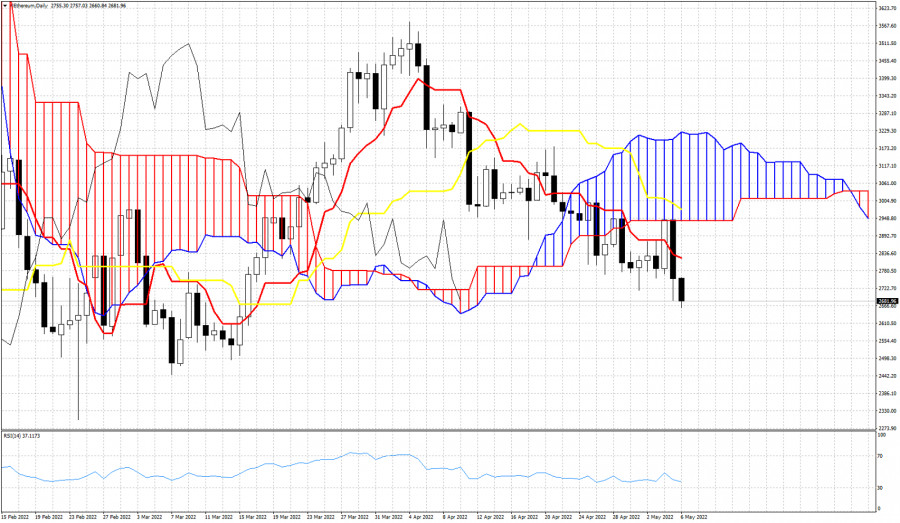
| Ichimoku cloud indicator analysis on Ethereum. Posted: 06 May 2022 06:37 AM PDT Ethereum is trading around $2,660 making new lower lows for April. Price is trading below the Ichimoku cloud (Kumo) and this confirms that we are in a bearish trend. Price has tested the cloud resistance over the last two sessions but got rejected.
|
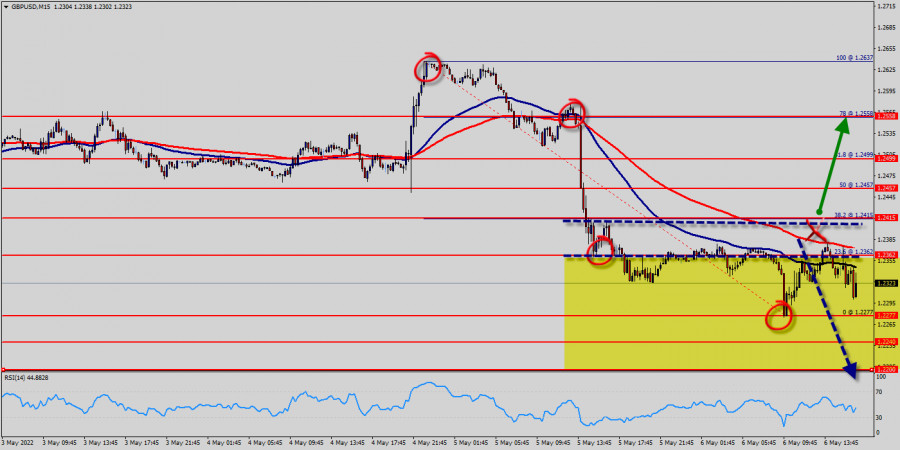
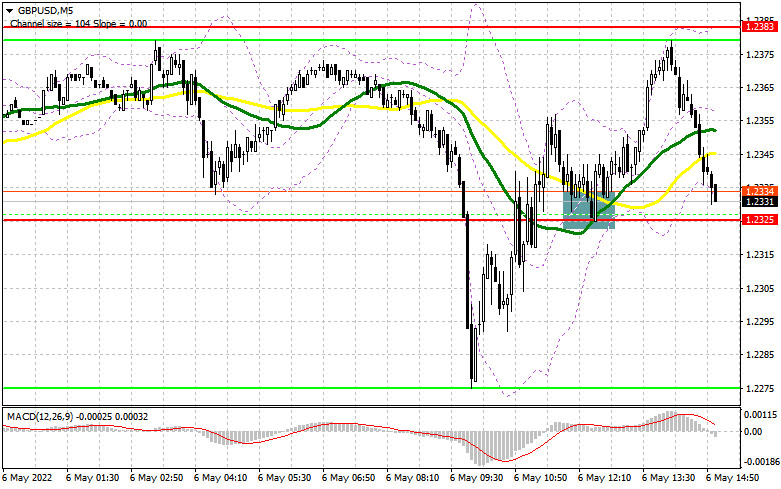
| Posted: 06 May 2022 05:34 AM PDT In my morning forecast, I paid attention to the level of 1.2325 and recommended making decisions on entering the market. Let's look at the 5-minute chart and figure out what happened. The breakout of this range in the first half of the day occurred without a reverse test from the bottom up. For this reason, I could not enter the market in short positions, and I missed all the downward movement. However, then there was a return to 1.2325 and consolidation on this range with a reverse test from top to bottom, which I noted on the chart. That's where it was necessary to act. As a result, the upward movement was about 60 points. I did not wait for a false breakout at 1.2383, as there were a couple of points missing before the test of this level. And what were the entry points for the euro this morning?
To open long positions on GBP/USD, you need: In the afternoon, the entire focus is on the data on the American labor market. We are waiting for reports on the unemployment rate and changes in the number of people employed in the US non-agricultural sector. If the data turns out to be better than economists' forecasts, then the demand for the US dollar will return, and the GBP/USD pair will decline to the area of intermediate support of 1.2308 formed by the results of the first half of the day. Only the formation of a false breakdown there, together with weak data on the US labor market, will lead to a signal to open long positions in the expectation of continuing the upward correction and returning to 1.2377, where the moving averages are playing on the side of the pound buyers. It is possible to expect a sharper upward jerk, but only after the speeches of FOMC members John Williams and Rafael Bostic, who will confirm the Fed's softer stance on monetary policy, which will weaken the dollar. Fixing above 1.2377 with a reverse test from top to bottom will lead to a buy signal, followed by movement to the area of the highs of 1.2442 and 1.2505, where I recommend fixing the profits. In the case of a decline in the pound and the absence of buyers at 1.2308, most likely, we will see a renewal of annual lows and another sale in the area of 1.2246. I also advise you to enter the market there only if there is a false breakdown. You can buy GBP/USD immediately on a rebound from the minimum of 1.2185, or even lower - around 1.2122 and only with the aim of correction of 30-35 points within a day. To open short positions on GBP/USD, you need: Bears control the market, as in the first half of the day they achieved an update of the weekly minimum, which preserves the downward trend. In the event of a spurt of the pound up after the data on the US economy, only the formation of a false breakdown at 1.2377 will be a sell signal. You can also count on a breakdown of the 1.2308 level, but on the condition that the unemployment rate will decrease and new jobs will show strong growth. A breakout and a reverse test from the bottom up of 1.2308 will lead to the formation of an additional sell signal that can collapse the pound to the lows, to the area of 1.2246, where I recommend fixing the profits. A more distant target will be the 1.2185 area, but it is possible to hope for the implementation of this scenario only after the speeches of the Fed representatives and their more hawkish statements. With the option of further growth of GBP/USD and the lack of activity at 1.2377, a new upward jerk may occur against the background of the demolition of stop orders. In this case, I advise you to postpone short positions to a larger resistance of 1.2442. I also advise you to open short positions there only in case of a false breakdown. You can sell GBP/USD immediately for a rebound from 1.2505, counting on the pair's rebound down by 30-35 points within a day.
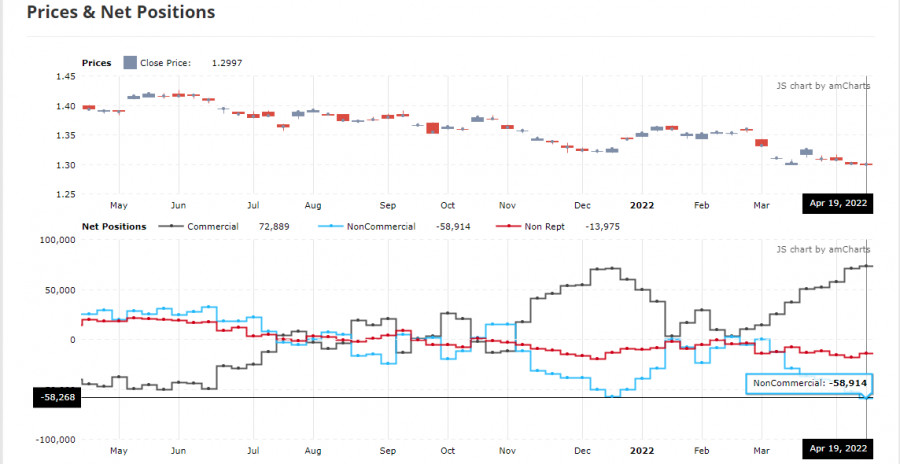
The COT report (Commitment of Traders) for April 19 recorded an increase in both short and long positions, but the former turned out to be much larger, which is obvious if you look at the GBP/USD chart. Things are very bad in the UK economy, which was confirmed last week by the Governor of the Bank of England, Andrew Bailey. His statements that the economy is heading towards recession were the last straw holding back the sellers of the pound in the second half of April. As a result, the breakdown of the finished minimum and a new major sale of the pound have already driven the trading instrument below the 26th figure, and it seems that this is not the end. The growth of the consumer price index is steadily moving towards double-digit indicators, and the increasingly complicated situation in the world due to supply chain disruptions against the background of a new wave of COVID-19 in China creates even more problems. The situation will only worsen, as future inflation risks are now quite difficult to assess due to the difficult geopolitical situation, but the consumer price index will continue to grow in the coming months. The situation in the UK labor market, where employers are forced to fight for every employee by offering higher and higher wages, is also pushing inflation higher and higher. The Bank of England's decision on interest rates could further weaken the pound's position if Governor Andrew Bailey decides not to take serious measures to combat inflationary pressures. The COT report for April 19 indicated that long non-commercial positions rose from the level of 35,514 to the level of 36,811, while short non-commercial positions jumped from the level of 88,568 to the level of 95,727. This led to an increase in the negative value of the non-commercial net position from -53 054 to -58 268. The weekly closing price decreased from 1.3022 to 1.2997. Signals of indicators: Moving averages Trading is conducted below 30 and 50 daily moving averages, which indicates an attempt by bears to return to the market. Note. The period and prices of moving averages are considered by the author on the hourly chart H1 and differ from the general definition of the classic daily moving averages on the daily chart D1. Bollinger Bands In the case of a decline, the lower limit of the indicator around 1.2308 will act as support. Description of indicators
|
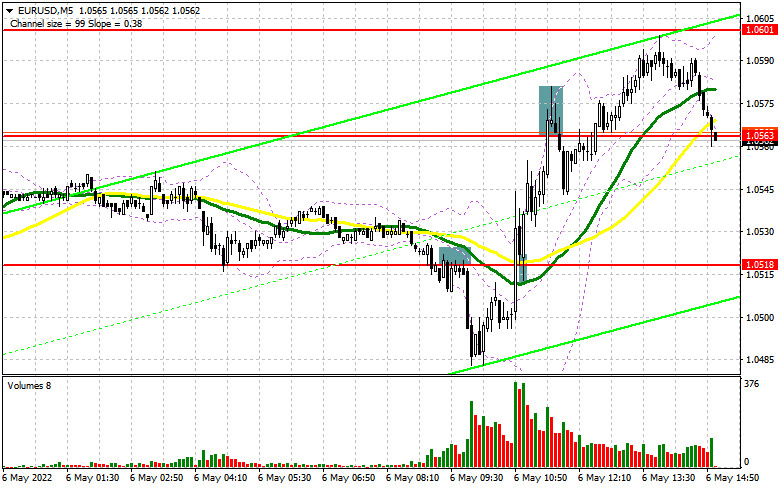
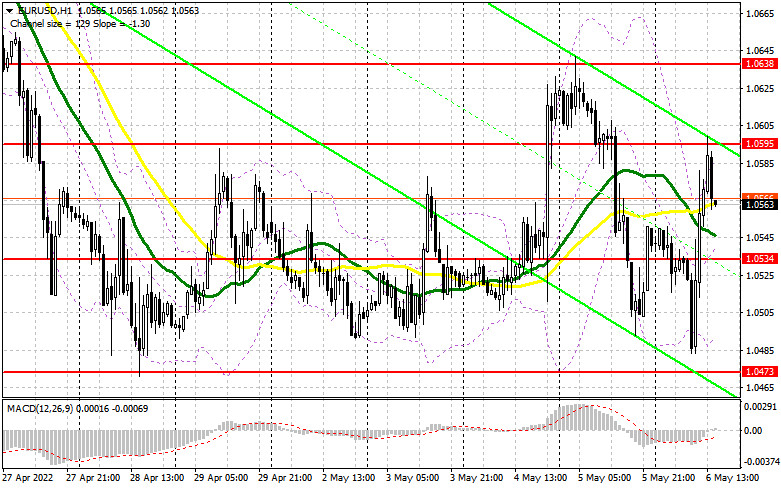
| Posted: 06 May 2022 05:34 AM PDT In my morning forecast, I paid attention to the 1.0518 level and recommended making decisions on entering the market from it. Let's look at the 5-minute chart and figure out what happened there. The expected downward movement to the 1.0518 area and the breakdown of this level, followed by consolidation below, led to a signal to open short positions in continuation of yesterday's bearish rally, observed after an unsuccessful attempt to cling to weekly highs. As a result, the downward movement amounted to about 30 points, after which the bulls became more active and began actively buying off annual lows. A return to 1.0518 and a reverse test of this level from top to bottom became a good buy signal, which led to an upward movement to the 1.0563 area. A false breakdown in this range and a sell signal, and as a result - a drop of 20 points. And what were the entry points for the pound this morning?
To open long positions on EURUSD, you need: For the second half of the day, the technical picture has changed slightly, because we are waiting for data on the unemployment rate and changes in the number of people employed in the non-agricultural sector of the United States. If the data turns out to be better than economists' forecasts, then the demand for the US dollar will return, and in this case, the bulls will need to make every effort to protect the nearest support of 1.0534. The formation of a false breakdown there will give a good entry point into long positions in the expectation of a return of the initiative by buyers with a subsequent breakdown of 1.0595. Going beyond this range will happen only in the case of rather weak growth in the number of jobs. A breakout and a top-down test of 1.0595 form a new signal to enter long positions, strengthening buyers and opening up the opportunity for further growth of EUR/USD to the area of 1.0638, where I recommend fixing the profits. A more distant target will be the 1.0691 area. In the event of a decline in EUR/USD and the absence of buyers at 1.0534, and there are moving averages playing on the side of the bulls, the optimal scenario for buying would be a false breakdown near this year's low of 1.0473, which we fell just a couple of points short of today. I advise you to open long positions on the euro immediately for a rebound only from 1.0426, or even lower - around 1.0394 with the aim of an upward correction of 30-35 points inside the day. To open short positions on EURUSD, you need: Sellers once again failed to offer anything in the area of annual lows, which suggests the continuation of the upward correction of the euro. However, a lot depends on the report on the US labor market, which can be pretty nerve-wracking. The optimal scenario for opening short positions will be the formation of a false breakdown around 1.0595, and strong data on the US labor market will complement the sell signal. This will lead to pressure on the pair to reduce the new support of 1.0534, formed following the results of morning trading. A breakdown and consolidation below 1.0534, together with a reverse test from the bottom up, will give an excellent signal to sell the euro, which will lead to the demolition of several bulls' stop orders and to the return of a bearish trend with the prospect of updating 1.0473, where I recommend fixing the profits. A more distant target will be the 1.0426 area, but such a scenario is possible only after the complete capitulation of euro buyers. If EUR/USD rises during the US session and there are no bears at 1.0595, serious problems will begin. In this case, I expect a sharper upward jerk. The optimal scenario will be short positions when forming a false breakdown in the area of 1.0638. You can sell EUR/USD immediately on a rebound from 1.0691, or even higher - around 1.0736 with the aim of a downward correction of 25-30 points.
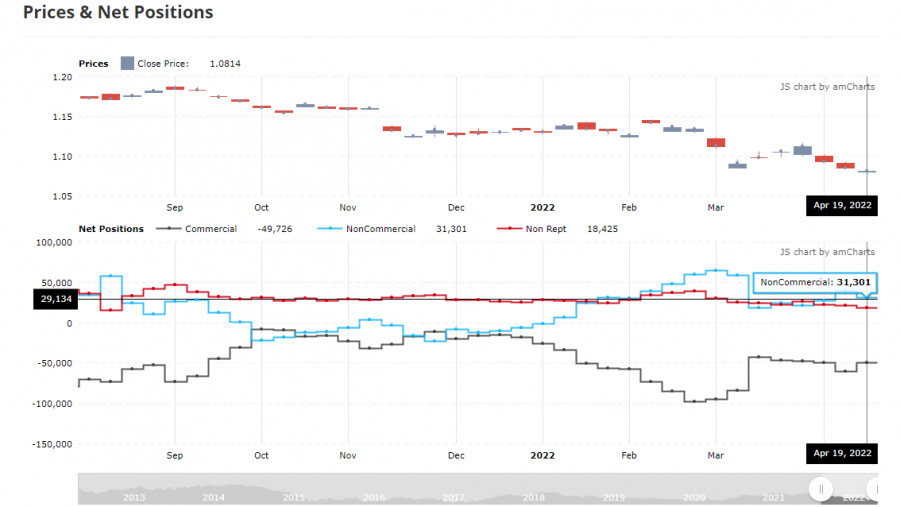
The COT report (Commitment of Traders) for April 19 recorded a sharp increase in short positions and a reduction in long ones. Recent statements by representatives of central banks have led to a new active sale of risky assets, as it became obvious to everyone that serious problems in the economies of developed countries cannot be avoided this year. And although the president of the European Central Bank noted in her speeches that the regulator plans to fully complete the bond purchase program by the end of the second quarter of this year, hinting at a rate hike in early autumn, this was not enough to support the euro. The more aggressive policy of the Federal Reserve System turned out to be not as aggressive as many expected, which slightly weakened the demand for the US dollar and returned the market to equilibrium. Another problem is the threat of another economic paralysis due to strict quarantine restrictions in China against the background of a new wave of COVID-19, which has already led to a large-scale disruption in the supply chains of European and Asian countries. The COT report indicates that long non-commercial positions decreased from the level of 221,645 to the level of 221,003, while short non-commercial positions increased sharply - from the level of 182,585 to the level of 189,702. It is worth noting that the decline of the euro makes it more attractive to investors, so the minimum closure of long positions is not surprising. At the end of the week, the total non-commercial net position decreased and amounted to 34,055 against 39,060. The weekly closing price collapsed and amounted to 1.0814 against 1.0855.
|
| Crypto market drops sharply at end of week Posted: 06 May 2022 05:34 AM PDT On Thursday, Bitcoin plummeted to the lows of January 2022, losing 8.5% and closing at $36,400. The leading cryptocurrency extended its drop on Friday, falling to $35,792 at the time of writing. According to CoinGecko, the crypto market's capitalization dropped by 7.1% to $1.77 trillion over the past day. The Fear and Greed Index has lost 5 points over the past 24 hours, falling to 22 points. All major cryptocurrencies finished Thursday in negative territory. Ethereum dived by 6.3% to $2,751, while Solana crashed by 11.1%, suffering the biggest losses out of the 10 largest cryptocurrencies by market cap.
In a few hours, traders closed positions worth $242 million due to the BTC sell-off, Coinglass reported. The sharp drop of US stock indexes triggered the BTC crash. On Thursday, the NASDAQ Composite lost 5%, while the S&P 500 fell by 3.5%. In April, the NASDAQ Composite dropped by more than 12% in its worst monthly performance since 2008. Earlier, Arcane Research reported that the correlation between BTC and tech stocks reached the highest level since July 2020. On Thursday, the yield of 10-year US Treasury bonds has jumped above 3.10% for the first time since the end of 2018. According to the weekly report by CoinShares, digital assets saw outflows of about $120 million over the past week. BTC outflows reached $133 million in the largest single week of outflows since the summer of 2021. It is the fourth consecutive week of outflows for digital assets. On Wednesday, bitcoin was surging upwards, touching $40,000 as the Federal Reserve announced a 50 basis point interest rate hike from 0.75% to 1%. The interest rate has been increased by 50 basis points for the first time since 2000 However, most cryptocurrency analysts think BTC has significant potential in the near future. Earlier, Bloomberg predicted that the Federal Reserve could ease its monetary tightening cycle due to the massive correction in the stock market. This would lead to a massive rally for all high-risk assets, such as equities and crypto. Besides bitcoin, altcoins such as Ethereum and Solana could also reverse upwards in this situation. US economist Benjamin Cowen stated that the digital assets market would likely experience an upsurge in the near future. However, he recommended traders to invest into Cardano, Avalanche, and Polkadot, shunning BTC. Bitcoin has largely performed well in May, advancing 7 times and declining 4 times over the past 11 years. On average, BTC rose by 27% and fell by 6% in May. If BTC follows the price dynamics of the past several years, it could either jump to about $48,000 or slide down to about $32,000. The material has been provided by InstaForex Company - www.instaforex.com |
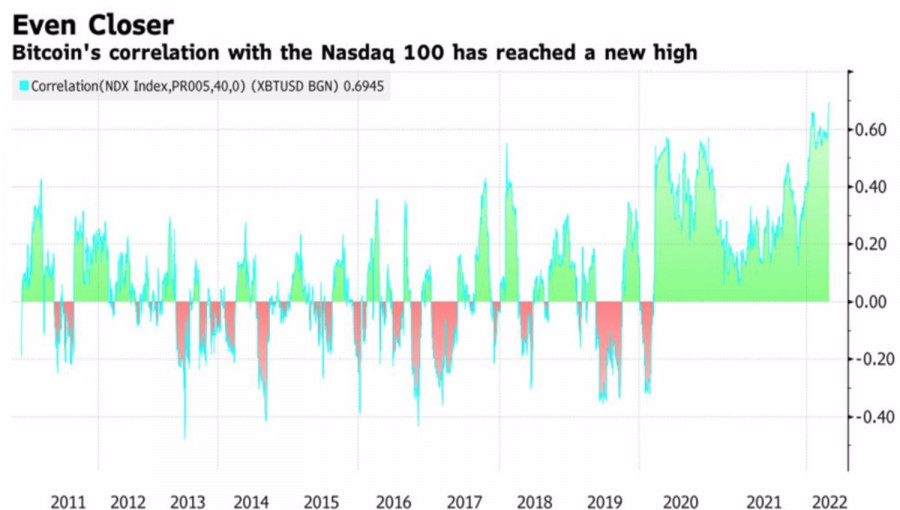
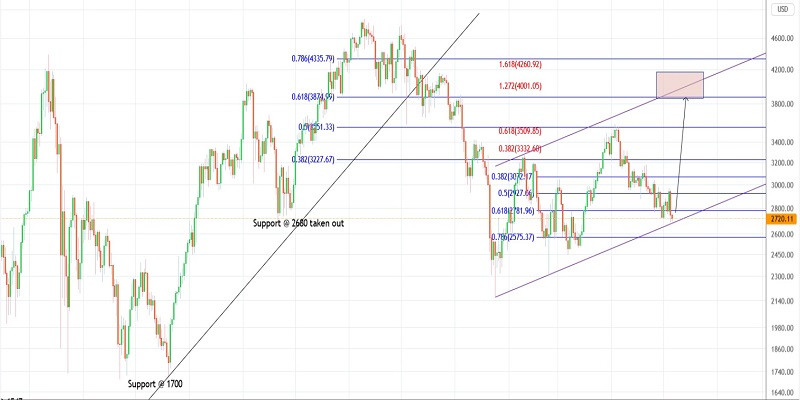
| BTCUSD: Bearish dominance may end soon Posted: 06 May 2022 05:30 AM PDT The May meeting of the Fed was a real shock to the financial markets. By raising the federal funds rate to 1%, voicing a plan to phase out the balance sheet, and declaring that a 75 bps increase in borrowing costs is not something the committee is actively discussing, the central bank has whetted the speculative appetite. Investors were actively buying stocks, but their euphoria quickly turned into panic, which caused stock indices to experience the biggest roller coaster since the start of the pandemic. Bitcoin has not escaped this fate. Its quotes first added more than 5%, and then sank by as much as 11%, dropping to the very bottom since the outbreak of the armed conflict in Ukraine. Despite its relative newness, the movement of the leader of the cryptocurrency sector is increasingly orderly. At present, fundamental analysis can be applied to this asset. This is evidenced by the leapfrogging correlation of bitcoin with the Nasdaq Composite. Since the beginning of the year, the cryptocurrency has decreased by 21%; the index of technology companies has noted the same result. Bitcoin and Nasdaq 100 Correlation Dynamics
The heart of the matter is in the entry into the market of large institutional investors who consider bitcoin as one of the components of the portfolio. It is impossible not to note the growing influence of Americans due to massive bans on cryptocurrencies by China. As a result, we can state with confidence that BTCUSD is a speculative instrument, the dynamics of which is influenced by the Fed's monetary policy, the associated debt rates, as well as the general state of the American economy. The transition of the Fed from an ultra-loose monetary policy to a tough one and the withdrawal of liquidity from the market is bad for risky assets. If in the face of negative real rates on US bonds, investors bought everything that came to hand, now they will think thrice before doing so. Selling on growth is preferred due to fears that an overly aggressive increase in the federal funds rate will not only slow down the US economy, but could also drive it into recession. The worse US GDP looks, the worse it is for corporate earnings. And the fall of the Nasdaq Composite convinces of this. Bitcoin, due to its speculative nature, is no exception. It has already fallen by 47% from the levels of the November record highs, and recently there has been an acceleration of capital outflow from the industry. So, according to CoinShares, in the week of April 29, investors withdrew $120 million from crypto products, resulting in a total outflow of $339 million over four five-day periods. CryptoCompare estimates the current capitalization of bitcoin at $716 billion, which is 17% less than at the beginning of April. Technically, the fall of BTCUSD to the convergence zone of 32,600–33,400 is likely to continue. However, a rebound from it, followed by a return of quotes above 34,250, will create prerequisites for the activation of the Broadening Wedge reversal pattern. Thus, current short-term sales may be replaced by medium-term purchases. BTCUSD, Daily chart
|
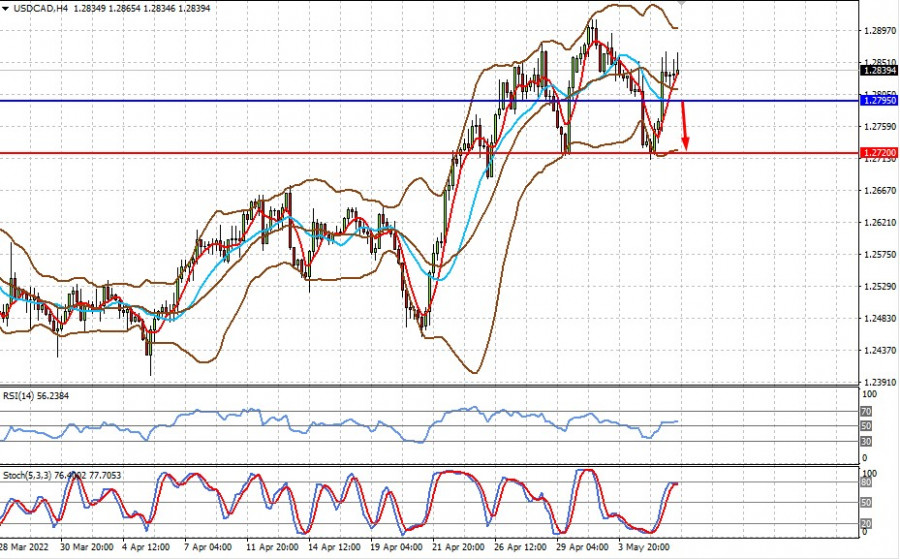
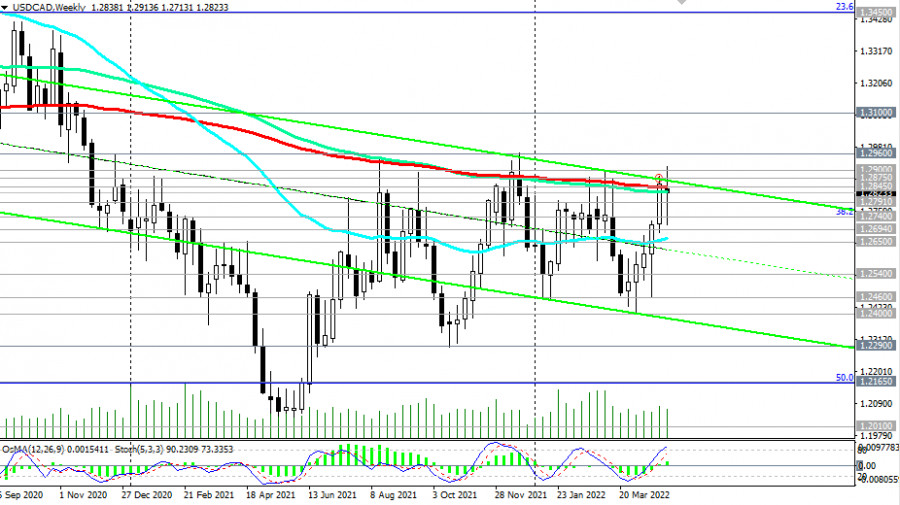
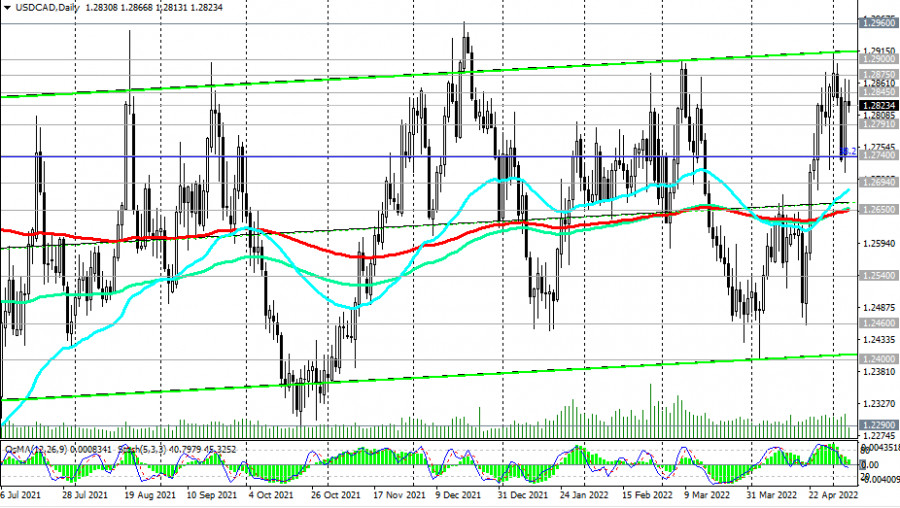
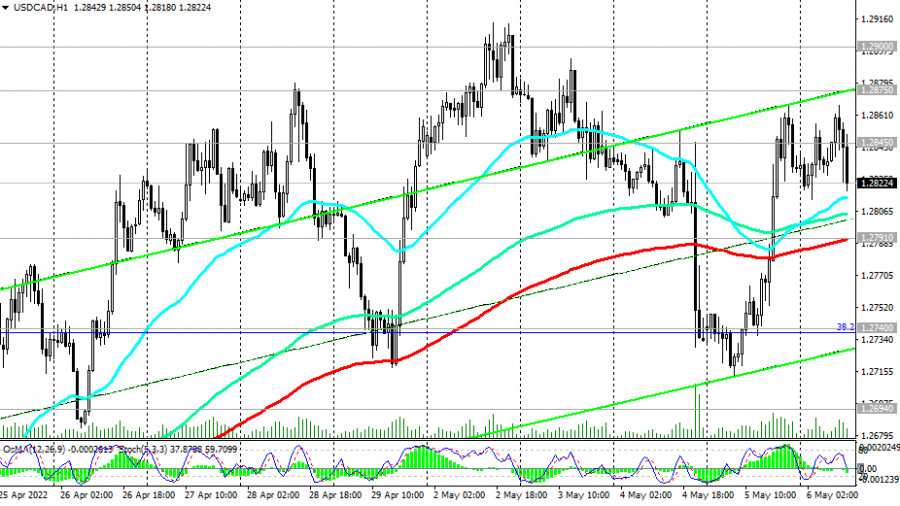
| Technical review for USD/CAD: price could fall again Posted: 06 May 2022 05:23 AM PDT USD/CAD halted in anticipation of the April employment report from the US. The data will show how correct the optimistic assessment of the Fed is, and influence the future actions of the central bank regarding interest rates. If figures turn out to be noticeably worse than expected, the market may interpret it as a signal for the Fed to pause in raising rates, which will return risk appetite. That, in turn, will provoke a decrease in the pair. technical picture: The pair is above the middle line of the Bollinger indicator, below the SMA 5, but above the SMA 14. Meanwhile, the relative strength index (RSI) is above 50% and is moving horizontally, while the stochastic indicator is turning down, below the overbought zone. Possible dynamics: A drop below 1.2795 may lead to further fall to 1.2720.
|
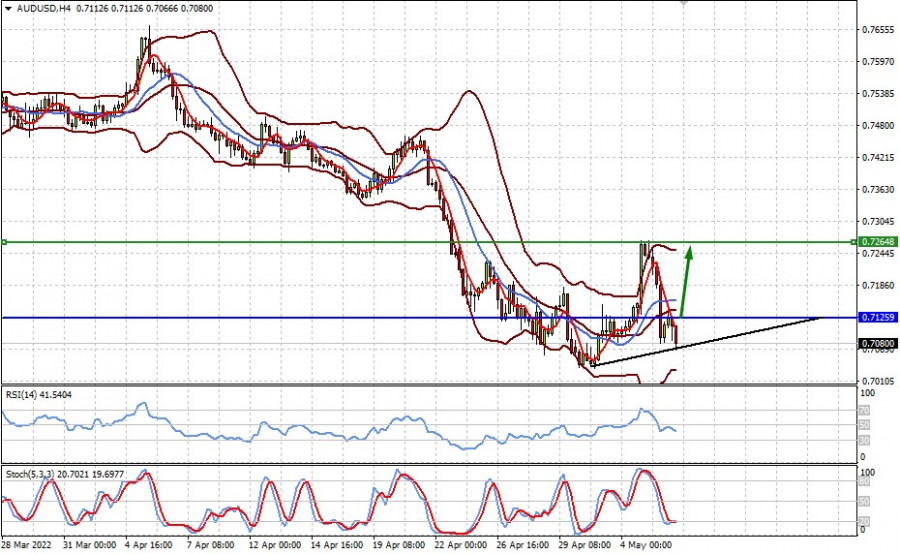
| Technical review for AUD/USD: price may bounce up Posted: 06 May 2022 05:15 AM PDT AUD/USD found support at 0.7070 after falling heavily the previous day because of the upcoming April employment data from the US. If the report turns out to be noticeably worse than expected, the market may interpret it as a signal for the Fed to pause in raising rates, which will return risk appetite. That, in turn, will provoke an increase in the pair. technical picture: The quote is below the middle line of the Bollinger indicator, below the SMA 5 and SMA 14. Similarly, the relative strength index (RSI) is below 50% and is indicating a reversal, while the stochastic indicator is in the oversold zone. Possible dynamics: Breaking through 0.7125 will push the pair to 0.7265.
|
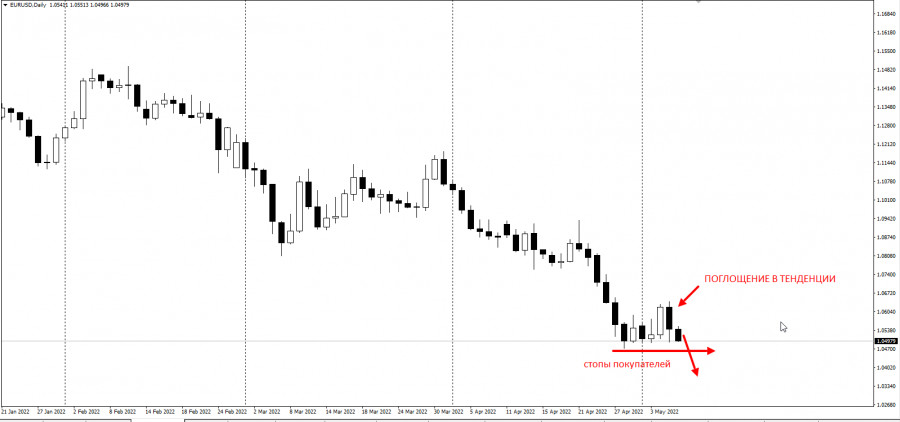
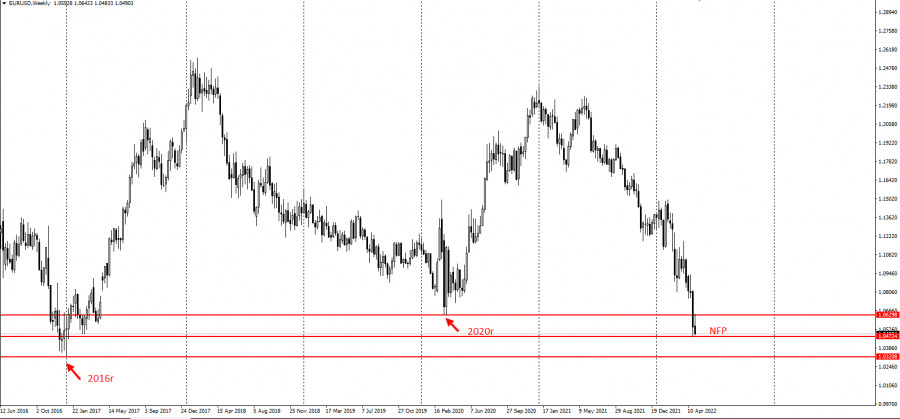
| Posted: 06 May 2022 04:54 AM PDT
EUR/USD closed with an almost complete absorption, so buyers had to limit their risks after the April low below 1.04700. Most likely, today's unemployment data will also add volatility to the market.
Considering that euro is currently at the historical lows of 2016, it is better to avoid long positions, at least until the breakdown of 1.04700.
This trading idea is based on the Price Action and Stop Hunting strategies.Good luck and have a nice day! The material has been provided by InstaForex Company - www.instaforex.com |
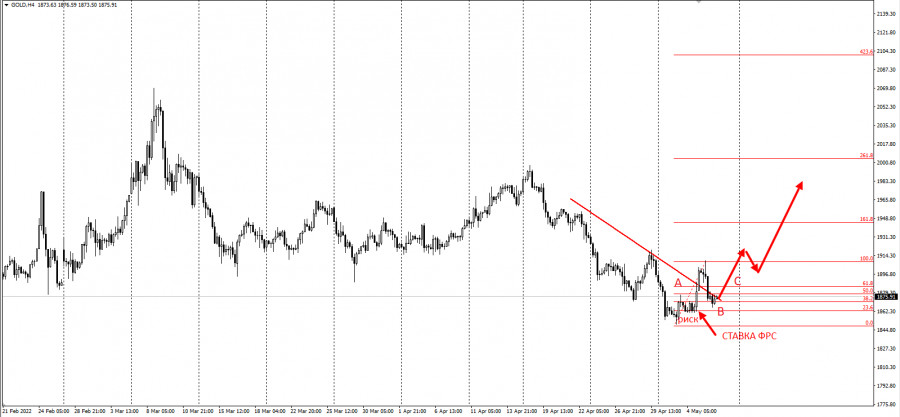
| Posted: 06 May 2022 04:53 AM PDT
Wednesday's news prompted gold to roll back, allowing bulls to continue working for an increase according to the ABC pattern.
This means that the previous trading plan for gold is still relevant, and the main target is still $2,075 or higher.
Based on this, the potential movement from the current prices is over 20,000 pips.Upcoming report on US employment will also add volatility to the market.
This trading idea is based on the Price Action and Stop Hunting strategies.Good luck and have a nice day! The material has been provided by InstaForex Company - www.instaforex.com |
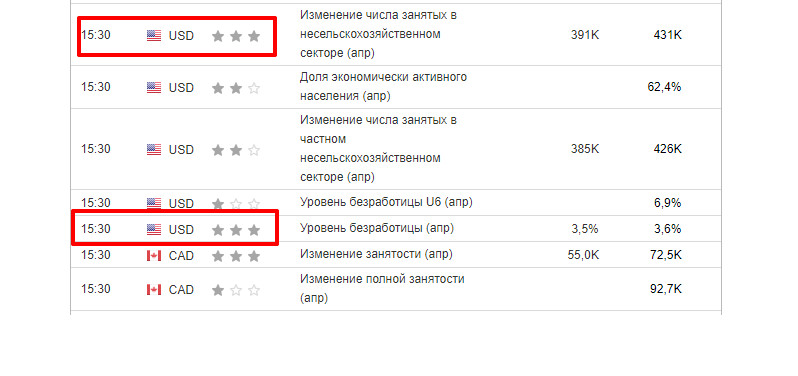
| US employment data can affect the markets Posted: 06 May 2022 04:44 AM PDT World markets continue to rumble amid unabated price growth, geopolitical tensions and growing doubts that Western elites are able to prevent the European and American economies from sliding into a deep recession. After market sentiment slightly improved on Wednesday following the speech of Fed Chairman Jerome Powell, a new wave of fears arose because the Fed could not curb the galloping growth of inflation by raising rates, but would increase its negative effects. The US stock market collapsed, burying all hopes that it would bounce up from the lows. As such, the heat in the market eased slightly, and now all attention has shifted to the upcoming April data from the US labor market. The forecast was a 391,000 job growth in April, up from 426,000 in March. Meanwhile, average hourly earnings are projected to correct to 5.5% y/y and maintain a 0.4% growth rate on a monthly basis. How might US employment data affect financial markets? As investors fully understand the significant risks of a deepening economic crisis in the US on the back of high inflation and a continued cycle of higher interest rates, a weaker nonfarm payroll numbers will only fuel a sell-off in equity and government bond markets. This, in turn, will lead to a new wave of growth in dollar and, quite likely, to an increase in demand for gold as a safe-haven asset. This scenario is most likely to happen because the reported data on business activity indicated a drop in growth, which naturally affects the number of jobs. Also, figures from the ADP showed a sharp decline, while the values of jobless claims rose. In short, yesterday's fall may continue, unless the market sees for itself that the weakening of the situation in the labor market will not force the Fed to take a pause in raising rates. In this case, it will be possible to observe a rollback of stock indices and a weakening of dollar. The material has been provided by InstaForex Company - www.instaforex.com |
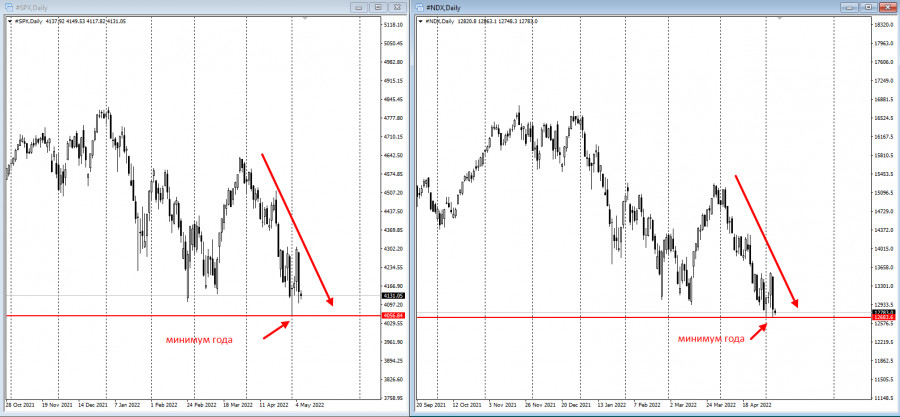
| US stock crash drags European indices down Posted: 06 May 2022 04:40 AM PDT
US futures dropped with bonds as risk aversion and volatility engulfed markets gripped by inflation and fears of rising inflation.The S&P 500 and Nasdaq 100 contracts showed further declines after yesterday's sell-off, which cut 3.5% from the S&P and 5% from the Nasdaq. Treasuries extended the fall, which lifted the underlying yield above 3%.
The next pressure point for markets will be today's US jobs report, which will be closely watched for signs that rising wage costs are adding to inflationary pressures, scaring investors. Economists estimate that the number of employed people will rise by 380,000 in April and that the unemployment rate will fall to 3.5%.
Although the labour market is still hot and the US consumer resilient, there are growing fears that the US economy will crack under higher rates. There is also the prospect that these rates will not be enough to cool the fastest inflation in four decades.Any upward pressure on average hourly earnings could lead to another surge in US yields and therefore put negative pressure on equities and especially technology stocks, Christophe Barrot, chief economist at Market Securities LLP in Paris, said.
The global energy crisis and increasingly hawkish central banks are fuelling fears that key economies will slide into 1970s-style stagflation. A toxic mix of rising costs, falling employment and slow growth may seem a remote risk, but the unexpected contraction in US economic growth last quarter reinforces the bearish outlook.Meanwhile, European equities extended their losses and are poised for their worst weekly drop in two months.
|
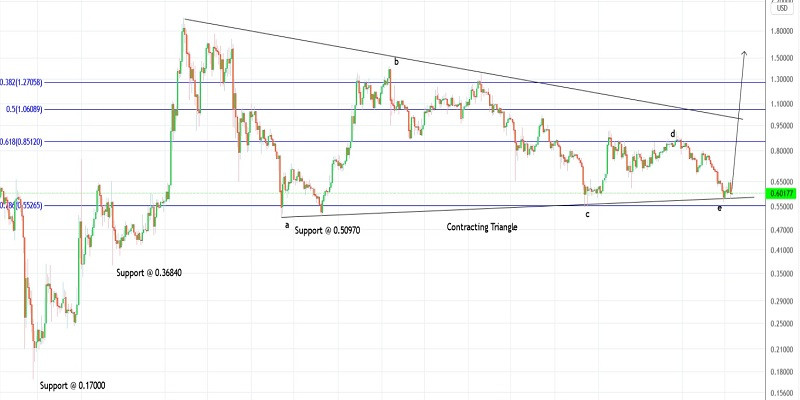
| Trading plan for Ripple on May 06, 2022 Posted: 06 May 2022 04:35 AM PDT
Technical outlook:Ripple drooped through $0.58000 on Thursday, giving up all its gains received amid the FOMC meeting on Wednesday. The crypto had raised through the $0.65000 mark on Wednesday only to find resistance. It was seen to be trading around the $0.59800 mark at this point in writing and is expected to resume moving higher in the near term. Ripple had earlier rallied between $0.17000 and $1.80000, carving a meaningful upswing. Since then, it has been in a sideways contracting triangle pattern as presented on the daily chart here. A triangle is a five wave structure which is labelled as a-b-c-d-e. With that respect, price action might have terminated its last wave around the $0.5660 levels. If the above proposed structure holds well, Ripple would be well under its way to break above the $0.91000 high and triangle resistance. Ideally, prices should not break below $0.50970 interim lows to keep the triangle count intact. Traders might be preparing to initiate fresh long positions from the current levels with risk below $0.50970. Trading plan:Potential rally through $0.9100 and higher against $0.50970 Good luck! The material has been provided by InstaForex Company - www.instaforex.com |
| USD/CAD Technical Analysis and Trading Tips on May 6, 2022 Posted: 06 May 2022 04:32 AM PDT
USD/CAD has been trying to fully restore the long-term trend since June 2021, strengthening from lows near 1.2000. At the time of writing, the pair is trading near the important resistance level of 1.2845 (200 EMA on the weekly chart). The breakout of this level will take the pair into a long-term bull market.
However, not everything is so clear. The Canadian dollar is a worthy competitor to the US dollar. The monetary policy parameters of the Bank of Canada run almost in parallel with the monetary policy parameters of the Fed. At the same time, inflation in Canada is still less than in the US, and rising oil prices provide strong support for the Canadian currency quotes. Very strong arguments are needed for the breakout and growth above the resistance level of 1.2845. If this breakout nevertheless takes place, then the nearest growth targets will be the local resistance levels of 1.2875, 1.2900, 1.2960 (2021 top).
In an alternative scenario, the signal to sell is on the break of the important short-term support level 1.2791 (200 EMA on the 1-hour chart). In this case, USD/CAD will head inside the descending channel on the weekly chart. Its lower limit is below 1.2400 (local support level). A more distant downside target is at support at 1.2165 (50% Fibonacci retracement in USD/CAD surge from 0.9700 to 1.4600) and close to 1.2000 (2021 bottom). Support levels: 1.2791, 1.2740, 1.2694, 1.2650, 1.2540, 1.2460, 1.2400, 1.2290, 1.2165, 1.2010, 1.2000 Resistance levels: 1.2845, 1.2875, 1.2900, 1.2960, 1.3000, 1.3100 Trading tips Sell Stop 1.2780. Stop-Loss 1.2880. Take-Profit 1.2740, 1.2694, 1.2650, 1.2540, 1.2460, 1.2400, 1.2290, 1.2165, 1.2010, 1.2000 Buy Stop 1.2880. Stop-Loss 1.2780. Take-Profit 1.2900, 1.2960, 1.3000, 1.3100 The material has been provided by InstaForex Company - www.instaforex.com |
| Video market update for May 06,,2022 Posted: 06 May 2022 03:44 AM PDT Watch for buying opportunities on the dips on USD/JPY.... The material has been provided by InstaForex Company - www.instaforex.com |
| Trading plan for Ethereum for May 6, 2022 Posted: 06 May 2022 03:35 AM PDT
Technical outlook:Ethereum dropped below $2,700, giving away its gains post FOMC on Wednesday. The crypto repeatedly tested its channel support just below $2,700 in the past two trading days. Bulls need to hold the price above $2,300 to keep the structure intact as they prepare to push through the $3,800-4,000 range. Ethereum is also re-testing its Fibonacci 0.618 retracement around $2,680-2,700. There is a high probability of a bullish reversal from current levels. A breakout above $2,960 will confirm a potential bottom in place as bulls register themselves to be back in control. The crypto has been producing a potential corrective wave from the $2,140 low. Furthermore, Ethereum has terminated two waves within the proposed corrective rally around $3,500 and $2,680 respectively. If the above holds well, bulls will be poised to resume the third wave higher through $3,800 at least to complete the structure. In case of a breakout above $4,100-4,200, the price will be able to test the level of $4,850. Trading plan:Potential rally through $3800 against $2100 Good luck! The material has been provided by InstaForex Company - www.instaforex.com |
| Daily Video Analysis: Crude Oil, H4 Bullish Buying Opportunity Posted: 06 May 2022 03:29 AM PDT Today we take a look at Crude Oil. Combining advanced technical analysis methods such as Fibonacci confluence, correlation, market structure, oscillators and demand/supply zones, we identify high probability trading setups. The material has been provided by InstaForex Company - www.instaforex.com |
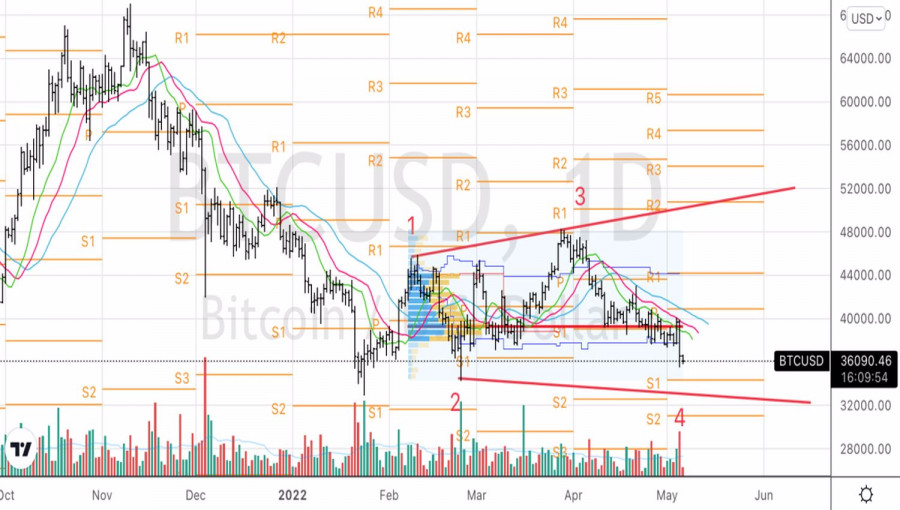
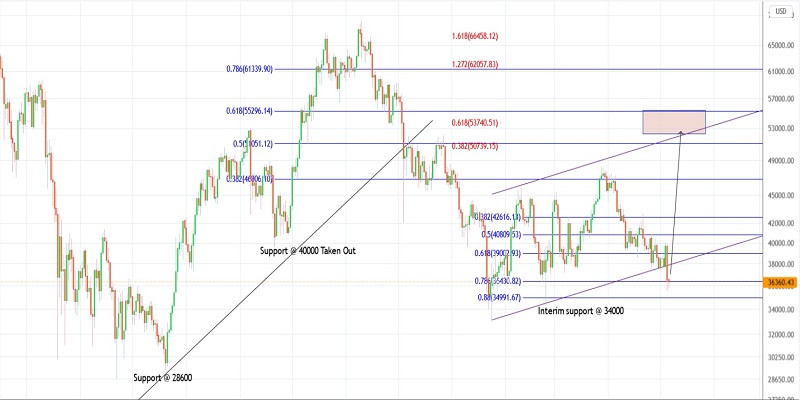
| Trading plan for Bitcoin for May 06, 2022 Posted: 06 May 2022 03:22 AM PDT
Technical outlook:Bitcoin dropped to $35,500 on Thursday breaking through the previous swing low around the $37,500 mark. It also penetrated the channel support as seen on the daily chart. However, it may not be a confirmed break below the channel. The support level of $34,000 remains intact. Bulls may try to take control with the price holding above $33,000-34,000. Bitcoin might have completed its second corrective wave at around $35,500. If this scenario comes true, bulls would resume the third wave higher, pushing the price to $50,000-55,000. The bottom line for the above structure is interim support at $33,000, which should remain intact. Bitcoin has been extending losses between $69,000 and $33,000. It is expected to break through the Fibonacci 0.618 retracement around the $53,000 mark. On the flip side, if prices rise above the $61,000 mark, it would open the way to fresh swing highs above $69,000. Trading plan:Potential rally through $50000-55000 zone against $33000 Good luck! The material has been provided by InstaForex Company - www.instaforex.com |


| You are subscribed to email updates from Forex analysis review. To stop receiving these emails, you may unsubscribe now. | Email delivery powered by Google |
| Google, 1600 Amphitheatre Parkway, Mountain View, CA 94043, United States | |


Comments