Forex analysis review
Forex analysis review |
- Analysis of GBP/USD on May 3. Fed meeting: the day before
- Trading Signal for EUR/USD for May 03-04, 2022: buy above 1.0520 (21 SMA - symmetrical triangle)
- Forex forecast 05/03/2022 AUD/USD, NZD/USD and Gold from Sebastian Seliga
- EUR/USD analysis on May 3. Bloomberg: oil embargo will work before the end of the year
- Trading Signal for Gold (XAU/USD) for May 03-04, 2022: buy above $1,858 (200 EMA - uptrend channel)
- Forecast for EUR/USD on May 3. Traders have started a new week and month very calmly
- Forecast for GBP/USD on May 3, 2022
- GBP/USD: plan for the American session on May 3 (analysis of morning deals). The pound will continue to sell at the slightest
- EUR/USD: plan for the American session on May 3 (analysis of morning deals). The euro is marking time in one place, drawing
- BTC update for May 03,.2022 - Watch for the dowwnside continuation towards $37.656
- EUR/USD analysis for May 03, 2022 - Potential for the downside continuation
- Analysis of Gold for May 03,.2022 - Potential for another drop towards $1.820
- US dollar index reaches swing high: should we expect rise in quotations of cryptocurrencies?
- Trading plan for Ethereum for May 03, 2022
- Trading plan for Bitcoin for May 03, 2022
- Technical analysis and forecast for USD/JPY on May 3, 2022
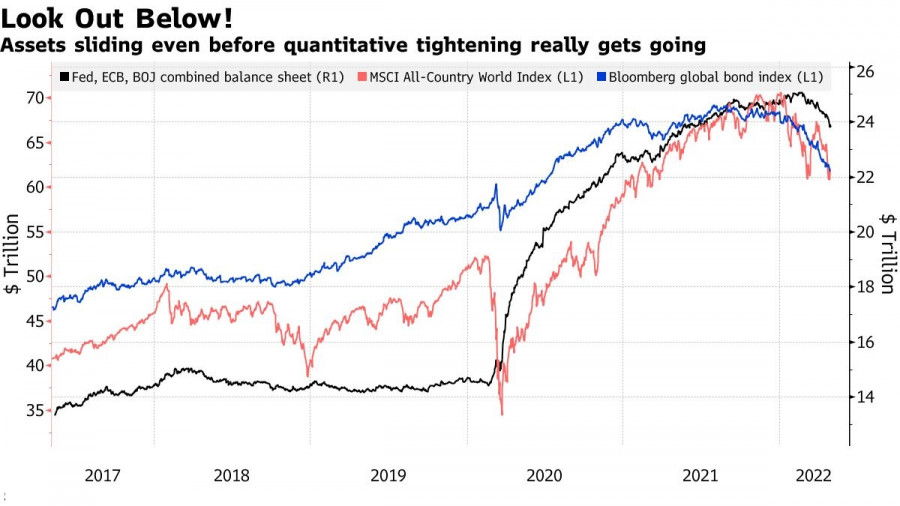
- Investors brace for biggest US rate hike since 2000
- Rising volatility and trading volumes: What to expect from Bitcoin after the Fed meeting?
- Analysis and forecast for GBP/USD on May 3, 2022
- Video market update for May 03,,2022
- EUR/USD analysis and forecast for May 3, 2022
- Buffett and Munger calls Bitcoin worthless
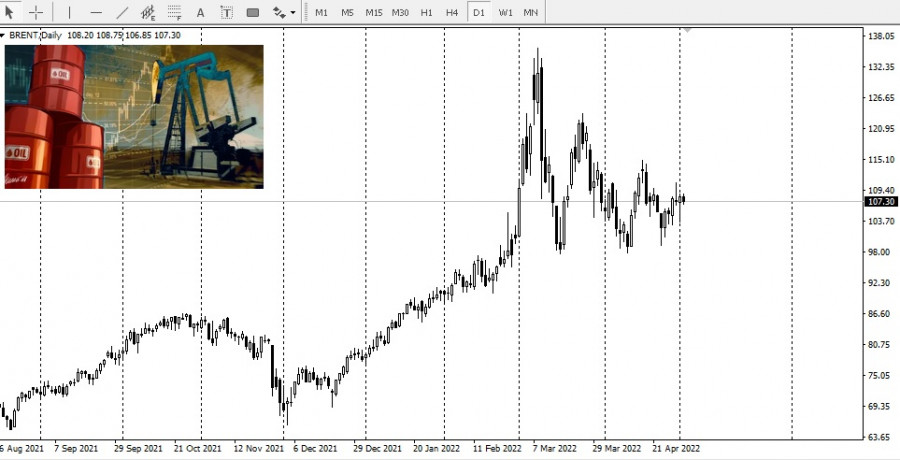
- Europe is on the verge of agreeing to abandon Russian oil
- Technical overview: EUR/USD (there is a possibility of resuming the growth of the pair)
- Technical overview: AUD/USD (there is a possibility of resuming the growth of the pair)
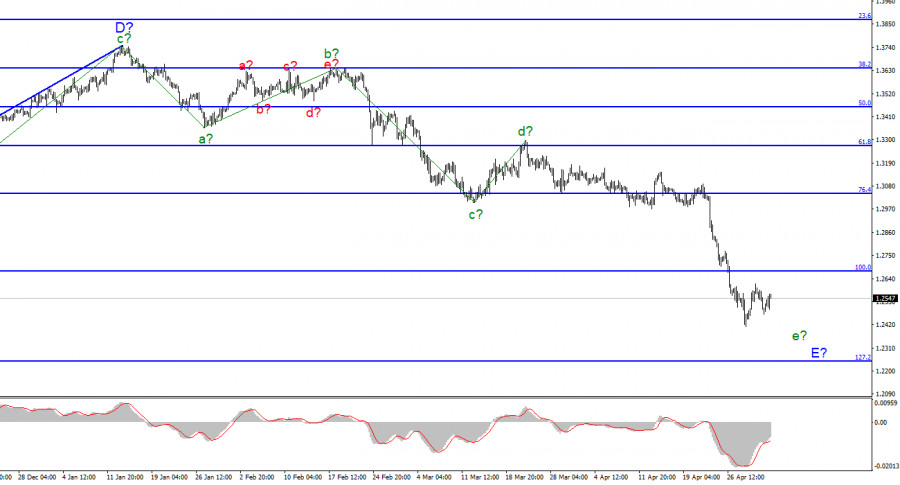
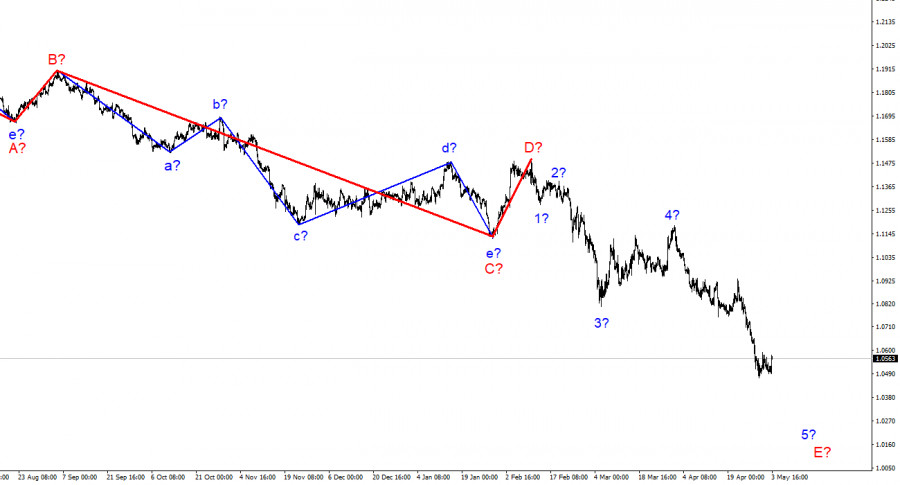
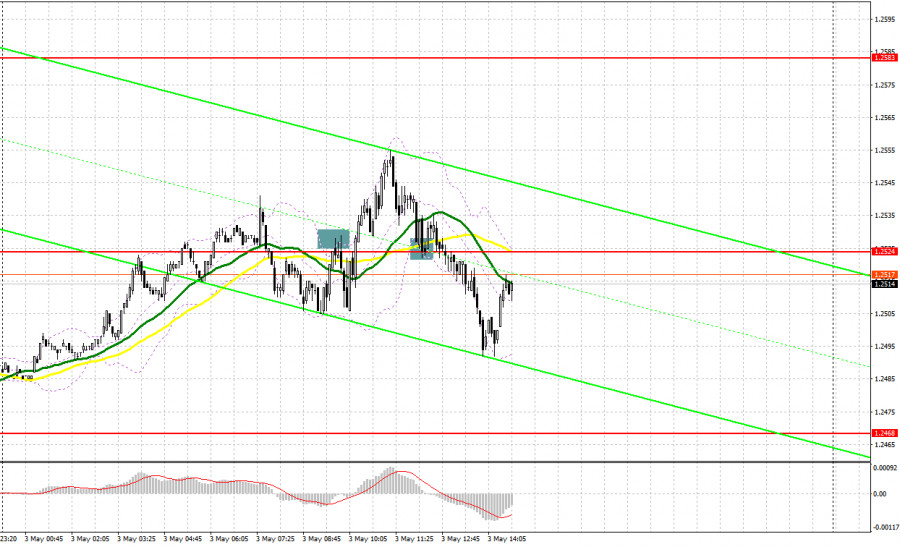
| Analysis of GBP/USD on May 3. Fed meeting: the day before Posted: 03 May 2022 09:11 AM PDT
For the pound/dollar instrument, the wave markup continues to look very convincing and does not require adjustments. The downward section of the trend continues its construction within the framework of wave E-E, and its internal wave marking looks quite difficult - correction waves are practically not viewed in it, so it is very difficult to determine which internal wave is being built at this time. Presumably, wave 4-e-E. If this is true, then we get almost the same wave markings for the British and the Europeans. The current wave is the last wave of the current downward trend segment. The entire site is either nearing completion of its construction, or it will have to take a much more complex and extended form. Everything will depend on the news background, which is now clearly divided into geopolitical and economic. The military conflict between Ukraine and Russia, according to many military analysts, may persist not just for months, but for years. The consequences for the European and British economies will be serious. From an economic point of view, the meetings of the Bank of England and the Fed will be held this week, which can greatly affect the mood of the market. The meetings of the Fed and the Bank of England will determine the future of the British The exchange rate of the pound/dollar instrument increased by 60 basis points on May 3. I assume that an internal correction wave is being built now, after which the decline in quotes will continue. To do this, the results of the Fed meeting, which will be held tomorrow, should be "hawkish". For them to be recognized as "hawkish", the Fed should not retreat from its plans, which it has actively voiced in recent months. The rate should be raised by 50 basis points tomorrow, and a quantitative tightening program should be announced, under which the regulator will sell bonds worth 95 billion rubles every month. If these two decisions are made and announced, then the demand for the US currency may begin to grow again, which will give us the necessary result that will fully correspond to the current wave markup. If not, then the Briton can finish another day with an increase, and on Thursday the results of the Bank of England will be known. Given that no matter how hard the British central bank tried, it failed to stop the fall of the pound by raising the interest rate, there are serious reasons to assume that demand for the British will not increase. There was no important news in Britain today. In the USA, too. Thus, I believe that the market is now purposefully building a corrective wave, after which it will start new sales. So far, everything looks very harmonious and logical. Separately, I would like to note the speech at the press conference by Jerome Powell, which will take place late tomorrow evening, after the meeting. It is very important what Powell will say about inflation since the issue of inflation is now the most important for many central banks. At the moment, there are no signs of its slowing down either in the UK, the US, or the European Union. But the Fed cannot announce an even stronger and faster rate hike. In the next two months, the rate may rise by 1% at once, which will be the fastest tightening of monetary policy since 2000. General conclusions The wave pattern of the pound/dollar instrument still assumes the construction of wave E. I continue to advise selling the instrument with targets located around the 1.2246 mark, which corresponds to 127.2% Fibonacci, according to the MACD signals "down". However, I don't see a pound below this mark yet. From my point of view, the construction of a downward section of the trend is nearing its completion and the mark of 1.2246 looks very good for the trend to end right around it.
At the higher scale, wave D looks complete, but the entire downward trend section does not. Therefore, I still expect a continuation of the decline of the instrument with targets located around the 22nd figure. Wave E takes on a five-wave appearance but still doesn't look fully equipped. However, it already takes a little time to complete the complete set. The material has been provided by InstaForex Company - www.instaforex.com |
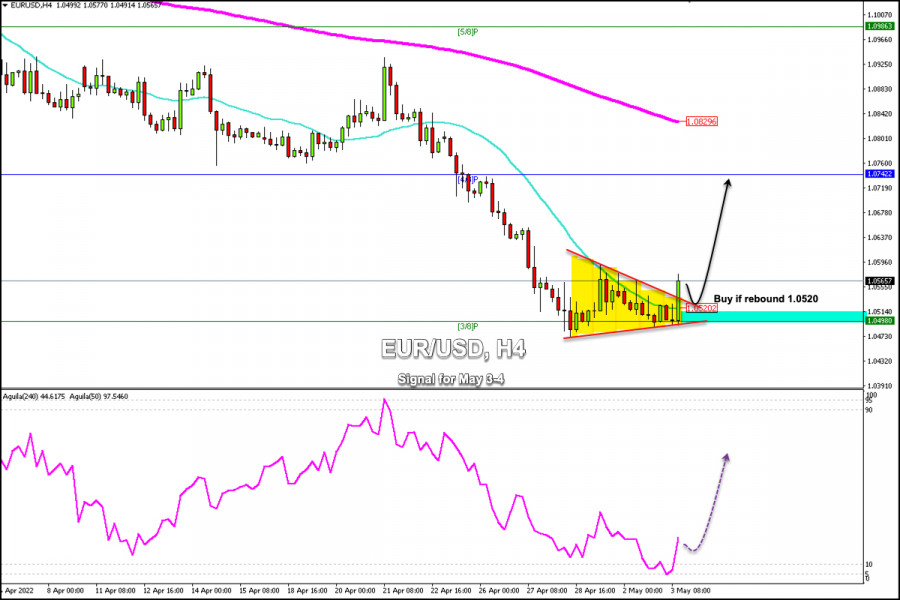
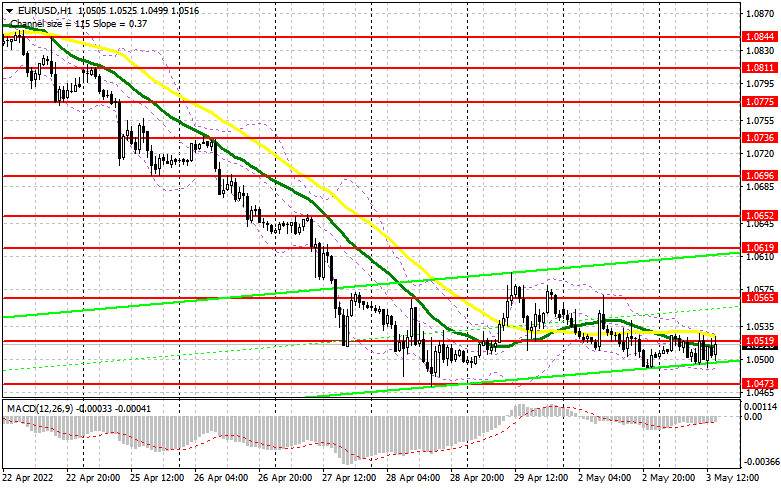
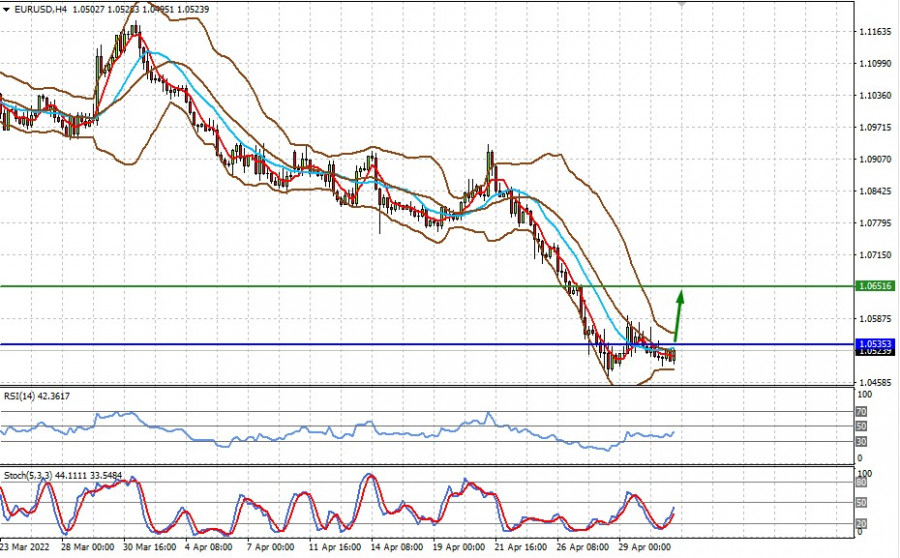
| Trading Signal for EUR/USD for May 03-04, 2022: buy above 1.0520 (21 SMA - symmetrical triangle) Posted: 03 May 2022 09:08 AM PDT
According to the 4-hour chart, the Euro has formed a symmetrical triangle pattern and is trading above the 21 SMA showing a positive signal. This pattern break should be confirmed by a pullback towards the area 1.0520. If it bounces above 1.0520, the euro is expected to reach 1.0756 in the next few days, where 4/8 Murray is located. On May 3, the eagle indicator reached the zone 5-point which represents an extremely oversold level. EUR/USD is likely to resume a technical rebound in the next few days. In recent days, the 3/8 Murray level has acted as a strong bottom and has become strong support, limiting the loss of the euro and allowing it to consolidate above this area. Therefore, if the euro remains above 1.0498 in the coming days, it is likely to bounce and recover gradually part of the losses. Hence, EUR/USD could reach the EMA 200 located at 1.0829. This week will be decisive to know the future of the euro with the Fed's decision on interest rates that will be published tomorrow. The non-farm payrolls are due on Friday. The market is likely to react with strong volatility. We expect to buy the EUR/USD pair only if it consolidates above 1.0500. The market always reacts contrary to the announcement as it is likely that the increase of 0.50% has been already priced in. The impact on the market will come with the speech by Powell and the announcements related to the Fed's balance sheet and the portfolio. Our trading plan is to buy the euro if it bounces around 1.0520, with targets at 1.0637 and 1.0742. If the bullish force prevails, EUR/USD could reach the 200 EMA located at 1.0829. Conversely, if the euro falls below 1.0490, we should avoid buying. The material has been provided by InstaForex Company - www.instaforex.com |
| Forex forecast 05/03/2022 AUD/USD, NZD/USD and Gold from Sebastian Seliga Posted: 03 May 2022 08:47 AM PDT Let's take a look at the technical picture of AUD/USD, NZD/USD and Gold. The material has been provided by InstaForex Company - www.instaforex.com |
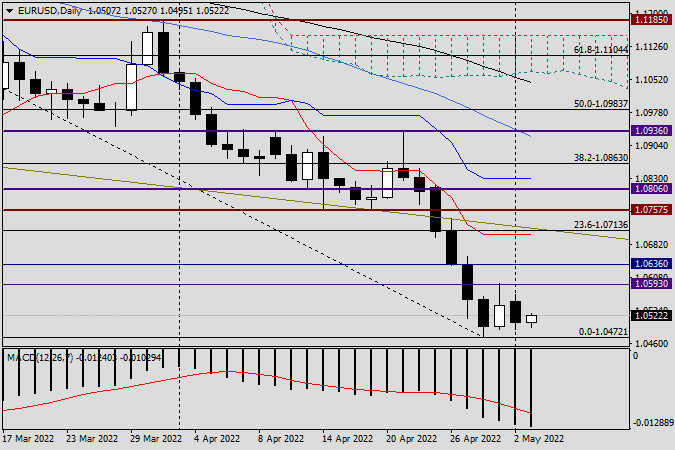
| EUR/USD analysis on May 3. Bloomberg: oil embargo will work before the end of the year Posted: 03 May 2022 07:44 AM PDT
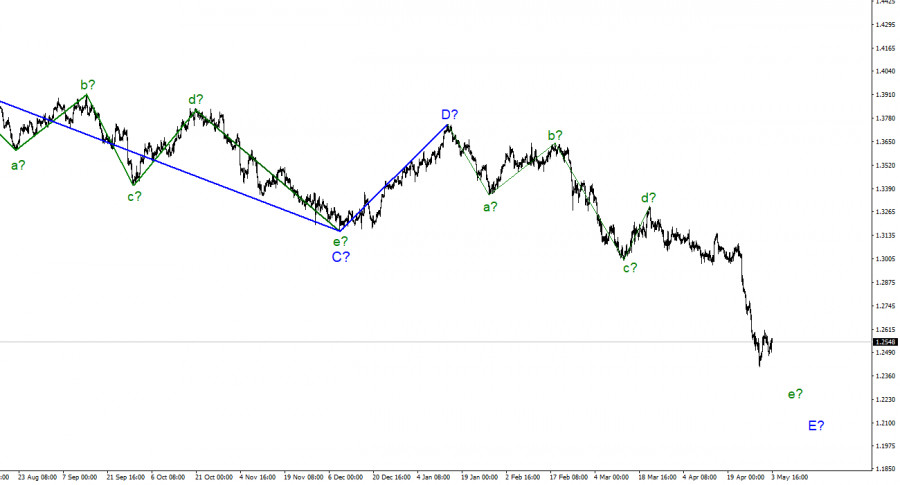
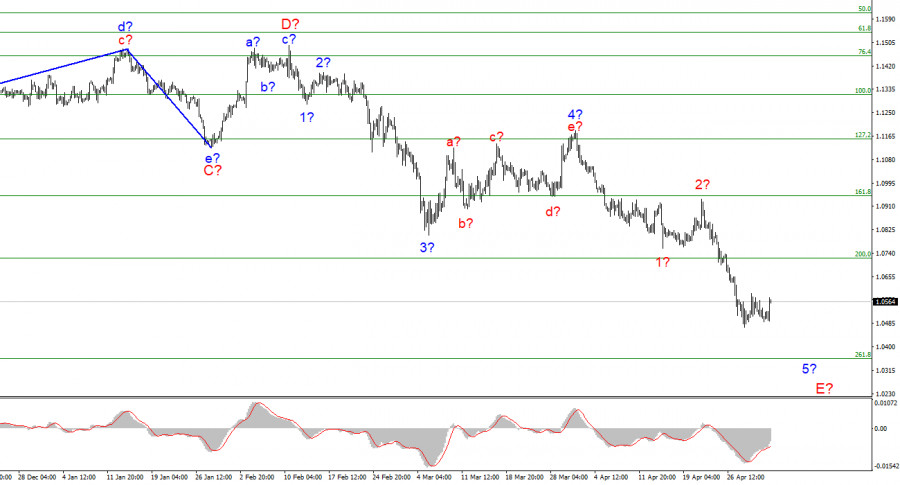
The wave marking of the 4-hour chart for the euro/dollar instrument continues to look convincing. The instrument continues to build a descending wave 5-E, which may be the last in the structure of the descending trend segment. If this is true, then the decline in the quotes of the euro currency may continue for another one or two weeks, since this wave may turn out to be a five-wave in its internal structure. At the moment, three internal waves are visible inside this wave, so I'm counting on building another pulse wave. A successful attempt to break through the 1.0721 mark, which equates to 200.0% by Fibonacci, indicates that the market is ready for further sales of the euro currency. In the coming days, the instrument may decline to the level of 1.0355, and there only 350 basis points will remain to price parity with the dollar. Presumably, the construction of the current downward wave and the entire downward section of the trend can be completed near this mark. If the breakout attempt of 1.0355 turns out to be successful, then the instrument will further complicate its wave structure. The European Union will still abandon Russian oil The euro/dollar instrument rose by 70 basis points on Tuesday. This increase may be the fourth, corrective wave consisting of 5-E. If this is true, then we are waiting for at least one more decline of the instrument, which may begin and end this week. To consider wave 4 completed, the instrument must go up a few dozen more points to go beyond the previous high. After that, the instrument can begin to decline again. The news was very weak today. The unemployment rate in the European Union decreased by 0.1% but remains quite high - 6.8%. In the US, unemployment is much lower. One could assume that the increase in demand for the euro currency today is due to this report, but I do not think so. Unemployment reports are rarely taken into account by the market. Much more important is the news from Bloomberg. The agency said that the sixth package of EU sanctions against Russia will include an oil embargo. But not momentary, but gradual. Bloomberg expects that 100% of the embargo will work by the end of 2022. It is expected that a complete ban on oil imports will be introduced in November-December, and until then the European Union will reduce oil supplies from Russia. It is reported that tanker oil will be banned first, and then pipeline oil. The agency also believes that Belarus will also fall into the sixth package of sanctions, as it assisted the Russian army in the process of invading Ukraine. Thus, within the next 7-8 months, the EU can completely abandon oil from Russia and start buying it from other countries. Against this background, oil quotes may take off even more, but the prices that are currently being set on the stock exchange and the prices at which oil is sold are very different now. There have been repeated reports that Moscow has offered big discounts to India. In any case, even with discounts, if Russia finds new importing countries for the entire volume of oil, it will lose practically nothing from the European embargo. Oil is now so expensive that even with discounts, the Russian budget will receive huge sums, which is positive for the Russian economy. General conclusions Based on the analysis, I still conclude that the construction of wave 5-E. If so, now is still a good time to sell the European currency with targets located around the 1.0355 mark, which corresponds to 261.8% Fibonacci, for each MACD signal "down". Now the construction of an internal correction wave 5-E can proceed, which can be interpreted as the fourth.
On a larger scale, it can be seen that the construction of the proposed wave D has been completed, and the instrument regularly updates its low. Thus, the fifth wave of a non-pulse downward trend section is being built, which turns out to be as long as wave C. The European currency will still decline for some time. The material has been provided by InstaForex Company - www.instaforex.com |
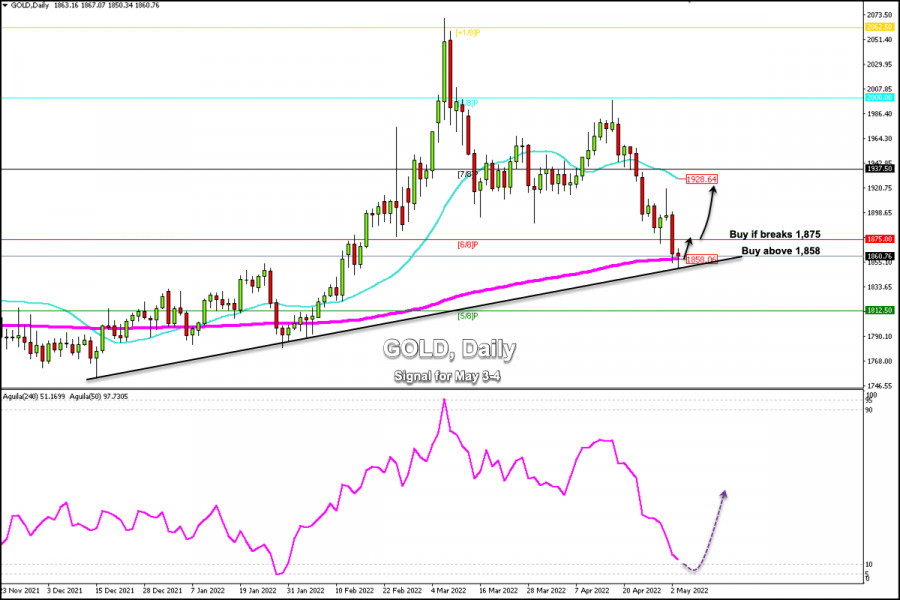
| Trading Signal for Gold (XAU/USD) for May 03-04, 2022: buy above $1,858 (200 EMA - uptrend channel) Posted: 03 May 2022 07:40 AM PDT
In the European trade, Gold (XAU/USD) reached a new low of 1,850, the price level of February 15. Gold is currently trading at 1,860, above the 200 EMA and below the 21 SMA. According to the daily chart, we can see that gold has touched the uptrend channel formed on December 15, 2021. As long as the metal keeps trading above 1,850, it is likely to recover part of its losses and could reach the level of 1,930 in the next few days. On the other hand, a daily close below 1,850 will be the start of a medium-term downtrend and we could expect a continuation of the bearish move. Gold could reach 5/8 Murray at 1,812.50. 10-year Treasury bond yields reached the highest level since December 2018 at 3.00%. It puts downward pressure on gold. However, in the American session, it is retreating, which relieves the downward pressure on gold. Yields remain high as investors trust the aggressive stance of the Fed. All traders, the stock and currency markets are waiting for the US central bank to raise interest rates by 0.50% to 1% so far. This data will be published tomorrow in the afternoon of the American session. Our trading plan is to buy above the 200 EMA around 1,858 with targets at 1,875. A sharp break and close above 1,875 on the daily chart will be a good signal to buy with targets at 1,900 and 1,928. The eagle indicator on the daily chart is reaching the zone 10-point which represents a strongly oversold level. If gold manages to trade above 1,875, it could be a key sign that the price could extend its bounce in the coming days and reach 1,900. The material has been provided by InstaForex Company - www.instaforex.com |
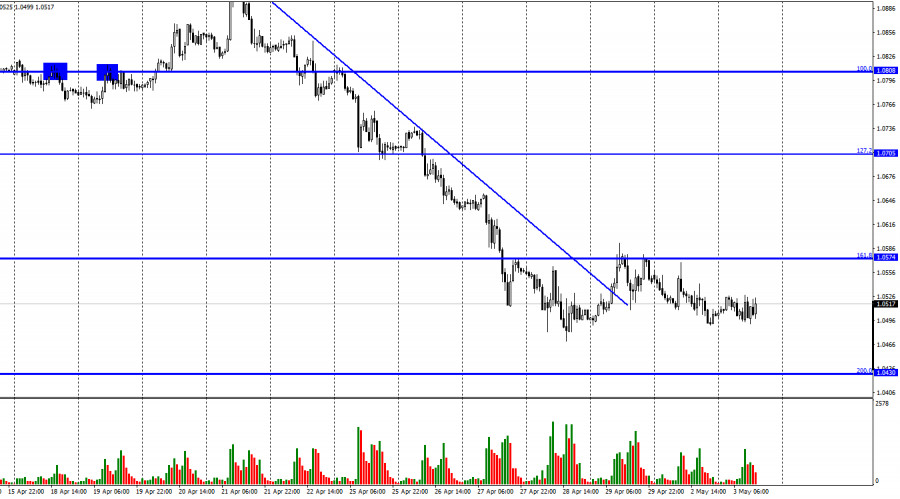
| Forecast for EUR/USD on May 3. Traders have started a new week and month very calmly Posted: 03 May 2022 05:47 AM PDT
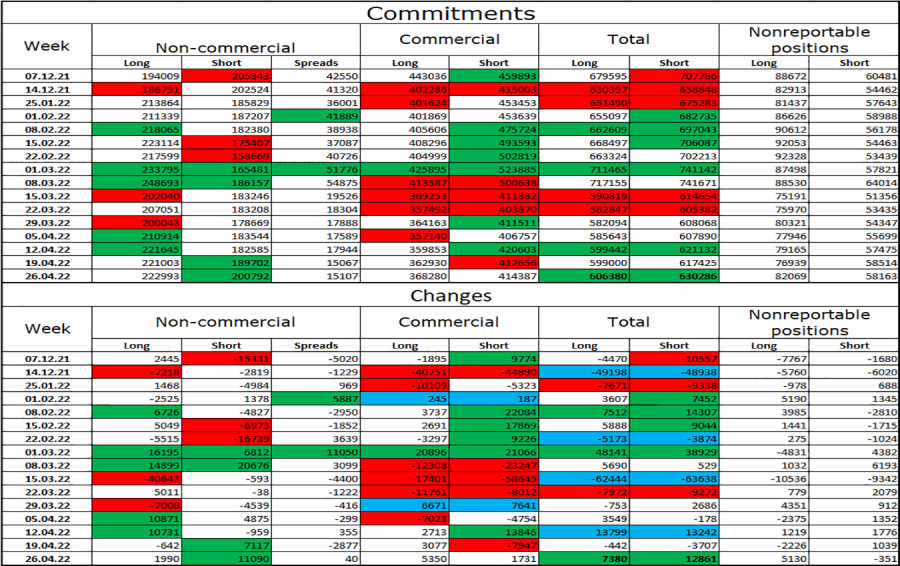
The EUR/USD pair was trading in the range of 1.0490-1.0570 on Monday and Tuesday. This range is located below the important corrective level of 161.8% (1.0574), the rebound from which allows us to expect a further drop in quotes in the direction of the next Fibo level of 200.0% (1.0430). Nevertheless, it was not possible to continue the fall yesterday and today, but bear traders are not retreating from the market and are waiting. They are waiting for new reports or news that will emphasize the feasibility of new euro sales. However, the very fact that the pair cannot close even above the 1.0574 level closest to it, from my point of view, says a lot. And it says specifically that traders are not in the mood to buy euros right now for sure. Sales have been suspended for the time being, but they can resume at any time before closing above the 1.0574 level. A lot of interesting things are going to happen this week. A new package of sanctions against the Russian Federation should be approved by the European Union, which will include the disconnection of several more banks from the SWIFT system, as well as the gradual refusal of EU countries from buying oil and gas in Russia. At the same time, the European Union is still not ready to block all energy supplies from Russia, but I believe that it is moving towards this step in full swing. The European Union understands perfectly well that it will have to give up, because otherwise, after the next elections, other politicians will be at the helm of the euro block. The level of support for Ukraine in the EU countries is off the scale, many countries believe that if Ukraine falls under the onslaught of the Russian Federation, then Russian troops will move to the Baltic States or Poland. For this reason, Finland and Sweden may submit official applications for NATO membership in the near future, as the events of the last two months show a high probability of new "special operations". The Finnish authorities want to build a fence on the border with Russia. I would also like to note that the process of Europe's rejection of Russian oil and gas has already begun since Gazprom itself refused further supplies to Poland and Bulgaria last week. The Ukrainian-Russian conflict persists, but recently there is only no advance of Russian troops, but even attempts to move forward everywhere except the Donetsk region. On the 4-hour chart, the pair secured under the corrective level of 100.0% (1.0638). Thus, the process of falling can be continued in the direction of the corrective level of 127.2% (1.0173). The downward trend corridor still characterizes the mood of traders as "bearish". There are no signals for the growth of the pair at this time. There are no brewing divergences. Commitments of Traders (COT) Report:
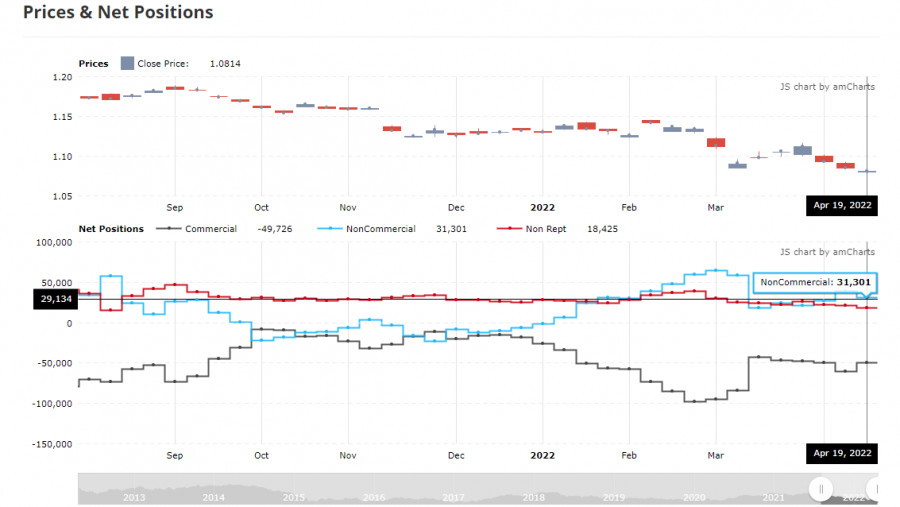
Last reporting week, speculators opened 1,990 long contracts and 1,1090 short contracts. This means that the bullish mood of the major players has weakened again, for the second week in a row. The total number of long contracts concentrated on their hands now amounts to 223 thousand, and short contracts - 201 thousand. Thus, in general, the mood of the "Non-commercial" category of traders is still characterized as "bullish", and with such data, the European currency continues its decline in pair with the dollar. As I have already said, the COT data indicate that the euro should grow, and this pattern has persisted over the past few months. Thus, it is impossible to draw adequate conclusions from the COT reports now. A very strong influence on the mood of traders is the possible continuation of hostilities in Ukraine, the deterioration of relations between Europe and the Russian Federation, new sanctions against Russia, and the weakness of the ECB's position. News calendar for the USA and the European Union: EU - unemployment rate (09:00 UTC). EU - ECB President Christine Lagarde will deliver a speech (13:00 UTC). On May 3, the European Union released an unemployment report (decreased from 6.9% to 6.8%), and a little later the speech of ECB Director Christine Lagarde will begin. In America, the calendar of economic events is empty today. The impact on the mood of traders will be present only if Lagarde makes important statements. EUR/USD forecast and recommendations to traders: I recommended selling the pair if a close is made under the 1.0574 level on the hourly chart with a target of 1.0430. New sales when rebounding from the 1.0574 level for the same purpose. I recommend buying the pair if a close is made above the 1.0574 level with a target of 1.0705. The material has been provided by InstaForex Company - www.instaforex.com |
| Forecast for GBP/USD on May 3, 2022 Posted: 03 May 2022 05:47 AM PDT
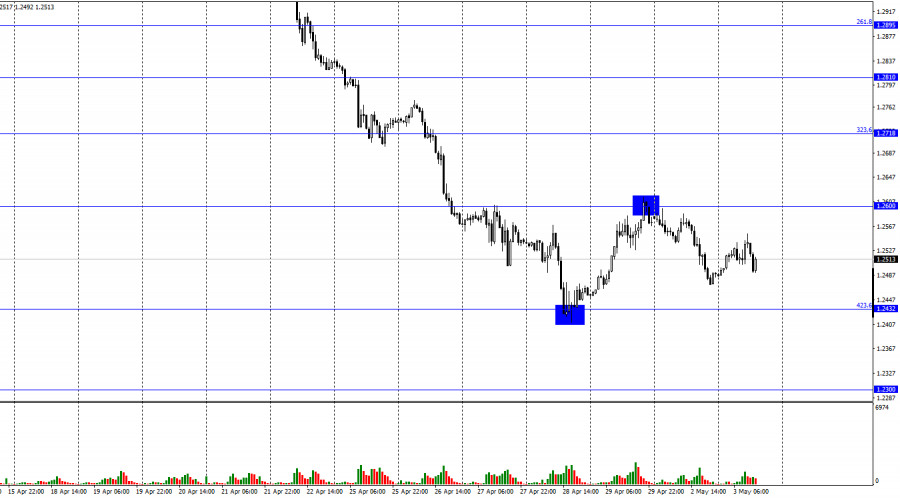
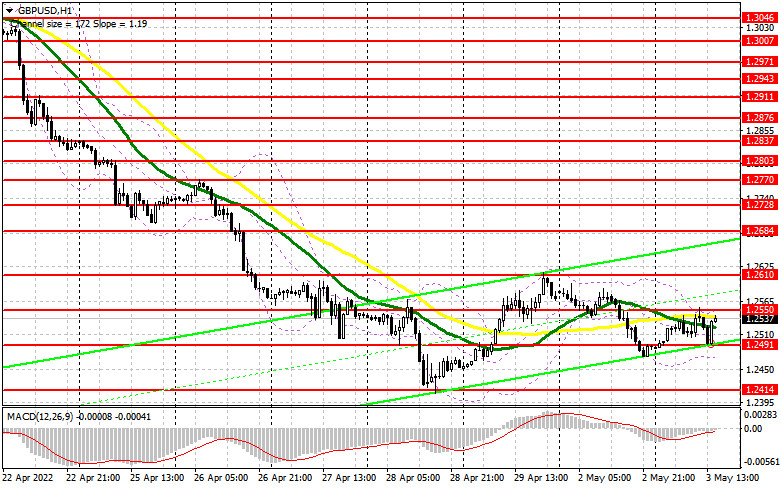
According to the hourly chart, the GBP/USD pair performed a new fall in the direction of the corrective level of 423.6% (1.2432) on Monday, and on Tuesday - a reversal in favor of the UK currency and some growth in the direction of the level of 1.2600. A new rebound from this level will again work in favor of the US currency and a new fall in the direction of the 1.2432 level. Closing above 1.2600 will allow traders to count on a stronger growth of the British dollar in the direction of the corrective level of 323.6% (1.2718). The information background in the first two days of the week was practically absent for the pound. Most of the news related to the new UK sanctions against Russia, as well as new arms supplies to Ukraine. So Boris Johnson announced a new package of military assistance to Kyiv of 390 million pounds. London has also imposed restrictions on the export to Russia of certain goods that can be used in military aggression against Ukraine. The pound did not respond to these reports in any way. This week, the Fed and the Bank of England will meet, and we will get a huge amount of food for thought. Traders are confident that both central banks will raise interest rates. The main question is what their next actions will be. If the Fed has already stated many times that it is ready to raise the rate at every meeting in 2022, then the Bank of England, on the contrary, a new rate hike may be the last. Both the US and the UK are now openly talking about a possible recession of the economy, and the indicators of the state of the economies will have to be analyzed by monetary committees. The conclusions that will be announced after the meetings will have to suggest in which direction both central banks will move. I don't see yet how the overall picture for a pound can change dramatically. The Bank of England is required to be as hawkish as possible for the 1.2600 level to be submitted to traders.
On the 4-hour chart, the pair performed a reversal in favor of the UK currency after the formation of a bullish divergence at the CCI indicator. The growth process began in the direction of the corrective level of 100.0% (1.2674), and the rebound from this level will allow traders to expect a reversal in favor of the US currency and a resumption of the fall in the direction of the Fibo level of 127.2% (1.2250). Commitments of Traders (COT) Report:
The mood of the "Non-commercial" category of traders has changed a lot again over the past week. The number of long contracts in the hands of speculators increased by 3,625 units, and the number of short - by 14,332. Thus, the general mood of the major players has become even more "bearish". The ratio between the number of long and short contracts for speculators still corresponds to the real picture on the market - longs are 2.5 times more than shorts (110057 - 40436). The big players continue to get rid of the pound. Thus, I expect the pound to continue its decline over the coming weeks. Other factors are talking about the fall of the pound sterling, but still, the pound is a pretty strong currency, so I would not bury it hopelessly. News calendar for the USA and the UK: UK - PMI index for the manufacturing sector (08:30 UTC). On Tuesday, the index of business activity in the manufacturing sector was released in the UK and it amounted to 55.8, which is slightly higher than last month. In the USA, the calendar of economic events is empty today. The influence of the information background on the mood of traders today will be absent. GBP/USD forecast and recommendations to traders: I recommended selling the British with a target of 1.2432 when rebounding from the level of 1.2600. Now, these deals can be kept open. Purchases of the British can be started at a new rebound from the level of 1.2432 or when fixed above the level of 1.2600. In the first case, the target is 1.2600, in the second – 1.2718. The material has been provided by InstaForex Company - www.instaforex.com |
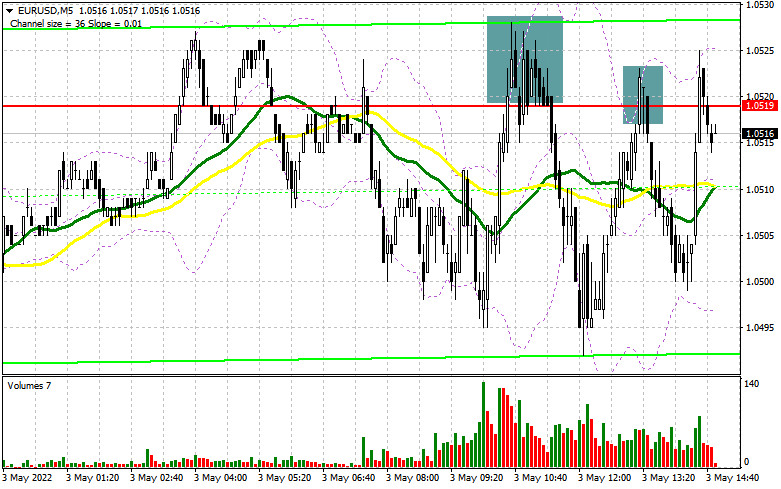
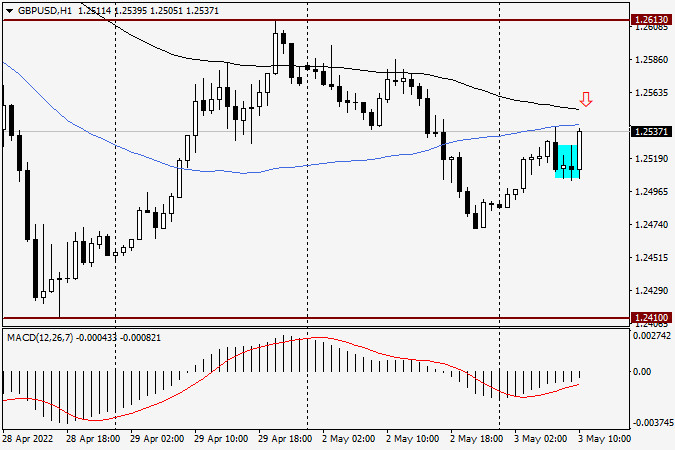
| Posted: 03 May 2022 05:47 AM PDT In my morning forecast, I paid attention to the level of 1.2524 and recommended making decisions on entering the market. Let's look at the 5-minute chart and figure out what happened. The unsuccessful attempt of the bears to break above 1.2524 from the first time led to a false breakdown and a signal to sell the pound. Unfortunately, the released good data on production activity limited the downward potential, so the downward movement was about 20 points. After that, the bulls achieved a breakthrough of 1.2524 with a reverse test from top to bottom. This led to a buy signal, but it turned out to be unprofitable. After moving up by 10 points, the bears regained the initiative. And what were the entry points for the euro this morning?
To open long positions on GBP/USD, you need: Due to several not quite profitable signals in the first half of the day, I revised the technical picture. During the American session, several not very important statistics are released, so we can count on another attempt by the bulls to seize the initiative. Reports on changes in the volume of production orders and the level of vacancies and labor turnover from the Bureau of Labor Statistics are expected. Very good indicators will lead to a decline in GBP/USD in the afternoon, which new buyers can and should take advantage of - if they exist. In this case, only the protection of the nearest support 1.2491, formed at the end of the first half of the day, as well as the formation of a false breakdown on it will give a signal to open long positions against the trend in the expectation of continuing the upward correction and a breakdown of 1.2550, which we failed to do in the first half of the day. You can expect a more sharp upward jerk, but only after the demolition of the bears' stop orders above 1.2550. A test of this level from top to bottom will give a buy signal already with the aim of correction to the area of 1.2610. A similar consolidation above this level will lead to the highs: 1.2684 and 1.2728, where I recommend fixing profits. In the case of a decline in the pound and the absence of buyers at 1.2491, it is best to postpone purchases until the next support of 1.2414. I also advise you to enter the market there only if there is a false breakdown. It is possible to buy GBP/USD immediately for a rebound from the minimum of 1.2369 and only for a correction of 30-35 points within a day. To open short positions on GBP/USD, you need: The bears retreated, but they did not stop controlling the market. In the case of GBP/USD growth during the US session after weak US data, sellers should do everything to keep the pair above 1.2550. The formation of a false breakdown at this level will be an excellent sell signal. You can also count on a breakdown of the 1.2491 level, but only after strong statistics on the United States. A breakout and a reverse test from the bottom up of this range will lead to the formation of an additional sell signal that can collapse the pound to lows in the area of 1.2414, where I recommend fixing the profits. The 1.2369 area will be a more distant target, but it will be quite difficult to hope for the implementation of this scenario. With the option of further growth of GBP/USD and the lack of activity at 1.2550, which is more likely to be true, a new upward jerk may occur against the background of the demolition of stop orders. In this case, I advise you to postpone short positions to a larger resistance of 1.2610, from where the bears recently staged a good sale. I also advise you to open short positions there only in case of a false breakdown. You can sell GBP/USD immediately for a rebound from 1.2684, counting on the pair's rebound down by 30-35 points within a day.
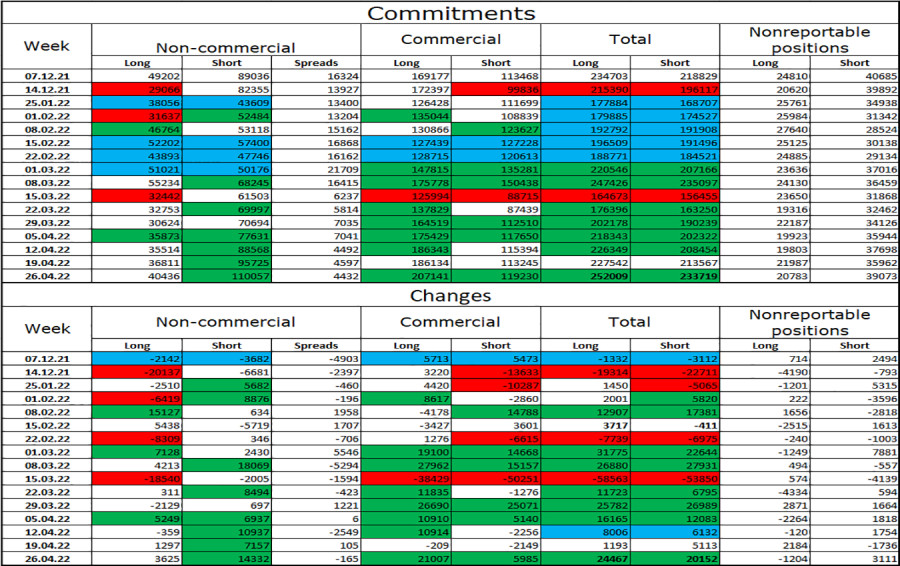
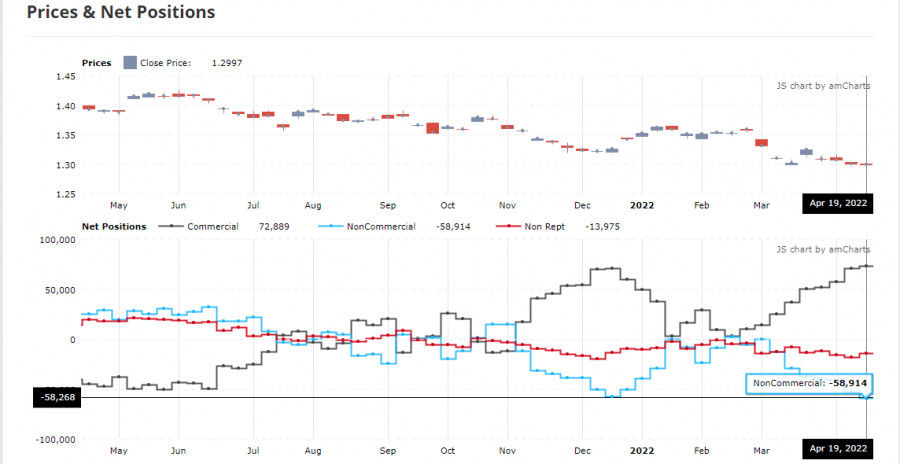
The COT report (Commitment of Traders) for April 19 recorded an increase in both short and long positions, but the former turned out to be much larger, which is obvious if you look at the GBP/USD chart. Things are very bad in the UK economy, which was confirmed last week by the Governor of the Bank of England, Andrew Bailey. His statements that the economy is heading towards recession were the last straw holding back the sellers of the pound in the second half of April. As a result, the breakdown of the finished minimum and a new major sale of the pound have already driven the trading instrument below the 26th figure and it seems that this is not the end. The growth of the consumer price index is steadily moving towards double-digit indicators, and the increasingly complicated situation in the world due to supply chain disruptions against the background of a new wave of COVID-19 in China creates even more problems. The situation will only worsen, as future inflation risks are now quite difficult to assess due to the difficult geopolitical situation, but the consumer price index will continue to grow in the coming months. The situation in the UK labor market, where employers are forced to fight for every employee by offering higher and higher wages, is also pushing inflation higher and higher. The pressure on the pound is also growing for another reason - the aggressive policy of the Federal Reserve System. Already during the May meeting, the committee may announce an increase in interest rates by 0.75% at once - they do not have such problems as in the UK with the economy yet. The COT report for April 19 indicated that long non-profit positions rose from the level of 35,514 to the level of 36,811, while short non-profit positions jumped from the level of 88,568 to the level of 95,727. This led to an increase in the negative value of the non-commercial net position from -53 054 to -58 268. The weekly closing price decreased from 1.3022 to 1.2997.
Signals of indicators: Moving averages Trading is conducted around 30 and 50 daily moving averages, which indicates the lateral nature of the market. Note: The period and prices of moving averages are considered by the author on the hourly chart H1 and differ from the general definition of the classic daily moving averages on the daily chart D1. Bollinger Bands In the case of a decline, the lower limit of the indicator around 1.2470 will act as support. Description of indicators
|
| Posted: 03 May 2022 05:47 AM PDT In my morning forecast, I paid attention to the 1.0519 level and recommended making decisions on entering the market from it. Let's look at the 5-minute chart and figure out what happened there. An unsuccessful attempt to grow after the release of statistics on the eurozone led to a false breakdown in the area of 1.0519 and to a signal to sell the euro, which resulted in a 25-point sell-off. After updating the daily low, the pair returned to the 1.0519 area again and formed a similar false breakdown - again a sell signal, but at the same time, the downward movement was only about 20 points. And what were the entry points for the pound this morning?
To open long positions on EURUSD, you need: The sharp jump in producer prices in the eurozone did not surprise anyone, while the data on the labor market and the unemployment rate coincided with economists' forecasts, which kept trade within a narrow side channel. Considering that the technical picture has not changed in any way for the second half of the day, I advise you to rely on the previous levels adhering to the previous strategy. In the case of strong US data and changes in the volume of production orders, the pair will quickly fall to 1.0473, which we did not reach quite a bit in the first half of the day. The optimal scenario for buying from there will only be the formation of a false breakdown to return the initiative, which the bulls have completely lost. In case of weak statistics, we can expect the pair to recover back to 1.0519, where the moving averages are already playing on the sellers' side. A breakout and a test of 1.0519 from top to bottom form a new signal for entering long positions, opening the possibility of returning to the area of 1.0565, where I recommend fixing the profits. A more distant target will be the 1.0619 area. If EUR/USD declines and there are no buyers at 1.0473, and this is more likely, especially considering tomorrow's Fed meeting and central bank policy, it is best to postpone long positions. The optimal scenario for buying would be a false breakdown near the new annual low of 1.0426. It is possible to open long positions on the euro immediately for a rebound only from 1.0394, or even lower - around 1.0347 with the aim of an upward correction of 30-35 points within a day. To open short positions on EURUSD, you need: Sellers control the market, actively protecting 1.0519. They now face a rather difficult task to further preserve the initiative, and for this, they need to update the annual lows below 1.0473. The optimal scenario for opening short positions will be the formation of a false breakdown at the level of 1.0519, similar to what I discussed above. This will lead to the first sell signal and a return of pressure on the pair to reduce to 1.0473. In the case of strong statistics on the United States, most likely in the afternoon, the whole fight will unfold. A breakdown and consolidation below 1.0473, as well as a reverse test from the bottom up, will give a signal to sell the euro, followed by reaching annual lows in the area of 1.0426 and with the prospect of updating 1.0394, where I recommend fixing the profits. A more distant target will be the 1.0347 area, but such a scenario is possible only after the bullish reaction of dollar buyers to tomorrow's Fed meeting. If the euro rises during the American session and there are no bears at 1.0519, nothing terrible will happen, but I expect a sharper upward jerk. In this case, the optimal scenario will be short positions when forming a false breakdown in the area of 1.0565. You can sell EUR/USD immediately on a rebound from 1.0619, or even higher - around 1.0652 with the aim of a downward correction of 25-30 points.
The COT report (Commitment of Traders) for April 19 recorded a sharp increase in short positions and a reduction in long ones. Recent statements by representatives of central banks have led to a new active sale of risky assets, as it became obvious to everyone that serious problems in the economies of developed countries cannot be avoided this year. And although the president of the European Central Bank noted in her speeches that the regulator plans to fully complete the bond purchase program by the end of the second quarter of this year, hinting at a rate hike in early autumn, this was not enough to support the euro. The more aggressive policy of the Federal Reserve System and expectations of a May rate hike of 0.75% at once support the dollar. Another problem is the threat of another economic paralysis due to strict quarantine restrictions in China against the background of a new wave of COVID-19, which has already led to a large-scale disruption in the supply chains of European and Asian countries. As a result, the US dollar continues to be in demand, which will continue to push the EUR/USD pair down. Russia's new active actions on the territory of Ukraine and the lack of progress in resolving the conflict also put pressure on the euro and will continue to do so. The COT report indicates that long non-commercial positions decreased from the level of 221,645 to the level of 221,003, while short non-commercial positions increased sharply from the level of 182,585 to the level of 189,702. It is worth noting that the decline of the euro makes it more attractive to investors, so the minimum closure of long positions is not surprising. At the end of the week, the total non-commercial net position decreased and amounted to 34,055 against 39,060. The weekly closing price collapsed and amounted to 1.0814 against 1.0855.
|
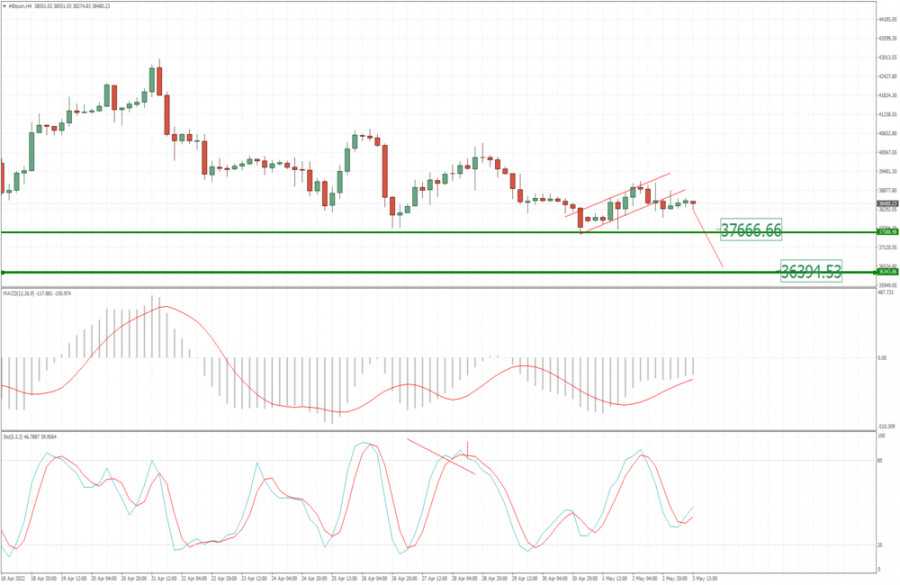
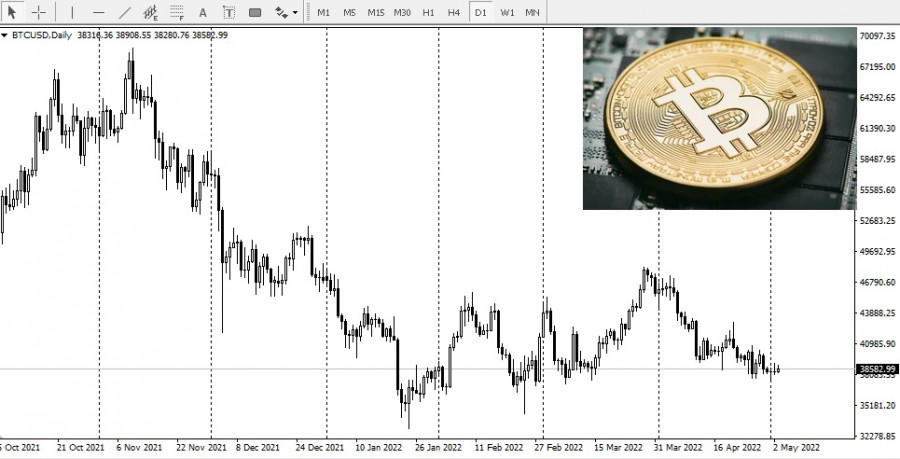
| BTC update for May 03,.2022 - Watch for the dowwnside continuation towards $37.656 Posted: 03 May 2022 04:47 AM PDT Technical analysis:
BTCUSD has been trading sideways at the price of $38.500 and I see potential for the downside continuation of the larger time frame trend. Trading recommendation: Due to the strong downside trend in the background and the broken bear flag, I see potential for the downside continuation. Watch for potential selling opportunities on the rallies with the downside objective at 1.0350. MACD oscillator is showing strong downside momentum, which is another confirmation that sellers are in control. Resistance is set at the price of $39.160 The material has been provided by InstaForex Company - www.instaforex.com |
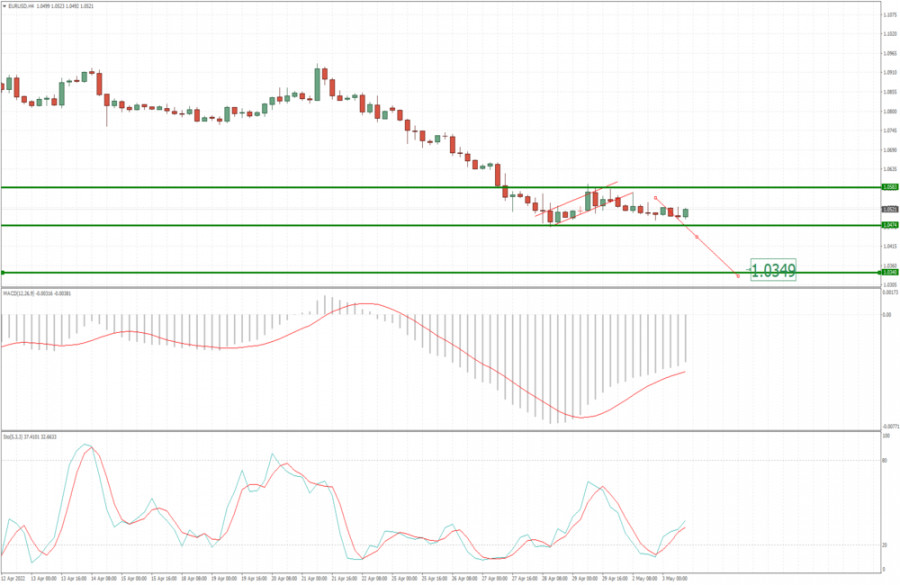
| EUR/USD analysis for May 03, 2022 - Potential for the downside continuation Posted: 03 May 2022 04:36 AM PDT Technical analysis:
EUR/USD has been trading downside as I expected. I still see EUR downside with potential test of the 1.0350. Trading recommendation: Due to the strong downside trend and the breakout of the bear flag in the background I see potential for further drop towards 1.0350. Watch for potential selling opportunities on the rallies with the downside objective at 1.0350. MACD oscillator is showing strong downside momentum, which is another confirmation that sellers are in control. Key resistance is set at the price of 1.5085 The material has been provided by InstaForex Company - www.instaforex.com |
| Analysis of Gold for May 03,.2022 - Potential for another drop towards $1.820 Posted: 03 May 2022 04:23 AM PDT Technical analysis:
Gold has been trading downside as I expected. I still see Gold downside with potential test of $1.820. Trend is still strongly to the downside. Trading recommendation: Due to the strong downside trend and the breakout of key pivot support at $1.885, I see potential for further drop towards $1.820. Watch for potential selling opportunities on the rallies with the downside objective at $1.820. MACD oscillator is showing strong downside momentum, which is another confirmation that sellers are in control. Key resistance is set at the price of $1.917 The material has been provided by InstaForex Company - www.instaforex.com |
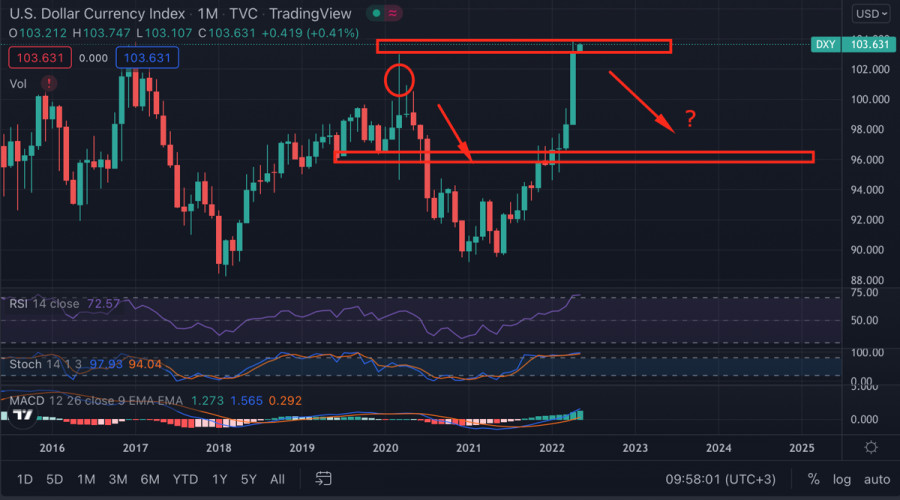
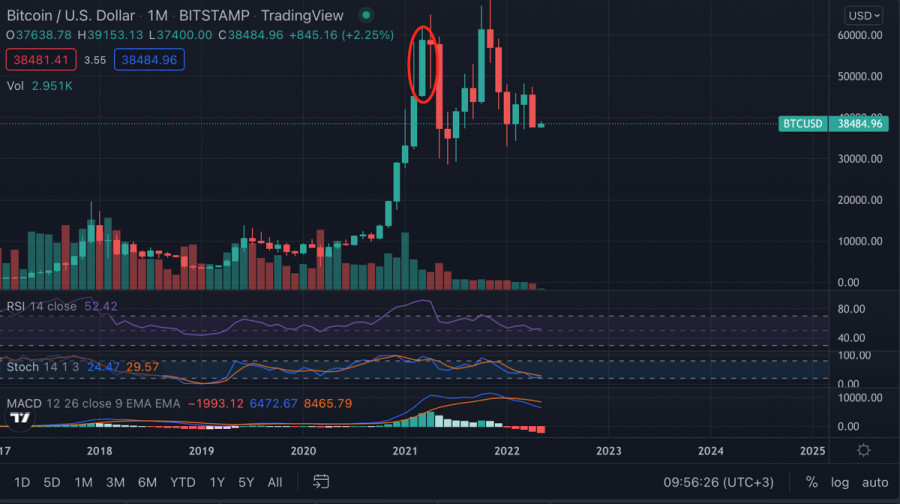
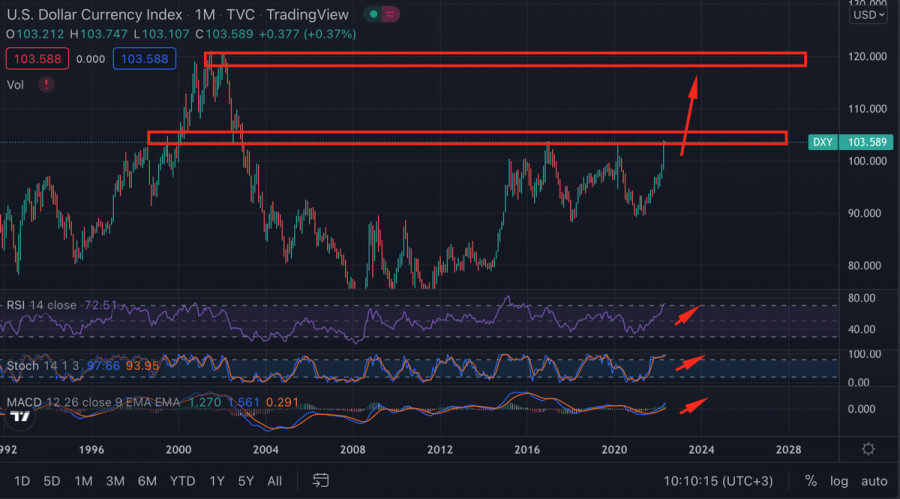
| US dollar index reaches swing high: should we expect rise in quotations of cryptocurrencies? Posted: 03 May 2022 03:37 AM PDT For the third month in a row, the Fed's entire policy has been aimed at reducing and withdrawing liquidity from high-risk markets and redirecting it into the US dollar. Almost all major financial instruments, which can be profitable in times of global turmoil, suffer from this policy. In addition to USD, government bonds and treasuries, which provide the US dollar, are benefiting. There is no reason to believe the situation will change given the rate hike. Regardless, we will try to put aside the fundamental backdrop and take apart an important component of the US dollar index movement, which may show some room for growth in other markets.
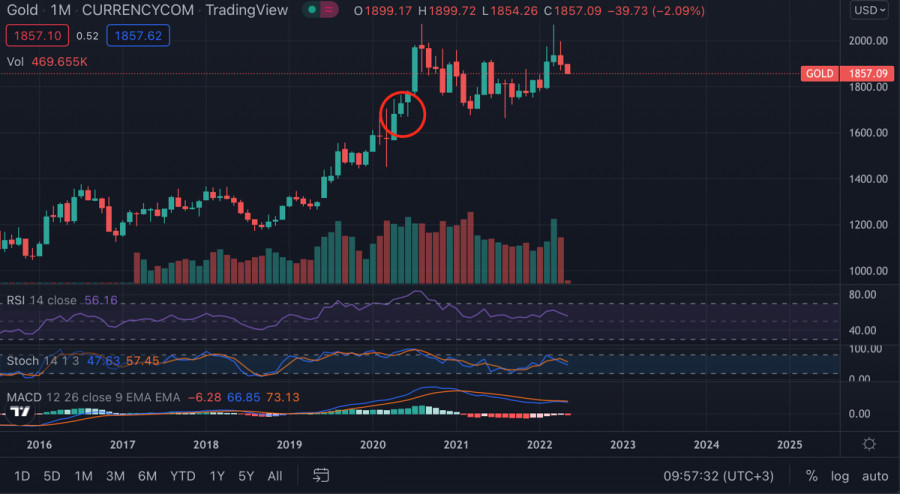
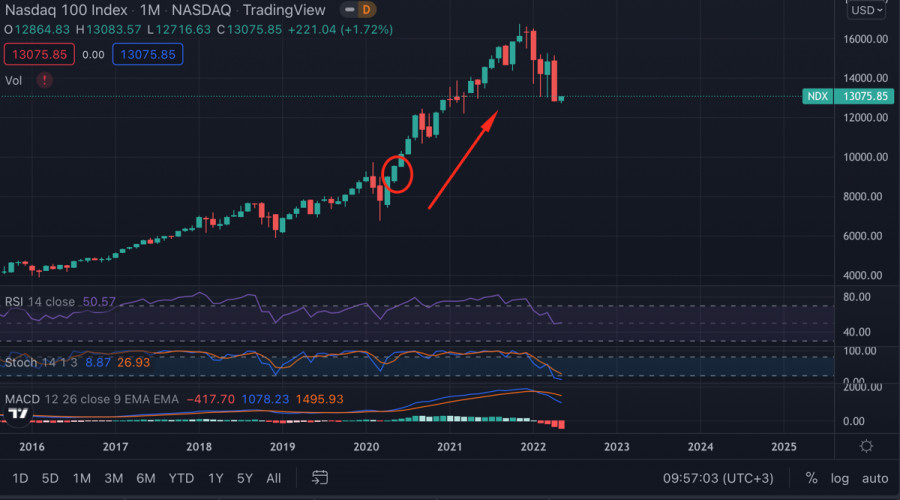
The US dollar index has maintained a continuous upward movement since June 2021. During this time, the index reached an important resistance area of 103. The asset did not manage to break through this level, but it consolidated slightly below it and is preparing for another rush. However, if you look at the monthly chart, you can see that the last time such a situation occurred was in 2016 and 2020. Each time the DXY started to decline and lost up to 15% of its value. It is also important to watch how other assets such as gold, NASDAQ, and Bitcoin behaved at this point.
If you watch the monthly time frames for 2020 of each of these assets, you can see the beginning or emergence of a strong uptrend. Given that, we can assume that if the DXY begins to correct, it will be a temporary weakening for other markets where liquidity will begin to flow in. However, how likely is that scenario? Considering the Fed meeting on May 4 and further key rate hikes, the US dollar is highly likely to break through this support zone.
Most likely, the asset will continue its upward movement to the level of 120. We can say that this is where the main stage of correction will start after the bull rally during the year. In this situation, it is important to understand that Bitcoin and the cryptocurrency market remain dependent on the US dollar. That is where most liquidity comes from, so when investing in cryptocurrencies, it is important to keep a close eye on the US dollar index. At least in 2022, this trading index will become the main index, as the Fed has announced it would curb inflation.
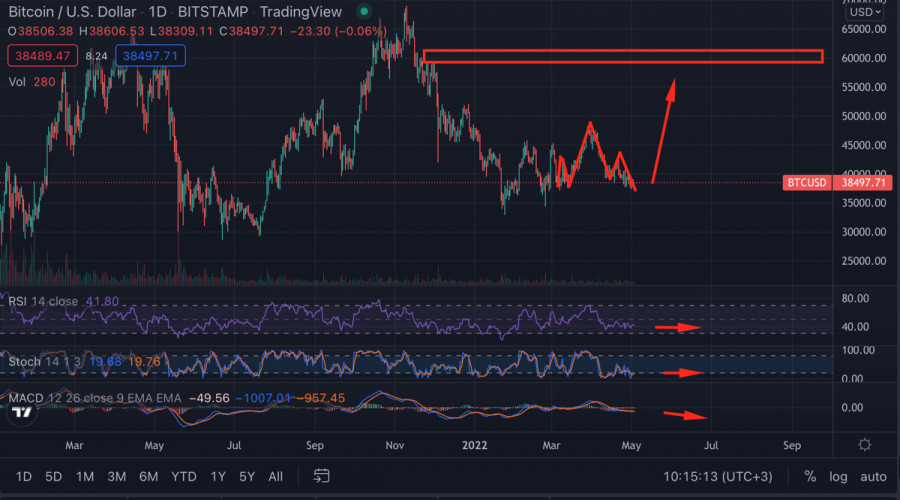
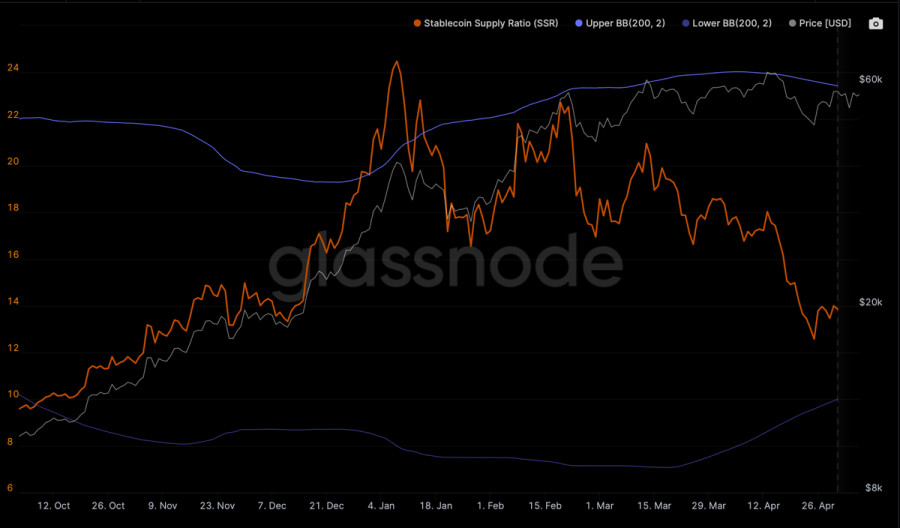
While analyzing this information, we can note that in the next two or three months Bitcoin and the cryptocurrency market will have a real chance to start a stable and upward movement. Meanwhile, a Head and Shoulders pattern has formed on the digital coin's daily chart. It is important to understand that the formation of the pattern was preceded by a downtrend, and as you may know, this pattern signals a reversal. Taking this into account, we can assume that the market has formed a signal for upward movement with the potential to rise to $60,000.
In the shorter term, we see buyers show weak activity and a gradual decline to the key support level of $37,400. Taking into account the decisions of the Fed in the coming days, we can expect two scenarios. The current consolidation ends with a breakout of the Bullish Wedge's upper boundary due to the key rate increase by 25 points, for which the market was ready. The second scenario suggests that the Fed will raise the rate to 0.75%, and the market begins a second wave of liquidity outflow from cryptocurrencies. In such a case, Bitcoin immediately declines into the range of $32,000-$35,000.
|
| Trading plan for Ethereum for May 03, 2022 Posted: 03 May 2022 03:20 AM PDT
Technical outlook:Ethereum pushed through the $2,860 highs intraday on Tuesday before finding resistance. The crypto has pulled back through the $2,830 levels at this point in writing and is expected to resume higher again soon. Also, note that bulls have managed to carve an Engulfing Bullish candlestick pattern over the weekend after bouncing back from sub $2,700 levels. Ethereum has carved a meaningful downswing between $4,850 and $2,140 earlier. The above is being retraced since then as the crypto has managed to terminate its sub-waves around $3,500 and sub $2,700 respectively. If the above structure holds well, pieces would stay above the $2,140 mark and continue pushing higher through the $3,800-4,000 zone. Ethereum is probably preparing to resume its third wave towards $3,800 at least before hitting resistance as seen on the chart here. On the flip side, if prices are able to break above $4,250 level, the Fibonacci 0.786 of the above downswing, bulls will be poised to push through fresh all-time highs above $4,850 before giving in to bears. Trading plan:Potential rally through $3,800-4,000 against $2,100 Good luck! The material has been provided by InstaForex Company - www.instaforex.com |
| Trading plan for Bitcoin for May 03, 2022 Posted: 03 May 2022 03:06 AM PDT
Technical outlook:Bitcoin pushed through the $39,000 mark on Monday after completing an Engulfing Bullish candlestick pattern over the weekend, right at the channel support. The above is encouraging to bulls as they prepare to push through the $50,000-55,000 mark at least going further. The crypto should ideally stay above the $34,000 mark to keep the structure intact. Bitcoin has been producing a potential countertrend rally since the $33,000 lows as seen on the daily chart here. The crypto has terminated two waves of the proposed corrective phase around the $45,000-48,000 and $37,400 levels respectively. If the above structure holds well, bulls might be preparing for the third wave higher towards the $50,000 mark at least. Alternatively, if prices manage to push through $61,000, which is the Fibonacci 0.786 retracement of the earlier drop between $69,000 and $33,000 levels, the probability remains for an all-time high above $75,000. Bears will be keen to regain control thereafter and drag prices through the $33,000 levels at least. Trading plan:Potential rally through $50,000-55,000 against $33,000 Good luck! The material has been provided by InstaForex Company - www.instaforex.com |
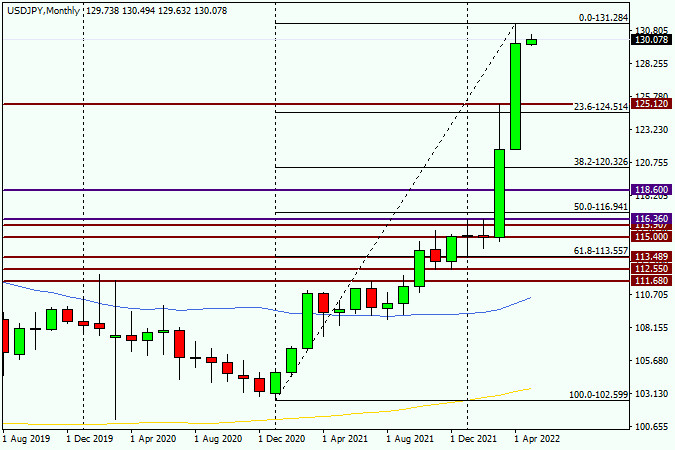
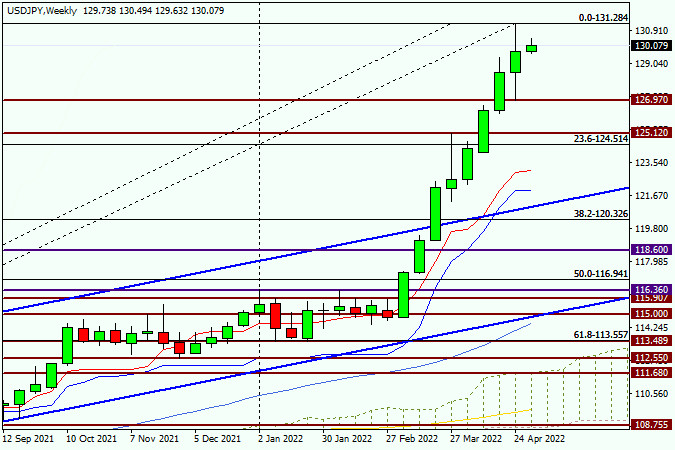
| Technical analysis and forecast for USD/JPY on May 3, 2022 Posted: 03 May 2022 03:00 AM PDT Since yesterday we did not have time to consider another major currency pair USD /JPY, we will do it today, and start with the results of the recently ended month of April. As you know, judging by the title of this article, it will be of a pronounced technical nature. However, given the most important event of this week, which tomorrow will be the decision of the US Federal Reserve System (FRS) on the main interest rate, a few words about this event, so expected by the market. Again, I have to remind you that market expectations regarding the tightening of the Fed's monetary policy are so high that, it would seem, there is simply nowhere higher. Naturally, such expectations are already more embedded in the price of the US dollar, so if the Fed and Jerome Powell personally disappoint the markets, I'm afraid the US currency is in for a lot of trouble. In case of insufficient tightening of monetary policy and (or) less hawkish rhetoric of Fed Chairman Powell, the old market rule may work - buy on expectations, sell on facts. By the way, we have already seen something similar with you recently, when the Fed made the first rate increase by 25 basis points after COVID-19. Even then, it seemed to the market to be an insufficient measure. It's no secret that many major bidders expect the Fed's May meeting to raise the rate by 75 bps at once, but the consensus forecast provides for an increase in the federal funds rate by only 50 basis points. At the same time, it is simply necessary to take into account the tone of Jerome Powell's speech at the final press conference. As for the Bank of Japan, it has traditionally taken a clearly "dovish" position in its monetary policy. It is this difference that has recently been the main driver for the growth of the US dollar paired with the Japanese yen. Monthly
As can be seen at the oldest time interval, last month the USD/JPY pair showed more than impressive growth, as a result of which the pair reached peaks 20 years ago near 131.00. However, there is a limit to everything, and such round and important psychological levels, which is 130.00 in this situation, most often from the first attempts do not breakthrough. This is exactly what we are seeing at the moment of trading, which is being conducted just near this landmark level. And the closing of April at 130.00 at the level of 129.76 demonstrates that the players on the course increase have problems with passing the 130.00 mark. At the beginning of this month, the bulls on the instrument tried to resume the rise of the quote but came across resistance from sellers, which runs at a strong technical level of 130.50. I assume that a lot will be decided for USD/JPY tomorrow evening after the announcement of the rate decision and the press conference of the head of the Fed. In the meantime, purely technically, looking at the monthly chart, there is every reason to expect further growth in the quote. However, before that, there may be a correction to the previous very strong growth. Weekly
But the closing of the last week of April trading does not look so unambiguous, as indicated by the almost equidistant and rather long shadows of the last candle. In my personal opinion, we should not rule out a corrective pullback towards the level of 127.00, where the minimum trading values of last week were shown. If this happens, and candle signals for opening purchases begin to appear at smaller time intervals, I think it's worth taking advantage of this. That's all for now. One of these days we will return to the consideration of this trading instrument and try to more clearly identify the trading recommendations for USD/JPY. The material has been provided by InstaForex Company - www.instaforex.com |
| Investors brace for biggest US rate hike since 2000 Posted: 03 May 2022 02:34 AM PDT
Bonds fell around the world as investors braced for the biggest US rate hike since 2000 and a wave of policy tightening by other central banks. The drop in prices sent stocks and futures on US indices higher.US 10-year bond yields traded around 3% after hitting a milestone on Monday. Germany's benchmark rate rose above 1% for the first time since 2015, while the corresponding UK bond yield climbed above 2%. Australian bonds slid, and the currency jumped, after the nation's central bank increased borrowing costs by more than many had expected.Meanwhile, investors betting that global bonds are still expensive took shelter in equities.Futures on the S&P 500 and Nasdaq 100 indices were up at least 0.1%, while the European benchmark Stoxx50 added 0.6%. However, trading was volatile amid growing nervousness about rising yields.
Markets are getting whipsawed between concerns around persistent inflationary spirals and risks to global growth from rising yields, China's Covid lockdowns and Russia's war in Ukraine.
"The right strategy right now is to position for inflation - a clear and present fact - rather than recession, which is still only a possibility," Solita Marcelli, chief investment officer for the Americas at UBS Global Wealth Management, wrote in a note.
|
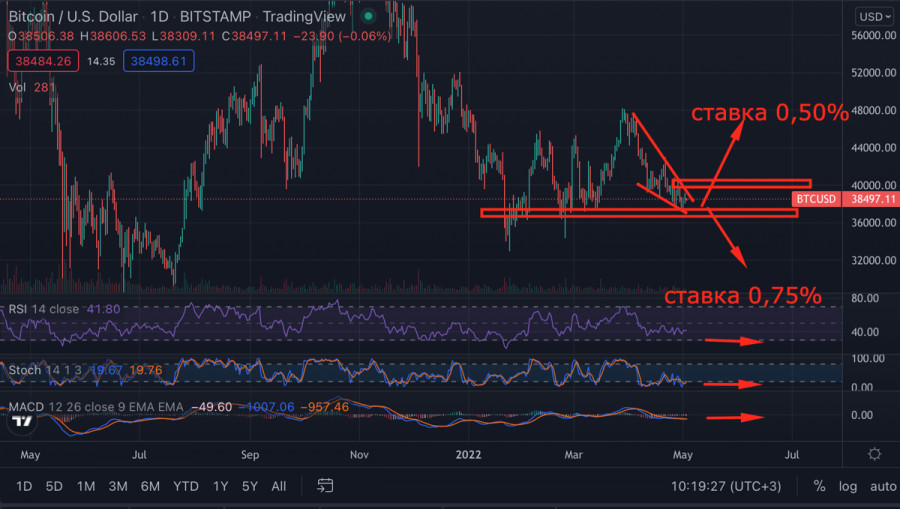
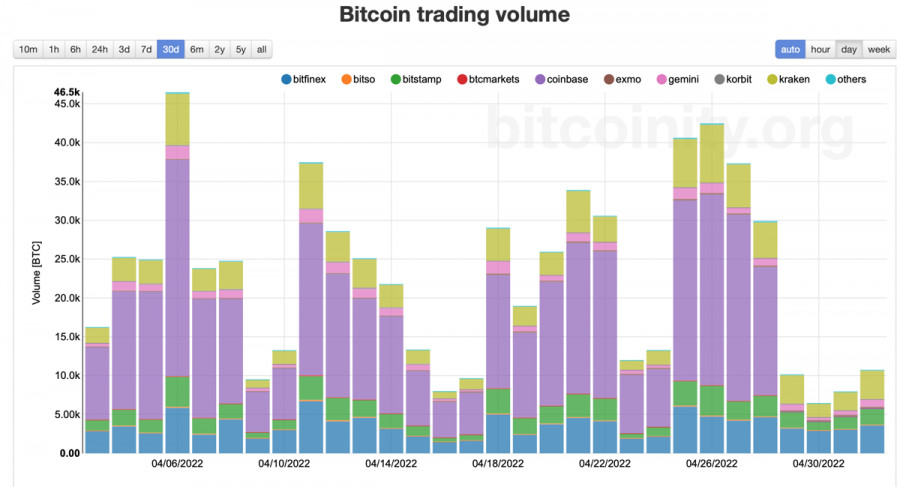
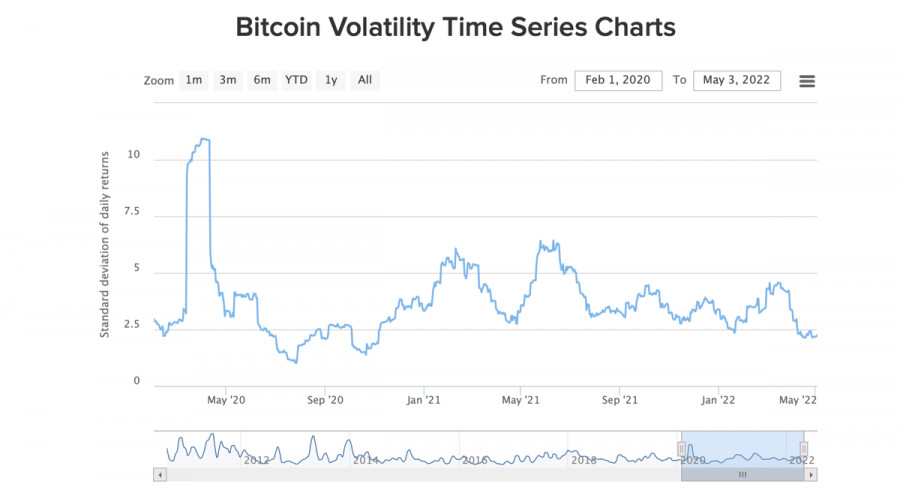
| Rising volatility and trading volumes: What to expect from Bitcoin after the Fed meeting? Posted: 03 May 2022 02:32 AM PDT Over the last month, Bitcoin has reached several milestones. The first one, which is positive, is that the volatility level of the asset has reached an all-time low. For a high-risk instrument, this is an important signal that increases its attractiveness for institutional traders. The second indicator is negative and represents a 30% decrease in Bitcoin trading volumes. These facts are interrelated and stem from the influence of geopolitical events and the subsequent reaction of state regulatory authorities to them. The decline in trading volumes was due to the Federal Reserve's policy of tightening liquidity and winding down the quantitative stimulus program. As a result, the volume of liquidity in the market decreased, the cryptocurrency market began to maintain a downtrend, and investors moved their capital to more promising sectors. All of this led to a gradual decline in the price without buyers attempting to protect important boundaries and a lack of upward momentum, a gradual decline, and a decrease of interest in the asset from new investors.
As a result, Bitcoin got rid of retail and short-term speculative traders, which accounted for about 18% of the total number of investors in mid-March. The volatility of the asset began to fall and specific trends began to show up more clearly in the cryptocurrency's charts. On the one hand, this is quite good, as lower volatility was a major necessity for big investors to enter the market. However, it is ironic that this happened when the asset was not needed as a means of payment.
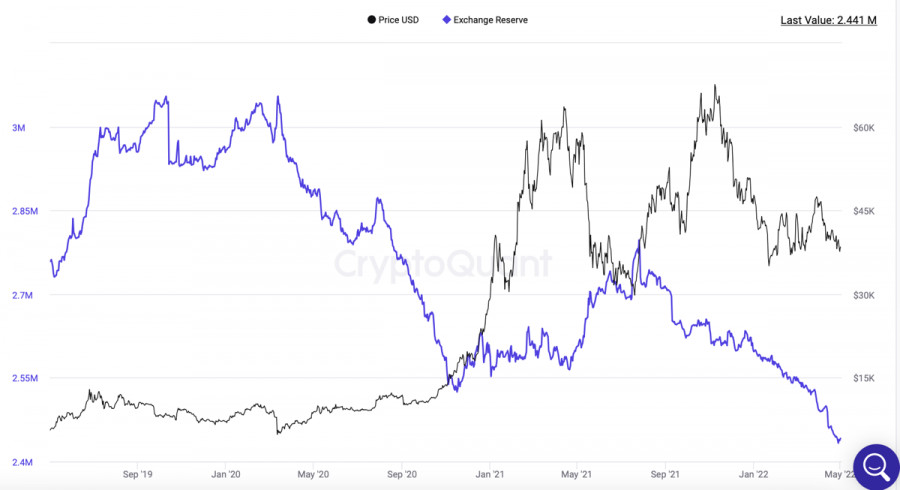
Another important reason for the decrease in volatility was the active accumulation phase. According to CryptoQuant, the volume of BTCs on exchanges has reached its lowest level since 2018. This prevents additional pressure on the coin's quotes and also reduces the influence of short-term traders on Bitcoin.
The current state of the cryptocurrency has its pros and cons, but very soon it will not be so important. On May 4, the Fed's two-day meeting starts, and there is every reason to believe that the key rate will be raised by 50 basis points at once. The market is already preparing for this, as evidenced by the accumulation of stablecoin volumes and the lack of a fight for important support areas. Most likely, the market is preparing to catch the major cryptocurrency between $32,000 and $35,000. During the week after the end of the meeting, we should expect a sharp drawdown of the stock and cryptocurrency markets.
We should subsequently expect a series of similar decisions from European central banks. All this may drag Bitcoin to the range of $32,000-$35,000, where investors will need massive amounts of stablecoins. However, even if the situation unfolds like this, there is a possibility of further price declines. This is due to general market sentiment, which will intensify many times after the price drops to $32,000-$35,000. Notably, more than 80% of BTC was in profit when the price was around $40,000. The main buying area was the range of $35,000-$40,000, so there is every reason to believe that in the first weeks the growth of trading volumes and volatility will negatively affect the BTC/USD pair.
As of May 3, Bitcoin forms the Bullish Wedge pattern on the daily chart. It is likely that the rate hike has been already priced into the asset and the market will meet the results of the meeting calmly. In this case, there will be a bullish breakout of the range toward $40,000. However, investors may not expect the rate to rise by 50 points at once and this scenario is more likely to occur. In this case, the asset may fall into the area of $32,000-$35,000. Technical indicators remain sideways and MACD is moving below zero. All this points to the lack of large volumes from buyers, and most likely, the price will continue its downward movement. The material has been provided by InstaForex Company - www.instaforex.com |
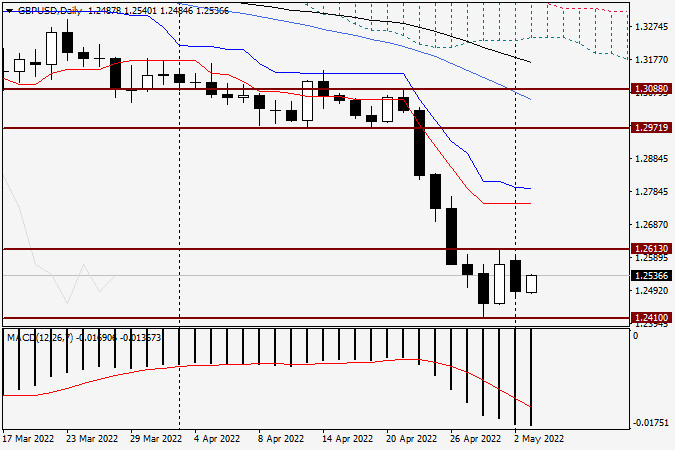
| Analysis and forecast for GBP/USD on May 3, 2022 Posted: 03 May 2022 02:25 AM PDT At yesterday's trading, the pound/dollar currency pair was in solidarity and essentially repeated the price dynamics of the euro/dollar. However, it is necessary to understand that yesterday was the first trading day during which the market often swings, and the most important events of this super busy trading week are still ahead. Let me remind you once again that tomorrow the US Federal Reserve System (FRS) will make its decision on the interest rate, after which a press conference will be held by Fed Chairman Jerome Powell, and the next day the Bank of England will publish its verdict on the rate. It is expected that both Central Banks will raise their rates - the Fed by 50 basis points, and the Bank of England by 25 bps. Nevertheless, as already noted in previous reviews on GBP/USD, the Bank of England will adhere to more "dovish" rhetoric, which will be facilitated by a weaker economic situation in the UK than in the USA. However, inflation continuing its growth on the shores of the UK may push the British Central Bank to a tougher tone. Meanwhile, do not forget about the likelihood of stagflation, which puts the Bank of England in an extremely ambiguous and contradictory position. Well, the British regulator will have to analyze the current economic situation once again and choose the further direction in its monetary policy. In my own opinion, the BoE will continue its fight against high inflation by raising rates, although this will happen at a much more restrained pace than their colleagues from the Fed. If so, then the US dollar has every chance to continue to steer in a pair with the British pound. In the meantime, pay attention to the price charts. Daily
After Friday's corrective growth to 1.2613, the pound retreated and closed trading on April 29 at 1.2570, after which it can be concluded that the market is not yet eager to trade GBP/USD above 1.2600. The course of yesterday's trading, with the closing price below the most important psychological level of 1.2500, confirmed this assumption. Nevertheless, it is worth noting that in the current situation, trading on the pound/dollar pair takes place in the range of 1.2613-1.2410, the exit from which can determine the immediate prospects of this trading instrument. A break in the resistance of 1.2613 will send the pair to the 1.2700 mark, the passage of which will ensure that the quote meets the red line of the Tenkan Ichimoku indicator, which lies at the strong technical level of 1.2750. A breakdown of support at 1.2410 will create prerequisites for further downward dynamics, the goals of which will be the levels of 1.2360, 1.2300 and 1.2250. H1
At the moment, the GBP/USD pair is trading under the blue 50 MA and the black 89 EMA. However, two highlighted hourly candles indicate the willingness of bulls to return the pound quote above the indicated moves. If this happens, then on the rollback to the broken 50 MA and 89 EMA, it is worth considering purchases with immediate goals in the area of 1.2585-1.2600. In case of unsuccessful attempts to break up the marked moving averages and the appearance of bearish candlestick analysis patterns under them, I recommend trying to sell with the nearest targets in the area of 1.2500-1.2470. Due to the most important events related to the decisions on the rates of both Central Banks, I do not recommend putting up more significant profits. At least not yet. The material has been provided by InstaForex Company - www.instaforex.com |
| Video market update for May 03,,2022 Posted: 03 May 2022 01:46 AM PDT Watch for downside continuational patterns on EUR and Gold ... The material has been provided by InstaForex Company - www.instaforex.com |
| EUR/USD analysis and forecast for May 3, 2022 Posted: 03 May 2022 01:34 AM PDT As you remember, yesterday's euro/dollar article emphasized that the current week will have an extremely strong fundamental connotation. A large number of macroeconomic indicators are expected to be released, of which the main report will be data on the US labor market, the publication of which is scheduled for Friday. But the main event will take place tomorrow when the US Federal Reserve System (FRS) announces its decision on rates, and half an hour after that, the press conference of Fed Chairman Jerome Powell will begin. There is little doubt that the Fed will raise the federal funds rate, the whole question is by how many basis points? And will Fed Chairman Jerome Powell retain his so pronounced "hawkish" rhetoric? In the meantime, the court and the case, let's briefly analyze yesterday's statistics and see what today's day has in store for us. Yesterday, investors' main attention was focused on data from the US on the Institute for Supply Management (ISM) manufacturing index. Let me remind you that the previous value of this indicator was 57.1, the forecast value assumed 57.6, but the actual figure was 55.4, which was the weakest growth in the US manufacturing sector in almost a year and a half. Although the value of this index is still held above 50.0, and this is generally a positive factor, weaker than expected ISM data, coupled with recent failed data on US GDP for the first quarter, may somewhat cool the "hawkish" fervor of the Fed and force the US Central Bank to tighten monetary policy more at a restrained pace. After all, it is not for nothing that virtually every speech by high-ranking monetary officials says that further steps will depend on incoming macroeconomic indicators. It won't be long to wait, and tomorrow evening we will find out everything and understand a lot. If you look at today's economic calendar, the main events for the EUR/USD currency pair will be the eurozone unemployment data, the speech of ECB President Christine Lagarde, as well as American reports on production orders, vacancy rates, and labor turnover. You can find out about all the details of these and other events by looking at the economic calendar. Daily
Despite weak data on the Institute for Supply Management (ISM) manufacturing index, the US dollar resumed its strengthening against the single European currency after a slight corrective decline shown last Friday. However, as can be seen on the daily price chart, yesterday's decline in EUR/USD did not bring any drastic changes. The main currency pair continues to hold in the current range of 1.0472 (lows on April 28) and 1.0593 (highs on April 29). In my personal opinion, the pair's exit from this range will indicate its prospects, at least for the near future. A breakdown of the resistance of 1.0593 and consolidation above 1.0600 will indicate that the Eurobucks are ready to continue the course correction to 1.0636, 1.0700, and 1.0745. If the lower limit of the current range, the level of 1.0472, is broken, it will become clear that 1.0593 is all that the players could achieve to increase the rate, which means that the most likely will be the continuation of the downward dynamics in the area of 1.0420-1.0400 and possibly lower towards the price zone 1.0370-1.0320. In the current situation, I still recommend waiting for at least some kind of corrective pullback up, after which the appearance of bearish candles at smaller time intervals will signal the opening of short positions on EUR/USD. The material has been provided by InstaForex Company - www.instaforex.com |
| Buffett and Munger calls Bitcoin worthless Posted: 03 May 2022 01:30 AM PDT
During the annual shareholder meeting last weekend, Berkshire Hathaway CEO Warren Buffett and Vice Chairman Charlie Munger had some harsh words about bitcoin. But here's how the crypto world reacted to another blow from legendary investors.
Buffett provided the most detailed explanation of why he does not like Bitcoin, saying that if he was offered only $ 25 for all bitcoins in the world, he would not buy them even at that price. He replied that he would not know what to do with them as soon as he sold them again. Because he does not know whether bitcoin will rise or fall next year or in 10 years, he only knows that bitcoin does not produce anything. Adding that he would prefer to own agricultural land or apartments because they can produce food and generate income from rent. Charlie Munger is even more hostile to cryptocurrency, calling it stupidity and evil, demonstrating three reasons for his negative attitude. The first is that there is a possibility of the cryptocurrency falling to zero. The second is that it undermines the Federal Reserve System. And the third is that by recognizing cryptocurrencies, they look stupid compared to China, which was supposedly smart enough to ban bitcoin in China. Buffett and Munger are well known for their extreme views on cryptography. In the past, Buffett has called Bitcoin rat poison squared. However, when Buffett commented on rat poison during the 2018 annual shareholder meeting, bitcoin rose from $ 9,500 to $ 38,808. This growth over the past four years has been 308% per bitcoin. The latest statements do not show any changes in their views, even though Bitcoin has become very widespread over the past couple of years.Nevertheless, the crypto world has been unwavering because of the views, rejecting comments and almost rejecting those who seem to disagree with their point of view.And Mexican billionaire Ricardo Salinas Pliego tweeted that it's sad to see people talking about a subject they clearly don't understand. Therefore, the future always belongs to the young, not the old. He later clarified that there is no need to try to sell or promote Bitcoin to people who have already decided that they do not want to participate.Tesla and SpaceX CEO Elon Musk ridiculed Buffett. Drawing attention to the fact that Buffett's reasoning is equivalent to what he would say about diabetes, surrounding himself with boxes of sweets during a speech. The material has been provided by InstaForex Company - www.instaforex.com |
| Europe is on the verge of agreeing to abandon Russian oil Posted: 03 May 2022 01:30 AM PDT
By the end of this week, the European Union may fully agree to a ban on the import of Russian oil, even though this will lead to a further increase in oil prices.
According to Bloomberg: EU members are discussing an approach to phase-out, in which Russian oil imports will gradually decrease by the end of the year. However, later, according to the Financial Times, the timing of the phase-out of Russian imports was shifted by several months. According to the FT report, Germany, one of the largest importers of Russian oil, initially asked for more time to prepare for the phase-out of Russian oil, at least until the end of the year. Now the German government seems emboldened and is ready to give up in a few months. On Sunday, German Economy Minister Robert Habeck said that full independence from Russia is already possible by the end of summer. Early on Monday morning, German Foreign Minister Annalena Baerbock said that once such a ban was introduced, it could last for years. Despite the many-voiced agreement on the oil embargo, it may still fail, since some EU members, in particular Hungary, opposed sanctions measures against energy carriers from Russia from the very beginning. Decisions on sanctions must be approved unanimously by all EU members. The purpose of the sanctions is to reduce Russia's revenues from oil and gas, which replenish the Kremlin's military coffers but not to cause turmoil in international oil markets. And now, it seems that unrest cannot be avoided, given the volume of Russian energy exports. Russia is the largest exporter of crude oil and petroleum products, as well as the largest exporter of natural gas. In addition to the Russian fossil fuel industry, the next round of sanctions will affect more banks, as well as access to consulting and cloud services. The material has been provided by InstaForex Company - www.instaforex.com |
| Technical overview: EUR/USD (there is a possibility of resuming the growth of the pair) Posted: 03 May 2022 01:30 AM PDT The pair found support at the 1.0490 level in anticipation of the outcome of the Fed's monetary policy meeting. The pair can get good support if the outcome of the meeting is a decision after the rate increases by 0.50%, then raise at a rate of 0.25% at each meeting. There is such a possibility. Technical picture: The price is located above the middle line of the Bollinger indicator, above SMA 5, but still below SMA 14. The relative strength index of the RSI is below the level of 50% and is gradually growing. Stoch is still growing. Forecast of the day: After overcoming the 1.0535 level and consolidating above it, the pair may continue to grow towards 1.0650.
|
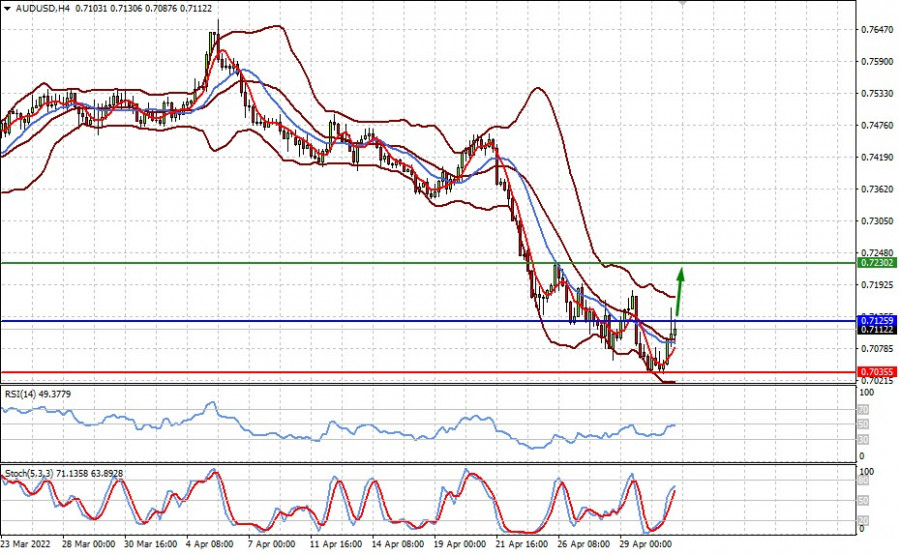
| Technical overview: AUD/USD (there is a possibility of resuming the growth of the pair) Posted: 03 May 2022 01:30 AM PDT The pair received support against the background of the RBA's decision to raise the key interest rate from 0.10% to 0.35%, which caused a local recovery. The pair may continue to grow if, following the results of the meeting, it becomes clear that the Fed, after tomorrow's increase in the cost of borrowing by the expected 0.50%, will continue to raise rates by 0.25%. Technical picture: The price is located above the middle line of the Bollinger indicator, above the EMA 5 and SMA 14. The relative strength index of the RSI is below the level of 50% and is gradually growing. Stoch is still growing. Forecast of the day: After overcoming the 0.7125 level and consolidating above it, the pair may continue to grow to 0.7230.
|


| You are subscribed to email updates from Forex analysis review. To stop receiving these emails, you may unsubscribe now. | Email delivery powered by Google |
| Google, 1600 Amphitheatre Parkway, Mountain View, CA 94043, United States | |


Comments