Forex analysis review
Forex analysis review |
- Will the geopolitical conflict between Ukraine and the Russian Federation put pressure on bitcoin in the future?
- Bitcoin got confused immediately after the Fed rate hike, but then everything fell into place.
- Analysis of the trading week of May 2-6 for the GBP/USD pair. COT report. The pound crashed on Thursday.
- Analysis of the trading week of May 2-6 for the EUR/USD pair. COT report. The "dead" euro miraculously refrained from a new
- GBP/USD: more declines expected
- USD/CHF in range pattern
- Bitcoin aims at 34,324 key level
- Litecoin vulnerable to drop deeper
- Trading Signal for EUR/USD for May 06-09, 2022: buy above 1.0550 (21 SMA - double bottom)
- GBP/USD Analysis on 6th May
- EUR/USD Analysis on 6th May
| Posted: 07 May 2022 10:20 AM PDT
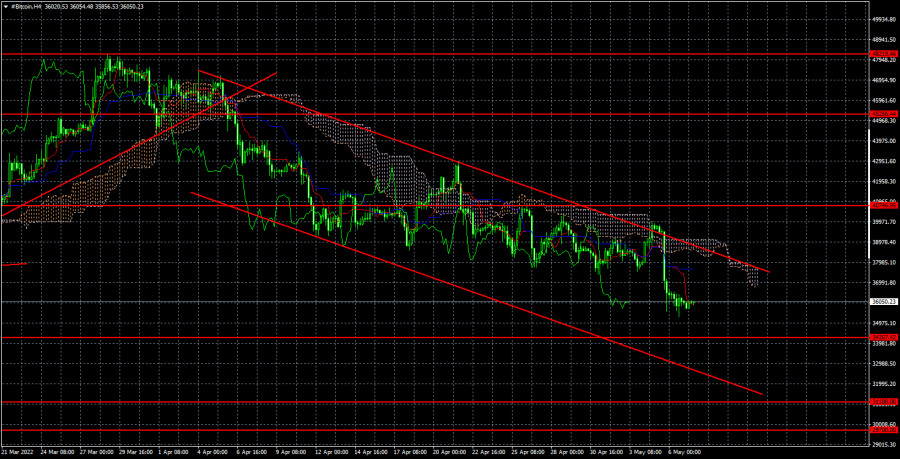
On the 4-hour TF, the technical picture for bitcoin looks very good. After bitcoin quotes were fixed below the ascending trend line, a fall began, and a little later a descending channel was formed, inside which the price continues to move now. After the pair unsuccessfully tried to overcome its upper boundary and the Ichimoku cloud on Wednesday, the fall resumed. The "false breakdown" was caused by the illogical reaction of the market to the results of the Fed meeting. However, the very next day, bitcoin began to fall again, as predicted by the technical picture. Thus, in the coming days, the "bitcoin may fall to the level of $ 34,267. In the first week of the geoconflict, bitcoin became more expensive. The cryptocurrency reacted not quite logically to the first weeks of the military conflict between Ukraine and Russia. A little later, it became clear that investors began to leave the collapsing economies of the two countries. But since central banks immediately imposed strict restrictions on the stock and currency markets, many investors tried to withdraw their capital from the countries using cryptocurrencies. This explains the growth of bitcoin, the demand for which has grown greatly. Bitcoin could also be used to protect against the depreciation of the Russian ruble, which sank to the level of 150 rubles per dollar. Nevertheless, after a few weeks, the ruble exchange rate began to stabilize and has now risen to pre-war values. Everyone who wanted to withdraw capital from Ukraine and Russia has already done so, so the demand for bitcoin began to sink. At this time, there is no point in buying cryptocurrencies, as the ruble is growing. And the withdrawn capital in bitcoins could have long been converted into stable currencies like the dollar, which continues to grow in the foreign exchange market. Thus, the geopolitical conflict first supported bitcoin and then contributed to its fall. At the moment, we do not see a direct correlation between the escalation of the conflict in Ukraine and the new movements of bitcoin. Tension persists, and in difficult and dangerous times, protective assets and currencies are in demand, to which bitcoin does not apply. Therefore, theoretically, the conflict in Eastern Europe may exert background pressure on digital gold, but it is unlikely to be strong. The Fed's program is much more important now, according which the rate may rise to 3% in 2022, and the Fed's balance sheet may begin to shrink by $ 100 billion every month. These two factors are much more likely to provoke the fall of the "bitcoin".
On the 4-hour timeframe, the quotes of the "bitcoin" continue to fall with targets of $ 34,267 and $ 31,100. Therefore, we recommend selling at this time. If the price is fixed above the descending channel, it can be a strong signal to buy, but we are not counting on a new upward trend now anyway. The material has been provided by InstaForex Company - www.instaforex.com |
| Bitcoin got confused immediately after the Fed rate hike, but then everything fell into place. Posted: 07 May 2022 09:42 AM PDT
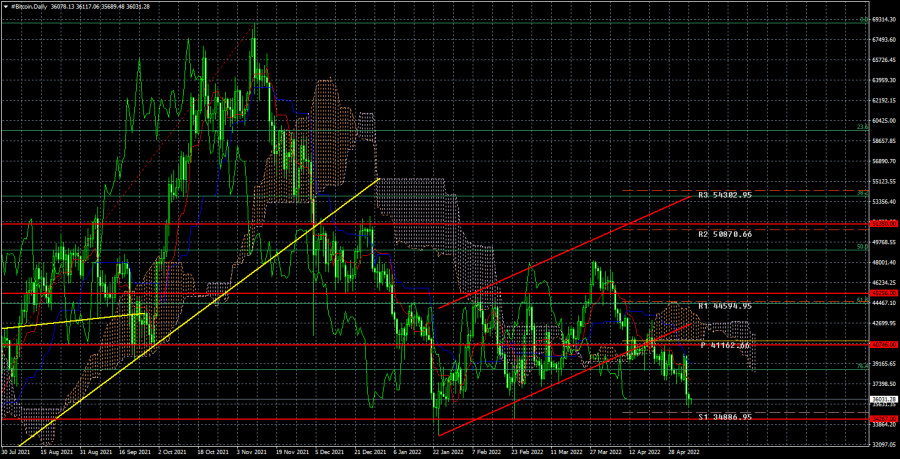
Over the past week, bitcoin has continued its decline. In principle, this is not surprising, since a few weeks ago, the quotes of the "bitcoin" on the 24-hour TF were fixed below the ascending channel, which is a signal to fall. This is exactly the drop we have been seeing in recent weeks. At the moment, bitcoin is moving to the nearest support level of $ 34,267. It is not moving too fast, but still, it accelerated significantly on Thursday, the day after the publication of the results of the Fed meeting. It should be noted here right away that the markets as a whole reacted very illogically to this event on Wednesday evening, but corrected it on Thursday. For example, the US dollar fell on the Fed rate hike, as well as on the "hawkish" rhetoric of Jerome Powell, but rose the next day. About the same thing happened with bitcoin, which rose on Wednesday, but fell heavily on Thursday. So, in the end, everything fell into place. Tightening monetary policy is bad for cryptocurrencies. Although various cryptocurrency experts continue to insist that bitcoin will grow to $ 100,000 in the near future, that a new "bullish" trend is coming, and the cryptocurrency will become a universal means of payment in the coming years, the cryptocurrency continues to show a drop in the last six months. The maximum value that it has managed to reach recently is the level of $ 48,000. This growth was shown as part of an upward correction after a 50% drop. Thus, there were no "bullish" factors behind it. There was just a technical correction. Now we see all the signs of a resumption of the downward trend. So there is every reason to say that the first cryptocurrency in the world will fall below the level of $ 34,267. In recent months, we have been constantly saying that we expect to see a "bitcoin" near the level of $ 31,100. In the future, we expect a stronger fall, since the fundamental background is not on the side of risky assets, which include even stocks that are much more stable than cryptocurrencies. It should be remembered that no one has canceled market laws and mechanisms. When the central bank raises the rate, it means that the yield of safe assets, such as bank deposits or bonds, increases. Naturally, there is a growing demand for them. And since capital tends to flow from market to market, then "somewhere it arrived, somewhere it decreased." Paradoxical as it may sound, but if bitcoin showed growth now, it could count on stronger growth, because in this case, investors would use it as a protection against inflation, which is now a headache for the whole world. But bitcoin is not growing, so it does not bring any profit to new investors. There are no new investors - bitcoin is not growing. We are inclined to continue the fall.
On the 24-hour timeframe, the quotes of the "bitcoin" were fixed below the Ichimoku cloud and the ascending channel. Thus, sales with targets of $ 34,267 and $ 31,100 have become relevant again at this time. The first target has almost been worked out, and if it is overcome, the cryptocurrency will continue to fall with the second goal. There are no reasons to expect cryptocurrency growth now. The material has been provided by InstaForex Company - www.instaforex.com |
| Posted: 06 May 2022 10:19 PM PDT Long-term perspective. |
| Posted: 06 May 2022 09:28 PM PDT Long-term perspective.
The EUR/USD currency pair has not even tried to start an upward correction again this week. There was no new collapse, but when there is no collapse and there is no correction, it means that there will be a new fall sooner or later. Maybe next week, but the point is that bears don't close short positions, and bulls don't open long ones. In this situation, it is very difficult to count on the strengthening of the euro currency. Needless to say, all the indicators on the 24-hour TF are pointing downwards? Needless to say, the pair has already updated its 5-year lows and is racing towards its 20-year lows at full speed? Needless to say, over the past week, there has not been a single factor that could provide significant support to the euro currency? At the moment, we rely only on one moment when we assume that the "nightmare" for the euro may end in the near future. This moment is the impossibility of the constant movement of the pair in one direction. There must be corrections and sooner or later they will be. The problem is that the correction depends entirely on the mood of traders, and what it is, we have already figured out above. Therefore, theoretically, the pair may well fall to 20-year lows and price parity before an upward pullback begins. We also draw attention to the fact that, despite the factors that openly oppose the euro and the dollar, the currency of the European Union has already fallen in price quite a lot. And therefore oversold. Nevertheless, this justification cannot be considered a starting point for the growth of the euro/dollar pair. This week, the situation for the euro currency could get much worse. Jerome Powell's rhetoric was frankly "hawkish", and the Fed raised the rate by 0.5% and almost openly stated that in June and July the rate would also increase by 0.5%. Thus, the fact that the dollar did not rise at the end of the week is even more surprising. COT analysis. The latest COT reports on the euro currency raised more questions than they answered. But at last, the situation began to change, and now COT reports more or less reflect the real picture of what is happening in the market, as the mood of the "Non-commercial" group has become "bearish". During the reporting week, the number of buy contracts decreased by 14.5 thousand, and the number of shorts from the "Non-commercial" group increased by 14 thousand. Thus, the net position decreased by 28.5 thousand contracts per week. This means that the "bullish" mood has changed to "bearish" since the number of sell contracts now exceeds the number of buy contracts from non-commercial traders by 6 thousand. However, what happened during the last reporting week is a double-edged sword. On the one hand, COT reports now reflect what is happening in the market. On the other hand, if the demand for the euro currency has also started to fall now, then we can expect another new fall in this currency. Recall that in recent weeks, professional traders, oddly enough, maintained a "bullish" mood and bought euros more than they sold. And even in this scenario, the euro fell like a stone. What will happen now that major players have started selling the euro currency? Demand for the dollar remains high, and demand for the euro is falling. Thus, it is quite reasonable now to expect a new decline in the euro/dollar pair. Moreover, the reaction to the "hawkish" Fed meeting was not quite adequate. Analysis of fundamental events. During the current week, the most important event was the Fed meeting. We have already said that we consider him completely "hawkish". However, the market was fully prepared for the fact that the rate would be raised, and in the coming months, the Fed's balance sheet would begin to shrink. Thus, after the publication of these results, it even sold the American currency and did not buy it. But the very next day everything fell into place and the dollar rose against the euro. At the moment, the fundamental factor remains not in favor of the euro. The monetary policy of the Fed is tightening, and the monetary policy of the ECB continues to be "out". We still believe that the ECB will not decide to raise the rate in the near future, but even if this happens, to what level will the rate be raised if the deposit rate is negative now? The Fed may raise its rate to 2% in July, and to 3% by the end of the year. That is, the ECB still cannot keep up with the Fed. Consequently, the US currency will have a fundamental advantage until the end of the year. Trading plan for the week of May 9-13: 1) On the 24-hour timeframe, the pair continues its downward movement and headed for the level of 1.0340 - the minimum for the last 20 years. Almost all factors still speak in favor of the growth of the US dollar, but still, we believe that the fall of the euro currency is already too strong. The price is below the Ichimoku cloud, so there is still little chance of growth for the euro currency. At the moment, sales remain the most relevant. 2) As for purchases of the euro/dollar pair, it is not recommended to consider them now. There is not a single technical signal that an upward trend may begin. The "foundation" and "macroeconomics" continue to exert strong pressure on the euro. "Geopolitics" can continue to put pressure on traders and investors who still believe that in any unclear situation, you need to buy the dollar. Europe is on the verge of an energy and food crisis. Only overcoming the Senkou Span B line we would consider as the basis for a new upward trend. Explanations of the illustrations: Price levels of support and resistance (resistance /support), Fibonacci levels - target levels when opening purchases or sales. Take Profit levels can be placed near them. Ichimoku indicators (standard settings), Bollinger Bands (standard settings), MACD (5, 34, 5). Indicator 1 on the COT charts - the net position size of each category of traders. Indicator 2 on the COT charts - the net position size for the "Non-commercial" group. The material has been provided by InstaForex Company - www.instaforex.com |
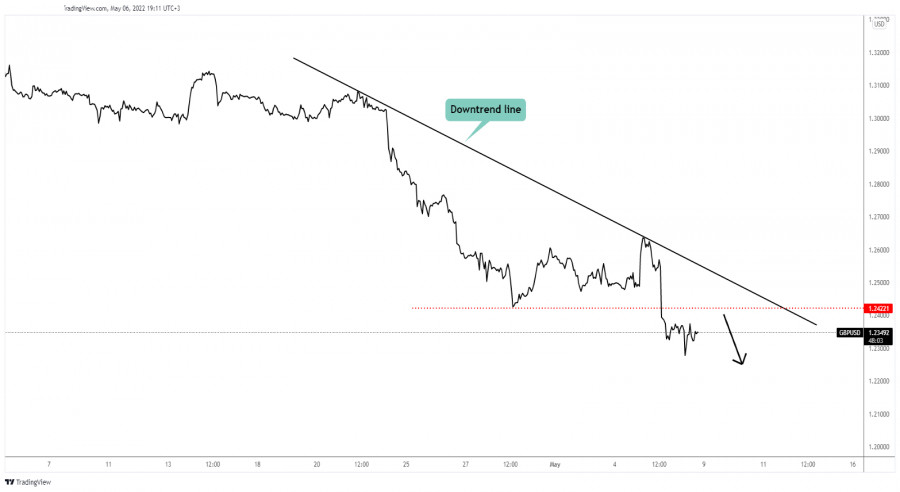
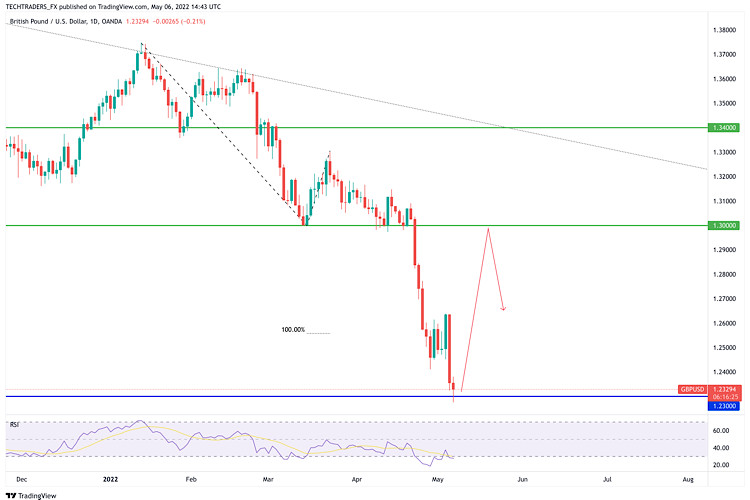
| GBP/USD: more declines expected Posted: 06 May 2022 09:59 AM PDT
GBP/USD Minor Growth!The GBP/USD pair tries to increase after dropping as low as 1.2275. After its massive drop, a temporary rebound is natural. 1.2422 former low stands as an upside obstacle. In the short term, the price could come back to test and retest this level before dropping deeper. Technically, as long as it stays under 1.2422 and below the downtrend line, the GBP/USD pair could decline deeper anytime. GBP/USD Trading Conclusion!Coming back to test and retest 1.2422 and the downtrend line could bring new selling opportunities. Also, making a new lower low, dropping below 1.2275 could activate more declines. Only jumping above the downtrend line could invalidate more declines and could bring new buying opportunities. The material has been provided by InstaForex Company - www.instaforex.com |
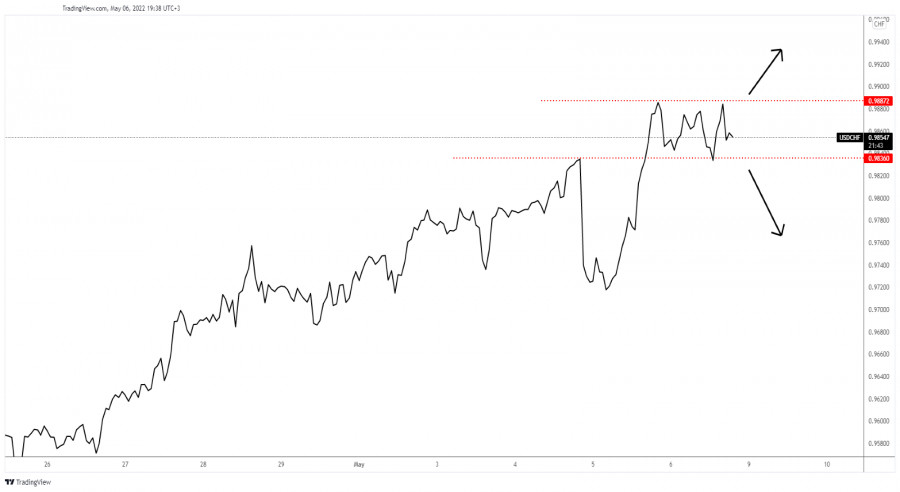
| Posted: 06 May 2022 09:58 AM PDT
USD/CHF Continuation or Reversal!The USD/CHF pair moves somehow sideways in the short term. It's trapped between 0.9836 and 0.9887 levels. The outlook remains bullish, the price could resume its uptrend as long as it stays above 0.9836. Dropping below this level may signal that USD/CHF could develop a corrective phase. You can see that the USD/CHF pair failed to stabilize below 0.9836 former high which represents a downside obstacle. 0.9887 former high represents an upside obstacle. USD/CHF Trading Conclusion!Dropping below 0.9836 could announce a downside movement and could bring new selling opportunities. Staying above this level and jumping above 0.9887 could confirm an upside continuation. The material has been provided by InstaForex Company - www.instaforex.com |
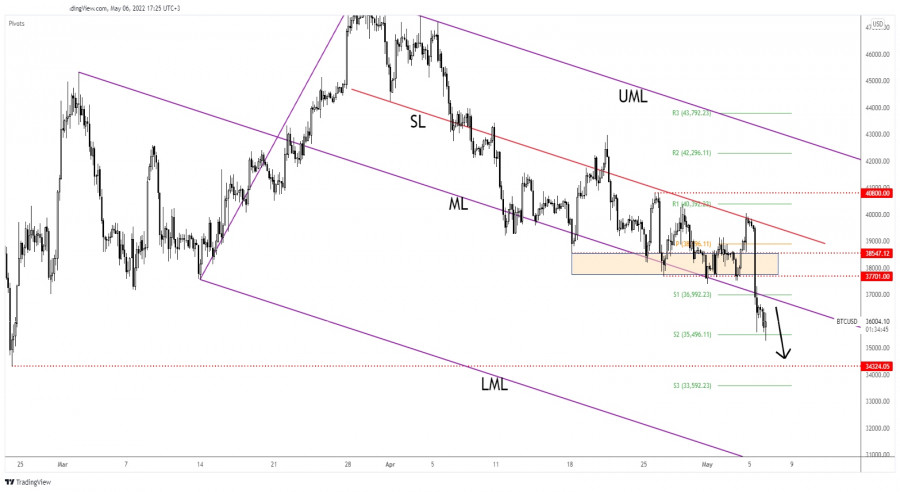
| Bitcoin aims at 34,324 key level Posted: 06 May 2022 08:52 AM PDT Bitcoin plunged after failing to stabilize above the 40,000 psychological level. Now, it's trading at 36,238 level at the time of writing. BTC/USD registered an 11.94% drop from Wednesday's high of 40,050 to 35,268 today's low. In the last 24 hours, the price of bitcoin is down by 3.05% and by 6.96 in the last 7 days. The current sell-off forced the altcoins to drop as well. BTC/USD's deeper drop could is favored after ignoring strong downside obstacles. BTC/USD More Declines Activated!
As you can see on the H4 chart, the crypto found resistance at the inside sliding line (SL) and now it has dropped below the median line (ML) which represented dynamic support. After the aggressive breakdown, BTC/USD could come back to test and retest the median line (ML). The downside pressure remained high after failing to make a new higher high or to make a valid breakout above the sliding line (SL). Also, its failure to stay above the 37,701 signaled strong sellers and a downside continuation. BTC/USD Outlook!Stabilizing below the median line (ML) may confirm more declines towards the 34,324 key level. Retesting the median line and registering only false breakouts above it could bring short opportunities. The material has been provided by InstaForex Company - www.instaforex.com |
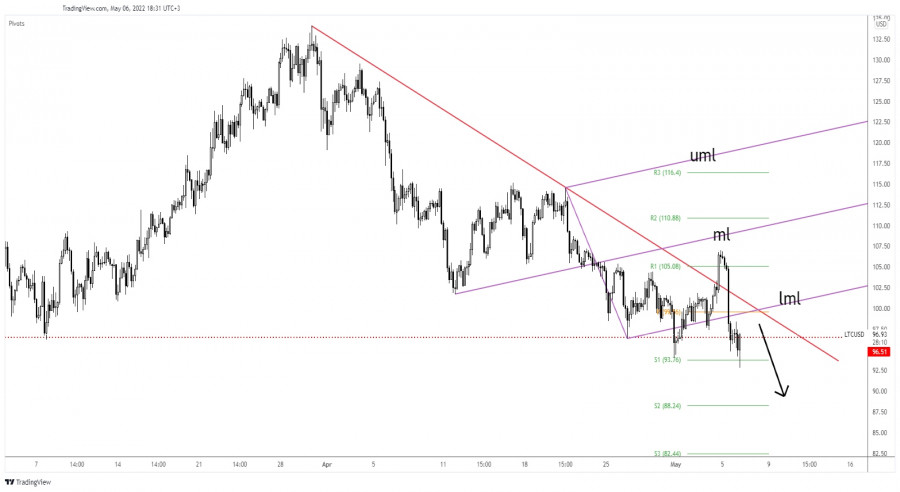
| Litecoin vulnerable to drop deeper Posted: 06 May 2022 08:50 AM PDT Litecoin plunged in the short term after failing to confirm a potential upside reversal. It is trading at 96.10 at the time of writing. Technically, the bias remains bearish, so a further drop is in cards. LTC/USD dropped by 13.30% from Wednesday's high of 107.03 to 92.80 today's low. LTC/USD plunged after the price of bitcoin crashed. BTC/USD's further drop could push Litecoin towards new lows. Still, after its amazing sell-off, the altcoin could try to rebound and recover a little. LTC/USD Upside Invalidated!
LTC/USD registered only a false breakout above the downtrend line signaling more declines. Validating its breakout above this line would have confirmed a potential upside reversal. Now, it has dropped below the ascending pitchfork's lower median line (lml) and through 96.51 activating a downside continuation. In the short term, LTC/USD could come back to test and retest 96.51 and the downtrend line before resuming its sell-off. LTC/USD Forecast!Stabilizing below the 96.51 could signal a further drop. A minor sideways movement under this level or the downtrend line retest could bring new selling opportunities. The material has been provided by InstaForex Company - www.instaforex.com |
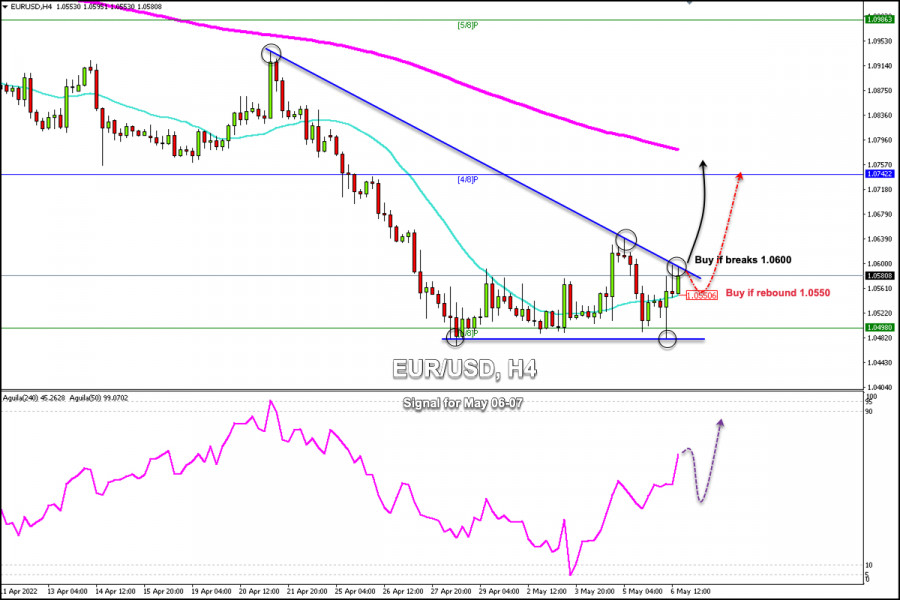
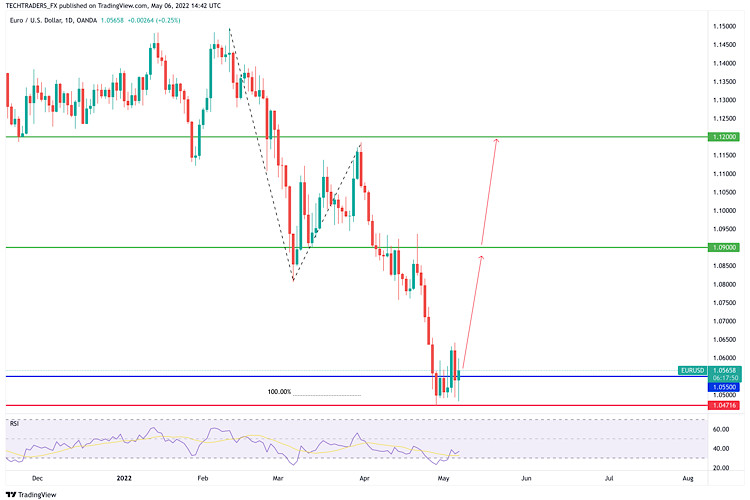
| Trading Signal for EUR/USD for May 06-09, 2022: buy above 1.0550 (21 SMA - double bottom) Posted: 06 May 2022 08:15 AM PDT
EUR/USD is losing steam after the US employment report. It had initially reached 1.0600 in the European session, but then changed direction and fell around 1.0550. EUR/USD is erasing gains as the dollar is advancing. The pair reached 1.0595 (top of downtrend channel) in light of the NFP data, but failed to break above. This level has become a key barrier in the short term. According to the 4-hour chart, we can see that the Euro is trading below a downtrend channel formed since April 20th. Early in the American session, the Euro has tested the top of the downtrend channel around 1.0600-1.0590. This top is strong and a sharp break and a close above 1.0600 on the 4-hour chart are likely to be a clear signal to buy the euro and it could reach 4/8 Murray at 1.0742 and the 200 EMA at 1.0790 in the next few days. On the other hand, if not exceeded, a technical correction towards the SMA 21 located at 1.0550 is expected. A technical bounce above this level could be an opportunity to buy the euro with targets at 1.0600 and 1.0742. On the contrary, if the euro closes below 1.0550 (21 SMA), we should exercise caution and wait for a technical bounce around 3/8 Murray (1.0498). The support that the euro reached below 3/8 Murray has formed a double bottom pattern which would signal that the euro could continue its uptrend and could reach the level 1.0800 in the coming days. Our trading plan for the next few hours is to buy the Euro around 1.0550 or above 1.0600. The eagle indicator is giving a positive signal which supports our bullish strategy. The material has been provided by InstaForex Company - www.instaforex.com |
| Posted: 06 May 2022 07:51 AM PDT
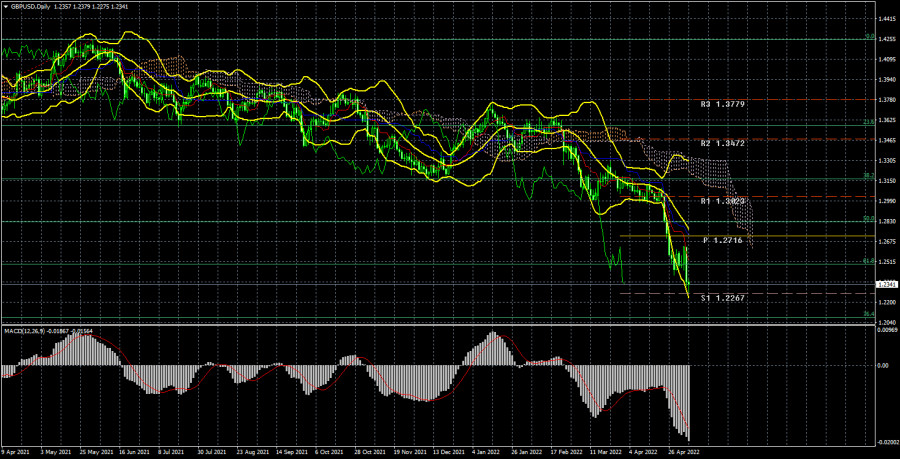
GBP/USD has met fresh bearish pressure in the second half of the day on Friday and declined below 1.2350. Although the greenback weakened with the initial reaction to the US April jobs report, it managed to erase its losses amid the souring market mood. The Relative Strength Index (RSI) indicator on the four-hour chart stays near 40, confirming the view that sellers remain in control of the pair's action. On the upside, 1.2400 (psychological level) aligns as the next resistance before 1.2430 (static level, former support) and 1.2460 (20-period SMA). In case safe-haven flows start dominating the markets in the second half of the day, the pair could test 1.2300 (psychological level) and extend its slide toward 1.2275 (daily low) and 1.2250 (static level coming from June 2020). The material has been provided by InstaForex Company - www.instaforex.com |
| Posted: 06 May 2022 07:50 AM PDT
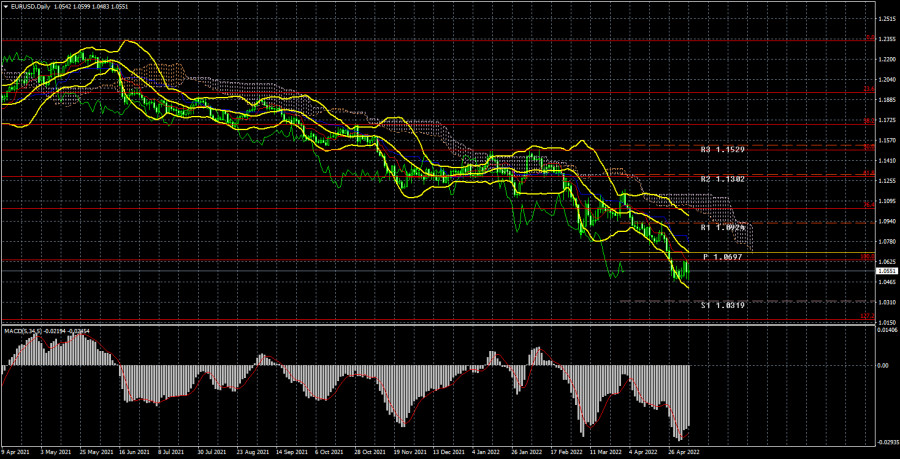
EUR/USD has lost its traction after having tested 1.0600 earlier in the day but managed to stay in positive territory above 1.0550. The data from the US confirmed that labor market conditions remain extremely tight in April with NFP rising more than 400K despite a decline in the participation rate. The pair is trading near the static resistance of 1.0560, which is reinforced by the 50-period SMA on the four-hour chart, and a four-hour close above that level could open the door for a rebound toward 1.0600 (psychological level, Fibonacci 23.6% retracement level of the latest downtrend). Finally, 1.0660 (Fibonacci 38.2% retracement) forms the next significant resistance. On the downside, 1.0540 (20-period SMA) aligns as interim support ahead of 1.0500 (psychological level and 1.0470 (multi-year low set on April April 26). The material has been provided by InstaForex Company - www.instaforex.com |


| You are subscribed to email updates from Forex analysis review. To stop receiving these emails, you may unsubscribe now. | Email delivery powered by Google |
| Google, 1600 Amphitheatre Parkway, Mountain View, CA 94043, United States | |


Comments