Forex analysis review
Forex analysis review |
- How to trade GBP/USD on May 9? Simple tips for beginners.
- How to trade EUR/USD on May 9? Simple tips for beginners.
- GBP/USD analysis on May 8. Difficult times for the pound are coming to an end.
- EUR/USD analysis on May 8. American statistics: not strong enough for the dollar to rise again.
- EUR/USD. Delayed action release: April Nonfarm did not impress traders
- GBP/USD. Bank of England's pessimism and the victory of Sinn Fein in Northern Ireland
- NFP gave the dollar a hint. The trend does not lose relevance, a new growth forecast has been named
- The main European indicators showed a fall
- EU's tough stance pushed oil prices to spectacular growth
| How to trade GBP/USD on May 9? Simple tips for beginners. Posted: 08 May 2022 07:29 AM PDT Analysis of previous deals:30M chart of the GBP/USD pair
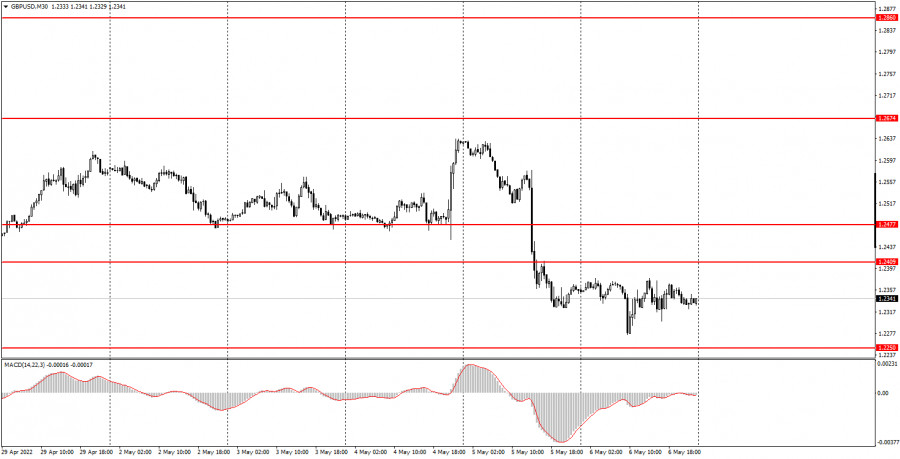
The GBP/USD pair was also trading flat on Friday, but at the same time it renewed its 2-year lows. In general, the pound also continues to be very low and the situation for it is very similar to the technical picture for the euro currency. Thus, we can make an unambiguous conclusion that the downward trend continues, although there is still neither a trend line nor a descending channel on the 30-minute timeframe. We have already said that a downward trend is clearly visible on higher timeframes, but on a 30-minute time frame, the entire movement and even its last part no longer fit on the chart. Plus, the movements are pretty jagged. For example, the pair fell by 300 points on Thursday, and the day before it rose by 150. Macroeconomic statistics from the US had almost no effect on the course of trading. In principle, the pound is now solving the problem of how to avoid a new fall against the dollar. As you can see, even the fact that the Bank of England raised the rate four times, significantly strengthening monetary policy, does not help. It was after the next increase that the pound fell with a slight delay by 300 points. We can only hope for a miracle or a technical correction. 5M chart of the GBP/USD pair
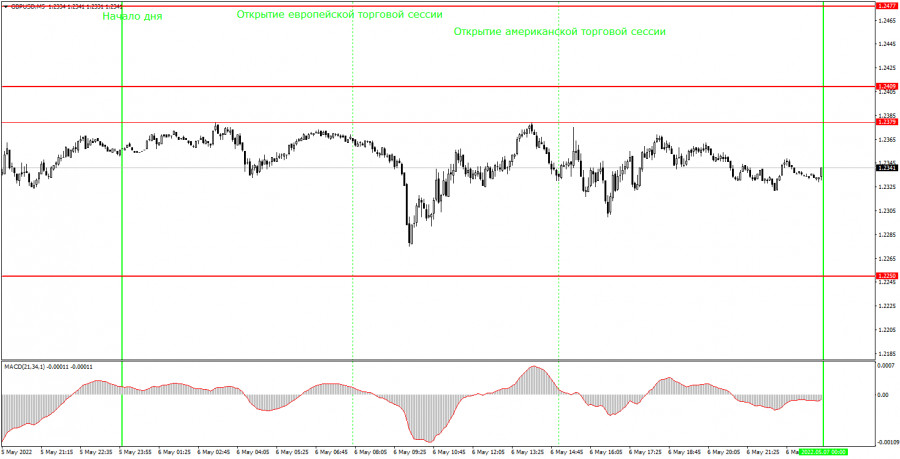
It moved very broadly on the 5-minute timeframe on Friday, but at the same time almost sideways. The pair did not reach any level during the day, therefore, not a single trading signal was formed. The 1.2379 level is the day's high, so it did not take part in the process of forming a signal. Therefore, there is practically nothing to analyze on the current TF. Next week, the pair may spend several days in a wide horizontal channel, which is currently limited by the levels of 1.2409 and 1.2250. However, there is no pronounced channel or flat for the pound now. Much will now depend on geopolitics, as it promises to become more complicated in the near future, which may negatively affect the euro and the pound, as more risky currencies compared to the dollar. How to trade on Monday:The downward trend still persists on the 30-minute timeframe. The pound has recently fallen in price by 700 points, and all its attempts to form a tangible correction ended in nothing. Thus, at this time, there are great chances for a continuation of the downward movement, but there is still no trend line, no descending channel. Therefore, you can trade only by levels, and it is more difficult to navigate the current trend. On the 5-minute TF tomorrow it is recommended to trade at the levels of 1.2250, 1.2409, 1.2477, 1.2502. When the price passes after opening a deal in the right direction for 20 points, Stop Loss should be set to breakeven. No important events are scheduled for tomorrow in the UK, and only a speech by Federal Reserve spokesman Rafael Bostic will take place in the US. Thus, traders will have nothing to react to during the day. Volatility should theoretically decrease, but both major pairs have been trading very volatile lately, even on days when there are no events and reports. Basic rules of the trading system:1) The signal strength is calculated by the time it took to form the signal (bounce or overcome the level). The less time it took, the stronger the signal. 2) If two or more deals were opened near a certain level based on false signals (which did not trigger Take Profit or the nearest target level), then all subsequent signals from this level should be ignored. 3) In a flat, any pair can form a lot of false signals or not form them at all. But in any case, at the first signs of a flat, it is better to stop trading. 4) Trade deals are opened in the time period between the beginning of the European session and until the middle of the American one, when all deals must be closed manually. 5) On the 30-minute TF, using signals from the MACD indicator, you can trade only if there is good volatility and a trend, which is confirmed by a trend line or a trend channel. 6) If two levels are located too close to each other (from 5 to 15 points), then they should be considered as an area of support or resistance. On the chart:Support and Resistance Levels are the Levels that serve as targets when buying or selling the pair. You can place Take Profit near these levels. Red lines are the channels or trend lines that display the current trend and show in which direction it is better to trade now. The MACD indicator (14,22,3) consists of a histogram and a signal line. When they cross, this is a signal to enter the market. It is recommended to use this indicator in combination with trend lines (channels and trend lines). Important speeches and reports (always contained in the news calendar) can greatly influence the movement of a currency pair. Therefore, during their exit, it is recommended to trade as carefully as possible or exit the market in order to avoid a sharp price reversal against the previous movement. Beginners on Forex should remember that not every single trade has to be profitable. The development of a clear strategy and money management are the key to success in trading over a long period of time. The material has been provided by InstaForex Company - www.instaforex.com |
| How to trade EUR/USD on May 9? Simple tips for beginners. Posted: 08 May 2022 07:19 AM PDT Analysis of previous deals:30M chart of the EUR/USD pair
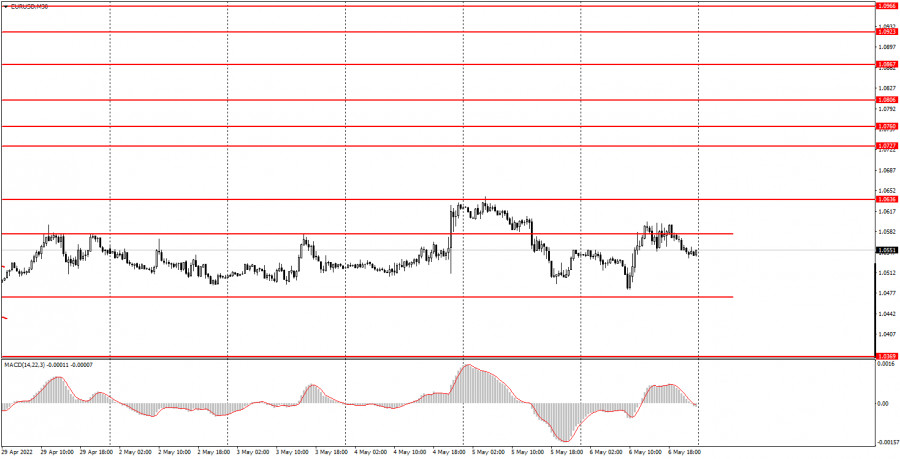
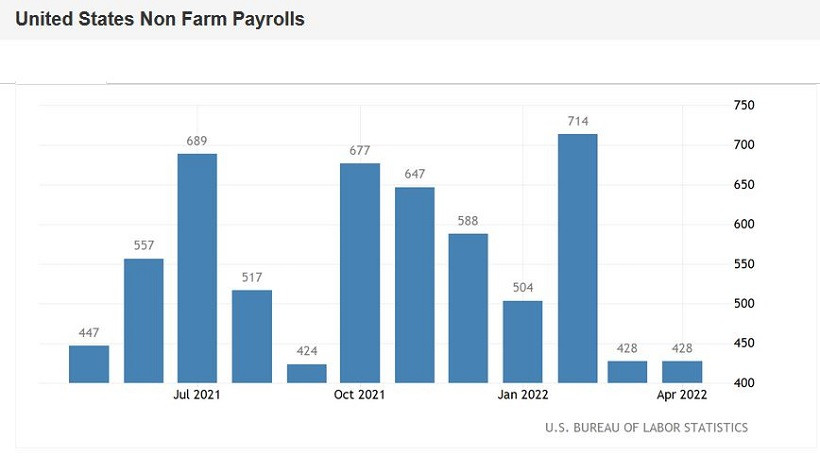
The EUR/USD currency pair, by and large, continued to trade in the horizontal channel on Friday, which is shown in the chart above. The pair left this horizontal channel on Wednesday and Thursday, so it is somewhat formal at this time. However, one should take into account the fact that this "exit" was due to the Federal Reserve meeting and its development. It is quite possible that if there had been no meeting, the pair would have continued to trade within the channel. Thus, we propose to consider that the pair has been in a flat for six trading days, which is located near 5-year lows. That is, the pair is trading sideways at the very "bottom" of the downward trend, which is still preserved, since for all this time we have not seen a tangible upward correction. Therefore, now the question is as follows: when will the euro resume to fall? We have already said that the only possible factor for the pair's growth is the absence of a strong correction: the price cannot constantly move in only one direction. But there are many more downside factors. We also note that on Friday the market actually ignored macroeconomic statistics from America. There was at least one important report - NonFarm Payrolls - the number of new jobs created outside the agricultural sector. Their number was 428,000, which in itself is a high value, and besides this, it was above the forecast. However, the dollar failed to show new growth due to this report. 5M chart of the EUR/USD pair
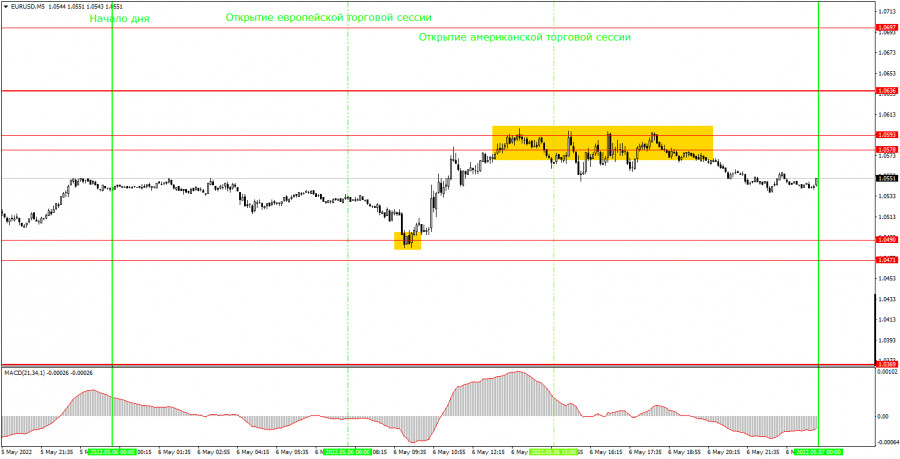
The technical picture on the 5-minute timeframe looks very good. Only two trading signals were formed during the day, both of which are not false, which is just fine for a flat. The pair has been in the horizontal channel all day between the levels of 1.0490 and 1.0593. That is, volatility remained very high, despite the flat. First, the pair rebounded from the level of 1.0490. It rebounded very accurately, allowing novice traders to open long positions. A few hours later, the price hit the 1.0578-1.0593 area, spent five or six hours around it, and eventually bounced from it, forming a sell signal. This signal should be used to leave long positions and open shorts. Profit on the first deal was about 60 points. It was not possible to make money on the short position, because until the very evening the pair could not really leave the area of 1.0578-1.0593. How to trade on Monday:The trend remains downward on the 30-minute timeframe, despite the formed flat. We believe that the pair can resume to fall at any moment, but we draw your attention to the fact that the euro has been falling for quite a long time and a correction will begin sooner or later. On the 5-minute TF tomorrow it is recommended to trade at the levels of 1.0369, 1.0471-1.0490, 1.0578-1.0593, 1.0636, 1.0697. When passing 15 points in the right direction, you should set Stop Loss to breakeven. There will be no important reports and events in the European Union on Monday. In the US, only a speech by a member of the Fed's Monetary Committee, Rafael Bostic, will take place. However, volatility has been very high in recent weeks. Most likely, it will decrease, but hardly to "zero" values. Basic rules of the trading system:1) The signal strength is calculated by the time it took to form the signal (bounce or overcome the level). The less time it took, the stronger the signal. 2) If two or more deals were opened near a certain level based on false signals (which did not trigger Take Profit or the nearest target level), then all subsequent signals from this level should be ignored. 3) In a flat, any pair can form a lot of false signals or not form them at all. But in any case, at the first signs of a flat, it is better to stop trading. 4) Trade deals are opened in the time period between the beginning of the European session and until the middle of the American one, when all deals must be closed manually. 5) On the 30-minute TF, using signals from the MACD indicator, you can trade only if there is good volatility and a trend, which is confirmed by a trend line or a trend channel. 6) If two levels are located too close to each other (from 5 to 15 points), then they should be considered as an area of support or resistance. On the chart:Support and Resistance Levels are the Levels that serve as targets when buying or selling the pair. You can place Take Profit near these levels. Red lines are the channels or trend lines that display the current trend and show in which direction it is better to trade now. The MACD indicator (14,22,3) consists of a histogram and a signal line. When they cross, this is a signal to enter the market. It is recommended to use this indicator in combination with trend lines (channels and trend lines). Important speeches and reports (always contained in the news calendar) can greatly influence the movement of a currency pair. Therefore, during their exit, it is recommended to trade as carefully as possible or exit the market in order to avoid a sharp price reversal against the previous movement. Beginners on Forex should remember that not every single trade has to be profitable. The development of a clear strategy and money management are the key to success in trading over a long period of time. The material has been provided by InstaForex Company - www.instaforex.com |
| GBP/USD analysis on May 8. Difficult times for the pound are coming to an end. Posted: 08 May 2022 06:47 AM PDT
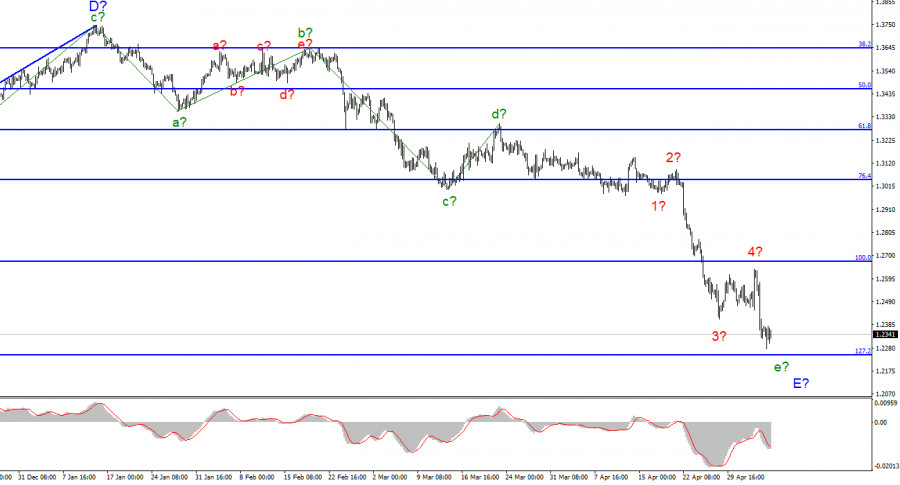
For the pound/dollar instrument, the wave markup continues to look very convincing and does not require adjustments. The downward section of the trend continues its construction within the framework of the wave e-E, and its internal wave marking looks quite complicated. Nevertheless, I have identified five waves inside this wave and, if my markup is correct, then wave 5, the last internal wave, is being built at this time. Thus, we get almost identical wave markings for the British and the European, each of which indicates the possible imminent completion of the downward trend section. Or it will have to take a much more complex and extended form than a weak news background or a complex geopolitical one can contribute to. The meetings of the Bank of England and the Fed resulted in a new decline in demand for the British dollar, although their results cannot be considered "positive only for the dollar." If the current wave marking does not become more complicated, then the decline in the British dollar may end within the next week. The pound experienced shock instead of joy and euphoria. The exchange rate of the pound/dollar instrument decreased by 10 basis points on May 6, but what difference does it make how much it lost on Friday if it ended Thursday with a result of -280 points? The pound has experienced another difficult week for itself, although the current wave marking suggests the imminent completion of his fall. I would like to note that the market practically ignored the results of the Bank of England meeting. To be more precise, the market reaction was not quite appropriate. After all, the British regulator raised the interest rate for the fourth time in a row, but the demand for the pound at the same time fell very much. From my point of view, such a reaction cannot be considered correct and indirectly indicates that the market is now trying to complete the downward trend section without violations in the wave marking and without complicating it. If this is true, then the construction will be completed in the near future, after which the pound may already rise quite a lot, as if playing back all the news that was ignored during its decline. Separately, I want to note that geopolitics is gradually weakening its influence on the pound and the euro. There have been no important events at the front in recent weeks, nevertheless, the Ukrainian-Russian conflict persists and is likely to be very protracted. Kyiv and Moscow show no signs of wanting to end the conflict. I mean, there are no real signs, since both sides would like to stop everything. This conflict is not beneficial for both of them and destroys their economy. Both sides are suffering huge financial losses. In addition, Ukraine is losing infrastructure, which will have to be rebuilt for many years, and the Russian Federation has already been isolated from most of the world and it will also take years to restore economic ties. However, Kyiv's position is as follows: the resumption of peace talks will be possible only if the Russian Federation withdraws its troops from the borders of Ukraine. Moscow's position is the opposite. Compromise is not possible at this time. General conclusions. The wave pattern of the pound/dollar instrument still assumes the construction of wave E. I continue to advise selling the instrument with targets located around the 1.2246 mark, which corresponds to 127.2% Fibonacci, according to the MACD signals "down". I don't see a pound below this mark yet. From my point of view, the construction of a downward section of the trend is nearing its completion and the mark of 1.2246 looks very good for the trend to end right around it. However, a successful attempt to break through this mark - and it will be possible to stay in sales.
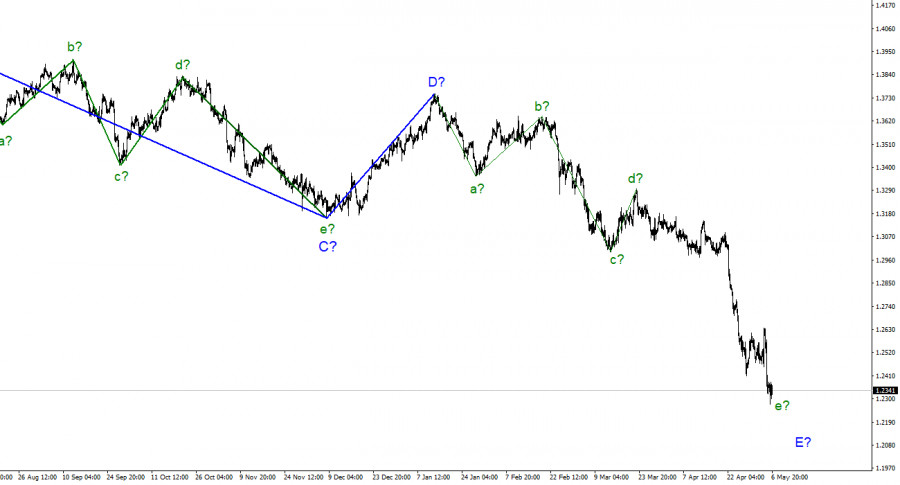
At the higher scale, wave D looks complete, but the entire downward section of the trend does not. Therefore, I still expect a continuation of the decline of the instrument with targets located around the 22nd figure. Wave E takes on a five-wave appearance but still doesn't look fully equipped. However, it already takes a little time to complete the complete set. The material has been provided by InstaForex Company - www.instaforex.com |
| EUR/USD analysis on May 8. American statistics: not strong enough for the dollar to rise again. Posted: 08 May 2022 06:47 AM PDT
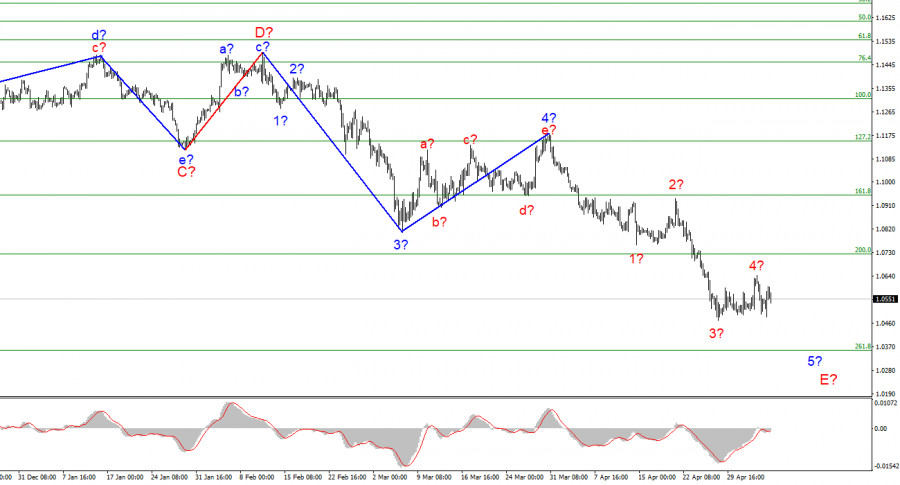
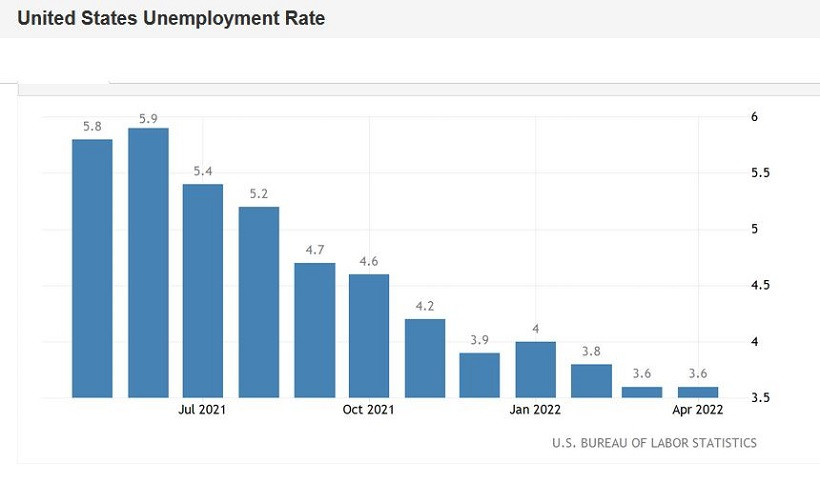
The wave marking of the 4-hour chart for the euro/dollar instrument continues to look convincing. The instrument continues the construction of the descending wave 5-E, which is the last in the structure of the descending trend section. If this is true, then the decline in the quotes of the euro currency may continue for another week, since this wave turns out to be a five-wave in its internal structure. At the moment, there are four internal waves visible inside this wave, so I'm counting on building another pulse wave. A successful attempt to break through the 1.0721 mark, which equates to 200.0% by Fibonacci, indicates that the market is ready for further sales of the euro currency. In the coming days, the instrument may decline to the level of 1.0355, and there only 350 basis points will remain to price parity with the dollar. Presumably, the construction of the current downward wave and the entire downward section of the trend can be completed near this mark. If the breakout attempt of 1.0355 turns out to be successful, the instrument will further complicate its wave structure and continue to decline. Payrolls in the USA did not disappoint. The euro/dollar instrument rose by 10 basis points on Friday. Yes, this is not a typo, it is 10 points, although the market activity was again at a height, the amplitude was almost 60 points. It should be noted that the tool has been moving very actively all this week, as there have been more than enough important events. Even if they did not please the market every day, they were very important, so their development was delayed for a long time, and not for 15-30 minutes, as usually happens when a report is released. Demand for the European currency mainly grew on Friday, but the instrument declined at night. It also declined after the release of American statistics, which turned out to be not super-beautiful, but at the same time very strong. The unemployment rate remained at 3.6%, although some expected it to fall to 3.5%. I think this is a very good value in any case, so it would be simply inadequate to expect a further decline in the indicator and get upset if this does not happen. The number of payrolls in April was 428K with slightly lower market expectations - also very good. Wages rose by 0.3% in April against market expectations of 0.4% - a slight discrepancy. Therefore, in general, the statistics turned out to be very decent and personally I am surprised that the demand for the American currency has increased only slightly. However, the US currency has been growing very briskly in recent weeks, so once the market could afford to rest and not finish off the European currency. If the current wave marking is correct and will not become more complicated in the future, then the decline of the euro currency will end soon. Of course, new negative geopolitical data may lead to a new decrease in demand for the EU currency. No one is immune from this, and no matter what the wave marking is, it can always take a more complex form. But at the moment, I believe that the construction of the downward trend section is being completed. Next, I expect the euro to rise, even if the news background does not support it. General conclusions. Based on the analysis, I still conclude that the construction of wave 5-E. If so, now is still a good time to sell the European currency with targets located around the 1.0355 mark, which corresponds to 261.8% Fibonacci, for each MACD signal "down". The construction of the proposed wave 4-5-E may have already been completed.
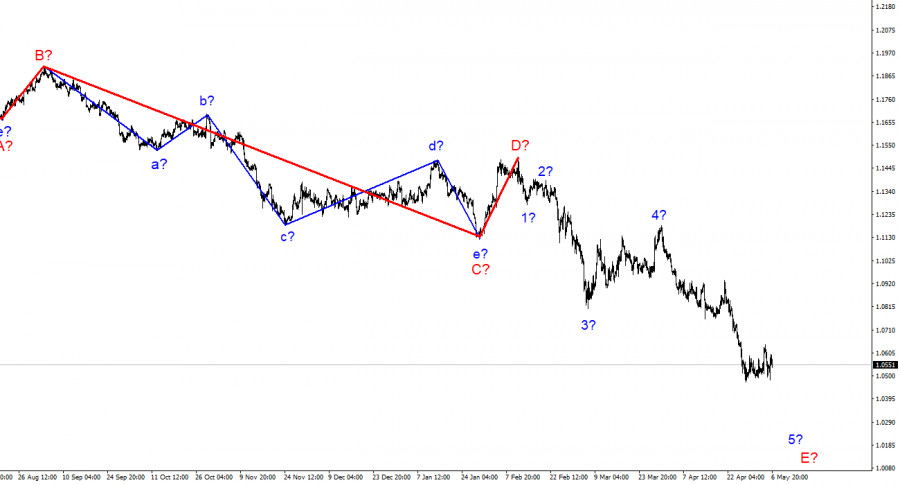
On a larger scale, it can be seen that the construction of the proposed wave D has been completed, and the instrument regularly updates its low. Thus, the fifth wave of a non-pulse downward trend segment is being built, which turns out to be as long as wave C. The European currency will still decline for some time. The material has been provided by InstaForex Company - www.instaforex.com |
| EUR/USD. Delayed action release: April Nonfarm did not impress traders Posted: 08 May 2022 06:42 AM PDT US Nonfarm did not disappoint, but did not impress market participants either. Despite the "red color" of the main indicator (the unemployment rate remained at 3.6%, despite the forecasted decrease to 3.5%), all other components came out in the green zone. The EUR/USD traders reacted quite calmly to the report, without creating a frenzy around the greenback. The bulls even managed to organize a slight correction, rolling back to the borders of the 6th figure. But the bears woke up in this price area, opening positions at a better price. In general, neither bears nor bulls EUR/USD dare to take any active actions of a large-scale nature. First of all, the Friday factor has an effect: traders take profits and do not risk re-entering short positions on the eve of the weekend. Therefore, in this case the Nonfarm is a time bomb. Most likely, the market will play this report next week.
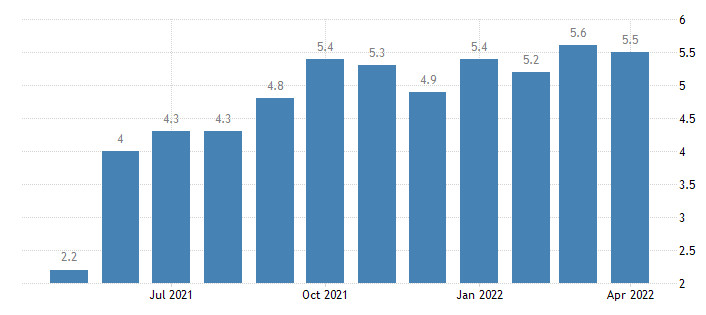
It cannot be said that the release is controversial, with its own strengths and weaknesses. After all, on one side of the scales - only the unemployment rate, which disappointed traders only by the fact that it came out at the level of the previous month. On the other side are all other components of the release that exceeded the predicted values. However, one should not forget here that the unemployment rate is currently in the area of 26-month lows. The last time the indicator was at 3.6% was in February 2020 (that is, before the coronavirus crisis), and before that, back in 1969. Therefore, it is impossible to talk about any disappointment here. The number of people employed in the non-agricultural sector increased by 428,000 in April (the same as in March), while experts expected to see this indicator slightly lower, at around 390,000. Over the past year, this component has fluctuated in the range of 440-680,000 (it "shot" up to 750,000 only in February of this year). In other words, this indicator did not disappoint either. The indicator of growth in the number of employed in the manufacturing sector similarly went into the green zone - instead of the projected increase by 24,000, it rose by 55,000. A similar situation has developed in the private sector of the economy - experts expected to see an increase of 380,000 jobs, but in fact the indicator grew by 480,000. One of the most important components of Friday's release also did not disappoint the dollar bulls. It's about the payroll issue. The average hourly wage on a monthly basis should have declined to 0.2%, while traders saw an increase to 0.3%. In annual terms, the index, in accordance with the forecast, fell minimally to 5.5% (after the March value of 5.6%), still remaining at a fairly high level. Here it is necessary to recall Federal Reserve Chairman Jerome Powell's press conference following the results of the US central bank's May meeting, where he paid a lot of attention to the US labor market, especially the salary issue. According to him, "wages are quite important, so it is very important that they grow." The report served as another confirmation of his words. Thus, the key data on the US labor market did not really disappoint, although it did not surprise with any breakthrough. The April Nonfarm came out "at the level" - quite sufficient for the Fed to continue to implement its announced strategy of tightening monetary policy. Therefore, in my opinion, the current upward pullback of EUR/USD is due solely to the Friday factor: there are no good reasons for a large-scale price increase on Friday.
In this context, it is also worth recalling that rather gloomy macroeconomic data were published in Germany on Friday. The "locomotive of the European economy" is stalling again - this time in the sphere of industrial production. Production fell to -3.9% in March. The indicator came out in the negative area for the first time since September last year. From a technical point of view, the pair continues to be under significant pressure, and almost on all higher timeframes. On the D1, W1 and MN charts, the pair is either between the lower and middle lines of the Bollinger Bands indicator, or on its lower line, which indicates the priority of the downward movement. The pair demonstrates a pronounced bearish trend, which is confirmed by the main trend indicators – Bollinger Bands and Ichimoku, which has formed a strong bearish Parade of Lines signal on all the above timeframes. All lines of the trend indicator are above the price chart, thus demonstrating pressure on the pair. The target of the downward movement is 1.0500. This is a psychologically important target. The main support level is 1.0450, which corresponds to the lower line of the Bollinger Bands indicator on the daily chart. The material has been provided by InstaForex Company - www.instaforex.com |
| GBP/USD. Bank of England's pessimism and the victory of Sinn Fein in Northern Ireland Posted: 08 May 2022 06:12 AM PDT Following the results of the May meeting, the Bank of England (BoE) raised the interest rate by 25 basis points, thus realizing the most predictable scenario. But despite another round of monetary tightening, the GBP/USD pair fell almost 300 points on Thursday, hitting a two-year price low. This happened for two reasons. Firstly, traders did not like the pessimistic rhetoric of BoE Governor Andrew Bailey, and secondly, the dollar began to strengthen its positions throughout the market again, having digested the results of the last Federal Reserve meeting. There is also a political factor, which, in my opinion, also contributed. As a result, the bears of the GBP/USD pair tested the 22nd figure on Friday - for the first time since the spring of 2020, when the coronavirus crisis created a real stir around the US currency.
The pair fell on Friday not only due to the strengthening of the greenback, but also due to the weakening of the pound. It is worth noting that the pound actually ignored the fact of the rate hike. After the release of the latest data on the growth of the consumer price index (which reflected the rise in inflation to 30-year highs), no one doubted that the BoE would conduct another round of monetary tightening. Therefore, the pound did not react to the rate increase - the market has long played this event. All attention was focused on the accompanying statements and forecasts of the central bank. And they, in turn, were not in favor of the British currency. First of all, the central bank warned of a projected sharp slowdown in GDP growth "in the near future." In particular, next year the central bank expects the economy to contract by 0.25%, while previously it was expected to grow by 1.25%. In 2024, according to the updated forecast, the volume of GDP will increase by 0.25%, while earlier forecasts spoke of a 1% growth. As you can see, the BoE has significantly revised its forecasts, significantly worsening them. At the same time, the central bank significantly raised the estimate for inflation in the UK in 2022 (from 5.75% to 10.25%, that is, to a 40-year high). Given such forecasts, it is not at all surprising that the word "stagflation" sounded quite often during Bailey's press conference. At the same time, he said that the members of the Committee do not agree with those people who believe that they should raise interest rates at a more aggressive pace. According to Bailey, "the central bank is concerned about the inflationary effects of the next round."The results of the May meeting of the BoE members puzzled market participants. By and large, the BoE has two main ways: either to raise the rate further, fighting inflationary growth (but at the same time pushing the economy into recession), or to put up with further growth in the consumer price index, hoping for an increase in GDP, or at least stagnation. It should be noted that such a dilemma will arise (or has already arisen) for many central banks of the world. But it was the English central bank that actually exposed this issue quite unambiguously. The reaction of the expert community was not long in coming: for example, according to currency strategists Standard Chartered and TD Securities, the BoE will slow down the pace of tightening monetary policy. In particular, according to Standard Chartered analysts, the British central bank will raise the rate in June and August, after which it will pause for an indefinite period. In general, the pessimistic attitude of Bailey, as well as the prospects for stagflation, offset the hawkish optimism that was associated with the actual increase in interest rates. The pound was under a wave of short positions. This happened against the backdrop of a general strengthening of the dollar, which came to its senses after the Fed's May meeting. Apparently, traders have realized one obvious, in general, fact: the Fed will act much more decisively this year (and, most likely, next), compared to the BoE, the European Central Bank and other central banks of the leading countries of the world. Therefore, the dollar bulls regained their confidence: the US dollar index tested the 104th figure on Friday. And yet, in my opinion, the pound's sharp decline on Thursday was associated not only with the disappointing results of the BoE's May meeting. Obviously, the political factor also played a role. The fact is that in Northern Ireland, which, as you know, is part of the UK, for the first time in history, the nationalist party Sinn Fein wins, the official program goal of which is the unification of Ireland: that is, the region's secession from Britain and joining the Republic of Ireland. According to The Irish Times, this will be the first time in 101 years since partition that the Nationalist Party has taken power in Northern Ireland. Let me remind you that the division of Ireland into two territories occurred in 1921 after the War of Independence. The island was divided into Northern - as part of the United Kingdom of Great Britain - and Southern Ireland (now the Republic of Ireland). Moods for secession from the British in Northern Ireland intensified after Britain left the European Union. Of course, it is still too early to talk about any practical steps in this direction. However, the very fact of the strengthening of the Sinn Fein party allowed the GBP/USD bears to increase the downward shaft.
As for the dollar's positions, here the dollar bulls are supported not only by the Fed, which has shown a hawkish attitude. The greenback is also supported by an external fundamental background. In particular, on Friday, the Russian Foreign Ministry announced that the Russian-Ukrainian negotiations "are in stagnation." Traders are also worried about the "Taiwan issue". Today it became known that Taiwan raised aircraft and put anti-aircraft missile systems on alert after 18 Chinese military aircraft entered the air defense zone of the island state. This news flow provoked an increase in anti-risk sentiment in the market. Thus, short positions on the GBP/USD pair remain a priority. The first and so far the main target of the downward movement is 1.2230 - this is the lower line of the Bollinger Bands indicator on the D1 timeframe. The material has been provided by InstaForex Company - www.instaforex.com |
| NFP gave the dollar a hint. The trend does not lose relevance, a new growth forecast has been named Posted: 07 May 2022 07:34 PM PDT
Balanced data came out on the US labor market on Friday, an impressive growth rate was maintained. As in March, 428,000 new jobs were created in April, which is higher than forecasted 390,000. Unemployment also remained unchanged from the previous month (3.6%). Overall, current employment is 1.2 million below pre-pandemic peaks and reflects full employment. The focus of traders in today's report on employment in the non-farm sector is the average wage. This is perhaps the most important economic indicator that has maintained support for Treasury yields and the dollar. US Average Hourly Wage Y/Y
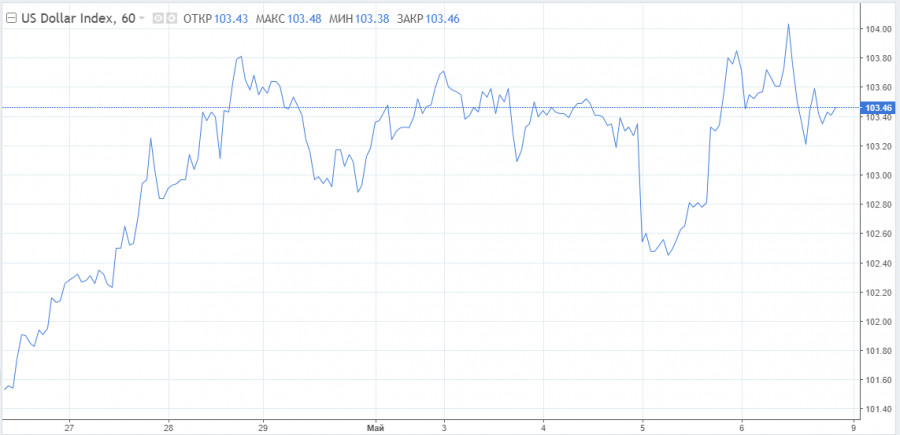
The average hourly wage rose by 0.3% in April compared to March and by 5.5% in annual terms. Historically, this is a high growth rate, but it is still not able to outpace the 8.5% price increase. However, wage growth has stabilized and is unlikely to push inflation sharply upwards, as it was before. It is worth noting that the current data does not provide for the need for a more stringent Federal Reserve rate hike. In other words, they are a kind of signal that the Fed will continue to adhere to the current course in monetary policy. Friday's balance of signals from the labor market should contain fluctuations in the stock and currency markets, but the trends will remain unchanged. The stock market will weaken, albeit at a slower pace, and the dollar will strengthen. At the end of the working week, the dollar index still conquered the 104.00 high, thus testing new peaks in almost 20 years. It wasn't difficult, as major competitors are losing customer support one by one. The US dollar now has good chances to settle above 104.00. The last time the index tried to climb higher, the economy and inflation needed to be stimulated. Now everything is quite the opposite - cooling is needed. Compared to last year, now the attitude towards the greenback has changed a lot, given that in 2021 the dollar was often talked about as losing its status. This sort of thing happens from time to time when things go downhill for a greenback. Now it is back on horseback and can overtake previous achievements. The rising value of the dollar, along with more attractive US Treasury yields, make it an almost uncompromising choice at the moment. Experts almost unanimously talk about the strength of the dollar. Economists at HSBC believe it will continue to rise. "We continue to believe that the US dollar will remain strong. First, the Fed's attitude to the corresponding pace of tightening may change if the situation requires it. Secondly, the 50bp momentum is likely to be maintained over the next few meetings. Third, while dollar bears will say that the Fed's aggressive hike is priced in, the same is true for most Big 10 central banks. And finally, the dollar will remain the most attractive buy in the face of global slowdown risks," strategists comment. On Friday, the US dollar index is under some selling pressure after reaching 104.00. However, the underlying bullish potential remains in place. A fresh surge above 104.00 should test 105.63 (11 December 2002 high) before targeting the December 2002 peak at 107.31.
Such movements of the US currency will force its key competitors to retreat further. Will European and Japanese officials calmly watch their names fall broadly? Probably not. This will exacerbate the existing economic problems and the situation with inflation. Japan managed to stop the strongest fall of the yen at the end of April, which stabilized near 130.00 against the dollar. Recently, there has been a wave of intensification from politicians about a possible tightening of rates to match the pace of tightening from the Fed. So far, these are only verbal interventions, and the greenback looks extremely confident. If next week it manages to settle above 104.00 on the index, then the bulls' appetite will rise significantly. The 107.00 level, the next technical stop may well be the value of 120.00. Here we are talking about the high since the beginning of this century. The material has been provided by InstaForex Company - www.instaforex.com |
| The main European indicators showed a fall Posted: 07 May 2022 07:34 PM PDT
The main European indicators showed a fall at the close of trading on Thursday. The composite European index STOXX Europe 600 fell by 0.7%. All other indices of the region also showed a decrease to 1%: the German DAX by 0.49%, the French CAC 40 - by 0.43%. The Italian FTSE MIB lost 0.6% and the Spanish IBEX 35 lost 0.77%. The British FTSE 100 index showed a slight increase (by 0.13%). Pessimistic moods of the market participants are caused, first of all, by the results of the US Federal Reserve meeting. As it became known, the central bank decided to raise the interest rate to 0.75-1%. Thus, as predicted by most analysts, the rate was increased immediately by 50 basis points. The Fed also announced a planned reduction in the balance of financial assets from June 1 this year.After such reports, American indicators fell much more than European ones - by 3-4.6%. Investors are concerned about the potential impact of monetary tightening on the economic situation. Globally, markets are also affected by geopolitical tensions. The growth of the British indicator is due to the strong weakening of the national currency of the country. The pound lost more than 2% against the US dollar. The Bank of England raised its interest rate to 1% from 0.75% for the fourth time in a year. Now it has reached its highest level since 2009. However, the markets were ready for this, as experts predicted an increase in the interest rate in advance. The central bank also increased the price growth forecast for 2022 to 10.25% (from 5.75%) and also for 2023 to 3.5% (from 2.5%). At the same time, the forecast for an increase in GDP for 2022 remained unchanged - an increase of 3.75% is expected, however, estimates of GDP growth for the next year have changed - a decrease in the indicator by 0.25% is expected (previously it was predicted to grow by 1.25%). According to the latest reports, the volume of orders of industrial enterprises in Germany decreased by 4.7% in March compared to the level at which it was a month earlier. The volume of industrial production in France decreased by 0.5% in March compared to the previous month. However, the decline was even greater in February - 1.2%. Despite positive data from Bayerische Motoren Werke AG (BMW) corporate reporting, namely a fourfold increase in quarterly profit, its stock quotes fell by 1.8%. Shell gained 3.1% as a result of Shell's 26% increase in net quarterly profit even after losing $3.9 billion due to the suspension of operations in the Russian market. Credit Agricole reported a 47% decrease in net profit, as a result of which its shares lost 4%. At the same time, another company from the same field, UniCredit, managed to make a profit of 1.16 billion euros, compared with last year's mark of 829 million euros. Due to this, the value of the company's securities increased by 2.1%. Leonardo S.p.A. stock quotes declined by 0.85%, despite the fact that the company managed to reach a profit level and increase revenues, as well as confirm its forecast for revenues for 2022 in the amount of 14.5-15 billion euros. As a result of the growth of Airbus SE's net quarterly profit, its capitalization tripled by 6.3%. The company has become one of the leaders among the components of the STOXX Europe 600 indicator. Some of the other companies that make up this indicator showed a decrease in share prices: Verbund AG by 12.8%, Just Eat Takeaway by 11.7%, and Zalando by 10.6%. The material has been provided by InstaForex Company - www.instaforex.com |
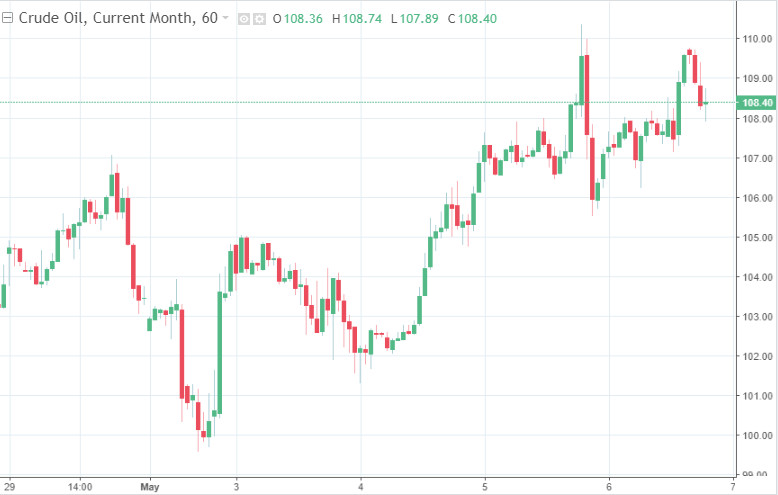
| EU's tough stance pushed oil prices to spectacular growth Posted: 07 May 2022 07:34 PM PDT During the trading session on Friday, world prices for black gold are permanently increasing and at one point, they have already gained more than 2%. Commodity market participants discussed the possibility of an imminent oil shortage against the backdrop of EU statements and the OPEC + decision. Thus, the cost of July Brent futures rose by 2.17% to $113.29 per barrel. As a result of trading on Thursday, these contracts increased in price by 0.7% - up to $110.9 per barrel.
Meanwhile, the price of June futures for WTI crude oil jumped on Friday by 2.12% to $110.56 per barrel. As a result of trading the day before, the cost of these contracts rose by 0.4% to $108.26 per barrel. The focus of investors on Friday is OPEC+'s announcement yesterday that it will maintain its plan to increase the quota for increasing total oil production next month by 432,000 barrels per day. Despite the permanent increase in quotas from the summer of 2021, the members of the alliance cannot reach the permitted level of oil production. So, according to the results of the past March, this indicator is behind by 1.45 million barrels per day.
The day before the announcement of the OPEC + decision, European Commission President Ursula von der Leyen announced the sixth package of sanctions against the Russian Federation. According to her, the new package of restrictions provides for the phased introduction of a complete oil embargo within six months. Ursula von der Leyen's statement about drastic measures regarding Russian raw materials instantly pushed oil prices up. Experts believe that the implementation of the EU plan may provoke an unforeseen reduction in part of the expected supply in the black gold market. At the same time, there is a possibility that Russia will stop supplying oil to the EU countries before the time allotted by the euro region for a step-by-step refusal to import Russian raw materials has expired. Then Europe will be forced to look for alternative sources of black gold as soon as possible. In addition, the US authorities recently announced plans to purchase oil from the market in order to replenish the strategic reserve. It is expected that soon the Ministry of Energy of the country will start accepting applications from sellers of black gold. By the way, recently market experts have begun to talk more and more often about the prospects for the risk of secondary US sanctions on oil supplies from Russia. If such restrictive measures are taken, countries purchasing Russian energy resources will face additional difficulties. If the United States does not take this step, states such as India and China will be able to significantly increase the purchase of oil from the Russian Federation, which will allow the EU countries to turn to other sources of energy. Analysts warn that, in the event of the termination of Russian oil exports to the states of the eurozone, world prices for black gold will begin to increase significantly. The material has been provided by InstaForex Company - www.instaforex.com |
| You are subscribed to email updates from Forex analysis review. To stop receiving these emails, you may unsubscribe now. | Email delivery powered by Google |
| Google, 1600 Amphitheatre Parkway, Mountain View, CA 94043, United States | |





Comments