Forex analysis review
Forex analysis review |
- Forecast for AUD/USD on May 18, 2022
- Technical analysis of GBP/USD for May 17, 2022
- Stock Europe closes trading with strong growth
- How to trade EUR/USD on May 18? Simple tips for beginners.
- EUR/USD. Temporary retreat of the dollar and hawkish messages of Klaas Knot
- Technical analysis of EUR/USD for May 17, 2022
- May 17, 2022 : EUR/USD daily technical review and trading opportunities.
- May 17, 2022 : EUR/USD Intraday technical analysis and trading plan.
- May 17, 2022 : GBP/USD Intraday technical analysis and significant key-levels.
- Trading Signal for USD/CAD on May 17-18, 2022: buy above 1.2817 (5/8 Murray - 200 EMA)
- GBP/USD analysis on May 17. Jerome Powell's performance is unlikely to be interesting.
- EUR/USD analysis on May 17. Christine Lagarde with her "dovish" rhetoric can greatly hinder the euro
- Short-term technical analysis on Gold for May 17, 2022.
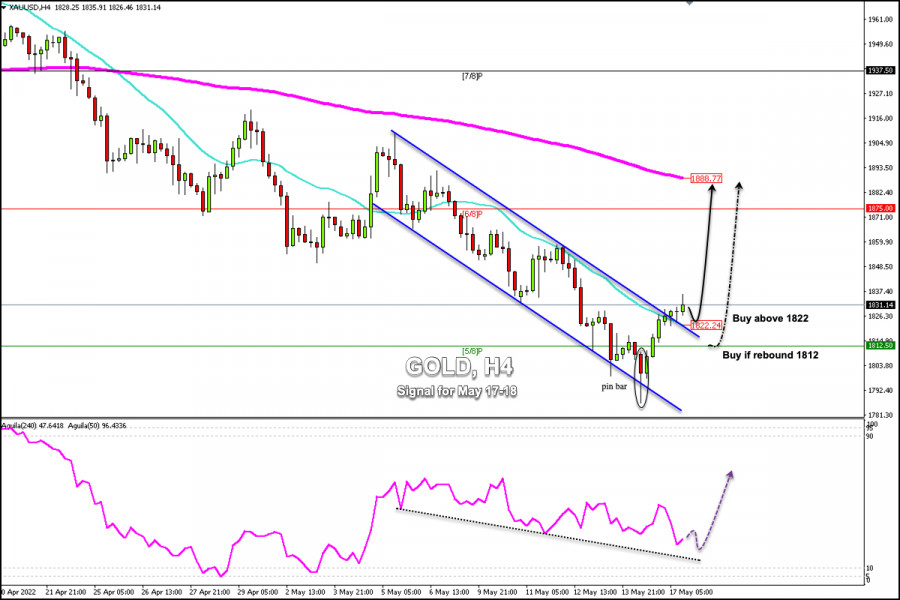
- Trading Signal for Gold (XAU/USD) on May 17-18, 2022: buy in case of rebound at 1,822 (21 SMA - 5/8 Murray)
- Ichimoku cloud indicator analysis on EURUSD for May 17, 2022.
- Short-term Bitcoin analysis for May 17, 2022.
- GBPUSD turns higher as expected from our previous analysis.
- EURUSD bears lure opponents into a trap
- Development of digital euro set to begin in 2023
- US Dollar Index Technical Analysis and Trading Tips for May 17, 2022
- Dollar expects Powell's support
- Dollar Index: Is the dollar falling?
- AUD/USD: RBA considered 3 scenarios in May meeting
- US stock indexes down on Monday
- Forecast for EUR/USD on May 17. Unexpectedly: the euro currency started strong growth
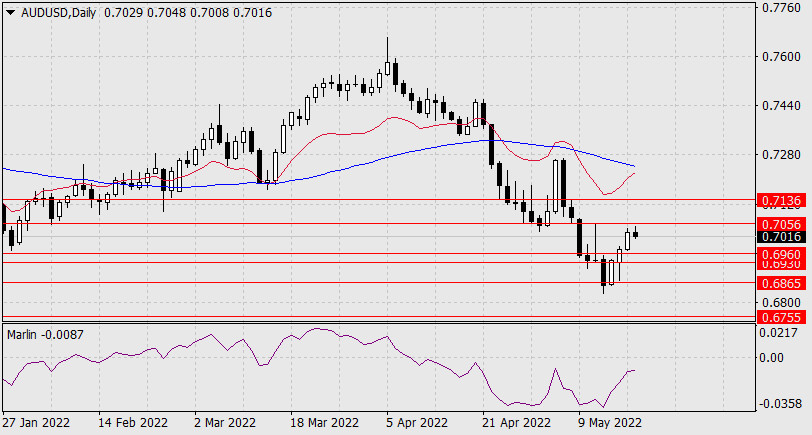
| Forecast for AUD/USD on May 18, 2022 Posted: 17 May 2022 07:47 PM PDT The Australian dollar fell 8 points short of the target level of 0.7065 and went down in today's Asian session. Although it should be clarified - the 0.7065 level is still not so much a target, but a record one, determined by the high on May 11 and the supports of February and April 2019.
There are other extremes, coinciding with today's high of 0.7048. Therefore, the target levels, as always, are not an absolutely accurate parameter, and by the nature of the current decline, it is very similar to the fact that the price reversed precisely from the level reached, for example, from the high on July 4, 2019 or from the resistance of ten-day period of January 2016. Falling below the range of 0.6930/60 will give the bears a second wind. The target will be the 0.6755 level. The Marlin Oscillator shows the intention to turn down. But it's too early to talk about a reversal. The optimal solution would be a waiting tactic.
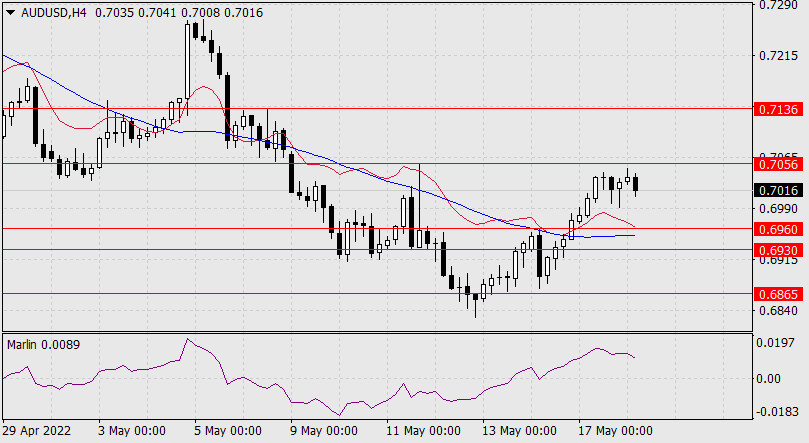
The Marlin Oscillator is turning down more decisively on the H4 chart. The MACD's indicator line is in the target range of 0.6930/60, which increases its significance. Falling below 0.6930 will create a good precondition for a medium-term decline. An exit above 0.7056 opens the target at 0.7136 – May 6 high and April 25 low. The material has been provided by InstaForex Company - www.instaforex.com |
| Technical analysis of GBP/USD for May 17, 2022 Posted: 17 May 2022 03:08 PM PDT
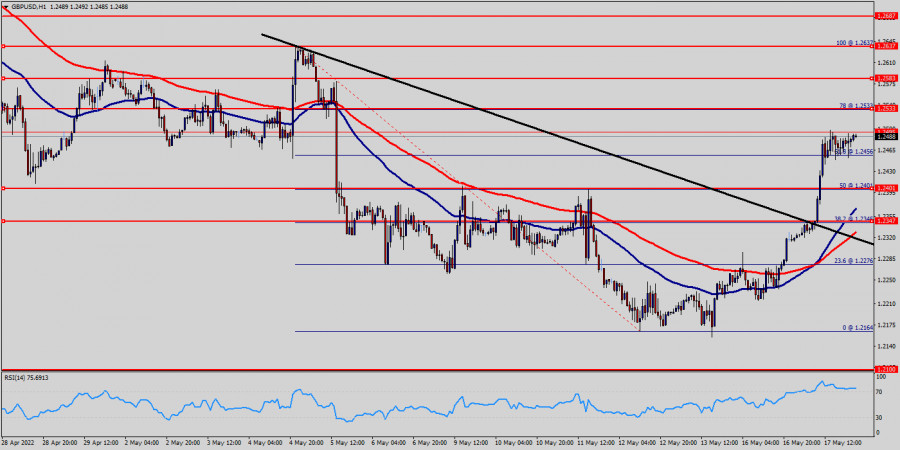
The GBP/USD pair continued moving upwards from the level of 1.2347. The pair rose from the level of 1.2347 (weekly support) to the top around 1.2488. Today, the first support level is seen at 1.2401 followed by 1.2347, while daily resistance is seen at 1.2533. According to the previous events, the GBP/USD pair is still moving between the levels of 1.2401 and 1.2533; for that we expect a range of 132 pips in coming hours. This would suggest a bullish market because the RSI indicator is still in a positive area and does not show any trend-reversal signs. This is confirmed by the RSI indicator signaling that we are still in a bullish market. The price is still above the moving average (100) and (50). Furthermore, if the trend is able to break out through the first resistance level of 1.2583, we should see the pair climbing towards the new double top (1.2637) to test it. On the contrary, if a breakout takes place at the support level of 1.2347, then this scenario may become invalidated. Remember to place a stop loss; it should be set below the second support of 1.2276. The material has been provided by InstaForex Company - www.instaforex.com |
| Stock Europe closes trading with strong growth Posted: 17 May 2022 02:56 PM PDT From the very beginning of the trading session on Tuesday, key European indices have been increasing spectacularly thanks to strong macroeconomic statistics for the region. The aggregate indicator of the leading companies in Europe, the STOXX Europe 600, increased by 1.68% to 440.96 points at one point. The highest results among the components of the STOXX Europe 600 index were shown by the securities of the Polish logistics company InPost S.A., which increased in price by 8.4%. The main outsiders here were the shares of the Norwegian semiconductor manufacturer Nordic Semiconductor ASA, which decreased by 2.5% The French CAC 40 was up 1.29%, the German DAX was up 1.47%, and the British FTSE 100 was up 0.86%.
By the way, over the past month, the leading indicators of the European stock market have significantly decreased: the German DAX lost 1.2%, the French CAC 40 – 3.7%, and the British FTSE 100 – 2%. The main downward factors for stock exchange indicators in April were investors' concerns about the increase in base interest rates by the US Federal Reserve, hard lockdowns against the background of the spread of COVID-19 in China and the armed conflict between Russia and Ukraine. Analysts predict that the combination of these factors will cause the fall of key stock indexes in Europe this month. On Tuesday, the focus of European traders was on macroeconomic statistics for the region. Thus, according to the second estimate of economists from the Statistical Office of the European Union, in January-March 2022, the gross domestic product (GDP) of 19 eurozone countries increased by 5.1% in annual terms and by 0.3% in quarterly terms. According to the first assessment of experts, each of the above indicators was lower by 0.1 percentage points. A day earlier, the European Commission lowered the GDP growth forecasts of the euroregion states for 2022 to 2.7% from 4%, announced in February. At the same time, the forecast of an increase in the indicator for next year worsened to 2.3% from 2.7%.According to the National Statistical Office of Great Britain, the unemployment rate in the country in the last quarter sank to 3.7% from the level of 3.8% in December-February. This quarterly result was the lowest since 1974. At the same time, experts predicted that the indicator would remain at the same level. In addition, in April, the number of applications for unemployment benefits in the UK fell to just under 57,000. France also contributed its positive contribution to the overall statistics on the bloc. Thus, in the first quarter of this year, the unemployment rate in the country fell to the lowest level in the last 14 years – to 7.3%. Another important stimulus for the growth of the European market on Tuesday was corporate news. The shares of the British tobacco company Imperial Brands jumped in value by almost 7%, thanks to the release of positive financial results. In the first quarter of the current financial year, Imperial Brands managed to show growth even despite leaving the Russian market. The quotes of one of the world's largest mobile operators Vodafone Group PLC are losing 2.8% in price on the company's forecasts that profit growth in 2022 will be lower than analysts' expectations due to difficult economic conditions. The capitalization of ContourGlobal, which is engaged in the purchase, development and management of energy generating enterprises, soared by 33% at the time of writing. The main catalyst for the spectacular rise in shares was the news that the American investment company KKR is buying an electricity production company for $2.16 billion. The share price of the Swiss chemical company Clariant is growing by 8.3%. The day before, Clariant management announced that the previously postponed annual financial report will be published on Thursday. The securities of the French energy company Engie S.A. increased by 5.8% on the background of the publication of strong reporting for the first quarter. Over the past period, the company's revenue has almost doubled. The material has been provided by InstaForex Company - www.instaforex.com |
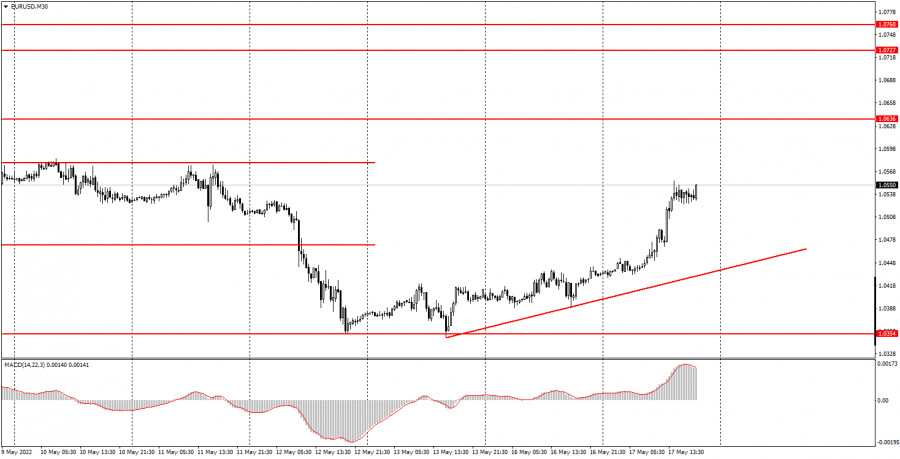
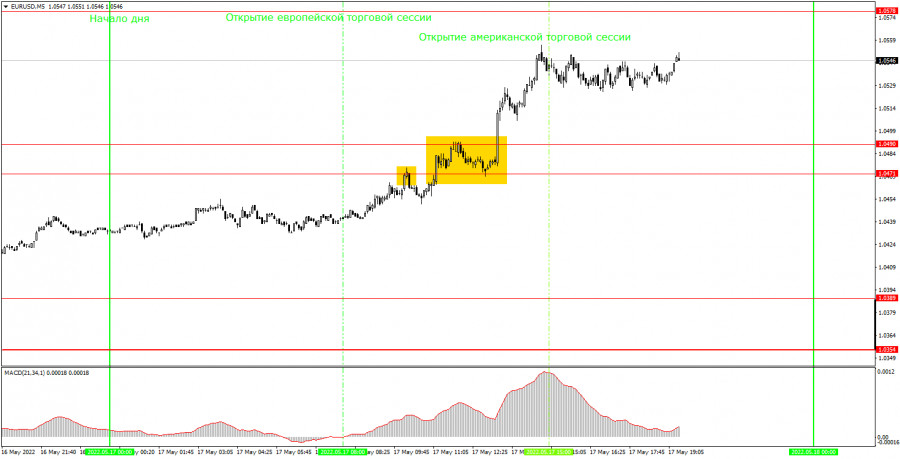
| How to trade EUR/USD on May 18? Simple tips for beginners. Posted: 17 May 2022 02:56 PM PDT Analysis of Tuesday deals:30M chart of the EUR/USD pair
The EUR/USD currency pair showed a fairly strong growth on Tuesday. On the one hand, one can try to link this growth with macroeconomic statistics, which were in abundance on Tuesday. And on the other hand, we are more inclined to believe that the market is tired of selling the pair and the "technical factor" of the need to correct from time to time has worked. Consider macroeconomics. In the morning, the European Union published a report on GDP for the first quarter in the second assessment. If the first assessment recorded an increase of 0.2%, then in the second assessment this figure increased and amounted to 0.3%. The difference is small, but still the market had formal reasons for buying the euro. After lunch, two "medium" reports were published in the United States. While retail sales rose 0.9% in April, just 0.1% below the forecast, industrial production rose 1.1%, up 0.7% from the forecast. Thus, in the second half of the day there were grounds for the dollar's growth, although rather weak. The dollar failed to grow, so we tend to conclude that the reasons for the euro's growth were purely technical. An ascending trend line has already been formed, which supports bulls. For the first time in a long time, the euro has a real chance of growth. 5M chart of the EUR/USD pair
The technical picture is still very simple on the 5-minute timeframe. However, there was a good trend movement on Tuesday, unlike Monday. Unfortunately, it was not possible to get a big profit, but they still managed to earn something. The main problem was that the upward movement could not be determined immediately. The first signal was for short positions, when the price rebounded from the level of 1.0471. Therefore, initially novice traders could open a short position and receive a small loss on it. The next signal for longs was already correct, but formed rather late. Plus, the candle on which it finally formed turned out to be very strong and closed much above the level of 1.0490. Nevertheless, it was still possible to work out this signal. Since the pair failed to reach the target level of 1.0578 until the very evening, the deal had to be closed manually. The profit on it was about 25 points, which is not much more than the loss on the first trade. How to trade on Wednesday:A new ascending trend line has formed on the 30-minute timeframe. Therefore, in the near future we can count on continued strengthening of the European currency. We do not see that this currency is supported by a fundamental or macroeconomic background, but the pair can easily go up 200-300 just as part of a technical correction. On the 5-minute TF, it is recommended to trade at the levels of 1.0354, 1.0389, 1.0471-1.0490, 1.0578-1.0593. When passing 15 points in the right direction, you should set Stop Loss to breakeven. On Wednesday, the European Union will publish the consumer price index (inflation) for April. This is again the second, final estimate of the indicator, and it may differ slightly from the first. However, we do not believe that the market reacted today only to the GDP report, so tomorrow the reaction to the inflation report is unlikely to be strong. On the other hand, only minor reports will be published in America. Basic rules of the trading system:1) The signal strength is calculated by the time it took to form the signal (bounce or overcome the level). The less time it took, the stronger the signal. 2) If two or more deals were opened near a certain level based on false signals (which did not trigger Take Profit or the nearest target level), then all subsequent signals from this level should be ignored. 3) In a flat, any pair can form a lot of false signals or not form them at all. But in any case, at the first signs of a flat, it is better to stop trading. 4) Trade deals are opened in the time period between the beginning of the European session and until the middle of the American one, when all deals must be closed manually. 5) On the 30-minute TF, using signals from the MACD indicator, you can trade only if there is good volatility and a trend, which is confirmed by a trend line or a trend channel. 6) If two levels are located too close to each other (from 5 to 15 points), then they should be considered as an area of support or resistance. On the chart:Support and Resistance Levels are the Levels that serve as targets when buying or selling the pair. You can place Take Profit near these levels. Red lines are the channels or trend lines that display the current trend and show in which direction it is better to trade now. The MACD indicator (14,22,3) consists of a histogram and a signal line. When they cross, this is a signal to enter the market. It is recommended to use this indicator in combination with trend lines (channels and trend lines). Important speeches and reports (always contained in the news calendar) can greatly influence the movement of a currency pair. Therefore, during their exit, it is recommended to trade as carefully as possible or exit the market in order to avoid a sharp price reversal against the previous movement. Beginners on Forex should remember that not every single trade has to be profitable. The development of a clear strategy and money management are the key to success in trading over a long period of time. The material has been provided by InstaForex Company - www.instaforex.com |
| EUR/USD. Temporary retreat of the dollar and hawkish messages of Klaas Knot Posted: 17 May 2022 02:56 PM PDT The EUR/USD pair demonstrates corrective growth, reacting to the hawkish statements of the European Central Bank representative. Bulls took advantage of the situation, especially against the backdrop of a general weakening of the dollar, which lost ground throughout the market. Looking ahead, it should be noted that the dollar is consolidating after a rapid rise to multi-year highs. That is, it is impossible to talk about a trend reversal. The US dollar index hit an almost 20-year high last week, appearing in the area of the 105th figure. The last time it was at this level was at the end of 2002. Therefore, it is not surprising that after such a large-scale dollar rally, the greenback retreated several steps: the index stood at the 103.40 mark. The temporary weakening of the greenback affected all dollar pairs of the major group, including EUR/USD. Bulls were able to return to the area of the 5th figure, although the low was at 1.0389 on Monday.
Under the circumstances, a corrective price increase looks quite logical and predictable. At the end of last week and at the start of the current five-day period, the EUR/USD bears came close to five-year price lows (1.0340 area) on the wave of the downward trend. In three months, the bears have moved more than 1000 points, breaking such strong support levels as 1.1000 and 1.0650. In the first case, we are talking about a psychologically important target, which opened the door for the bears to the area of 7-8 figures. The mark of 1.0650 is also significant in a sense. This is the price low that was reached in March 2020 during the first wave of the coronavirus crisis. Many experts doubted that in 2022 traders will be able to go below this level, which was too tough for the bears two years ago. But contrary to skeptical forecasts, EUR/USD bears continued their downward path and stopped only in the area of 5-year price lows. If they had overcome the mark of 1.0340 (and settled below it), then in this case one could seriously talk about achieving parity. The pair would trade at 20-year lows. Obviously, for such a breakthrough, an additional information impulse is needed. Federal Reserve representatives (in particular, John Williams) over the past few days continued to pump traders with hawkish messages, but this was not enough to overcome such an important price barrier as 1.0340. John Williams and Loretta Mester confirmed earlier reports that the Fed is ready to raise interest rates in 50-point increments "in the next few meetings." Such signals allowed the EUR/USD bears to once again enter the area of the third figure, but did not allow them to test the above support level. In my opinion, in order to implement this scenario, tougher rhetoric from the Fed was needed - for example, in the context of the central bank's readiness to raise the rate by 75-point steps. This option of the development of events is not hypothetically excluded, but so far they are not seriously talking about it. Therefore, it is not surprising that without the appropriate information feed, the downward momentum gradually faded away - traders did not dare to hold short positions for a long time on the threshold of a powerful price line with a long "history". Against the backdrop of a general weakening of the greenback, bulls seized the initiative for the pair, organizing a corrective growth. This was also facilitated by the chairman of the central bank of the Netherlands Klaas Knot. He said a 50 basis point ECB rate hike "shouldn't be left off the agenda, especially if inflation shows a strong upward momentum over the next few months." He also called "absolutely realistic" the option of a 25-point increase following the results of the July meeting. Let me remind you that, according to analysts at Goldman Sachs, the ECB may raise interest rates by 25 basis points in July, September and December. If we talk about longer-term prospects, here the strategists of the financial conglomerate predict four increases within the next year.
But here it should be noted that the head of the ECB and the chief economist of the central bank have so far taken a rather cautious position on this issue. They do not exclude the option of raising the rate after the completion of the stimulus program (at the end of the third quarter). However, at what pace rates will rise and for how long is an open question. Lagarde and the rest of the most influential members of the ECB prefer not to voice clear and unambiguous forecasts. In addition, the ECB, even against the backdrop of Knot's hawkish statements, looks too "sluggish" and slow compared to the Fed, which, in fact, announced several rounds of 50-point rate hikes. In addition, the single currency is too vulnerable to a reversal of the EUR/USD trend against the backdrop of an impending energy crisis, increased risks of stagflation, sanctions confrontation with Russia, and fruitless Russian-Ukrainian negotiations. Thus, it is advisable to use the current corrective growth to open short positions, especially if EUR/USD bulls fail to overcome the resistance level of 1.0580 (the middle line of the Bollinger Bands indicator on the daily chart). If the upward momentum begins to fade in this price area, short positions will again be in a trend with targets of 1.0500 (Tenkan-sen line on D1), 1.0450 and 1.0400 in the medium term. The material has been provided by InstaForex Company - www.instaforex.com |
| Technical analysis of EUR/USD for May 17, 2022 Posted: 17 May 2022 02:31 PM PDT
The EUR/USD pair faced resistance at the level of 1.0578, while minor resistance is seen at 1.0540. Support is found at the levels of 1.0495 and 1.0461. Pivot point has already been set at the level of 1.0461. Equally important, the EUR/USD pair is still moving around the key level at 1.0461, which represents a daily pivot in the H1 time frame at the moment. Yesterday, the EUR/USD pair continued moving upwards from the level of 1.0461. The pair rose to the top around 1.0550 from the level of 1.0461 (coincides with the ratio of 38.2% Fibonacci retracement). In consequence, the EUR/USD pair broke resistance, which turned into strong support at the level of 1.0461. The level of 1.0461 is expected to act as the major support today. We expect the EUR/USD pair to continue moving in the bullish trend towards the target levels of 1.0578 and 1.0648 (last bullishw ave). On the downtrend: If the pair fails to pass through the level of 1.0578, the market will indicate a bearish opportunity below the level of 1.0578. So, the market will decline further to 1.0495 and 1.0461 to return to the daily support. Moreover, a breakout of that target will move the pair further downwards to 1.0349 in order to form the double bottom. The material has been provided by InstaForex Company - www.instaforex.com |
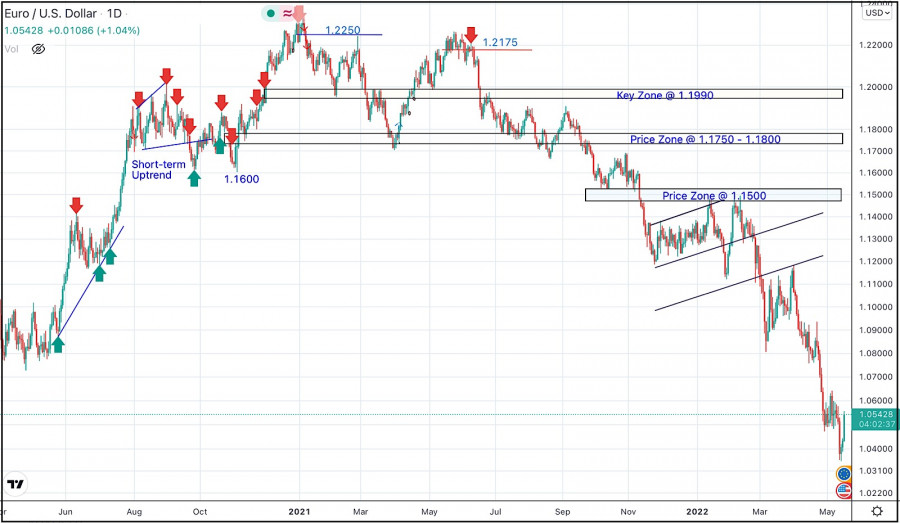
| May 17, 2022 : EUR/USD daily technical review and trading opportunities. Posted: 17 May 2022 10:06 AM PDT
In late September, Re-closure below the price level of 1.1700 has initiated downside-movement towards 1.1500 where some recovery was witnessed. Shortly after, Price levels around 1.1700 managed to hold prices for a short period of time before another price decline took place towards 1.1200. Then the EURUSD has temporarily moved-up within the depicted movement channel until downside breakout occurred recently. Since then, the price zone around 1.1500 has applied significant SELLING pressure when a valid SELL Entry was offered upon the previous ascending movement towards it. Shortly after, the EURUSD looked oversold while approaching the price levels of 1.0800. That's where the recent upside movement was previously initiated. That's why, the recent movement towards 1.1200 was considered for another SELL Trade which is already running in profits now. For beginners, the current price levels are too low to have SELL trades around. Hence, intraday BUY trades are considered a better option. Any ascending movement above 1.0600 will probably enable more advancement towards 1.0700 and 1.0850. Otherwise, conservative traders should stay out of the market. The material has been provided by InstaForex Company - www.instaforex.com |
| May 17, 2022 : EUR/USD Intraday technical analysis and trading plan. Posted: 17 May 2022 10:05 AM PDT
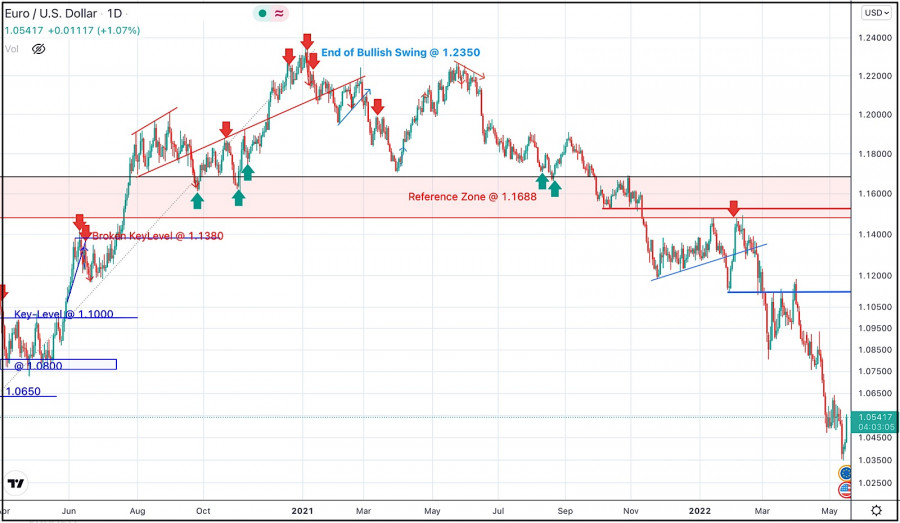
A short- term sideway movement was demonstrated within the highlighted zone around 1.1600 before quick bearish decline could occur towards 1.1200. On the other hand, the price zone around 1.1500 - 1.1600 remained a reference zone that applied significant bearish pressure upon two successive bullish visits before another bearish continuation sign was expressed. Hence, downside movement proceeded towards 1.1000 then 1.0920 where short-term bullish pullback was initiated. The price levels around 1.1150 hindered further bullish movement before another bearish move was aggressively expressed towards 1.0500. Failure to persist below the newly-recorded LOW at 1.0350 will probably enable another bullish pullback at least towards 1.0800 and probably 1.1150. Until then, Intraday traders shouldn't have any BUY trades unless bullish persistence above 1.0650 is achieved first. The material has been provided by InstaForex Company - www.instaforex.com |
| May 17, 2022 : GBP/USD Intraday technical analysis and significant key-levels. Posted: 17 May 2022 10:04 AM PDT
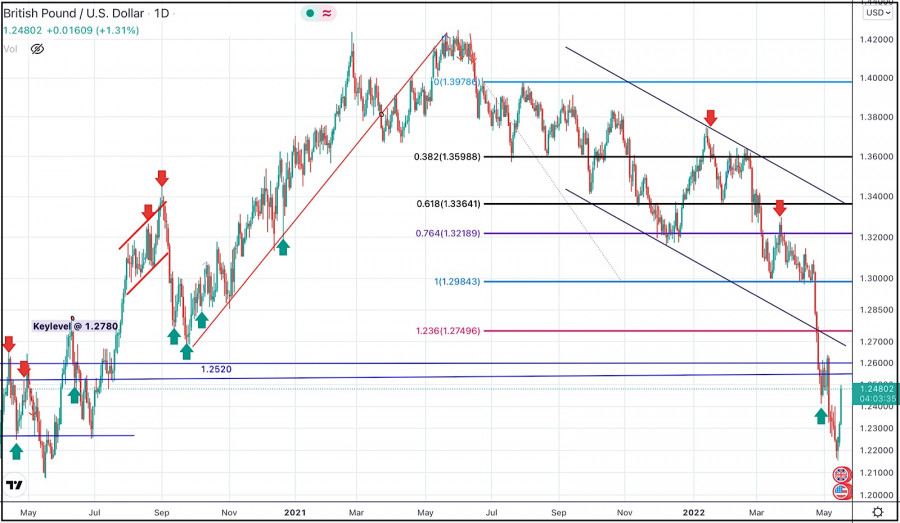
The GBPUSD pair has been moving within the depicted bearish channel since July. Sideway movement was expressed above 1.3600 while the price levels around 1.3730 - 1.3800 were considered as they offered significant bearish rejection. The short-term outlook turned bearish when the market went below 1.3600. This enhanced the bearish side of the market towards 1.3200 which brought the pair back towards 1.3600 for another re-test. Hence, the recent bullish pullback towards 1.3600 should have been considered for SELL trades as it corresponded to the upper limit of the ongoing bearish channel. Shortly after, Bearish persistence below 1.3360 was needed to enable further downside continuation towards 1.2980 - 1.3000. Bullish rejection has arised many times around 1.3000 standing as a significant Daily Support where the previous consolidation range has arised. This happened before another bearish decline could take place earlier this week. Another bearish breakout below 1.2980 has enabled quick bearish extension towards 1.2600-1.2550 where some bullish recovery and a short-term sideway movement could be established before another downside movement was expressed. Previous bearish decline was expected to extend towards 1.2100 where some bullish recovery could be expected. However, considerable bullish rejection was expressed slightly below 1.2200 Bullish breakout above 1.2400 is needed to abolish the short-term bearish scenario and may enable quick bullish advancement towards 1.2550, 1.3300 and probably 1.3600 if sufficient bullish momentum is expressed. The material has been provided by InstaForex Company - www.instaforex.com |
| Trading Signal for USD/CAD on May 17-18, 2022: buy above 1.2817 (5/8 Murray - 200 EMA) Posted: 17 May 2022 08:40 AM PDT
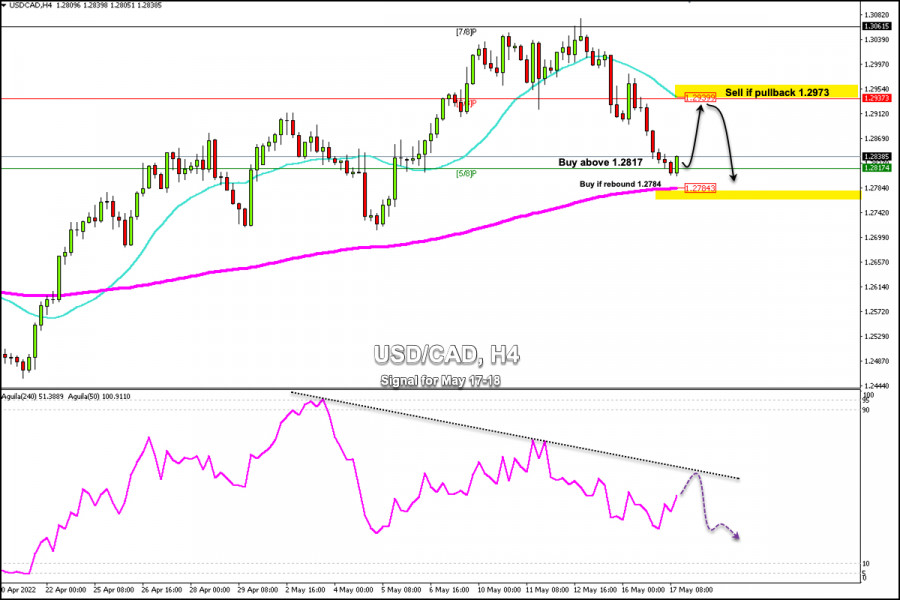
Early in the American session, the Canadian dollar (USD/CAD) is showing signs of a technical bounce, and is trading above 5/8 Murray and below 21 SMA. Having reached the psychological level of 1.30 on May 11, the loonie started a strong technical correction and is likely to find support around the 200 EMA located at 1.2784. Investors believe that the Fed will continue with its interest rate increases at a pace of at least 0.50% in its next meetings. The markets have already priced in this scenario and the US dollar is likely to make a technical correction in the coming days which could set the stage for the strengthening of the Canadian dollar. The short-term trend for the USD/CAD pair is bearish. However, we can expect a technical bounce so that the pair could reach the 21 SMA or 6/8 Murray around 1.2937. The bottom line would be to wait for the USSD/CAD pair to decline to 1.2939. So, we could sell with targets at 1.2817 and the 200 EMA at 1.2784. Additionally, a sharp break and a daily chart close below 1.2784 will mean that the Canadian dollar has entered a bearish phase and any momentum will be seen as an opportunity to sell with short-term targets at 1.2500. Our trading plan for the next few hours is to buy the Canadian dollar above 1.2817 or in the event of a technical bounce around 1.2784 (200 EMA) with targets at 1.2890 and 1.2939 (21 SMA). The material has been provided by InstaForex Company - www.instaforex.com |
| GBP/USD analysis on May 17. Jerome Powell's performance is unlikely to be interesting. Posted: 17 May 2022 08:32 AM PDT
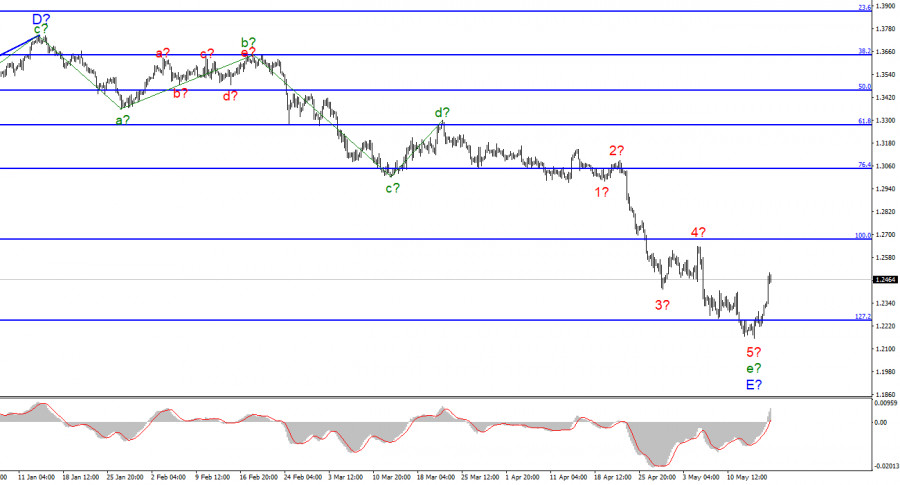
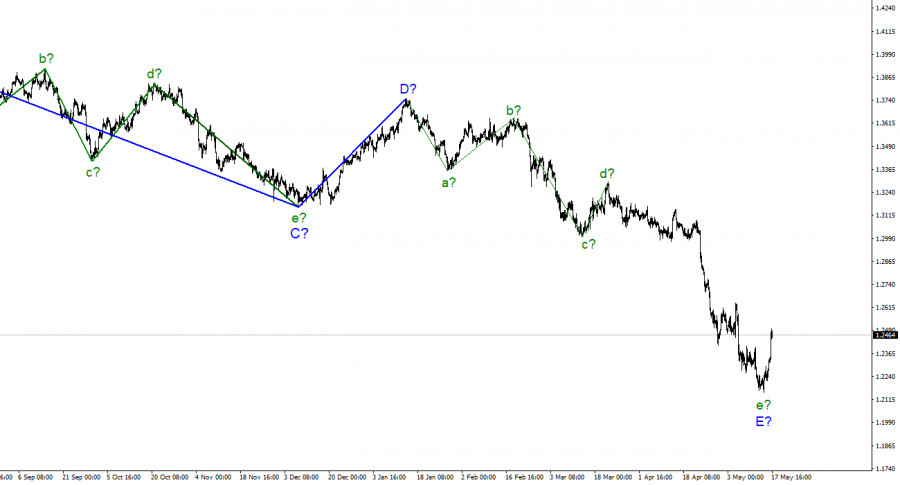
For the pound/dollar instrument, the wave markup continues to look very convincing and does not require adjustments. The downward section of the trend is presumably completed, and the wave e-E, although it has taken a rather complex form, however, is also a five-wave in the structure of the five-wave downward section of the trend, as well as for the euro/dollar instrument. Thus, both instruments can now complete the construction of downward trend sections, which will be very symbolic, given that they have been trading very similar in recent months. Of course, there is also a backup option, in which the descending section will complicate its internal wave structure. This may happen if the demand for the British begins to decline again. And it may start to decline due to the weak (for the British) news background. I suggest that at this time we start from the option that the downward section of the trend is completed, but at the same time closely monitor the news. The instrument's increase may continue with targets located near the 1.2672 mark, which corresponds to 100.0% Fibonacci. Powell's speech and British statistics The exchange rate of the pound/dollar instrument increased by 140 basis points on May 17. The amplitude during the day was even higher, but by the end of the day, the quotes began to move away from the reached highs. The news background for the Briton today was very positive. In the early morning, a report was released on unemployment (a decrease from 3.8% to 3.7%), wages (an increase of 7.0% with expectations of 4.2%), and applications for unemployment benefits (-56.9K with expectations of -42.3K). That is, the market received the values it needed in the morning to start increasing demand for the pound. But the US reports did not affect the market mood, as industrial production grew higher in April than the market expected, and retail trade turned out to be worse than expected. The Briton has already grown quite a lot in one day, so I don't expect any new strong movements for the rest of the day. In a few hours, the speech of Fed President Jerome Powell will begin. Let me remind you that the Fed has recently taken a very tough stance on monetary policy, and every new speech by Powell is perceived by the market as a possible even stronger tightening of rhetoric. Some analysts believe that there is nowhere further to tighten the rhetoric since Powell cannot openly promise that the rate will be raised in June or July by 75 basis points at once. Therefore, I think that his rhetoric will not change and nothing important will be said today. If my assumption is correct, then the market will not react in any way to the speech of the Fed president. Now the Briton needs to hold on to the positions that he has achieved today. A quick pullback down will most likely indicate that the market is not ready for further purchases and will turn a potential upward trend segment into a corrective one. And after the completion of the corrective (three waves), the decline in the British dollar, which we have observed in the last year and a half, may resume. General conclusions The wave pattern of the pound/dollar instrument still assumes the completion of the construction of wave E. As I said, a successful attempt to break through the 1.2246 mark from the bottom up will be a signal to close sales and open purchases with targets located near the estimated 1.2672 mark. This mark looks like a very confident goal. I do not think that the British, which has declined by more than 1,000 basis points in the last few weeks alone, will not be able to recover to this mark, which is near the peak of wave 4-e-E.
At the higher scale, the entire downward trend section looks fully equipped. Therefore, the continuation of the decline of the instrument below the 22nd figure is far from obvious. Wave E has taken a five-wave form and looks quite complete. The material has been provided by InstaForex Company - www.instaforex.com |
| EUR/USD analysis on May 17. Christine Lagarde with her "dovish" rhetoric can greatly hinder the euro Posted: 17 May 2022 08:32 AM PDT
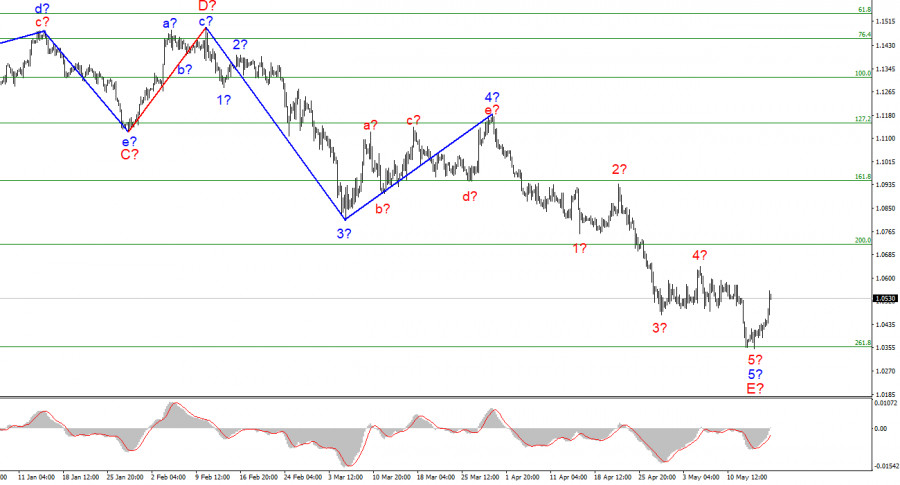
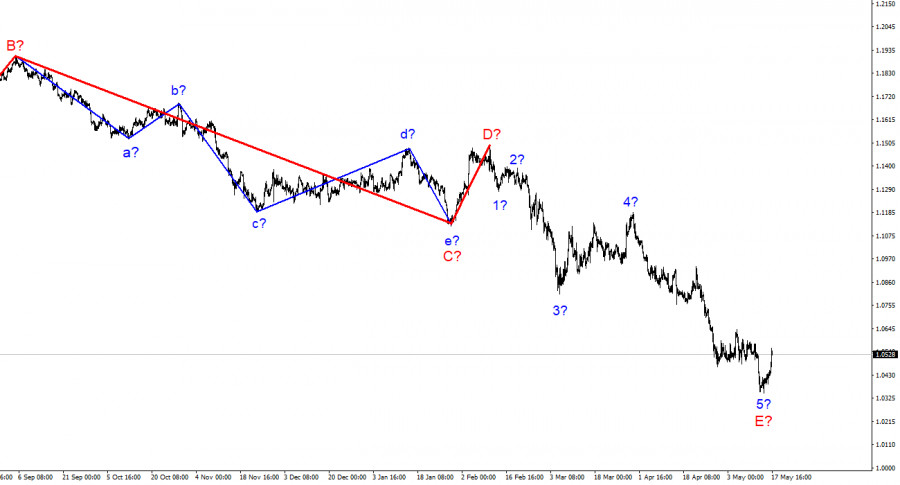
The wave marking of the 4-hour chart for the euro/dollar instrument continues to look convincing and does not require adjustments. The instrument has presumably completed the construction of the descending wave 5-E, which is the last in the structure of the descending trend section. If this is true, then at this time the construction of a new upward section of the trend has begun. It can turn out to be three-wave, or it can be pulsed. One way or another, the instrument has made a strong step towards completing a long downward section. The supposed wave 5-E turned out to be a pronounced five-wave, so its internal wave marking is beyond doubt. The only option in which the decline of the euro can resume is a strong complication of the entire downward section of the trend. It cannot be completely excluded, but I advise you to consider it as a spare. The coming days will be crucial for the instrument, as Tuesday's success will need to be developed. Without this, the instrument can very quickly return to decline. Christine Lagarde's statements are dangerous for the euro currency now The euro/dollar instrument rose by exactly 100 basis points on Tuesday. According to the current wave layout, this movement was expected. I talked about this in previous articles, since the downward section of the trend already looked quite complete. Thus, this increase could happen even on a day when there would be no news background. But today the news background was interesting. In the European Union, a report on GDP for the first quarter was released in the morning. The past value (+0.2% q/q) was adjusted to a value of +0.3%. This is positive news for the euro and the eurozone, so from the very morning, the market could increase demand for the euro currency. During the next time, the euro grew continuously, and the American reports came out just an hour ago when the euro currency had already grown by 100 points. I believe that they did not have an impact on the mood of the market today. However, two more events will take place today. For the euro currency, it is now of great importance how the ECB and Christine Lagarde personally are set up. Recent statements by her and Deputy Chairman Luis de Guindos indicated that they have different opinions. Lagarde has never specifically stated that the interest rate will be raised at a certain time. But Luis de Guindos said a couple of weeks ago that it could be upgraded this summer. Now the market is waiting for a clearer position on monetary policy from Christine Lagarde. If her rhetoric becomes tougher and she confirms the ECB's specific intentions to tighten the DCP, and also names the deadlines, then the euro currency demand may continue to grow, since now two factors will support it. If not, then the euro can very quickly deflate and start a new decline. And the lower it falls, the greater the probability of complicating the downward trend section. General conclusions Based on the analysis, I conclude that the construction of wave 5-E is completed. If so, then it is already possible to buy a tool with targets located near the estimated mark of 1.0720, which equates to 200.0% Fibonacci. The downward section of the trend may still become more complicated, but it is already a backup option.
On a larger scale, it can be seen that the construction of the proposed wave E has been completed. Thus, the entire downtrend has acquired a complete look. If this is true, then in the future, the instrument will rise with goals, near the peak of wave D, that is, to the 15th figure. The material has been provided by InstaForex Company - www.instaforex.com |
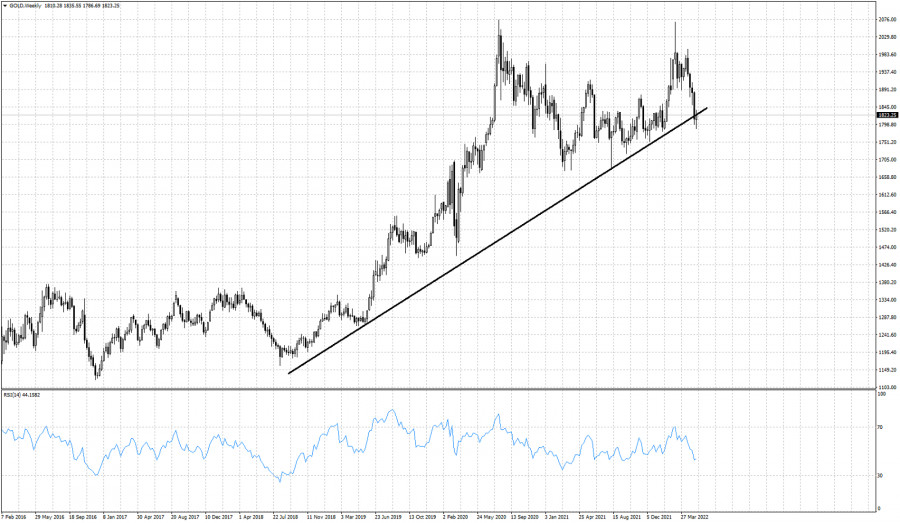
| Short-term technical analysis on Gold for May 17, 2022. Posted: 17 May 2022 08:02 AM PDT Gold price is trading around $1,825, very close to the first important resistance level that we also mentioned in yesterday's analysis. Gold briefly moved below the key long-term support trend line and is now back above it. There is clearly no clear breakdown yet, but bulls need to be cautious if Gold price fails to hold above $1,810.
Gold price is challenging the weekly support trend line from $1,200. A weekly break below this support trend line would be a sign of weakness. As we mentioned in yesterday's analysis, Gold bulls need to push price above $1,825 which is the first short-term resistance in order to start a new trend higher. There are increased chances that the entire decline from $1,997 is complete and at least a strong bounce higher should be expected. The material has been provided by InstaForex Company - www.instaforex.com |
| Posted: 17 May 2022 07:48 AM PDT
Gold (XAU/USD) is trading higher above the 21 SMA and above the downtrend channel that was formed on May 5. The rise in gold is due to a generalized correction in low-risk markets. The US dollar is falling across the board. The USDX is making the third consecutive daily decline and the worst day in weeks which favors the recovery of the euro, pound and gold. Since the low of 1,786, gold has bounced by almost $50. This is a positive sign for a recovery in the short term. In the American session, XAU/USD reached 1,835.91, the highest level since last Thursday. The weekly pivot point is located at 1,931. If gold manages to consolidate above this level, we could expect further advances in the gold price. Conversely, below this level, a technical correction is likely in the next few hours. So, the price could drop to the 21 SMA around 1,822. The 61.8% Fibonacci retracement zone (1,786-1,835) is located between 1,813 and 1,805. If gold manages to break below the 21 SMA, it is likely to continue its decline to 5/8 Murray or towards the 61.8% Fibonacci level. Gold has left a candlestick formation called pinbar when it hit the low of 1,786. This is a positive sign in the short to medium term. It is likely that if gold manages to consolidate above 1,812 (5/8) or above 1,822 (21 SMA), it could rise and reach 6/8 Murray around 1,875 and even 200 EMA around 1,888 in the next few days. Our outlook is bullish for gold. Hence, we expect a technical correction around the 21 SMA to buy, with targets towards the 200 EMA (the daily chart) around 1,850 and 6/8 Murray at 1,875. Our trading plan is to buy around 1,822 or in the event of a technical bounce around 1,812, with targets at 1,835, 1850, 1,875, and 1,1888. The material has been provided by InstaForex Company - www.instaforex.com |
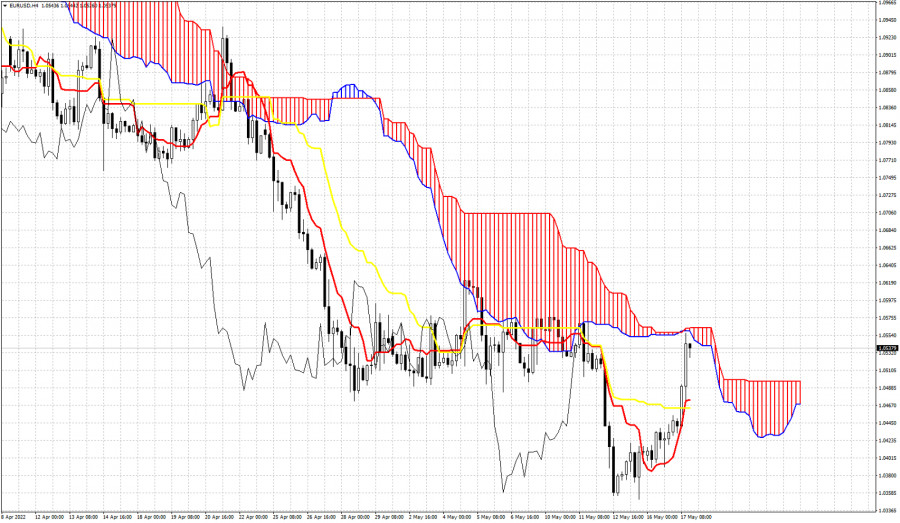
| Ichimoku cloud indicator analysis on EURUSD for May 17, 2022. Posted: 17 May 2022 07:31 AM PDT EURUSD is trading around 1.0530. Price is above both the tenkan-sen and kijun-sen. Price however remains below the Kumo and currently is challenging it. Big cloud resistance found here around 1.0560.
|
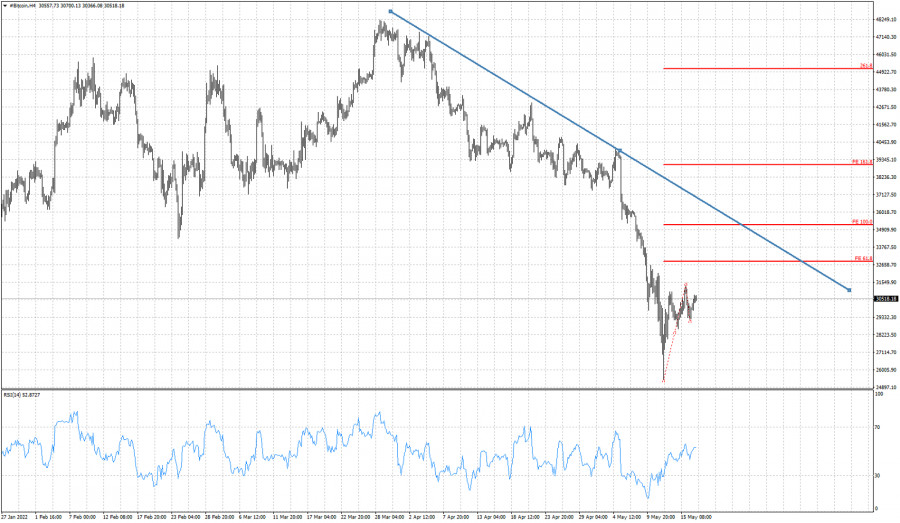
| Short-term Bitcoin analysis for May 17, 2022. Posted: 17 May 2022 07:26 AM PDT Bitcoin continues to trade around $30,000 after making a low around $25,000. Price remains in a bearish trend and we continue to consider this bounce as a counter trend move. However we should not ignore the upside potential as long as price holds above $29,000.
Red lines- Fibonacci extension targets Bitcoin is bouncing after the sharp decline to $25,000. Upside potential for Bitcoin should not be ignored as a move towards the blue resistance trend line or the 100% extension target at $35,200 is very probable if bulls continue to hold price above the recent lows. The big question is if the entire decline from its $48,200 high is over! If the entire decline is over we could see price bounce towards $40,000. Until then traders need to be cautious. The material has been provided by InstaForex Company - www.instaforex.com |
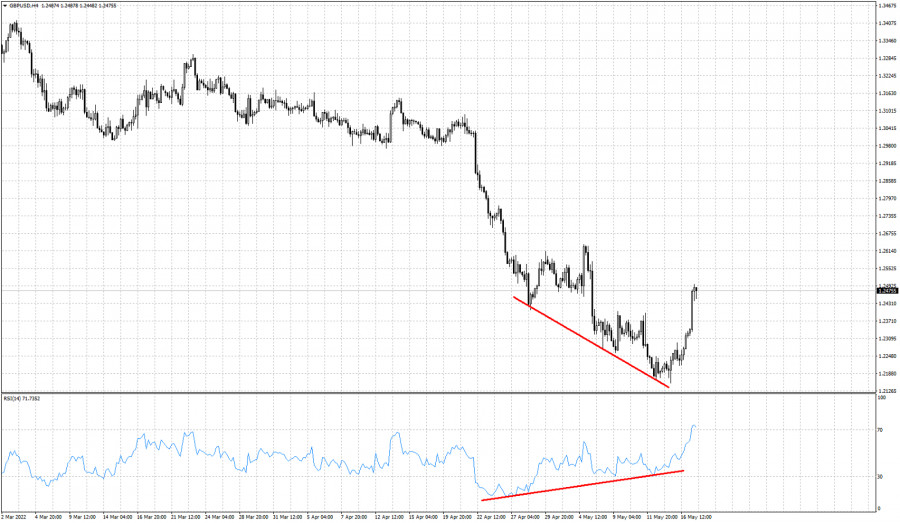
| GBPUSD turns higher as expected from our previous analysis. Posted: 17 May 2022 07:20 AM PDT GBPUSD recently made a low around 1.2154 but is now trading around 1.2472. In our previous analysis on GBPUSD, we warned traders that a bounce higher was imminent and justified as the downtrend was weakening according to the bullish RSI divergence.
Last Friday we warned bears that a move towards 1.2380 was justified and what we were expecting to happen over the next two sessions. Today is the 2nd session after this analysis and price has surpassed our expected bounce target. As long as price holds above 1.2150, we believe that a bigger bounce could unfold if the entire decline from 1.4230 is complete. The material has been provided by InstaForex Company - www.instaforex.com |
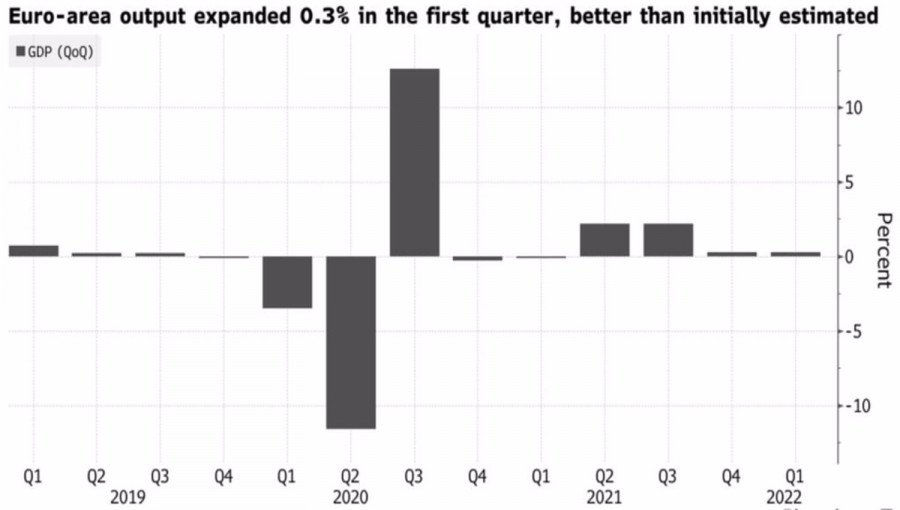
| EURUSD bears lure opponents into a trap Posted: 17 May 2022 06:53 AM PDT Taking advantage of the hawkish rhetoric of the ECB and Hungary's stubborn resistance to the Russian oil embargo, the EURUSD bulls, as expected, went on the counterattack and inflated the quotes of the main currency pair above 1.05. For a long time, the positions of the euro looked hopeless, but any trend, no matter how strong it may be, needs correction. Why not now? Such a rapid fall of the single European currency was clearly not part of the ECB's plans. In such a scenario, an increase in import prices further accelerates inflation and slows down economic growth. In this regard, the words of Bank of France Governor Francois Villeroy de Galhau look like a verbal intervention. The authoritative official said that the ECB is closely monitoring the situation on Forex, and the fall of the euro contradicts the goals of price stability. The faster growth of eurozone GDP in the first quarter by 0.3%, rather than 0.2% QoQ, added fuel to the fire of the bulls' counterattack on EURUSD. The currency bloc's economy is recovering from the pandemic faster than previously expected. If it were not for the armed conflict in Ukraine, it could have outstripped its American counterpart, which would have led to the breakdown of the downward trend in the main currency pair. Eurozone GDP dynamics
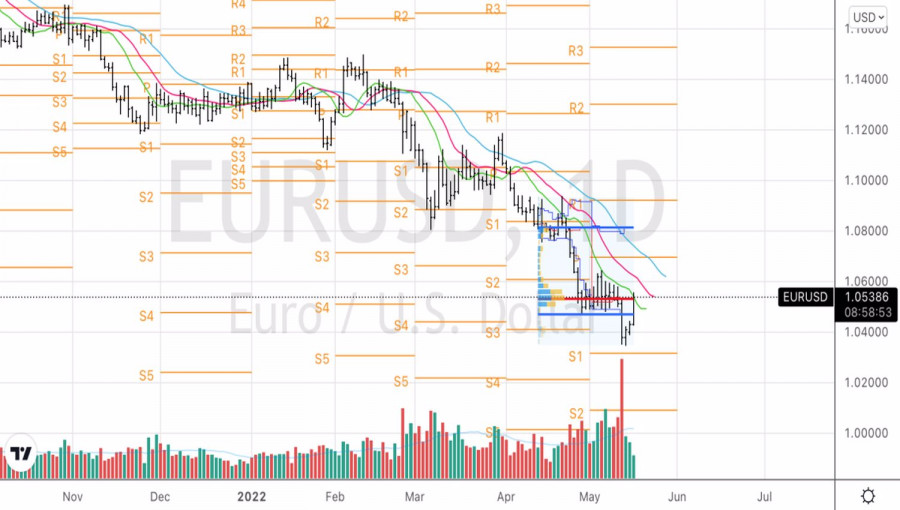
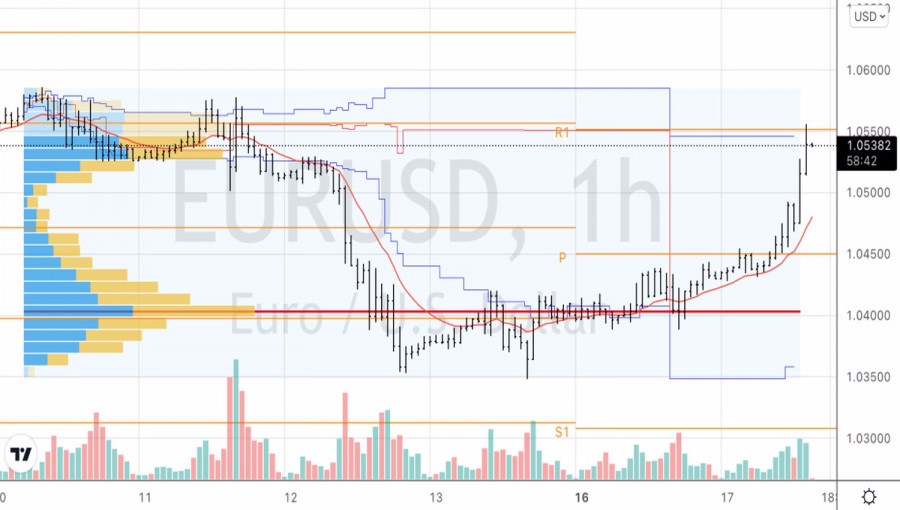
However, work on Forex does not tolerate the subjunctive mood. Due to the fact that the Fed will tighten monetary policy faster than the ECB; the US economy has recovered faster from COVID-19, and the eurozone is closer to the epicenter of hostilities in Eastern Europe, the EURUSD bears dominate the market and can afford to play cat and mouse with their main opponent. Investors are looking forward to the speeches of Christine Lagarde and Jerome Powell. Lagarde's alleged "hawkish" rhetoric is one of the drivers of the euro pullback. The derivatives market predicts that the deposit rate will rise by 90 bps in 2022, which is equivalent to 25 bps at three or four meetings of the Governing Council. Out of the 48 Reuters experts, 26 said that borrowing costs will rise by 50 bps by the end of the third quarter, another 18 see +25 bps, and two said +10 bps. More than 90% of respondents expect to see zero or positive rates by the end of the year. Note that at present it is -0.5%. Hungary's resistance to the EU's plan to embargo Russian oil is also lending a helping hand to EURUSD bulls. 65% of oil imports to this country come from the Russian Federation. And in order to abandon it, it is necessary to redo the entire infrastructure, which Budapest estimates at €15–18 billion. No ban on oil supplies—no higher prices—no retaliatory sanctions from Moscow. This means that the risks of a recession in the eurozone are reduced. Good news for the euro. Technically, the return of EURUSD to the boundaries of fair value indicates the seriousness of the intentions of the bulls. Closing the trading day above 1.053 will increase the risks of a correction in the direction of 1.06 and 1.066. In this regard, the longs formed at the break of resistance at 1.0435 are still holding and watching the closing price. EURUSD, Daily chart
EURUSD, Hourly chart
|
| Development of digital euro set to begin in 2023 Posted: 17 May 2022 06:48 AM PDT
Over the past 3 years, speculation has abounded about the creation of digital EUR and USD. The development of these central bank digital currencies (CBDC) is well underway. 2023 could prove to be a decisive year for CBDCs. The fast spread of the blockchain technology and digital currencies in general over the past several years has attracted the attention of the leading financial institutions, such as the Federal Reserve and the ECB. In 2019, the European regulator began to lay the groundwork for the digital euro, aiming to stay competitive in the global financial market. According to the "Future of Money" report, which was presented by the European Parliament in November 2019, the digital euro would be a currency issued and controlled by the ECB. The new legal tender would be "the digital form of fiat money that is issued and regulated by the monetary authority of a country", the report said. This would allow the ECB to have extended control over the currency. Earlier, the influence of ECB was limited to control over cash supply and the reserves of private banks. European households would be able to open accounts at the central bank directly, bypassing other banks. Furthermore, the ECB would guarantee the security of investments, as the central bank cannot go bankrupt. According to ECB board member Fabio Panetta, the launch of a digital euro would support Europe's drive towards innovation, as well as strengthen the euro's status globally. Furthermore, it would fortify the Eurozone's monetary sovereignty. "At the end of 2023 we could decide to start a realisation phase to develop and test the appropriate technical solutions and business arrangements necessary to provide a digital euro. This phase could take three years," Panetta stated. In his speech at the National College of Ireland, Panetta noted that a CBDC could be used for digital payments. Commenting on the crash of TerraUSD (UST) and the resulting volatility in the crypto market, he pointed out the weak points of stablecoins as a payment option. "Despite claims that cryptos are a trustworthy form of 'currency' free from public control, they are too risky to act as a reliable means of payment. They behave more like speculative assets and raise multiple public policy and financial stability concerns." Panetta said, adding that stablecoins are not risk-free. The best possible solution in this situation would be state regulation, he concluded. ECB president Christine Lagarde supports Panetta's position. Earlier, she stated that the digital euro would become a reality, but its development would take a lot of time. The legal framework for the CBDC is expected to be developed within the next 5 years, with the development of the digital euro itself to be finished by 2026. According to Fabio Panetta, most EU residents supported the launch of the European CBDC. The material has been provided by InstaForex Company - www.instaforex.com |
| US Dollar Index Technical Analysis and Trading Tips for May 17, 2022 Posted: 17 May 2022 06:36 AM PDT
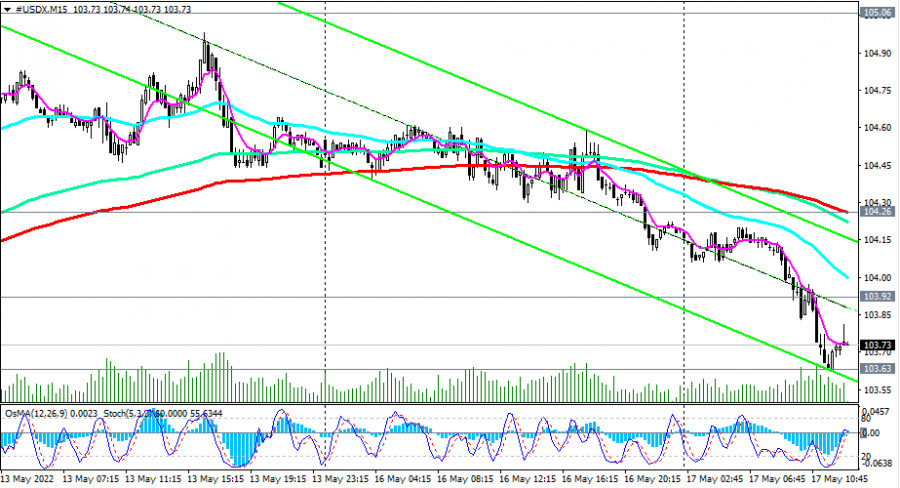
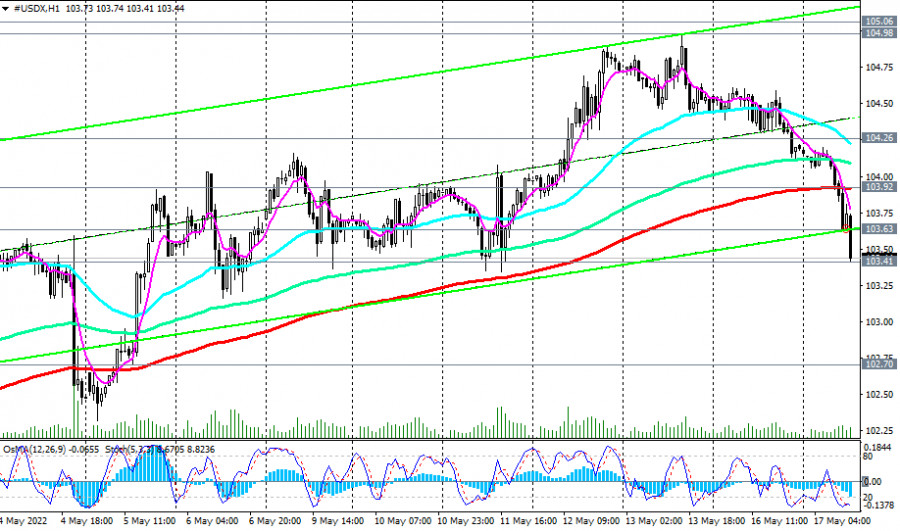
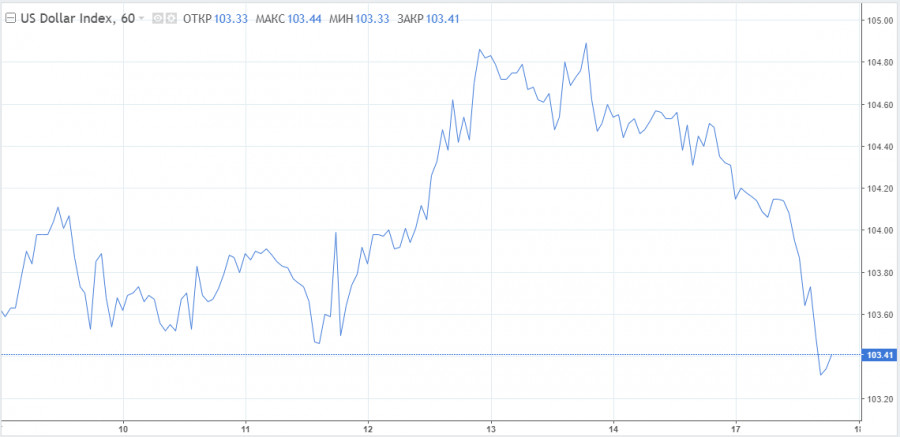
US Dollar Index (DXY) futures are trading near 103.74 as of this writing, continuing to decline for the third consecutive trading day after hitting a new high since January 2003 at 105.06 on Friday. From a technical point of view, the price of the DXY index futures broke through an important short-term support level of 103.92 (200 EMA on the 1-hour chart), placing an order for further decline.
We also assume that the breakdown of today's local bottom of 103.63 may increase the negative dynamics. As of this writing, futures for the DXY index continued to decline, reaching a new intraday low of 103.41. A local support level also passes through this mark, from which the price rebounded three times—on May 6, 9 and 11. If this level holds again, then we should wait for the next rebound from it and the price to return to the zone above the level of 103.92. The breakdown of the resistance level 104.26 (200 EMA on the 15-minute chart) will be a confirmation signal for the resumption of long positions.
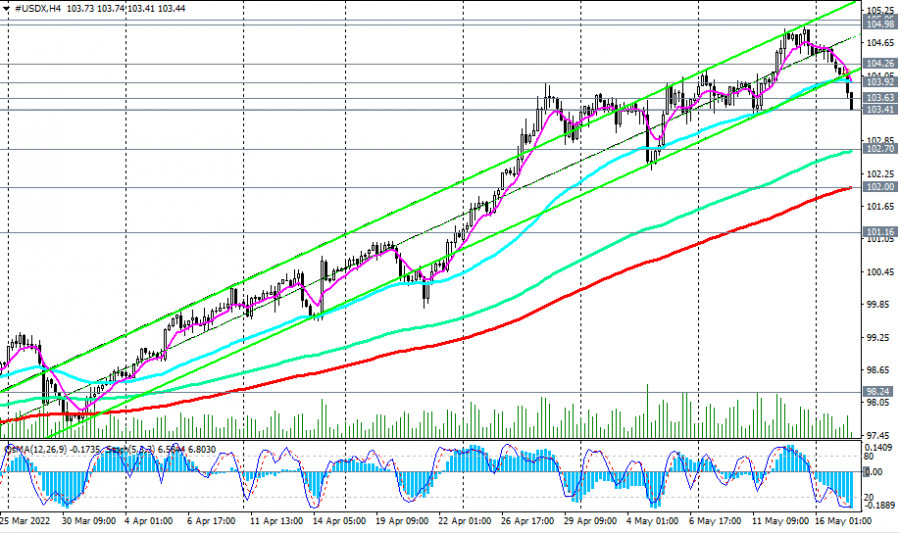
If the support level of 103.41 fails and is broken, then the downward correction may last up to the support levels of 102.70 (144 EMA on the 4-hour chart), and 102.00 (200 EMA on the 4-hour chart and the lower limit of the descending channel on the daily DXY chart).
We consider the current decline as corrective, expecting the resumption of the upward dynamics of the dollar and its DXY index. Support levels: 103.41, 102.70, 102.00, 101.16, 101.00 Resistance levels: 103.63, 103.92, 104.26, 104.98, 105.06 Trading Tips Sell Stop 103.30. Stop-Loss 103.95. Take-Profit 102.70, 102.00, 101.16, 101.00 Buy Stop 103.95. Stop-Loss 103.30. Take-Profit 104.26, 104.98, 105.06, 106.00, 110.00 The material has been provided by InstaForex Company - www.instaforex.com |
| Dollar expects Powell's support Posted: 17 May 2022 06:33 AM PDT
The dollar is facing a technical correction and the index is below the overbought zone. The downward movement was the reason for new forecasts about the further positioning of the US currency. Where is the greenback headed? Today, traders focus their attention on Jerome Powell's speech and macroeconomic releases evaluating retail and industrial production indicators. The number of buyers of the US dollar has declined significantly ahead of some important events. However, the dollar should maintain most of its gains. ING economists view the current stock market recovery and dollar decline as a break in the established recent trend rather than a sustained shift in traders' sentiment and reversal. The experts wrote that they expected further strengthening of the bearish steepness of the US yield curve slope and a rise in 10-year US real yields to 100 bps in the coming months. They noted that that issue would continue to pose a challenge to equity and credit markets. April retail sales and industrial production should produce positive results. Fed Chairman Jerome Powell and St.Louis Fed President James Bullard are likely to mention again that the central bank has just started its tightening cycle to fight market expectations of tightening. Investors are curious about Powell's views on the recent sell-off in risky assets and its possible effect on the Fed's future plans. The officials have not expressed any concern about these issues so far. On the contrary, they continued to support further tightening of financial conditions. Moreover, the markets are also focused on the size of the central bank balance sheet and the possible peak in inflation. The dollar could strengthen slightly on Wednesday amid this news. Today, a consolidation is likely. If the dollar further declines, the level of 103.40 may change. In case the greenback breaks through this area, the index will move further and reach a level of 102.35. The dollar is expected to find strong support there.
Further bullish sentiment is also expressed by Bank of America economists. The US currency will continue to rise in the coming weeks. Moreover, there are at least three reasons for that. The first reason is divergence in US monetary policy. European and Japanese regulators will try to catch up with the Fed. However, this process will be very gradual. The ECB will start to tighten its policy later this year if that. However, it will not be sufficient to reverse the dollar index. Secondly, the dollar will stimulate expensive energy supplies amid the Ukrainian crisis and possible EU sanctions on Russian energy imports. This fact will exert strong pressure on the euro. Thirdly, China's deep concern about Covid-19 and a weaker yuan has caused the country's imports to decline dramatically in annual terms. It could become negative in the coming months. Controversial aspects of strong dollar Previously, a strong dollar would produce positive effects under different circumstances. The growth of the US currency should have regulated the world economy. Weaker nations could boost exports while reducing inflationary pressures in the United States by lowering the cost of imports. Currently, the situation is the opposite. A significant and rapid rise in the greenback (nearly 10% since the start of the year) may undermine the global economy, which has become stagnant in recent years, and destabilize financial markets. The politicians have not made any attempts to fight the strong dollar so far. However, they have identified this problem. Moreover, countries already dealing with high risks of economic, energy, food and debt crises may face serious consequences. Will the Fed be able to control the dollar? In the current situation, the US regulator will have difficulties with previous market liquidity concerning bloated balance sheets and inflation problems. The countries that consider risks of a strong dollar can reduce them in their own ways. They will need to carry out structural reforms to improve economic growth and productivity, increase returns on capital and make their economies more resilient. This process is gradual, which means they will have to bear the burden of a strong dollar. Global restructuring is underway, and a strong dollar is likely to be a main source of economic and financial instability. The material has been provided by InstaForex Company - www.instaforex.com |
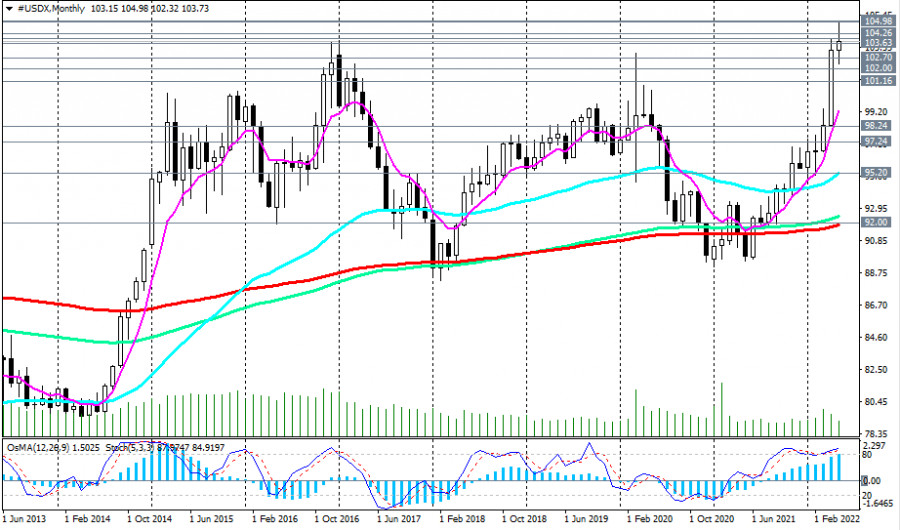
| Dollar Index: Is the dollar falling? Posted: 17 May 2022 06:19 AM PDT The decline of the dollar, strange as it may seem in the current situation, continues today, and for the third trading day in a row. If we attributed its decline on Friday to the fixation of some of the many long positions at the end of the week, then the continued decline of the dollar may begin to raise doubts about its further strengthening after months of growth. At the time of writing this article, futures for the dollar index (DXY) are trading near 103.74, continuing to decline for the third trading day in a row after reaching a new high since January 2003 at 105.06 on Friday. Perhaps this is how investors reacted to yesterday's New York Fed report, according to which the manufacturing activity index in the US fell to -11.60 in May from 24.60 in April, which also turned out to be much worse than the forecast for the index to fall to 15.50. In addition, the US stock market is now seeing a resurgence of investor optimism, which is accompanied by an increase in their propensity to buy risky and profitable stock market assets and to exit the protective dollar. For example, futures on the broad market index S&P 500 rose 5.4% to 4071.0 from last week's low of 3860.0. Nevertheless, most economists believe that the growth of the dollar will resume: the tightening cycle of monetary policy is just beginning, and the Fed is unlikely to back down from its plans. Federal Reserve Chairman Jerome Powell recently reaffirmed that the central bank's main task is to regain control of inflation, which has reached highs in the US for the past 40 years. If economic performance is in line with expectations, then Powell considers it appropriate to raise interest rates by 50 basis points at the next two meetings. Today, during the American trading session, he will speak at an event organized by the Wall Street Journal, and market participants will be waiting for new signals from him regarding the prospects for the Fed's monetary policy. His speech is scheduled to start at 18:00 (GMT). It is possible that Powell will hint at a 75-point rate hike at the next Fed meeting on June 14–15, as the market expects. In this case, the dollar will receive a powerful impetus to strengthen. If Powell maintains the same rhetoric regarding monetary policy, then the dollar may weaken. However, this weakening will not be long-lasting. Either way, the Fed's stance on taming rising inflation remains the toughest among the world's major central banks. And this is one of the main fundamental factors in favor of further strengthening of the dollar (however, also provided that the Fed's measures turn out to be effective). In addition, market participants will also pay attention to the publication (at 12:30 GMT) of statistics on the dynamics of retail sales and industrial production in the US for April. Retail sales is the main indicator of consumer spending in the US, showing the change in retail sales. The "Retail Control Group" indicator evaluates the volume in the entire retail industry and is used to calculate price indices for most goods. A high result strengthens the US dollar, and vice versa, a weak report weakens the dollar. Data worse than the previous period (-0.1% in March, -1.2% in February, +3.8% in January) may negatively affect the dollar in the short term. Forecast for April: +0.5%. At the same time, the volume of retail sales, according to the forecast, grew in April by +0.7% (after growth in March by +0.5%). This is still positive data for the dollar, but let's see how market participants react to it. From a technical point of view, the price of the DXY index futures broke through an important short-term support level of 103.92, placing an order for further decline. A breakdown of today's local low of 103.63 may increase the negative dynamics.
|
| AUD/USD: RBA considered 3 scenarios in May meeting Posted: 17 May 2022 05:59 AM PDT The Australian dollar paired with the US currency returned to the area of the 70th figure. Early last week, the AUD/USD bears managed to pull the price below 0.7000, hitting a new low of the year at 0.6830. However, already last Friday, buyers organized a counteroffensive, keeping the pair from further stalling. The minutes of the last meeting of the Reserve Bank of Australia published today only strengthened the position of the Aussie. The document is unequivocally hawkish in nature, allowing the Australian dollar to feel more or less confident, at least in the context of corrective counteroffensives.
Recall that following the results of the May meeting, the RBA raised the interest rate by 25 basis points at once, while on the eve of this meeting, most analysts predicted a 15-point increase. Commenting on the decision, RBA Governor Philip Lowe, said that in the "coming months" further interest rate hikes "will clearly be necessary." According to him, the normal level of rates is around 2.5%. At the same time, Lowe noted a significant increase in inflation, the pace of which exceeded the earlier forecasts of the RBA. Australian inflation really did not disappoint, to put it mildly. In quarterly terms, the consumer price index rose to 2.1%, while the growth forecast was up to 1.7%. On an annualized basis, the inflation indicator jumped to the level of 5.1%, while the growth forecast was up to 4.6%. That is, the indicators approached 20-year highs. Lowe said that the strongest price growth was in the field of fuels and lubricants: in particular, fuel prices rose by 11% QoQ and 35% YoY. This is the strongest growth rate for fuel in the last 32 years. And judging by the dynamics of the oil market, this component will continue to push inflation up, forcing the RBA to take retaliatory measures. Here it is necessary to recall that following the results of the April meeting, the Reserve Bank of Australia actually "tied" the issue of raising the interest rate to the dynamics of key macroeconomic indicators, primarily in the field of inflation and the labor market. Therefore, the latest inflation report, which was published just a week before the May meeting of the RBA, allowed the regulator to decide on a 25-point rate increase (instead of the expected 15-point step). Today we learned the details of the May meeting. The published minutes of this meeting made it clear that the members of the regulator had three scenarios on the table. The first is a rate hike of 15 basis points, the second is 25 basis points and the third is 40 basis points. According to the document, the RBA members concluded that the 15-point step does not correspond to the current situation—"given that the policy is very stimulating, and it is very likely that further rate hikes will be required." As for the option of increasing the rate by 40 basis points at once, it was postponed as a last resort, that is, if inflation continues to increase at an accelerated pace. The minutes indicate that "an argument in favor of tightening by 40 points may be the presence of upward risks for inflation and the current very low level of interest rates." That is, by and large, this is a "plan B," the activation of which will depend on the dynamics of inflation in the second quarter (note that in Australia, CPI indicators are published quarterly, not monthly). According to the majority of RBA members, a 25-point rate hike is the most comfortable scenario. At the same time, the regulator made it clear that it will increase the rate by 25 points already at the next or July meeting, that is, in the foreseeable future. Thus, the protocol states that after an increase by such an "average" amount, "the Central Bank will have the opportunity to revise the level of interest rates again within a relatively short period of time." The hint here is quite transparent.
Thus, the Australian dollar today received a very tangible support, which coincided with the situational weakening of the US currency. The US dollar index retreated from its highs, falling from 105.00 to the 103rd figure. However, it is impossible to talk about a trend reversal now—neither in the context of the greenback, nor in the context of the AUD/USD pair. In my opinion, Aussie buyers have a "margin of correction" in terms of price growth to the level of 0.7050 (the Tenkan-sen line on the D1 timeframe) and 0.7100 (the average line of the Bollinger Bands indicator on the same timeframe). In this price area, the upward momentum may fade, given the fact that the intentions of the US Federal Reserve are more aggressive and decisive. Therefore, when approaching the 71st figure, it is advisable to fix the profit and take a wait-and-see position. The material has been provided by InstaForex Company - www.instaforex.com |
| US stock indexes down on Monday Posted: 17 May 2022 05:56 AM PDT
US stock market indexes largely closed in negative territory on Monday. The S&P 500 fell by 0.39%, while the NASDAQ lost 1.2%. The Dow Jones Industrial Average edged up by 0.08%. Investors are highly cautious and avoid risk amid concerns over global economic recovery. The European Commision cut its growth outlook for 2022 to 3.2% from 5.7%. US growth outlook was reduced to 2.9% from 4.5%. The Goldman Sachs cut its US economic outlook for 2022 to 2.4% from 2.6%. The outlook for 2023 was revised to 1.6% from 2.2%. The New York Empire State Manufacturing Index fell to -11.6 points from 24.6 points in April, indicating worsening economic conditions in the New York region. Analysts expected the index to decline to 16.5-17 points. Investors are also concerned by weak macroeconomic data from China. Retail sales fell by 11.1%, surpassing the projected decline by 6.1%. Furthermore, industrial output decreased by 2.9%, well below the expected increase by 0.4%. The negative situation in China could make an impact on the economic situation in other countries. Furthermore, market players try to predict the future actions of the Federal Reserve. The Fed is expected to increase the interest rate to 1.25%-1.5% at its June meeting. Earlier, the regulator hiked the rate by 50 basis points to 0.75%-1%. Analysts are concerned that a very fast monetary tightening cycle could send the US economy into a recession. On the Dow Jones, the best performing stocks of Monday's session were Chevron Corp. (+3.1%), Merck & Co. (+2.1%), and Verizon Communications (+1.8%). The worst performing stocks were Boeing Co (+2.5%), Walt Disney Co. (+2%), and Salesforce Inc. (+1.7%). Shares of McDonald's Corp. lost 0.4% after the company announced it would quit Russia after more than 30 years in the Russian market. McDonald's expects to suffer a loss of $1.2-1.4 billion from this move. Nucor Corp. lost 3.3% as the company prepares to acquire C.H.I. Overhead Doors for more than 3.3%. In a hostile takeover bid, JetBlue Airways has offered Spirit Airlines stakeholder $30 per share on Monday. As a result, the share price of Spirit Airlines jumped by 13.5%, while JetBlue Airways lost 6.1%. ManTech International gained 15% on the news of the company's imminent takeover by Carlyle Group Inc. Shares of Carlyle Group Inc. shed 0.3%. The material has been provided by InstaForex Company - www.instaforex.com |
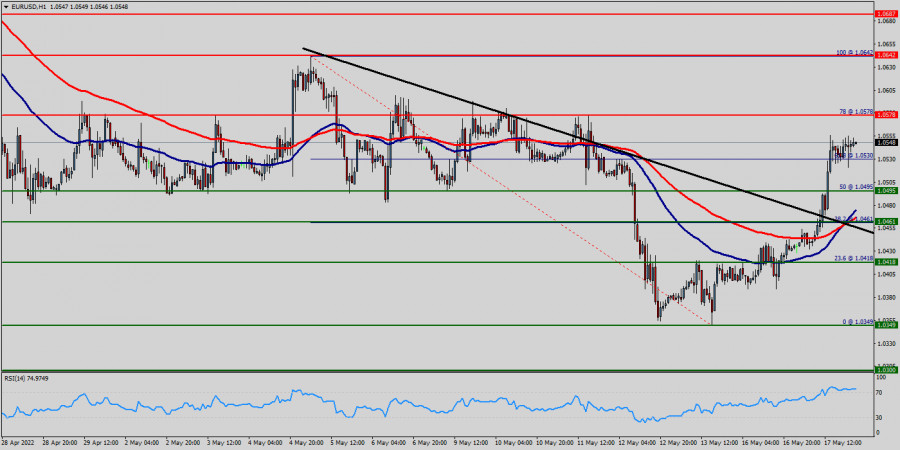
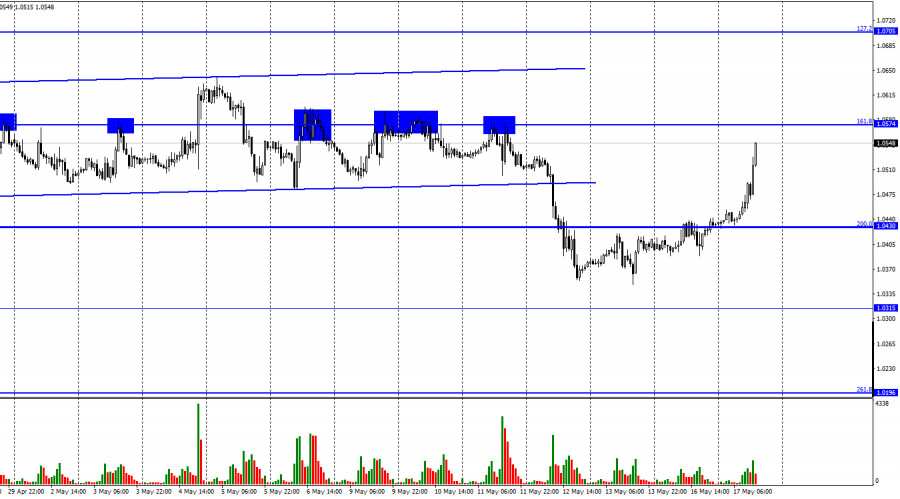
| Forecast for EUR/USD on May 17. Unexpectedly: the euro currency started strong growth Posted: 17 May 2022 05:55 AM PDT
The EUR/USD pair on Monday continued the growth process that it started two days ago, secured above the corrective level of 200.0% (1.0430), and is currently approaching the level of 161.8% (1.0574). In just one day, the currency was able to grow by 120 points, although before that growth of such strength happened extremely rarely. I have several assumptions about the strong growth of the euro and the pound on Tuesday (the pound is also growing). Several reports on the European Union and the UK were released this morning. In particular, the European economy showed growth of 0.3% in the first quarter, although a month earlier this value was 0.2%. I cannot say that this was the only reason for the growth of the euro, but for sure this report influenced the mood of traders, making it more "bullish". I should immediately note that the British statistics also turned out to be much better than expected, so the pound could grow quite reasonably today. However, there is also news from Ukraine. Yesterday, the storming of the Azovstal plant in Mariupol officially ended, and the Ukrainian military stopped firing. The world media consider this event as the first step towards new negotiations and de-escalation of the conflict between Kyiv and Moscow. Unfortunately, this assumption does not correspond to reality, since both Ukraine and Russia said today that the peace talks have been completed and will not resume in the near future. In Mariupol, an exchange of prisoners of war is simply taking place, of which there have already been many over the past 2.5 months of confrontation. Thus, I think the market could react with purchases of the euro and the pound, hoping that at least active hostilities on the territory of Ukraine would stop or weaken. However, this, unfortunately, also does not correspond to reality. The fighting in the Donbas continues, and it is there that the largest number of Ukrainian and Russian armed forces are concentrated. The growth of the euro currency may be short-term because of this.
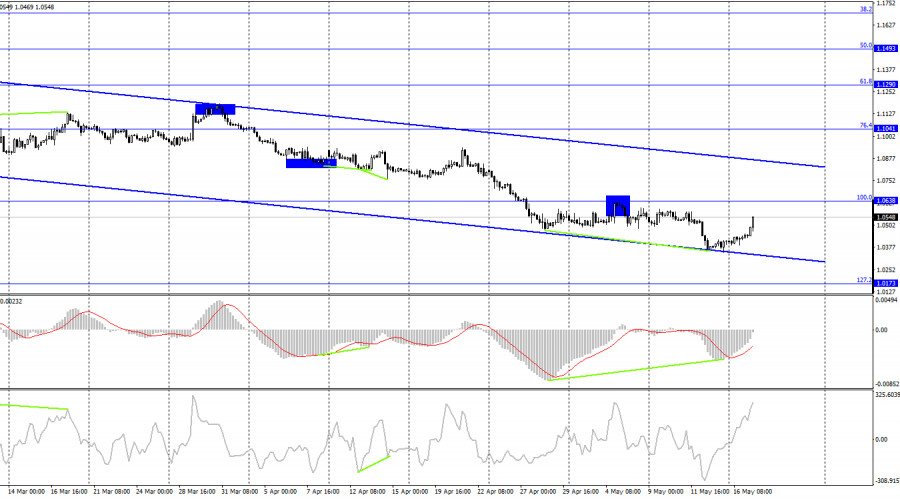
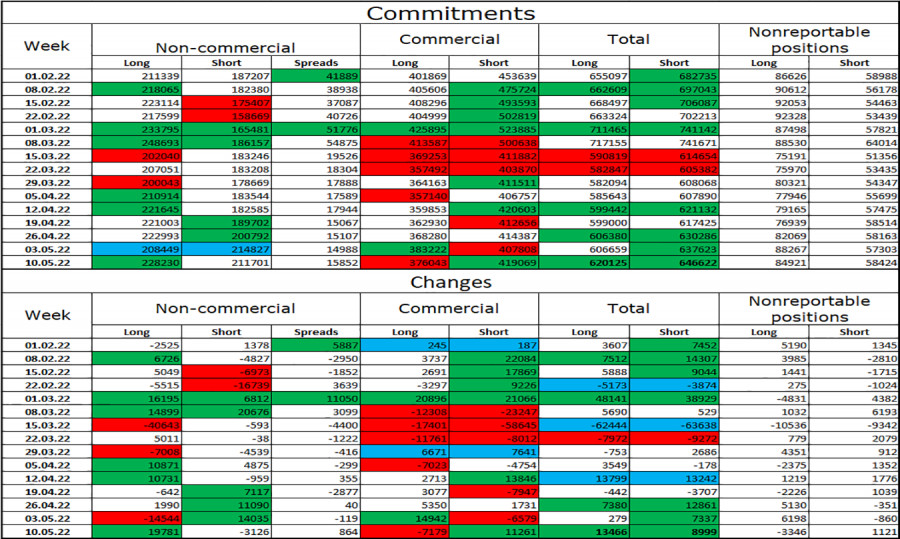
On the 4-hour chart, the pair performed a reversal in favor of the European currency after the formation of a "bullish" divergence at the MACD indicator. The process of growth has begun in the direction of the corrective level of 100.0% (1.0638), but this growth takes place inside the downward trend corridor, which still characterizes the current mood of traders as "bearish". A rebound from the level of 100.0% will work in favor of the US currency and the resumption of the fall in the direction of the Fibo level of 127.2% (1.0173). Commitments of Traders (COT) Report:
Last reporting week, speculators opened 19,781 long contracts and closed 3,126 short contracts. This means that the bullish mood of the major players has intensified again. The total number of long contracts concentrated on their hands is now 228 thousand, and short contracts - 211 thousand. As you can see, the difference between these figures is minimal and you can't even say that in the market for the European currency it is a big problem to show an increase of 100 points. In recent months, the euro has mostly remained bullish, while the currency itself has been falling, falling, and falling. Thus, now the situation is approximately the same. The COT report continues to say that major players are buying euros, and the euro, meanwhile, is falling. Therefore, the expectations of COT reports and the reality now simply do not coincide. News calendar for the USA and the European Union: EU - change in GDP (09:00 UTC). US - change in retail trade volume (12:30 UTC). US - change in industrial production (13:15 UTC). EU - ECB President Christine Lagarde will deliver a speech (17:30 UTC). US - chairman of the Fed Board of Governors Jerome Powell will deliver a speech (18:00 UTC). On May 17, the calendars of economic events in the European Union and the United States are full of important events. The GDP report looks secondary against the background of other events. The most interesting thing ahead is the speeches of Lagarde and Powell. The information background today can have a strong impact on the mood of traders. EUR/USD forecast and recommendations to traders: I recommend new sales of the pair if there is a rebound from the 1.0574 level on the hourly chart with the goal of the 1.0430 level. Or in case of a rebound from the 1.0638 level on the 4-hour chart. I recommended buying the euro currency when closing above the 1.0430 level on the hourly chart with a target of 1.0574. Now, these transactions can be held. The material has been provided by InstaForex Company - www.instaforex.com |


| You are subscribed to email updates from Forex analysis review. To stop receiving these emails, you may unsubscribe now. | Email delivery powered by Google |
| Google, 1600 Amphitheatre Parkway, Mountain View, CA 94043, United States | |


Comments