Forex analysis review
Forex analysis review |
- Crypto market takes a break ahead of Powell's speech: what to expect from Bitcoin?
- Technical analysis recommendations on EUR/USD and GBP/USD for May 17, 2022
- Forex forecast 05/17/2022 AUD/USD, EUR/USD, USDX, Oil and Bitcoin from Sebastian Seliga
- GBP/USD: the pound rushes up against everything
- Indicator analysis: Daily review of GBP/USD on May 17, 2022
- Indicator analysis: Daily review of EUR/USD on May 17, 2022
- GBPUSD Potential For Bullish Bounce | 17th May 2022
- NZDUSD Potential For Bearish Continuation | 17th May 2022
- Technical Analysis of GBP/USD for May 17, 2022
- BTCUSDT, Potential For Bullish Continuation | 17th May 2022
- Technical Analysis of EUR/USD for May 17, 2022
- Technical Analysis of ETH/USD for May 17, 2022
- Technical Analysis of BTC/USD for May 17, 2022
- GBP/USD: plan for the European session on May 17. COT reports. The pound is actively bought in anticipation of forming a
- EUR/USD: trading plan for European session on May 17. COT report and overview of yesterday's trading. EUR gaining ground
- Trading plan for Gold on May 17, 2022
- Trading plan for USDJPY on May 17, 2022
- Trading plan for GBPUSD on May 17, 2022
- Elliott wave analysis for Natural Gas on May 17, 2022
- Elliott wave analysis of Crude Oil on May 17, 2022
- Trading plan for US dollar index on May 17, 2022
- Trading plan for EURUSD on May 17, 2022
- Forecast and trading signals for EUR/USD for May 17. COT report. Detailed analysis of the pair's movement and trade deals.
- Forecast for EUR/USD on May 17, 2022
- Forecast for GBP/USD on May 17, 2022
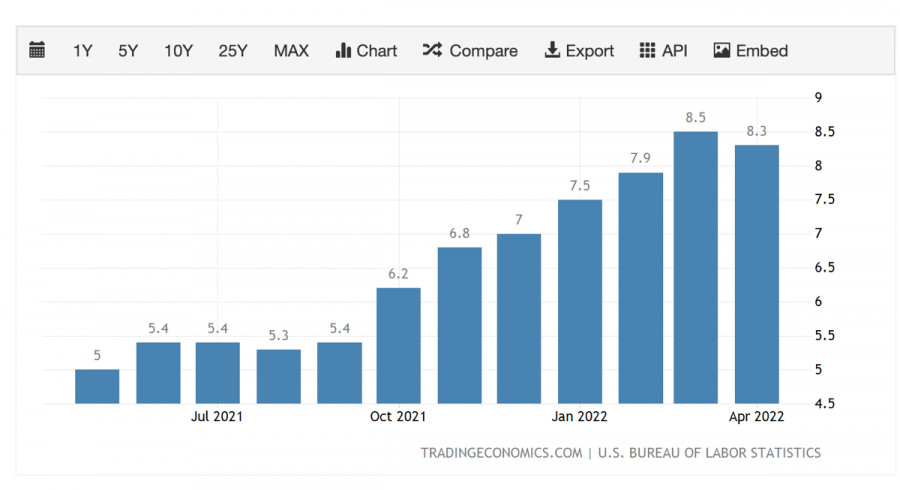
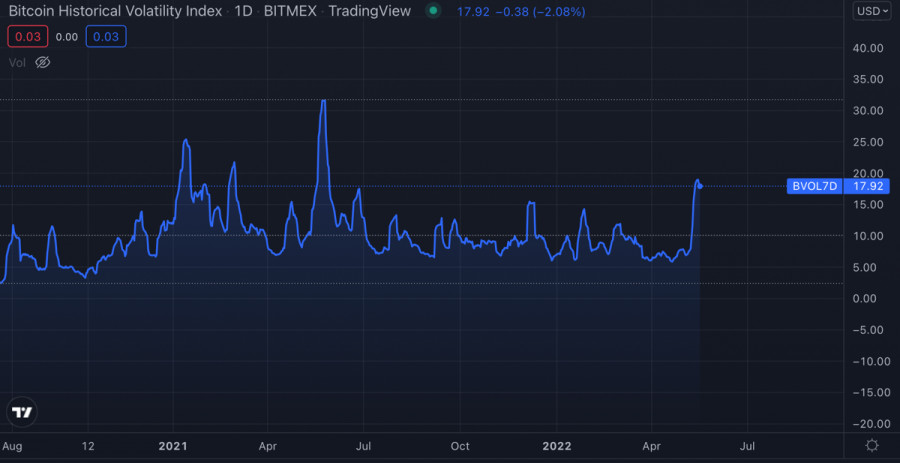
| Crypto market takes a break ahead of Powell's speech: what to expect from Bitcoin? Posted: 17 May 2022 01:45 AM PDT The cryptocurrency market is starting to stabilize after a powerful bearish week. Quotes of the main assets have fixed in the area of local support zones and are trying to consolidate. At the same time, market volatility falls, and investors begin to accumulate cryptocurrency coins. However, there is reason to believe that soon the situation will escalate again due to the speech of the head of the Fed, Jerome Powell. During this speech, key theses regarding the future monetary policy, the rate, as well as the start of the quantitative tightening (QT) program will be announced. The market reacted with hostility to the previous increase in the key rate by 50 basis points, which resulted in the largest liquidation in recent months. At the June meeting, a rate hike of another 0.5% is planned. However, the market is alarmed by the possibility of a more radical tightening of monetary policy. Concerns are connected with the recent publication of reports on the growth of consumer prices.
According to the report, the inflation index was at the level of 8.3% against the expected 8.1%. The problem and concern is that after the May meeting, Powell said that the Fed controls inflation growth and has all the necessary tools to stop it. However, a few weeks later, the inflation index turns out to be higher than expected. In this regard, Powell may announce tougher measures, such as an increase in the key rate by 0.75%. This will avoid the collapse that occurred in the markets after the Fed meeting. In addition to gestures regarding the key rate, the agency may tighten the timing and volume of reduced liquidity under the QT program.
At the same time, it is important to understand that Powell has established himself as a liberal official. The May meeting turned into a massive collapse in both crypto and the stock market. In this regard, the Fed may leave the key points of the strategy to combat inflation unchanged, and this will be the best solution for the cryptocurrency market. Thanks to this solution, Bitcoin and the digital asset market will get the pause necessary to stabilize quotes. There is no question of the emergence of an upward trend, since the increase in the key rate was not the most painful blow to the crypto market and Bitcoin. The quantitative tightening program will start in June, and it is the forced withdrawal of liquidity that will become the main pain for Bitcoin. It is important to understand that the market reacts moderately to negative news, but the manipulations of individual large players provoke large sales. In other words, "whales" are squeezing "weak hands" out of the crypto market.
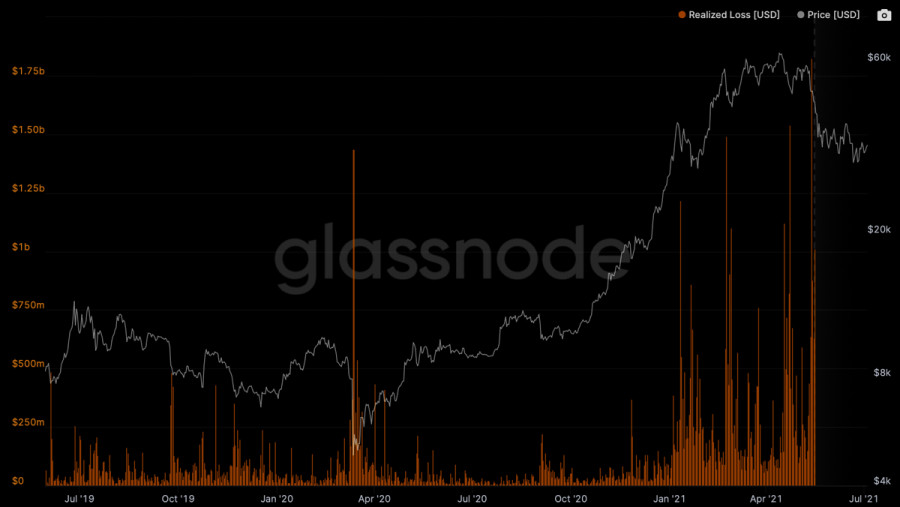
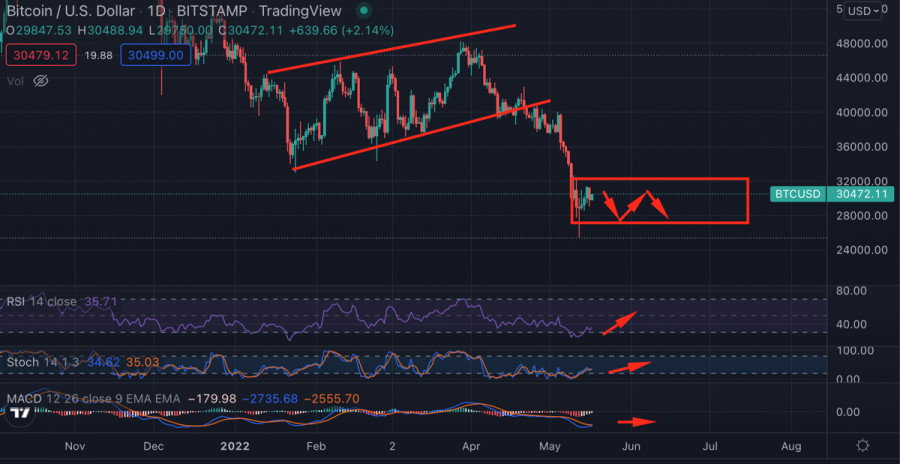
Bitcoin has fallen 63% from its all-time high and is now at a crossroads. If market manipulation ends after the start of the QT program, this will mean the final stage of investors' adaptation to new realities. After all, the strategy of the "whales" is to "shave off" uncertain players to create a springboard for the upward movement of Bitcoin. However, a growth stage should be expected after the next stage of increased volatility and a sell-off provoked by the launch of the QT program.
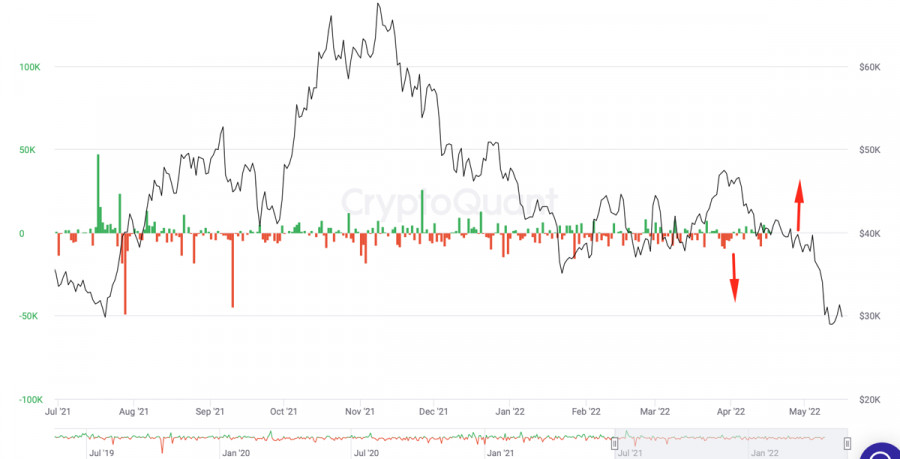
Bitcoin continues to stabilize after a massive crash. The price starts the local stage of consolidation in a narrow range of $28.1k–$31.6k. The charts signal that after a massive sell-off, the exchanges have again begun to show an outflow of coins. This directly points to the strategy of squeezing "weak hands." The process of large accumulation has started, but this does not mean that sharp price fluctuations are not expected. Technical indicators of Bitcoin show local signals for growth, but the positions of buyers are still weak. The first stage of knocking out small investors has been completed, but the whole campaign is just getting underway.
|
| Technical analysis recommendations on EUR/USD and GBP/USD for May 17, 2022 Posted: 17 May 2022 01:20 AM PDT EUR/USD
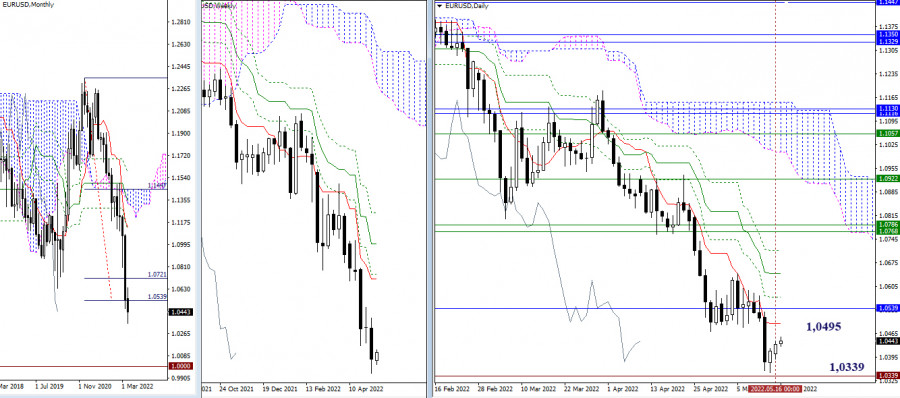
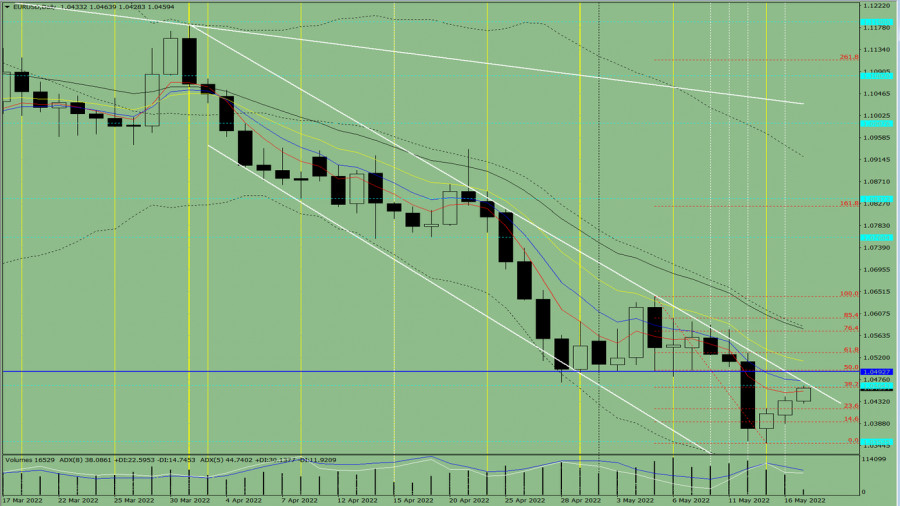
Higher timeframes Bulls continue to implement a corrective rally, but the size of the gains is very small. The first target in this situation is the daily short-term trend, which today is located at 1.0495. Further, during the rise, resistance will be provided by the monthly milestone of 1.0539 (100% working out of the monthly target), this level not so long ago was the center of daily consolidation for a long time, and the levels of the daily death cross (1.0573 – 1.0642 – 1.0712). The completion of the correction and the breakdown of support at 1.0339 (the 2017 main bottom) will open opportunities for further decline. In this case, the psychological level of 1.0000 can serve as a reference point.
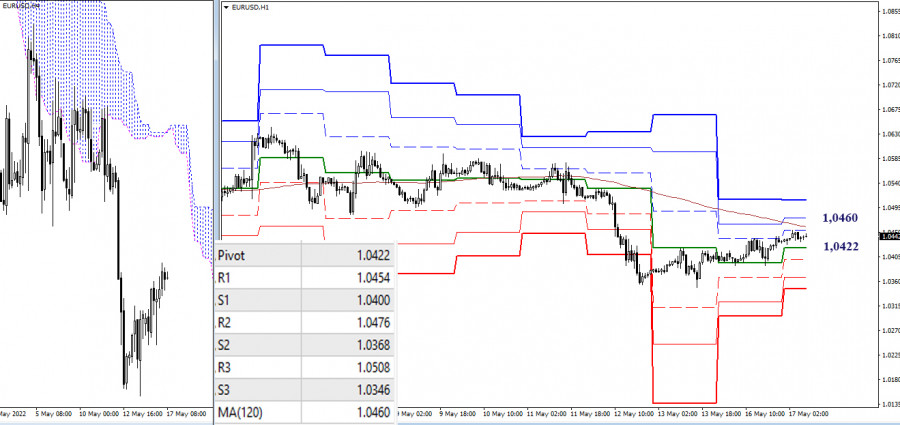
H4 - H1 The corrective rise continues. In the lower timeframes, the pair approached a key level—the weekly long-term trend (1.0460). Consolidation above and reversal of the moving average can continue to strengthen bullish sentiment and allow players to build new far-reaching plans for an increase. Additional upside targets within the day today can be noted at 1.0476 and 1.0508 (classic pivot points). If the rise is completed and the second key level returns to the side of the bears—now at 1.0422 (central pivot point of the day), there will be prospects for exiting the upward correction zone and restoring the downward trend (1.0349). The extremum (1.0349) is strengthened by the support of the higher timeframes (1.0339), so a breakdown and a reliable consolidation below can greatly help the bears in the subsequent decline. *** GBP/USD
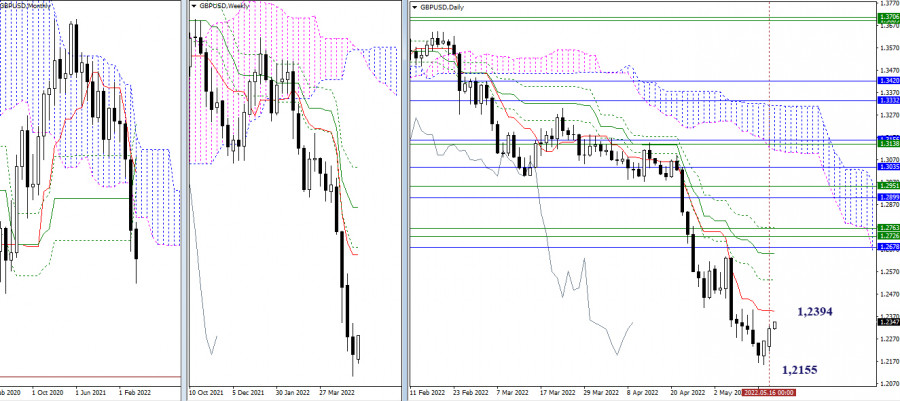
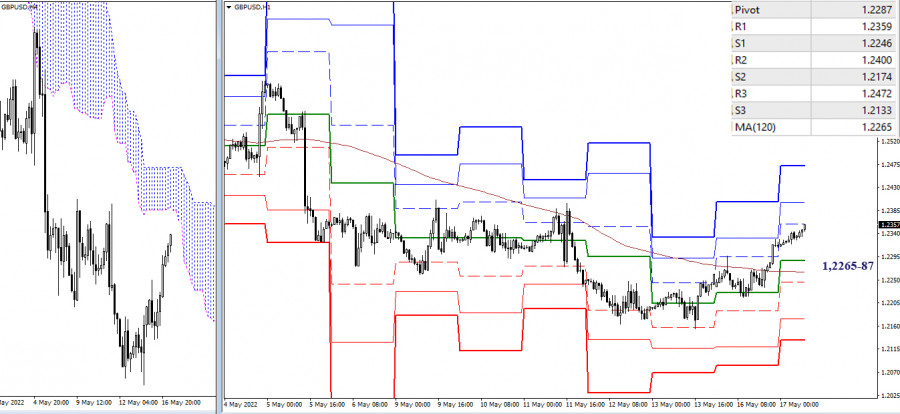
Higher timeframes The corrective rise continues. The first daily target of the upward correction is already close—1.2394 (daily short-term trend). When this resistance is overcome, the bulls will have new prospects at 1.2534 (daily Fibo Kijun) and 1.2651 – 1.2767 (a zone of accumulation of levels of different timeframes). The completion of the correction and the restoration of the downward trend is possible through the update of the bottom of 1.2155. Subsequently, the psychological level of 1.2000 may provide support in case of a decline.
H4 - H1 In the lower timeframes, the pound took over the key levels, turning them into support: today they are located in the area of 1.2265–87 (central pivot point + weekly long-term trend). Consolidation below will change the current balance of power, which is now in favor of the bulls. Upward reference points within the day today are the resistance of the classic pivot points (1.2359 – 1.2400 – 1.2472). *** In the technical analysis of the situation, the following are used: higher timeframes – Ichimoku Kinko Hyo (9.26.52) + Fibo Kijun levels H1 - Pivot Points (classic) + Moving Average 120 (weekly long-term trend) The material has been provided by InstaForex Company - www.instaforex.com |
| Forex forecast 05/17/2022 AUD/USD, EUR/USD, USDX, Oil and Bitcoin from Sebastian Seliga Posted: 17 May 2022 01:04 AM PDT Let's take a look at the technical picture of AUD/USD, EUR/USD, USDX, Oil and Bitcoin The material has been provided by InstaForex Company - www.instaforex.com |
| GBP/USD: the pound rushes up against everything Posted: 17 May 2022 12:56 AM PDT
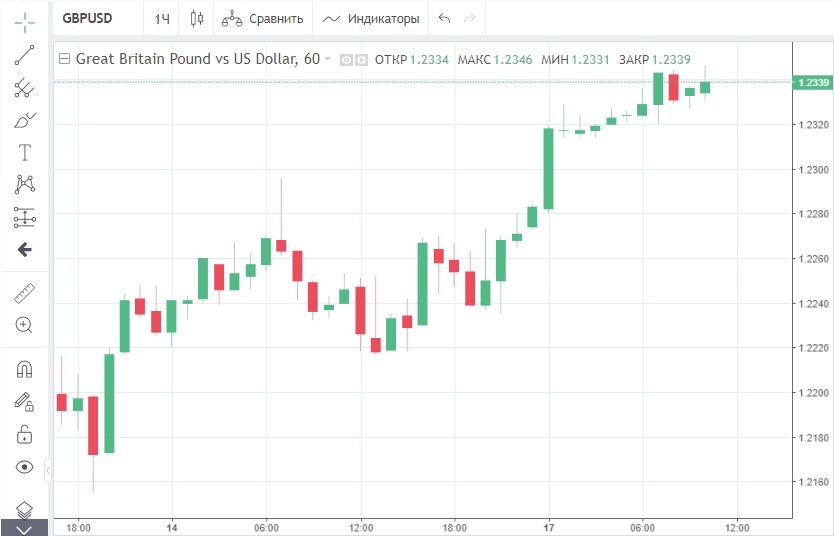
A few days ago, the dollar was confidently winning against the pound. But at the beginning of this week, the balance of power in the GBP/USD pair changed. What is the reason for the pound's growth, and how high can it rise? The pound had all the prerequisites to start the week with a fall. The twists and turns around the Northern Ireland protocol are not abating, and the British Parliament has criticized the Bank of England's policy aimed at combating inflation. British Prime Minister Boris Johnson again renewed threats to break the Brexit agreement with the EU if the Northern Ireland protocol is not amended. Now Britain, more than ever before, is very determined, because the protocol on Northern Ireland that exists today hinders the recovery of its economy, which is already on the verge of recession. It is expected that today the Government of the United Kingdom will consider a draft law on breaking the Brexit agreement with the European Union. Also on Tuesday, British Foreign Minister Liz Truss will present proposals to Parliament on the revision of the Northern Ireland Protocol. This could provoke another conflict between Britain and the EU. Recall that the European Alliance has repeatedly stated its readiness to suspend trade with the United Kingdom if the protocol on Northern Ireland is changed unilaterally. Such a scenario is negative for the British economy and could seriously weaken its currency. Nevertheless, yesterday the pound ignored concerns about the possible termination of trade with the EU. News about the long-awaited reform of the Northern Ireland Protocol, on the contrary, encouraged the British currency. On Monday, the GBP/USD pair jumped by about 1.5% and continued to grow this morning, awaiting further action from the British government. Today, the pair is trading above the level of 1.235, while last week it sharply plunged under the pressure of a strong dollar to the lowest level since 2020 at 1.219.
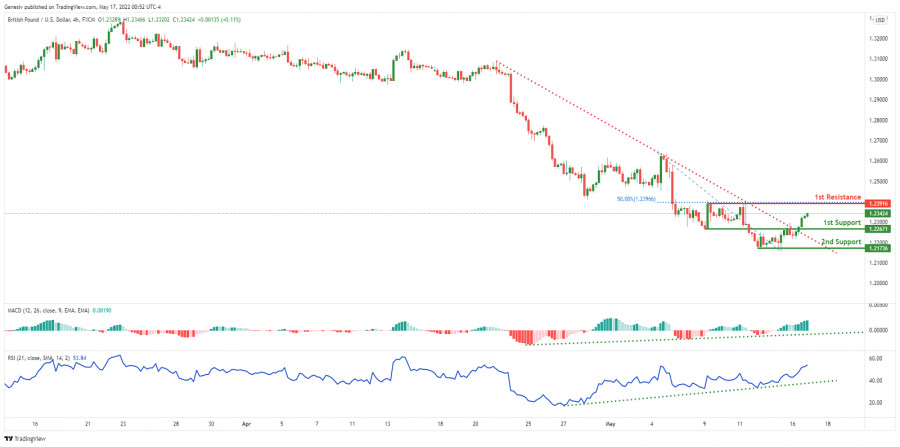
At the beginning of the current seven-day period, the pound was also supported by the weakening of the US currency. Yesterday, the greenback retreated from the 20-year high of 105,100 reached last Friday. The dollar index declined against its main competitors by 0.8%, to 104,100 points. The greenback sharply plunged after the statements of the president of the Federal Reserve Bank of New York, John Williams. Since the NY Empire State manufacturing activity index fell by more than 11% in May, the official did not speak in favor of a more aggressive rate hike at the next FOMC meetings. He supported the idea of Fed Chairman Jerome Powell to increase the indicator by 50 bps, as in the current month. The soft position of Williams had a negative impact on the yield of US government bonds. On Monday, it fell to 2.88%, down 3.6 bps. Meanwhile, the British parliament said yesterday that the BoE acted too cautiously and slowly, trying to contain inflation. In response to the criticism, BoE Governor Andrew Bailey said that officials could not have foreseen such large-scale problems in global supply chains, which led to crazy price increases. The military conflict in Ukraine and a new outbreak of coronavirus in China provoked a significant increase in the 2% inflation target set by the British government. Recall that the BoE has raised interest rates at four consecutive meetings and intends to stick to a hawkish course in the coming months. According to forecasts of the British central bank, inflation may reach 10.2% this year. Bailey has warned that the rise in food prices will continue and will have "apocalyptic" consequences for the poorest segments of society. At the same time, the BoE is afraid to act too aggressively, trying to tame raging inflation, because a sharp increase in rates increases the threat of recession. The risk of a slowdown in the growth of the British economy is the main obstacle to the pound's growth in the long term. However, in the near future, the GBP/USD pair has a great chance to continue climbing. Today, the pound can get a boost from fresh statistics from the labor market. The number of applicants for unemployment benefits fell in April to 56,900 from the previous value of 81,000. And the unemployment rate fell to 3.7% from 3.8% reached in March. The technical picture also speaks about the positive short-term dynamics of the pound. Recently, the GBP/USD pair confirmed on the chart a bullish pattern of a descending wedge with a clear break above 1.2300. This implies a further advance to the monthly high in the area of 1.2640. The material has been provided by InstaForex Company - www.instaforex.com |
| Indicator analysis: Daily review of GBP/USD on May 17, 2022 Posted: 17 May 2022 12:46 AM PDT Trend analysis (Fig. 1). The market may move up from the level of 1.2316 (close of yesterday's daily candle) to the target of 1.2423, the 23.6% retracement level (red dotted line). When testing this level, the price may continue to move upward to 1.2487, the historical resistance level (blue dotted line).
Fig. 1 (daily chart). Comprehensive analysis:
Today, the price may move up from 1.2316 (close of yesterday's daily candle) to the target of 1.2423, the 23.6% retracement level (red dotted line). When testing this level, the price may continue to move upward to 1.2487, the historical resistance level (blue dotted line). Alternative scenario: from the level of 1.2316 (close of yesterday's daily candle), the price may move up with the target of 1.2423, the 23.6% retracement level (red dotted line). When testing this level, the price may move downward with the target of 1.2213, the historical resistance level (blue dotted line). When testing this level, the price may move up.The material has been provided by InstaForex Company - www.instaforex.com |
| Indicator analysis: Daily review of EUR/USD on May 17, 2022 Posted: 17 May 2022 12:32 AM PDT Trend analysis (Fig. 1). The euro-dollar pair may move up from 1.0434 (close of yesterday's daily candle) to 1.0460, the 38.2% retracement level (red dotted line). When testing this level, the price may continue to move up to 1.0495, the 50% retracement level (red dotted line). A downward pullback is possible from this level.
Fig. 1 (daily chart). Comprehensive analysis:
Today, the price may move up from 1.0434 (close of yesterday's daily candle) to 1.0460, the 38.2% retracement level (red dotted line). When testing this level, the price may continue to move up to 1.0495, the 50% retracement level (red dotted line). A downward pullback is possible from this level. Alternative scenario: from 1.0434 (close of yesterday's daily candle), the price may move up to 1.0460, the 38.2% retracement level (red dotted line). When testing this level, the price may move down to the lower fractal 1.0349 (red dotted line). From this level, the price may move up.The material has been provided by InstaForex Company - www.instaforex.com |
| GBPUSD Potential For Bullish Bounce | 17th May 2022 Posted: 17 May 2022 12:25 AM PDT
On the H4, with price moving below the Ichimoku cloud, we have a bearish bias that price will drop from our 1st resistance at 1.23802 where the horizontal swing high resistance is to our 1st support at 1.21005 in line with the 61.80% Fibonacci projection. Alternatively, price may break 1st resistance structure and head for 2nd resistance at 1.26396 where the horizontal swing high resistance is. Trading Recommendation Entry: 1.23802Reason for Entry:Horizontal swing high resistanceTake Profit: 1.21005 Reason for Take Profit:61.80% Fibonacci projectionStop Loss: 1.26396Reason for Stop Loss: Horizontal swing high resistance The material has been provided by InstaForex Company - www.instaforex.com |
| NZDUSD Potential For Bearish Continuation | 17th May 2022 Posted: 17 May 2022 12:23 AM PDT
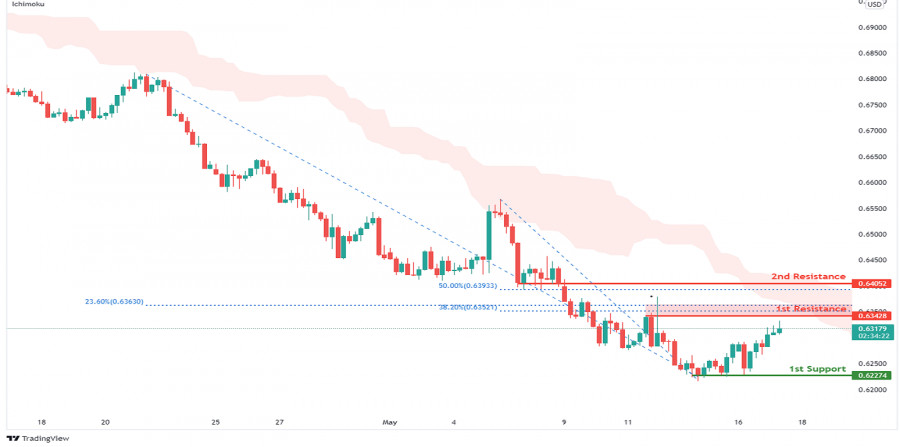
On the H4, with price moving below the Ichimoku cloud, we have a bearish bias that price will drop from our 1st resistance at 0.63428 where the 23.6% Fibonacci retracement, 38.2% Fibonacci retracement and horizontal swing high resistance is to our 1st support at 0.62274 in line with the horizontal swing low support. Alternatively, price may break 1st resistance structure and head for 2nd resistance at 0.64052 in line with the horizontal pullback resistance and 50% Fibonacci retracement. Trading Recommendation Entry: 0.63428 Reason for Entry: 23.6% Fibonacci retracement, 38.2% Fibonacci retracement and Horizontal swing high resistance Take Profit:0.62274 Reason for Take Profit:Horizontal swing low supportStop Loss: 0.64052 Reason for Stop Loss: Horizontal pullback resistance and 50% Fibonacci retracement The material has been provided by InstaForex Company - www.instaforex.com |
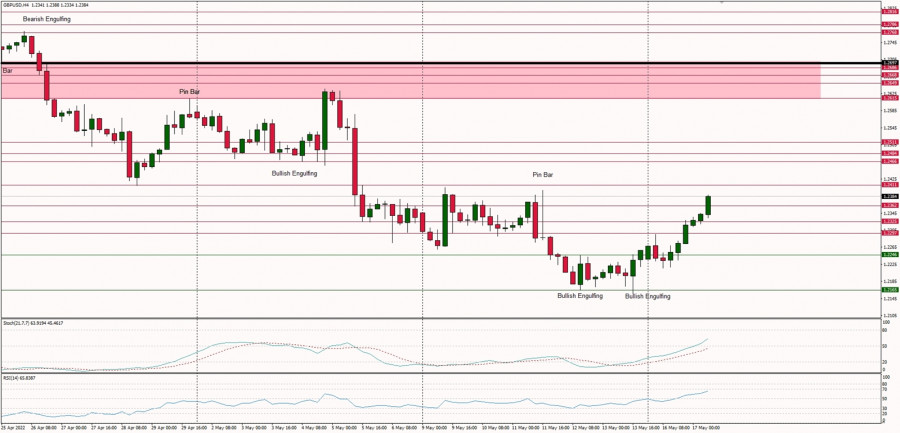
| Technical Analysis of GBP/USD for May 17, 2022 Posted: 17 May 2022 12:21 AM PDT Technical Market Outlook: The GBP/USD pair has been seen bouncing from the swing low located at the level of 1.2155 and bulls had broken through the immediate intraday technical resistance at 1.2297 and 1.2325. The technical resistance located at the level of 1.2411 is being tested currently, so any breakout through this level will open the road towards 1.2466 - 1.2511 zone. Despite the oversold market conditions on the H4 and Daily time frame charts there is no indication of trend termination or reversal just yet, so any move up must be seen only as a corrective cycle during the down trend. The bearish pressure will likely resume soon and the next technical support is seen at the level of 1.2165 and 1.2072. Weekly Pivot Points: WR3 - 1.2621 WR2 - 1.2514 WR1 - 1.2371 Weekly Pivot - 1.2267 WS1 - 1.2119 WS2 - 1.2008 WS3 - 1.1859 Trading Outlook: The price broke below the level of 1.3000, so the bears enforced and confirmed their control over the market in the long term. The Cable is way below 100 and 200 WMA , so the bearish domination is clear and there is no indication of trend termination or reversal. The next long term target for bears is seen at the level of 1.1989. Please remember: trend is your friend.
|
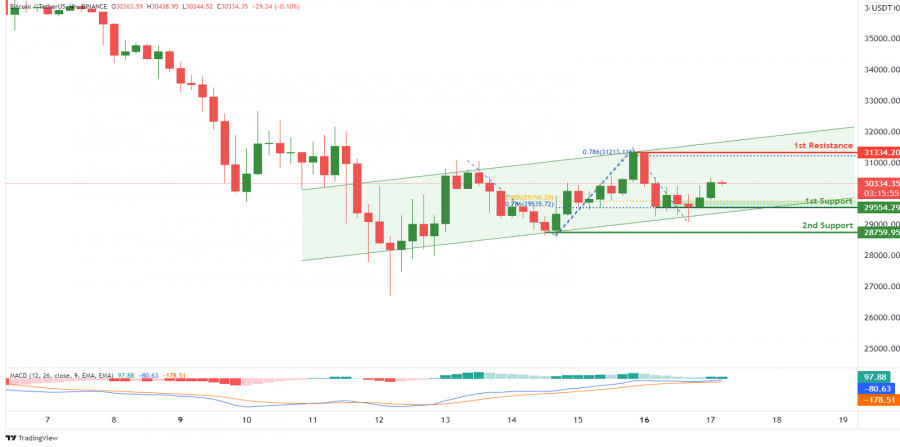
| BTCUSDT, Potential For Bullish Continuation | 17th May 2022 Posted: 17 May 2022 12:20 AM PDT
On the H4, with the MACD showing a bullish momentum, we have a bullish bias that price will rise to our 1st resistance at 31334.20 in line with the horizontal swing high resistance and 78.6% Fibonacci projection from our 1st support at 29554.29 in line with the horizontal swing low support, 61.8% Fibonacci retracement and 78.6% Fibonacci projection. Alternatively, price may break 1st support structure and head for 2nd support at 28759.95 where the horizontal swing low support is. Trading Recommendation Entry: 29554.29 Reason for Entry: Horizontal swing low support, 61.8% Fibonacci retracement and 78.6% Fibonacci projection Take Profit: 31334.20 Reason for Take Profit: Horizontal swing high resistance and 78.6% Fibonacci projectionStop Loss: 28759.95 Reason for Stop Loss: Horizontal swing low support The material has been provided by InstaForex Company - www.instaforex.com |
| Technical Analysis of EUR/USD for May 17, 2022 Posted: 17 May 2022 12:17 AM PDT Technical Market Outlook: The EUR/USD pair has bounced towards the key short-term technical resistance located at the level of 1.0469. The bearish market border is located at 1.0635, so there is still a room for bears to try to resume the down trend, even if they break through the technical resistance. The oversold market conditions on the Daily time frame chart, indicate the down trend continuation and there is no indication of trend termination or reversal just yet. The nearest technical support is seen at the level of 1.0419 and 1.0349. Weekly Pivot Points: WR3 - 1.0771 WR2 - 1.0681 WR1 - 1.0526 Weekly Pivot - 1.0438 WS1 - 1.0274 WS2 - 1.0195 WS3 - 1.0032 Trading Outlook: The market is still in control by bears that pushed the price way below the level of 1.0639, so a breakout above this level is a must for bulls for a long-term trend reversal. The up trend can be continued towards the next long-term target located at the level of 1.1186 only if bullish cycle scenario is confirmed by breakout above the level of 1.0726, otherwise the bears will push the price lower towards the next long-term target at the level of 1.0336 or below.
|
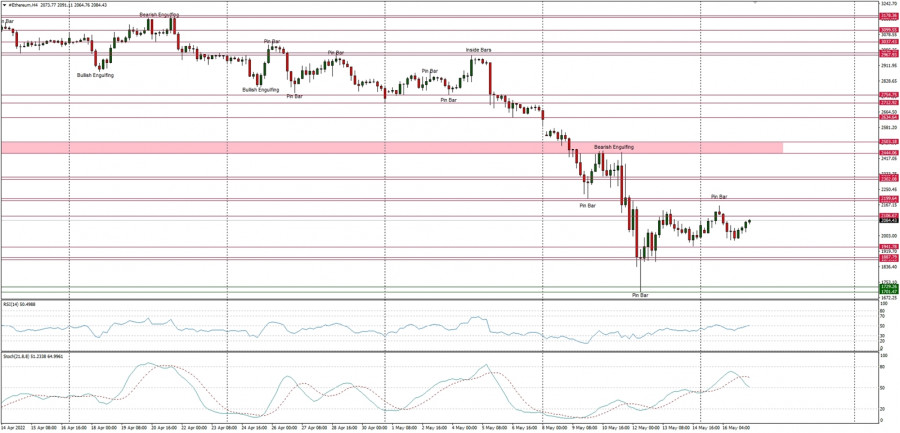
| Technical Analysis of ETH/USD for May 17, 2022 Posted: 17 May 2022 12:13 AM PDT Crypto Industry News: The Nigerian Securities and Exchange Commission (SEC) has announced new rules governing the issuance of digital assets as securities. The regulations also contain provisions on registration requirements for platforms offering digital content. Virtual asset service providers and digital asset exchanges are covered by a new set of rules that was recently published by the commission. Under the new rules, individuals or entities wishing to raise funds through a coin offer or the private sale of tokens must first submit an initial "evaluation form and white paper draft". In the draft white paper, the business license applicant must provide "complete and up-to-date information on initial digital asset projects, business plan and feasibility study". The draft document must also include a brief description of the initial offering of the digital asset, the value of each token, and the privileges they give to the buyer. The SEC also stated that the use and allocation of funds must also be specified in this document. Regarding the white papers on initial projects offering digital content, the committee said that the document should contain a disclaimer stating that this is not an offer to sell. Once the required documentation has been submitted, the SEC will review it for a decision. Upon reaching its decision, the SEC will inform the issuer within five days of the completion of the review. Technical Market Outlook: The ETH/USD pair has bounced from the new swing low at the level of $1,700 and is currently trading around the level of $2,100 as the bulls consolidate the recent gains. The recent up move might have been terminated at the level of $2,163 as the Shooting Star candlestick pattern was made at this level. The nearest technical resistance is seen at $2,199, but the weak and negative momentum supports the short-term bearish outlook with a new target for bears seen at the level of $1,420. The market keeps making lower lows and lower highs on the H4 time frame chart, so the down trend is intact. Weekly Pivot Points: WR3 - $3,385 WR2 - $2,946 WR1 - $2,555 Weekly Pivot - $2,120 WS1 - $1,688 WS2 - $1,275 WS3 - $820 Trading Outlook: The down trend on the H4, Daily and Weekly time frames had broken below the key long term technical support seen at the level of $2,000 and continues to make new lower lows with no problems whatsoever. So far every bounce and attempt to rally is being used to sell Ethereum for a better price by the market participants, so the bearish pressure is still high. The next target for bears is located at the level of $1,420.
|
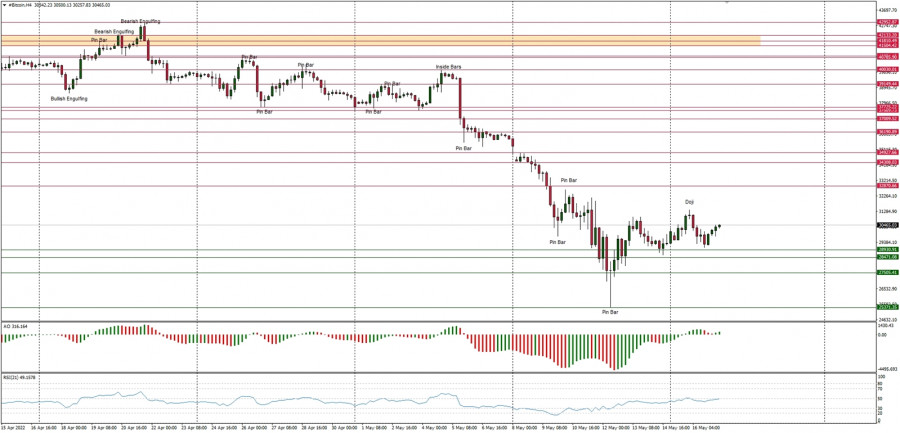
| Technical Analysis of BTC/USD for May 17, 2022 Posted: 17 May 2022 12:10 AM PDT Crypto Industry News: Global market regulators are likely to appoint a joint body over the next year to better coordinate cryptocurrency laws, said the chief executive of the International Organization of Securities Commissions (IOSCO). The top management of the International Organization of Securities Commissions (IOSCO) discussed cryptocurrency regulation this week. Members of the global organization regulate over 95% of the world's securities markets in more than 130 jurisdictions. Emphasizing the need for a global group to adjust cryptocurrency rules, IOSCO CEO Ashley Alder said that over the next year, global market regulators are likely to appoint a joint body to better coordinate cryptocurrency laws, Reuters reports. Noting that similar configurations are already used for climate finance, Alder said: "There is no such thing for cryptocurrencies right now ... But I think it is now seen as one of the three Cs (Covid, climate and crypto), so it's very, very important," we read. Citing the boom in digital currencies, including Bitcoin, the chairman of IOSCO said that cryptocurrencies "rose to the agenda" and has become one of the three key areas that authorities focus on. She noted that there are many cryptocurrency risks that need to be addressed, adding that regulators are lagging behind in some key risk areas, including cybersecurity, operational resilience, and a lack of transparency in the crypto ecosystem Technical Market Outlook: The BTC/USD pair has bounced from the swing low made at the level of $25,367 after the Pin Bar candlestick was made at the end of the down move. The bulls keep trying to bounce higher and are currently trading back above the level of $30,000.. The local high was made at the level of $31,190 so far. The weak and negative momentum supports the short-term bearish outlook with a new target for bears seen at the level of $20,000. The market keeps making lower lows and lower highs on the H4 time frame chart, so the down trend is intact. Weekly Pivot Points: WR3 - $44,348 WR2 - $39,422 WR1 - $35,469 Weekly Pivot - $30,396 WS1 - $26,266 WS2 - $21,367 WS3 - $17,368 Trading Outlook: The down trend on the H4, Daily and Weekly time frames continues. So far every bounce and attempt to rally is being used to sell Bitcoin for a better price by the market participants, so the bearish pressure is still high. The key long term technical support is seen at the round psychological level of $20,000.
|
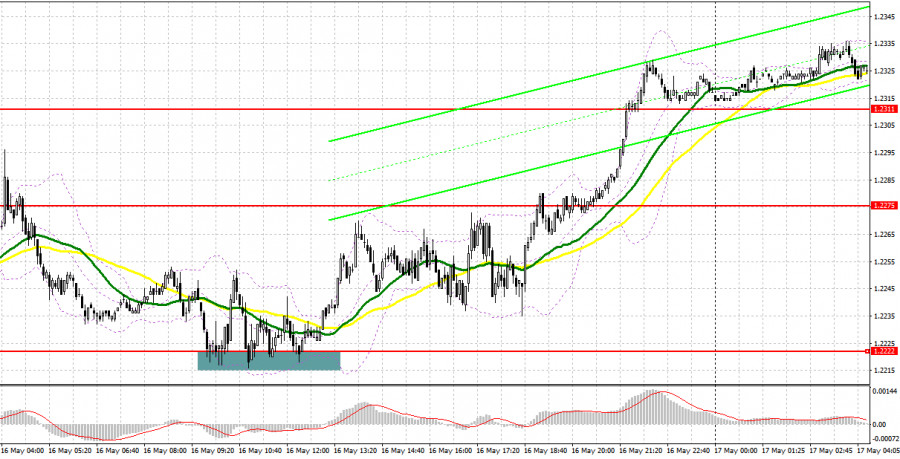
| Posted: 16 May 2022 11:59 PM PDT When to go long on GBP/USD: Yesterday only one good signal was formed to enter the market. Let's take a look at the 5-minute chart and see what happened. In my morning forecast, I paid attention to the level of 1.2222 and advised you to make a decision on entering the market from it. The lack of statistics on the UK and the expected speech of Bank of England Governor Andrew Bailey in the afternoon caused the 1.2222 level to be tested, where in my morning forecast I advised you to open long positions there in anticipation of the recovery of the pair, which happened. As a result of forming a false breakout and a buy signal, the pair went up by more than 40 points, but we have not yet reached the planned resistance in the 1.2291 area. In his speech, Bailey reassured investors who were afraid of a pause in the interest rate hike cycle by the BoE, after which the pound continued to rise. However, it was not possible to wait for new signals to enter the market.
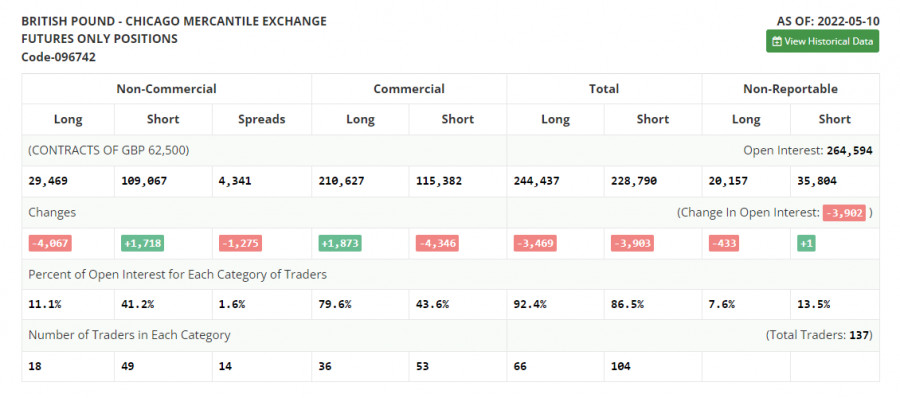
Before analyzing the technical picture of the pound, let's look at what happened in the futures market. The Commitment of Traders (COT) report for May 10 showed that long positions decreased while short positions had increased, which caused the negative delta to increase further. The presence of a number of problems in the economy and a rather difficult situation with inflation are forcing investors to get rid of the British pound, which is very seriously losing its appeal against the backdrop of demand for safe haven assets and more profitable instruments. The monetary policy of the Federal Reserve, aimed at tightening the cost of borrowing, will continue to support the US dollar, pulling the British pound lower and lower. The actions of the Bank of England to raise interest rates have not yet brought the desired result, and talk that, due to serious economic difficulties, the central bank may even suspend the normalization of monetary policy, scare investors even more. As I have repeatedly noted, future inflationary risks are now quite difficult to assess also because of the difficult geopolitical situation, but it is clear that the consumer price index will continue to rise in the coming months. The situation in the UK labor market, where employers are forced to fight for each employee, offering ever higher wages, is also pushing inflation higher and higher. The May 10 COT report indicated that long non-commercial positions decreased by -4,067 to 29,469, while short non-commercial positions rose by 1,718 to 109,067. This led to an increase in the negative value of the non-commercial net position from - 73,813 to -79,598. The weekly closing price fell from 1.2490 to 1.2313.
Pound bulls can take advantage of good data on the UK economy and continue the correction in order to break through the nearest resistance at 1.2356. If the pair declines after receiving disappointing data on the change in the number of applications for unemployment benefits and the unemployment rate in the UK, the bulls will have to defend the immediate support of 1.2311. Only a false breakout at this level can provide a signal for long positions that can keep the GBP/USD within the rising channel, as well as based on the breakdown and update of 1.2356. Consolidating above 1.2356 will strengthen the demand for the pound and lead to growth to the area of rather large resistance at 1.2396. There bulls will take a break before the release of important statistics on the US, expected this afternoon. A more distant target will be the area of 1.2445, where I recommend taking profits. However, we will only be able to get to this level if a number of bearish stop orders are removed after the release of the US retail sales report. In case the pound falls during the European session and the lack of activity at 1.2311, bulls do not need to panic. I advise you to postpone long positions until the next support at 1.2275, where the moving averages are passing, playing on the bulls' side. Forming a false breakout there will provide an entry point into long positions, counting on the continuation of the upward correction. You can buy GBP/USD immediately on a rebound from 1.2237, or even lower - in the area of 1.2201 with the goal of correcting 30-35 points within the day. When to go short on EUR/USD: The bears received a very serious rebuff and now it is necessary to open short positions against the formation of a new upward trend, and this is to be done very carefully - especially considering what annual lows we are at. The first task is to protect the 1.2356 range. Forming a false breakout at this level will provide an entry point to short positions with the goal of returning the bear market and the subsequent update of support at 1.2311. A breakdown and a reverse test from below 1.2311 will bring down the GBP/USD to the lows: 1.2275 and 1.2237. A more distant target will be the area of 1.2201, where I recommend taking profits. If the pair rises during the European session against the background of strong data on the UK labor market, as well as a positive change in the level of average earnings of the population, it is best to postpone short positions to the level of 1.2396. I also advise you to open short positions there only in case of a false breakout. You can sell GBP/USD immediately for a rebound from the high of 1.2445, counting on the pair's rebound down by 30-35 points within the day.
Indicator signals: Moving averages Trading is above the 30 and 50-day moving averages, which indicates an attempt by the bulls to build a correction. Note: The period and prices of moving averages are considered by the author on the H1 hourly chart and differs from the general definition of the classic daily moving averages on the daily D1 chart. Bollinger Bands A breakthrough of the average border of the indicator in the area of 1.2311 will increase the pressure on the pair. If the pair grows, the upper border of the indicator around 1.2385 will act as resistance. Description of indicators
|
| Posted: 16 May 2022 11:48 PM PDT What is needed to open long positions on EUR/USD The currency pair created a few market entry signals yesterday. Let's take a look at the 5-minute chart and try to figure out what has actually happened. In the morning review, I highlighted the level of 1.0424 and recommended making decisions on market entry with this level in focus. The euro bulls managed to assert themselves amid the empty economic calendar in the first half of the day and expectations of more aggressive moves from the ECB. In fact, the bulls didn't receive as much support as they wanted. The price grew and made a false breakout at 1.0424 according to the morning scenario which created a good point for opening short positions. However, the price didn't make a large downward move. After the pair had slipped 15 pips, the bulls began buying the euro enabling the second test of 1.0424 and a revision of the technical picture. In the second half of the day, the euro weakened against the US dollar. A test and a false breakout of support at about 1.0387 generated a buy signal. As a result, the pair moved more than 40 pips upward and halted at around resistance of 1.0442.
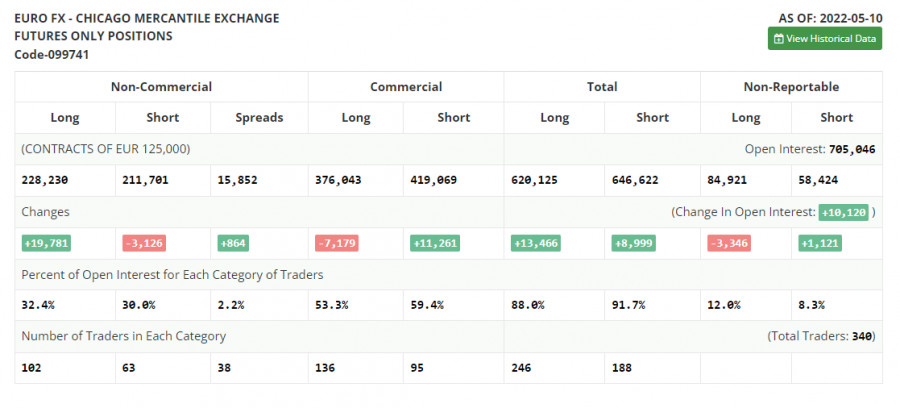
Before we discuss further prospects of EUR/USD, let's see what's going on in the future market and what has changed in the COT report from May 10. The report shows a sharp increase in long positions and contraction in short ones. The euro's overbought status indicates interest from traders and investors. Recent statements from ECB policymakers arouse optimism in hope that the euro will be able to develop an upward cycle. The ECB governing board will increase the deposit rate by 0.25% as early as July 2022. The next rate hikes will follow in September and in December. The deposit rate will stand at 0.25% at the year-end. Besides, the key interest rate will be raised in September and in December from the current zero level to 0.5%. Such a hawkish policy will allow the euro buyers to touch the bottom in the near future. Nevertheless, the US Fed alongside escalating geopolitical jitters might derail such plans. Let me remind you that the US Fed intends to pursue aggressive monetary tightening. There are rumors that the FOMC could lift interest rates by 0.75% at a time at the next policy meeting. This scenario gives a clear signal to buy the US dollar in the medium term. The COT report reads that long non-commercial positions jumped rapidly by 19,781 from 208,449 to 228,230. At the same time, short mom-commercial positions dropped by 3,126 from 214,827 to 211,701. I noted that the low rate of the euro makes it more attractive for traders. Currently, we see that more buyers are entering the market. The overall non-commercial net positions rose to 16,529 at the end of the last week against the negative -6,378 a week ago. EUR/USD closed last week almost flat at 1.0546 against 1.0545 in the previous week.
EUR bulls are eager to push the price to new one-week highs, having approached resistance at 1.0462. Today a series of macroeconomic data is due in the EU that might pave the way for EUR/USD's further growth in the first half of the day. Obviously, the market is riveted to US retail sales for April. Further price action will depend on how the bulls will behave at 1.0462. They will be able to push the price above the resistance of 1.0462 in case of strong EU GDP data and a decline in the unemployment rate. It will be a challenge for them because an upward correction could be over in that area. EUR/USD will break and make the opposite test of this area downward on the condition of upbeat on Italy's trade balance and consumer price index. So, the pair will generate the first buy signal with the target at large resistance of 1.0497 which will cap the bullish momentum. A climb above 1.0497 will trigger stop orders of the bears that will cancel a short-term bearish trend and shape a bullish trend with prospects of updating highs of 1.0529 and 1.0575. However, such growth will be possible in case of weak US retail sales data which is due in the second half of the day. If the pair goes down, the first task for the bears will be the defence of 1.0426. Moving averages are passing slightly below this level, benefiting the buyers. The pair might drop anytime soon because traders are poised to express risk aversion. Negative data for the Eurozone will assure traders to push the price immediately to 1.0426. So, it would be better to cancel long positions. The reasonable long scenario would be opening long positions after a false breakout of the low at 1.0391. We could buy EUR/USD immediately at a dip from 1.0353 or lower at 1.0306 bearing in mind an upward correction of 20-25 pips intraday. What is needed to open short positions on EUR/USD Yesterday the sellers failed to fulfil their tasks. Now they have to make efforts to defend the nearest resistance at 1.0462. As long as the pair settles below this level, the odds are that the euro will go down. However, the bears have to see a false breakout before they can enter the market. Weak EU GDP data and Italy's inflation will push EUR/USD back to 1.0426, the level to struggle for. Abreakout and the opposite test of this level upwards will create an extra signal to sell the euro. Even this price action will hardly terminate the upward correction. The final hope for the bulls will be 1.0391 where the lower border of the upward correction channel is passing. If the price settles above this level and with a similar test upwards, the market will generate a sell signal with a downward target at 1.0353 where I recommend profit-taking. A lower target is seen at 1.0306. If the euro fails to grow and bears lack activity at 1.0462, the bulls will try to add more long positions at nearly 1.0497. Market sentiment today will depend on Christine Lagarde's statements in the second half of the day. The reasonable scenario will be short positions in case of a false breakout at 1.0529. We could sell EUR/USD immediately at a bounce from 1.0575 or higher from 1.0638 bearing in mind a downward 25-30 pips correction intraday.
Indicators' signals:The currency pair is trading above the 30 and 50 daily moving averages. It indicates a further upward correction of EUR/USD. Moving averages Note: The period and prices of moving averages are considered by the author on the H1 hourly chart and differ from the general definition of the classic daily moving averages on the daily D1 chart. Bollinger BandsA breakout of the indicator's lower border at 1.0410 will be bearish for the euro. Alternatively, a breakout of the indicator's upper border at 1.0460 will encourage the euro's growth. Description of indicators Moving average (moving average, determines the current trend by smoothing out volatility and noise). Period 50. It is marked yellow on the chart. Moving average (moving average, determines the current trend by smoothing out volatility and noise). Period 30. It is marked green on the chart. MACD indicator (Moving Average Convergence/Divergence — convergence/divergence of moving averages) Quick EMA period 12. Slow EMA period to 26. SMA period 9 Bollinger Bands (Bollinger Bands). Period 20 Non-commercial speculative traders, such as individual traders, hedge funds, and large institutions that use the futures market for speculative purposes and meet certain requirements. Long non-commercial positions represent the total long open position of non-commercial traders. Short non-commercial positions represent the total short open position of non-commercial traders. Total non-commercial net position is the difference between short and long positions of non-commercial traders. The material has been provided by InstaForex Company - www.instaforex.com |
| Trading plan for Gold on May 17, 2022 Posted: 16 May 2022 11:26 PM PDT
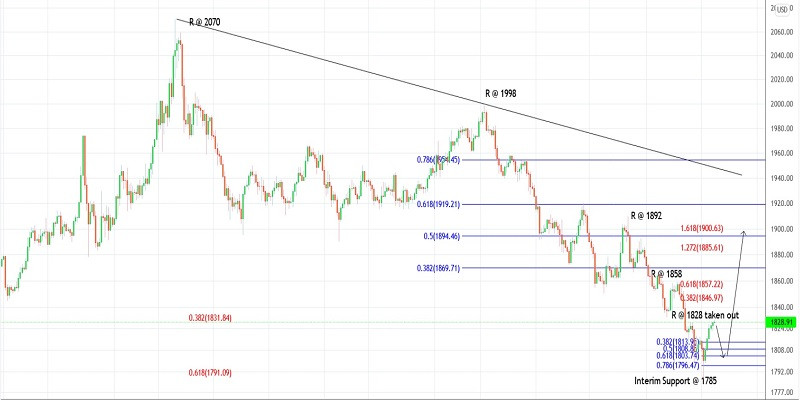
Technical outlook:Gold prices raised through the $1,830-31 levels on Monday during the past hour. The yellow metal has moved in tune with our earlier projection and has also taken out the initial resistance around $1,828 with ease. Ideally, prices should pull back slightly toward $1,815 and $1,803 before resuming a counter-trend rally. Gold has been dropping since the $2,070 high and has completed a meaningful down trade cycle as marked on the chart here. Further, bears have been successful in carving a meaningful downswing between $1,998 and $1,786. As expected, the counter-trend rally is now underway towards the $1,910-20 area. Also, note that the Fibonacci 0.618 retracement of the above downswing is seen to be passing through $1,919. The high probability remains for a bearish turn if prices manage to reach there. Furthermore, the past support-turned-resistance is seen through the $1,900-1,905 zone. Bears might be inclined to come back in control thereafter. Trading plan:Potential rally through $1,900-20 against $1,780 Good luck! The material has been provided by InstaForex Company - www.instaforex.com |
| Trading plan for USDJPY on May 17, 2022 Posted: 16 May 2022 11:07 PM PDT
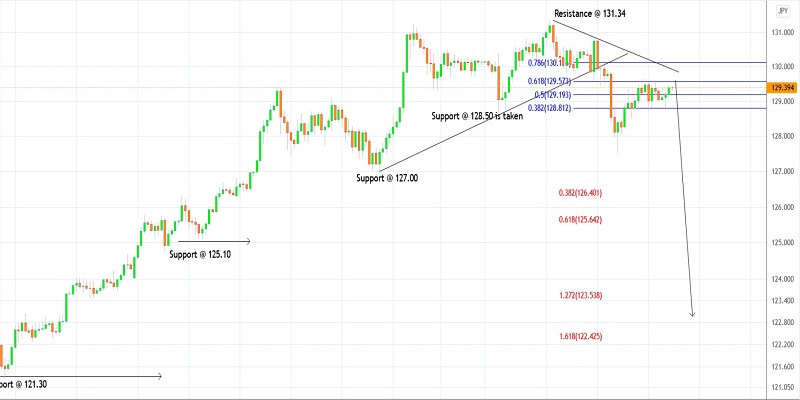
Technical outlook:USDJPY has been drifting sideways for the last 24-36 hours roughly between the range of 129.00 to 129.50. It might push through the 129.80-130.00 range before finding resistance and turning lower again. Bears will be poised to hold prices below 130.80 to keep the structure intact and drag towards 127.00 and 125.50 in the near term. USDJPY has carved a down trade cycle between 131.34 and 127.51 in the past few trading sessions as seen on the 4H chart here. Also, note that recent downswing is between 130.81 and 127.51 respectively. Prices have retraced from the above downswing through 129.50-60 range, which is also the 0.618 Fibonacci level (129.57) projected here. A high probability remains for a turn lower from here. Then, the price may continue through 126.50 and 125.50 as the next potential Fibonacci extensions marked on the chart. The above bearish structure would turn void only if prices break above 130.80 and broadly above 131.34 going forward. Traders might prepare to initiate fresh short positions now. Trading plan:Potential drop through 125.50 against 132.00 Good luck! The material has been provided by InstaForex Company - www.instaforex.com |
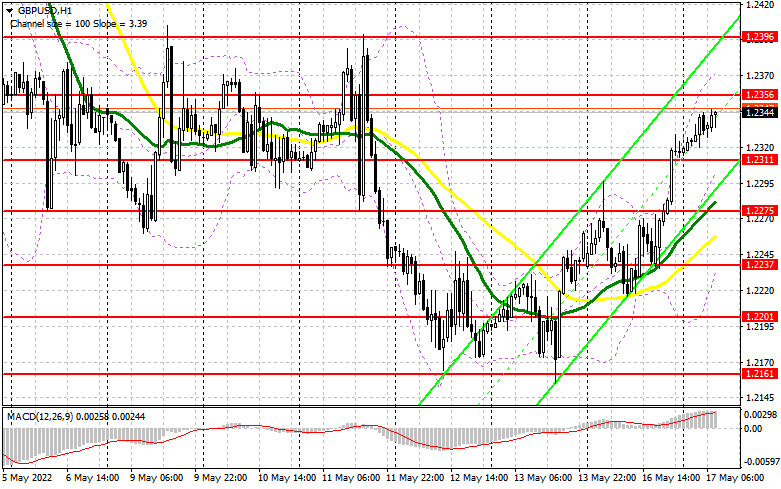
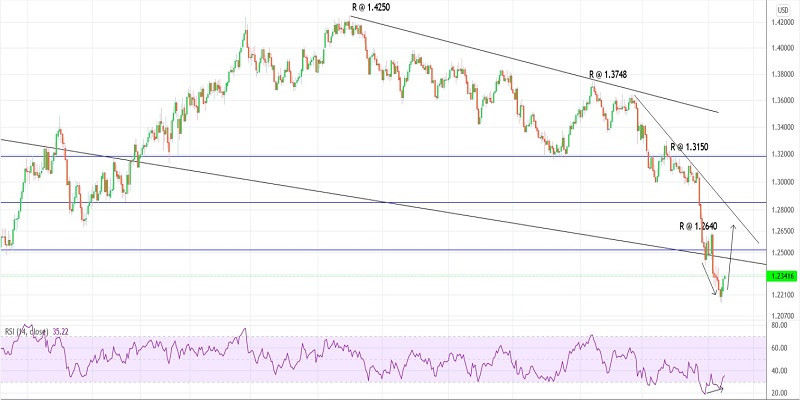
| Trading plan for GBPUSD on May 17, 2022 Posted: 16 May 2022 10:30 PM PDT
Technical outlook:GBPUSD further rallied through the 1.2345 high on Tuesday as bulls are looking poised to push through 1.2400-10 and 1.2640 in the near term. The currency pair is looking to remain in control of bulls from here and hold prices above 1.2155 going forward. Bulls have managed to push the price up nearly 200 points from the 1.2155 lows. GBPUSD has been dropping since the 1.4250 high and seems to have terminated around 1.2155 over the last week. The entire drop seems to be corrective (three waves). The currency pair could resume its next rally soon. Immediate resistance is now seen around 1.0650, followed by 1.3150 and higher; while support comes around 1.2155 respectively. A push through 1.2640-50 will now confirm that bulls are back in control and that prices will stay above the 1.2155 interim lows. Also, note that GBPUSD has produced a strong bullish divergence on its daily RSI, which is a strong indication of a potential trend reversal ahead. Traders might be preparing to initiate fresh long positions. Trading plan:Potential rally toward 1.2650 against 1.2100 Good luck! The material has been provided by InstaForex Company - www.instaforex.com |
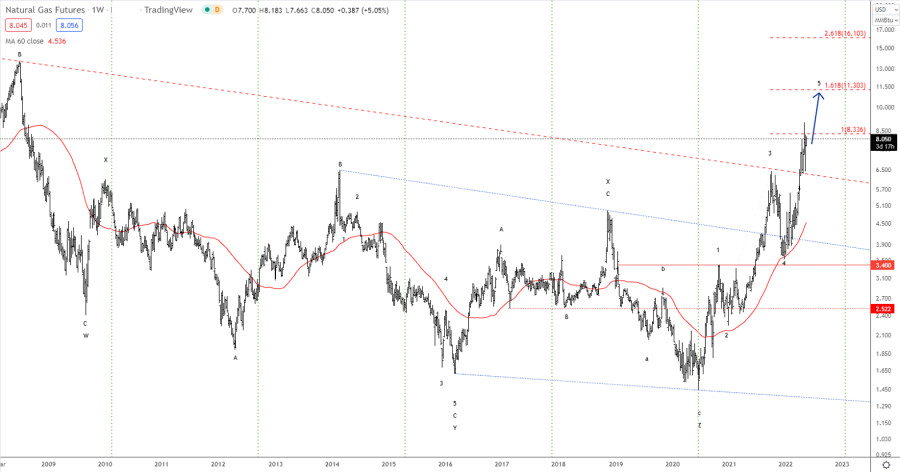
| Elliott wave analysis for Natural Gas on May 17, 2022 Posted: 16 May 2022 10:27 PM PDT
Natural Gas (NG) continues to point higher toward the next upside target at 11.30. If NG develops a runaway rally, we could see a continuation all the way to 16.10 as the next upside target. Rapid rallies in the commodity instruments are not unusual, as they often arise due to low supply and fear. In the short term, we see support near 7.38 and then 6.43. Only a break below the latter will question our bullish expectations. The material has been provided by InstaForex Company - www.instaforex.com |
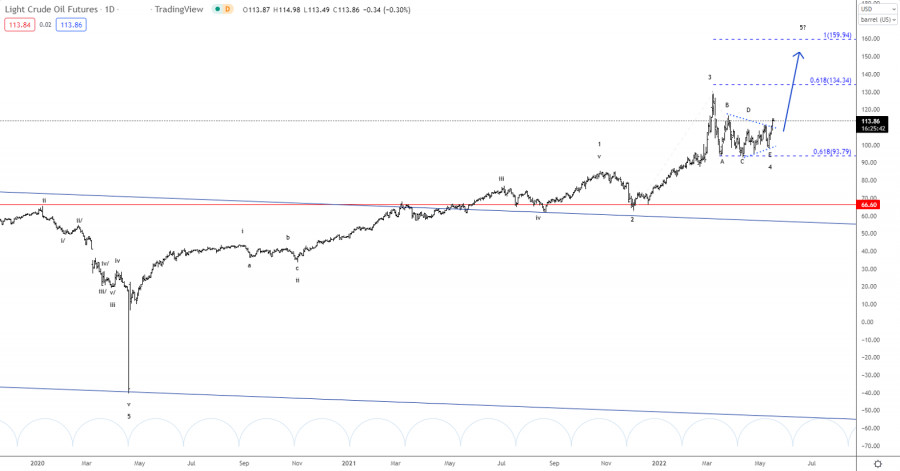
| Elliott wave analysis of Crude Oil on May 17, 2022 Posted: 16 May 2022 10:22 PM PDT
Crude oil has just completed a symmetric triangle to the upside which calls for the next impulsive rally towards at least 134.34 and more likely closer to 159.94. If we see a runaway rally in wave 5, we could even see crude oil reach the 200 handle. Short-term we see minor resistance near 116.64 before running higher for a test of the 134.34 target. The material has been provided by InstaForex Company - www.instaforex.com |
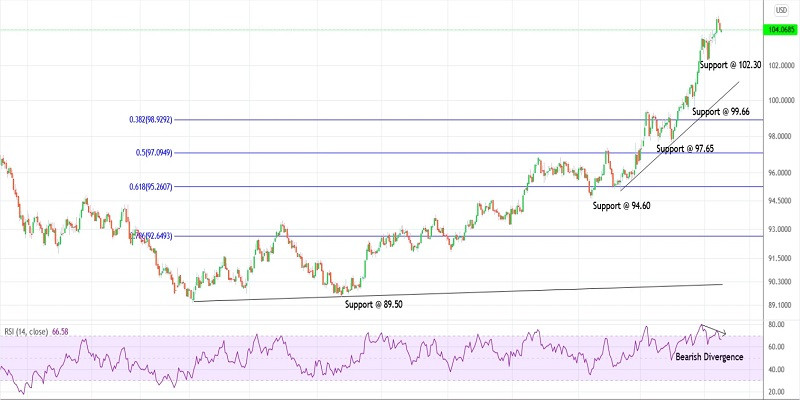
| Trading plan for US dollar index on May 17, 2022 Posted: 16 May 2022 10:10 PM PDT
Technical outlook:The US dollar index slipped to 103.94 in the early hours of the Asian session on Tuesday. The index is seen to be trading at around 104.10 at this point in writing and is expected to continue its decline through 102.30 at least in the near term. Also, note that bears have finally managed to carve an Evening Star candlestick pattern on the daily chart. The US dollar index could be preparing to drop through initial support around 102.30 as bears are now looking to remain in control. The bottom line remains that prices should stay below the 104.88 mark to keep the structure intact. The high probability remains for a meaningful top in place and prices to drag below 102.30 and 99.65 in the near term. Besides, note that the daily RSI has been producing a strong bearish divergence as shown here. This is a potential indicator for a trend reversal soon. A break below initial support at 102.30 will confirm the same. Until that happens, the US dollar index remains poised to reach a new high towards the 105.00-50 mark. Trading plan:Potential drop through 102.30, 99.65 and 97.65 against 105.50 Good luck! The material has been provided by InstaForex Company - www.instaforex.com |
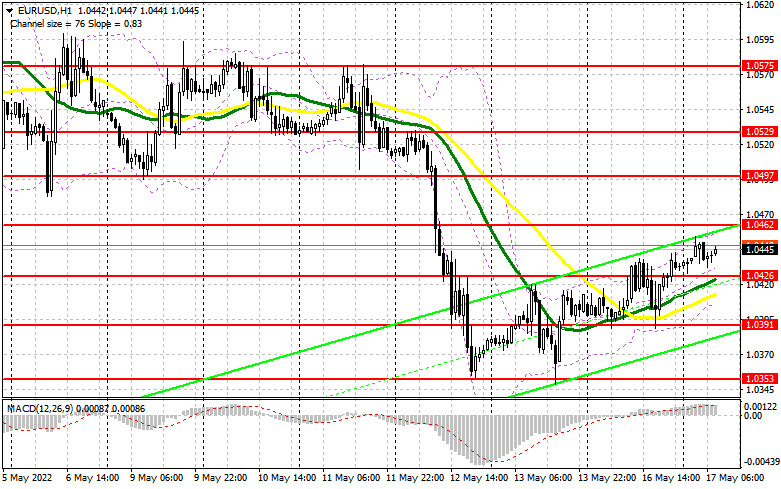
| Trading plan for EURUSD on May 17, 2022 Posted: 16 May 2022 09:51 PM PDT
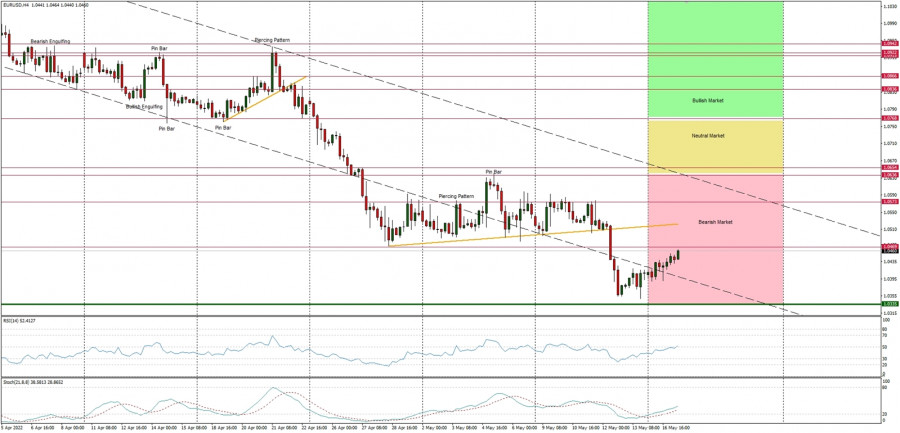
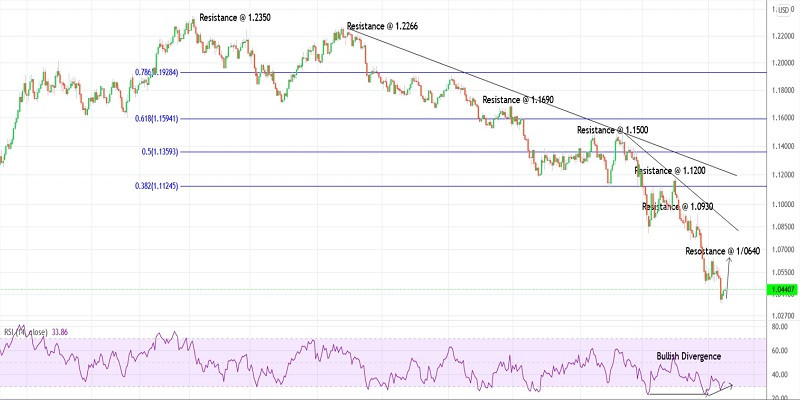
Technical outlook:EURUSD raised through the 1.0450-50 zone on Tuesday, inching towards its initial resistance seen around the 1.0640-50 mark. The single currency pair is seen to be trading at around 1.0440 at this point in writing. It is expected to push further higher from here. Bulls are looking poised to hold prices above the 1.0348 lows going forward. EURUSD is still not out of woods on the downside and needs to break above the 1.0640-50 initial resistance at least to confirm a major bottom in place. Until that happens, the probability remains for yet another low below the 1.0348 mark going forward. Please note that the potential remains for a push through the 1.1200 and 1.1500 resistance levels in the next few trading sessions. EURUSD has been showing bullish divergence on the daily RSI since the last swing low at 1.0800 as seen here. The latest drop through 1.0348 has produced a strong divergence, which indicates a potential trend reversal. The high probability remains for bulls to remain in control and prices to hold above 1.0348. Watch out for a break of 1.0640-50 in the next few trading sessions. Trading plan:Potential rally through 1.0650 against 1.0300 Good luck! The material has been provided by InstaForex Company - www.instaforex.com |
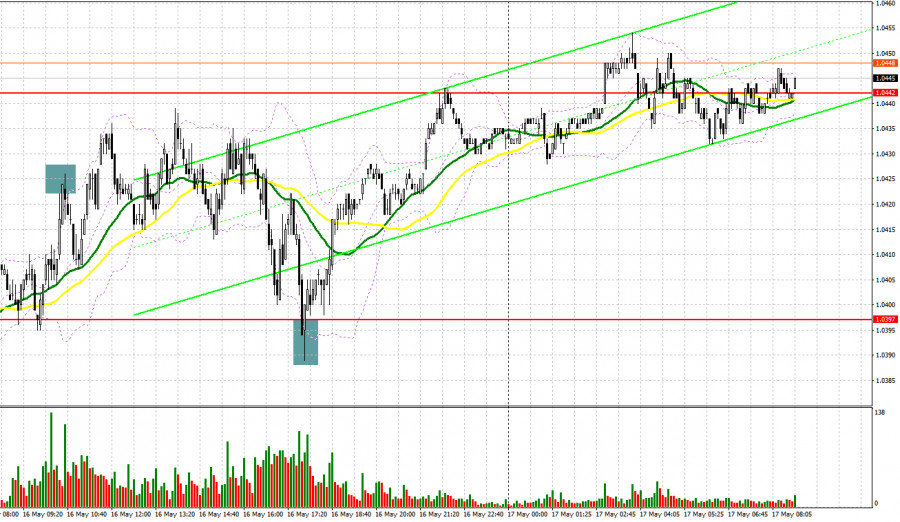
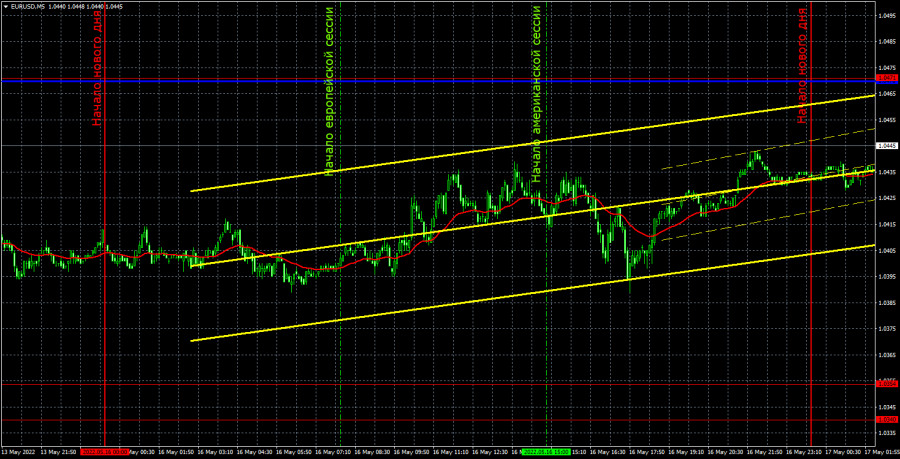
| Posted: 16 May 2022 09:46 PM PDT EUR/USD 5M
The EUR/USD pair continued its upward correction with grief in half on Monday. This upward correction, to be honest, does not even look like a correction yet, since it is several times weaker than the downward movement that preceded it. Thus, it would be better to say "rollback". In general, the pair continues to maintain a downward trend and the euro could fall almost at any moment. Unfortunately, the market not only does not pay attention to the fact that it is necessary to correct from time to time, it even ignores the macroeconomic statistics that could support the euro. So it all comes down to simple long positions on the dollar in any situation now. From time to time, the pair takes a break, during which it mostly moves sideways. There were no macroeconomic statistics and fundamental events on Monday. Volatility was rather weak, which is not surprising. The situation was even more boring in terms of trading signals, since none were formed on Monday. The pair did not even come close to any level or line. In fairness, it should be noted that there are practically no levels in the current price range, and the Ichimoku indicator lines are located above the current price values. This happens because the downward trend is too strong and the Kijun-sen and Senkou Span B lines seem to be catching up with the price. And they do it with a noticeable delay. There are so few levels because the pair is near its 20-year lows. COT report:
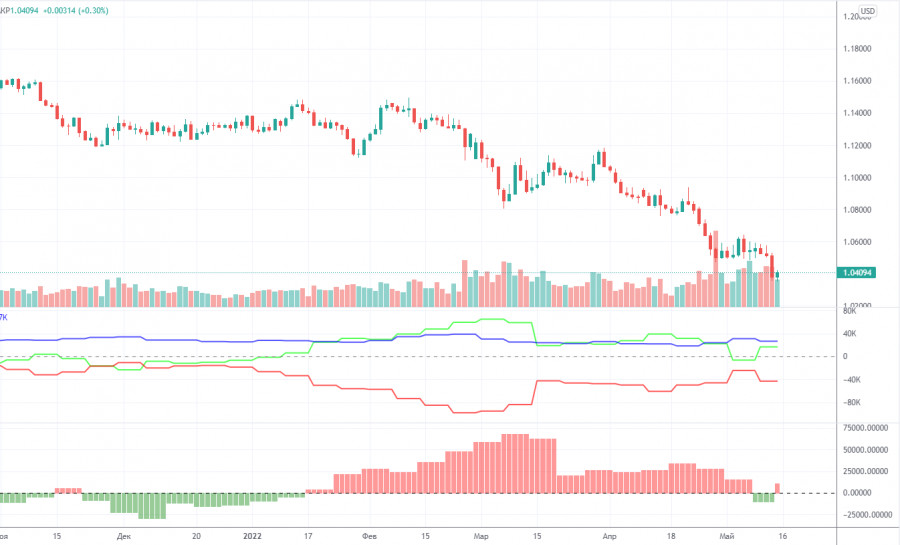
The latest Commitment of Traders (COT) reports on the euro raised more questions than they answered! The week before last, for the first time in a long time, the COT report showed a bearish mood among traders, which is logical, given the strong fall of the euro in recent months. However, the new COT report again showed an increase in bullish sentiment! During the reporting week, the number of long positions increased by 19,800, while the number of short positions in the non-commercial group decreased by 3,100. Thus, the net position grew by 23,000 positions per week. This means that the bearish mood has turned to bullish, as the number of longs now exceeds the number of shorts for non-commercial traders by 17,000. As a result, we again have a paradoxical picture in which big players buy more euros than they sell, but at the same time, the euro falls. From our point of view, this is because the demand for the US dollar is much higher than the demand for the euro. Even if someone suggested that the whole point is the weakening of the bullish mood in recent months (the second indicator is a histogram), then we recall that in the week between May 4 and 10, commercial traders opened 20,000 longs, and the euro increased by 30 points over the same period... Thus, it is still impossible to make a correlation between COT reports and what is happening in the market. Forecasts to build on such data, moreover, do not make sense. We recommend to familiarize yourself with:Overview of the EUR/USD pair. May 17. The Baltic is a new platform for a possible clash between Russia and NATO. Overview of the GBP/USD pair. May 17. Great Britain and the European Union are obviously bored: a trade war may begin. Forecast and trading signals for GBP/USD on May 17. Detailed analysis of the movement of the pair and trading transactions. EUR/USD 1H
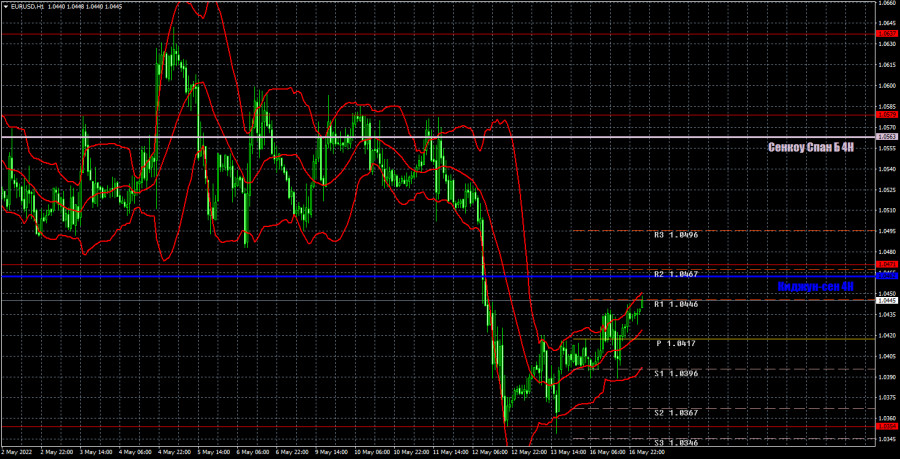
The pair continues its downward trend on the hourly timeframe and now we have a clear support area at 1.0340-1.0354, which represents 20-year lows. It makes no sense to talk about the technical picture now, since it has remained unchanged for a very, very long time. As long as the price is below the critical line, we do not expect the euro to show significant growth against the dollar. On Tuesday, we allocate the following levels for trading - 1.0340-1.0354, 1.0471, 1.0579, as well as Senkou Span B (1.0563) and Kijun-sen (1.0462) lines. Ichimoku indicator lines can move during the day, which should be taken into account when determining trading signals. There are also secondary support and resistance levels, but no signals are formed near them. Signals can be "rebounds" and "breakthrough" extreme levels and lines. Do not forget about placing a Stop Loss order at breakeven if the price has gone in the right direction for 15 points. This will protect you against possible losses if the signal turns out to be false. Several reports of medium importance are scheduled for May 17 in the European Union and the United States. In the EU, we have the GDP for the first quarter in the second estimate, in the US, there's retail sales and industrial production in April. We do not believe that this data, whatever it may be, is capable of provoking a strong market reaction. Volatility may remain not too high, and the movement may be weakly upward. Explanations for the chart:Support and Resistance Levels are the levels that serve as targets when buying or selling the pair. You can place Take Profit near these levels. Kijun-sen and Senkou Span B lines are lines of the Ichimoku indicator transferred to the hourly timeframe from the 4-hour one. Support and resistance areas are areas from which the price has repeatedly rebounded off. Yellow lines are trend lines, trend channels and any other technical patterns. Indicator 1 on the COT charts is the size of the net position of each category of traders. Indicator 2 on the COT charts is the size of the net position for the non-commercial group. The material has been provided by InstaForex Company - www.instaforex.com |
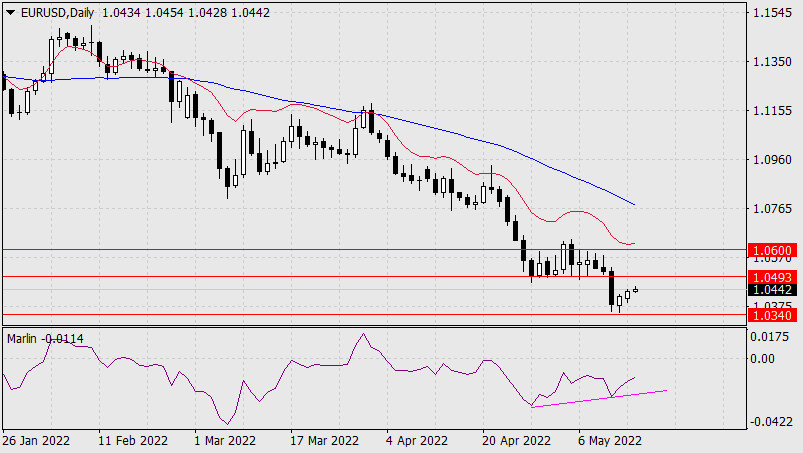
| Forecast for EUR/USD on May 17, 2022 Posted: 16 May 2022 08:15 PM PDT The euro continues slow corrective growth. The Marlin Oscillator on the daily chart is growing with a noticeable lead of the price, which is a sign of an imminent downward reversal in the price and the oscillator. The target resistance level is 1.0493. It is very likely that the price will go above the level and get stuck in the consolidation range of the first decade of May. From the range, we are waiting for the price to turn into a new wave of medium-term decline.
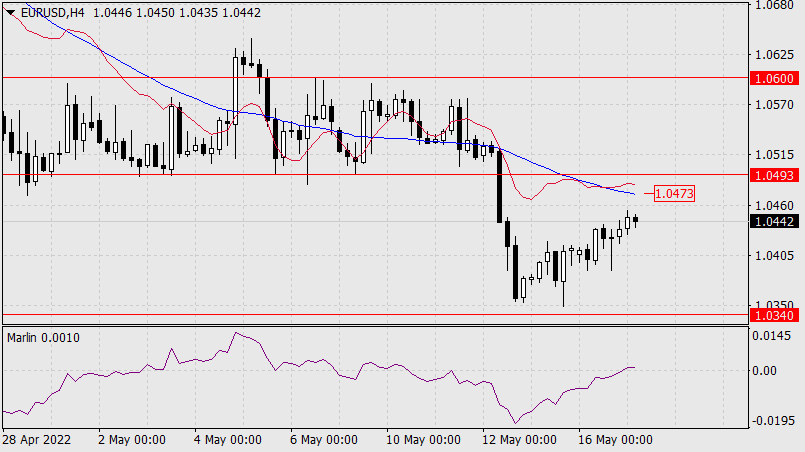
On the four-hour chart, the Marlin Oscillator is being introduced into the zone of positive values, thus the price receives support for a short-term growth. The first resistance is the MACD line (1.0473), slightly above it is the target level of 1.0493.
|
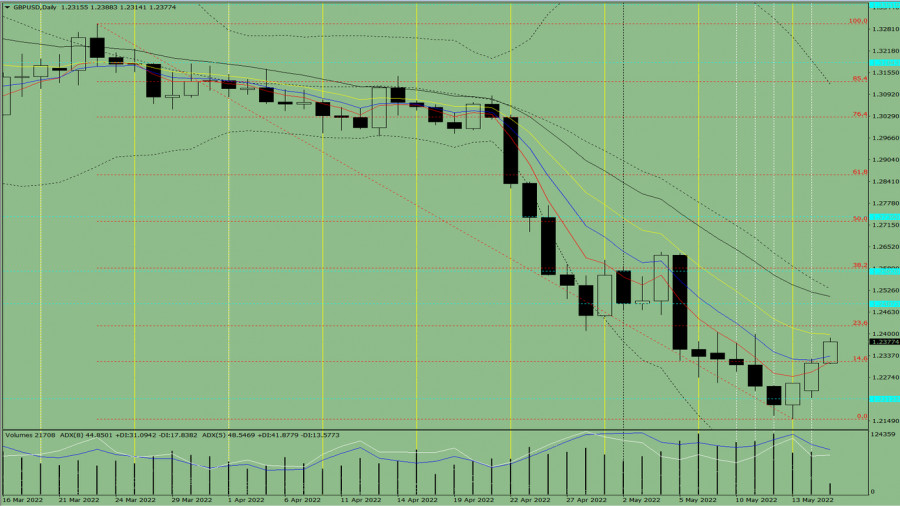
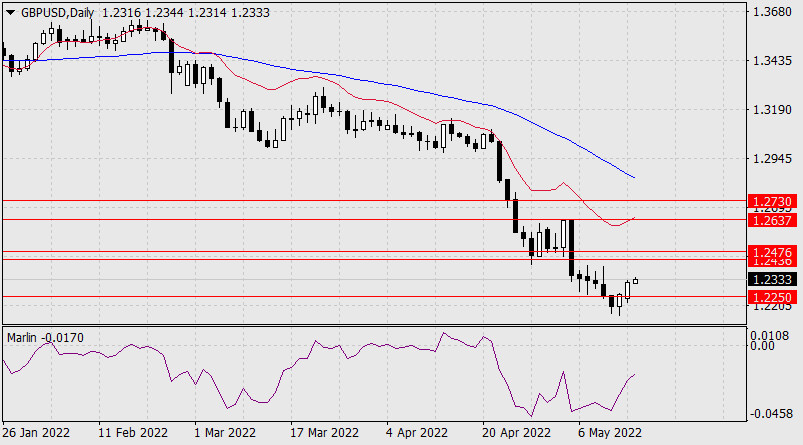
| Forecast for GBP/USD on May 17, 2022 Posted: 16 May 2022 08:15 PM PDT Yesterday, the pound rose briskly by 54 points. The price goes to the target range of 1.2436/76 with the growing Marlin Oscillator. Yesterday, Bank of England Governor Andrew Bailey, speaking in the House of Commons before the Treasury Committee, gloomily described the prospects for inflation, which was understood by many market players as the central bank's intention to tighten policy.
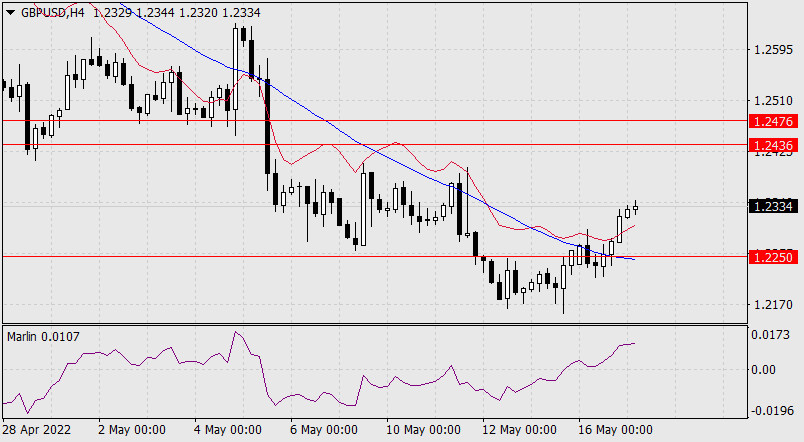
On a four-hour scale, the price settled above the balance and MACD indicator lines, Marlin is growing in the positive area. We are waiting for the price in the specified target range of 1.2436/76.
|
| You are subscribed to email updates from Forex analysis review. To stop receiving these emails, you may unsubscribe now. | Email delivery powered by Google |
| Google, 1600 Amphitheatre Parkway, Mountain View, CA 94043, United States | |


Comments