Forex analysis review
Forex analysis review |
- Analysis of GBP/USD on May 14
- EUR/USD analysis on May 14. The fate of the euro currency will be decided next week.
- Analysis of the trading week of May 9-13 for the GBP/USD pair. COT report. The British pound reacts very one-sidedly to macroeconomic
- Analysis of the trading week of May 9-13 for the EUR/USD pair. COT report. The euro crashed down again.
| Posted: 14 May 2022 06:39 AM PDT
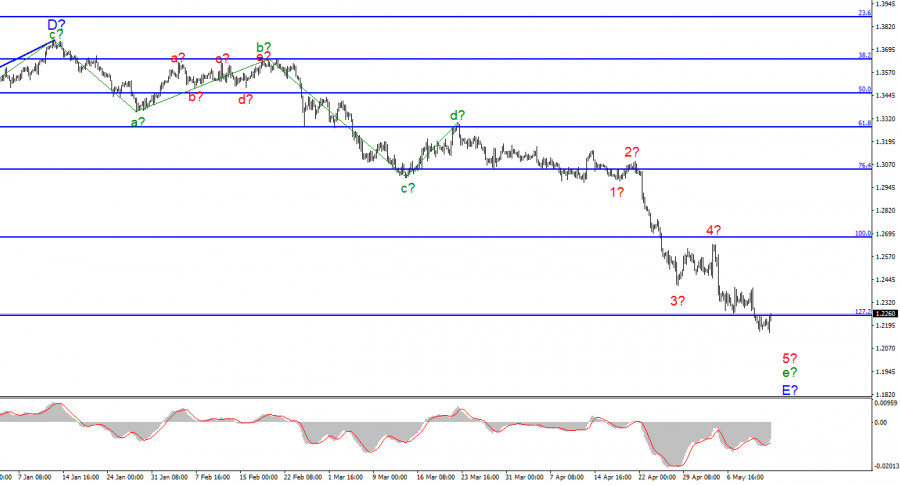
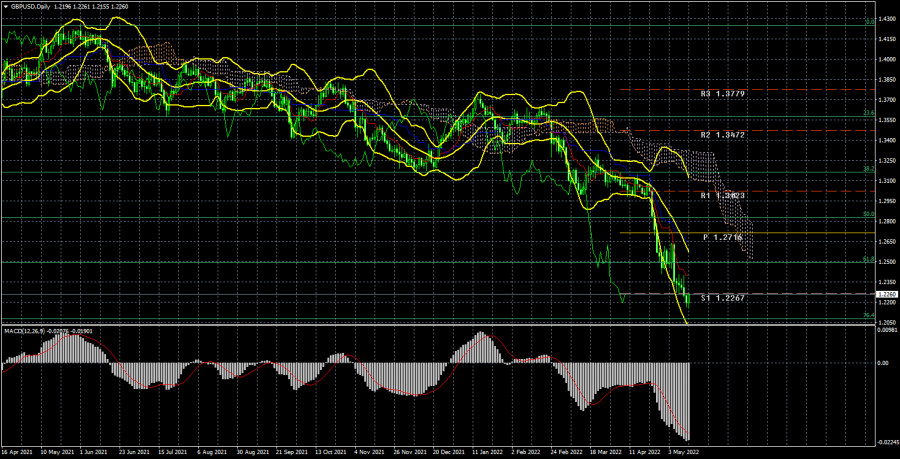
For the pound/dollar instrument, the wave markup continues to look very convincing and does not require adjustments. The downward section of the trend continues its construction within the framework of the wave e-E, and its internal wave marking looks quite complicated. Nevertheless, I have identified five waves inside this wave and, if my markup is correct, then wave 5, the last internal wave, is being built at this time. Thus, we get almost identical wave markings for the British and the European, each of which indicates the possible imminent completion of the downward trend section. Or everyone will have to take a much more complex and extended view, which can be facilitated by a weak news background or a complex geopolitical one. The wave 5-e-E may already be completed, but a successful attempt to break through the 1.2245 mark, which corresponds to 127.2% Fibonacci, indirectly indicates the opposite. However, now this wave can end at any moment, regardless of breakthroughs. If the current wave marking does not become more complicated, then the decline in the British dollar may be completed in the near future. At the moment, however, the market is not making any attempts to do this.The Briton will try to do without new complications of the wave pattern. The exchange rate of the pound/dollar instrument increased by 60 basis points on May 13. The news background on this day was insignificant. All the main economic news came out on Thursday: GDP and industrial production in the UK. And a day earlier - inflation in the United States. Thanks to these reports, the British dollar fell in price by about 150 more basis points. However, the most resonant topic of this week was rumored that the Bank of England may take a break in raising rates. I can't say how much these rumors have affected the mood of the market, but I don't see anything terrible in them. The Bank of England has raised the rate four times in a row, so a pause for 1-2 months looks normal. Now we need to evaluate the results of these increases to then decide on the need for a new tightening of monetary policy. However, the market is not too diligent now to understand all the background of the PEPP or economic data. There is a reason to sell - sell. Such a motto now clearly appeals to most of the market. In contrast to this mood, a wave pattern works, which assumes the completion of the construction of a downward trend section. It is important that the wave patterns of the European and the British now almost completely coincide. You can count on the completion of downward trends for both instruments. Agree, it would be strange if a European started an upward trend, but a Briton did not. Next week, the UK will release a report on unemployment, average wages, inflation, and retail trade. I think the most important thing right now is inflation. Not so long ago, the Bank of England gave a forecast for inflation for 2022 - 10.25%. Forecasts say that by the end of April, inflation will rise to 9%. Thus, the figure of 10.25% does not even look excessively high. The higher the growth, the more likely the Bank of England will refuse to pause in raising the interest rate. And this factor can support the demand for the British currency. General conclusions. The wave pattern of the pound/dollar instrument still assumes the completion of the construction of wave E. Now I also advise selling the instrument with targets located near the 1.1704 mark, which corresponds to 161.8% Fibonacci, since the attempt to break through the 1.2246 mark turned out to be successful. However, the construction of a downward section of the trend is nearing its completion and the mark of 1.2246 looks very good for the trend to end near it. A break of this mark from the bottom up will be a signal to close sales and, possibly, to open small purchases.
At the higher scale, the entire downward trend section looks fully equipped. Therefore, the continuation of the decline of the instrument below the 22nd figure is far from obvious. Wave E has taken a five-wave form and looks quite complete. The material has been provided by InstaForex Company - www.instaforex.com |
| EUR/USD analysis on May 14. The fate of the euro currency will be decided next week. Posted: 14 May 2022 06:39 AM PDT
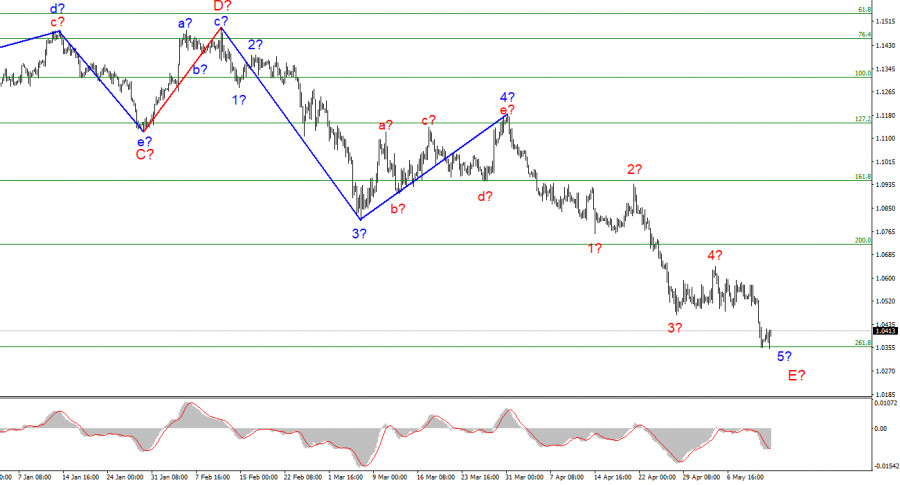
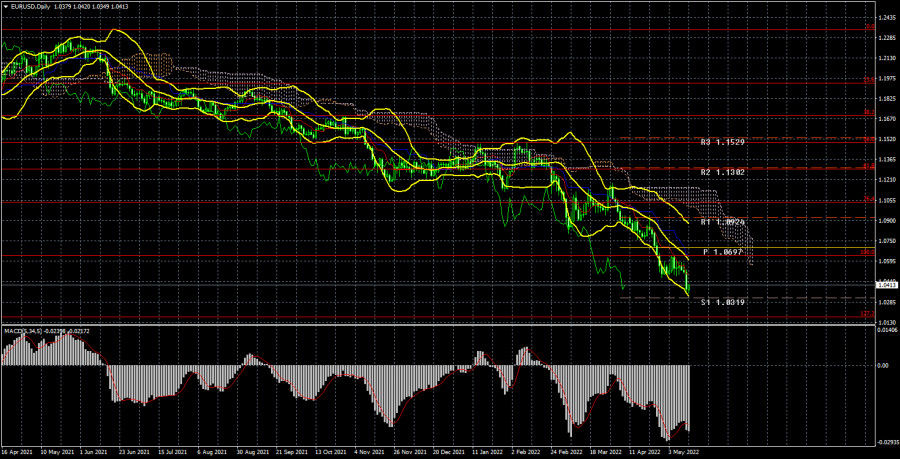
The wave marking of the 4-hour chart for the euro/dollar instrument continues to look convincing and does not require adjustments. The instrument continues the construction of the descending wave 5-E, which is the last in the structure of the descending trend section. If this is true, then the decline in the quotes of the euro currency may end at any moment, since the internal structure of this wave is already five-wave. And an unsuccessful attempt to break through the 1.0355 mark indicates that the market is not ready for new sales. If the attempt to break 1.0355 turns out to be successful after all, then the instrument will further complicate its wave structure and continue to decline with targets located near the zero figure. So far, the wave marking looks like in a textbook, and even its complication (lengthening in the fifth wave or the wave E) will not lead to its scraping. There are no alternative wave markings now. I continue to expect the downward trend to end, but a pronounced bearish market sentiment may lead to an even stronger decline in the instrument. The 1.0355 level is a lifeline for the euro. The euro/dollar instrument rose by 30 basis points on Friday. This increase definitely cannot be considered the beginning of a new upward wave. At the moment, only an unsuccessful attempt to break through the 1.0355 mark, which corresponds to 261.8% Fibonacci, is the hope for the instrument that a new fall will not happen. The internal wave marking of wave 5-E looks very convincing. Therefore, the European currency needs to stay above 1.0355 next week. The news background in the next five working days will be very weak. In the European Union, reports on GDP, and inflation will be released and Christine Lagarde will speak once. However, the GDP report will be released in the second estimate and is unlikely to differ much from the first, which was +0.2%. The inflation report will also be released in the second assessment and its value is unlikely to differ much from 7.5%. I don't expect any surprises and strong data from Europe. Perhaps the geopolitical news will have an impact on the market mood. The situation is heating up in the Baltic region, where Finland and Sweden may apply for NATO membership as early as Monday. It is now known that Turkey opposes this, as it believes that there are representatives of "terrorist organizations" in these countries' Parliaments. However, it may turn out the same as with Hungary, which opposes the introduction of an oil embargo as part of the sixth package of sanctions against Russia. After a few weeks of negotiations - and the issue will be resolved. NATO Secretary-General Jens Stoltenberg has already stated that the applications of Sweden and Finland will be considered quickly and there is no reason for them to be rejected. Russia, in turn, has already refused to supply electricity to Finland and announced that it will strengthen the border with this country. There have also been repeated hints of a military conflict with Finland if it joins NATO. The situation is also heating up around Poland, as it provides the strongest support to Ukraine. In the State Duma of the Russian Federation, words about the "denazification" of Poland have already been heard at the official level. At the same time, Moscow changed its position on Ukraine's accession to the EU. Now the Kremlin is against it. The situation continues to deteriorate and become more complicated. General conclusions. Based on the analysis, I still conclude that the construction of wave 5-E. If so, now is still a good time to sell the European currency with targets located around the 1.0000 mark, which corresponds to 323.6% Fibonacci. But first, you need to wait for confirmation that the descending wave will continue its construction - a successful attempt to break the 1.0355 mark.
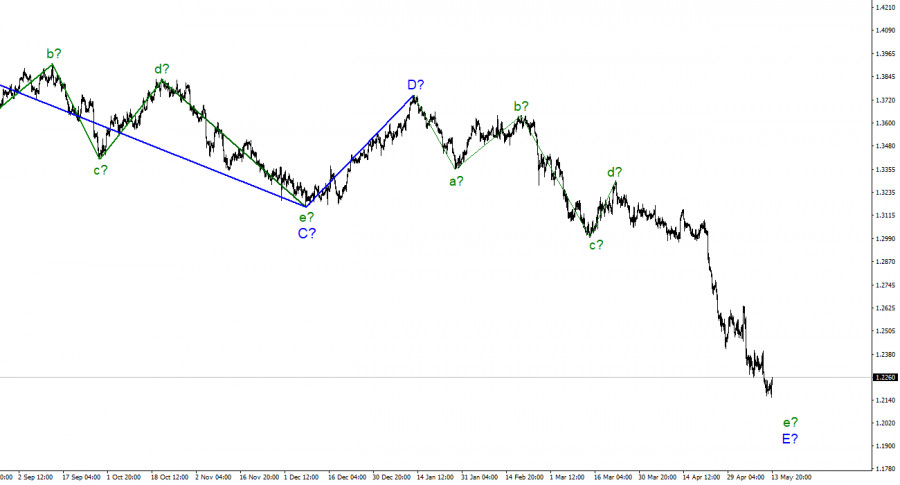
On a larger scale, it can be seen that the construction of the proposed wave D has been completed, and the instrument regularly updates its low. Thus, the fifth wave of a non-pulse downward trend section is being built, which turns out to be as long as wave C. The European currency may still decline for some time. The material has been provided by InstaForex Company - www.instaforex.com |
| Posted: 14 May 2022 12:23 AM PDT Long-term perspective.
The GBP/USD currency pair has fallen by another 80 points during the current week. The almost landslide fall continues. If in normal times even a strong movement in one direction is replaced from time to time by corrections, now a strong movement in one direction only slows down from time to time. This week, the British currency had a formal reason to continue the decline. Reports on GDP and industrial production in the UK were weaker than forecasts. However, these data were released on Thursday, and the pound fell perfectly on Monday, Tuesday, and Wednesday. The question also remains open, why did the US dollar not fall when the US GDP report declared a decline of 1.4%? That is, GDP growth in Britain by 0.8% is not enough, we sell the pound, and a drop of 1.4% in the US is normal, we buy the dollar? As we have already said, the pound sterling now looks excessively oversold. Although the fundamental, geopolitical, and macroeconomic backgrounds have not supported the pound in the past few months, there are simply no new compelling reasons for its fall now. Even the monetary policy of the BA and the Fed is now almost identical. That is, it cannot be said that the pound is falling because the Fed's monetary policy is more "hawkish". The rates are the same, and the QT programs have not yet started. Therefore, we assume that the pound (and the euro, too) are now falling simply by inertia. Market participants see a strong trend and many want to make money from this movement. We believe that this trend will end with a strong rebound of both the euro and the pound up. However, it's hard enough to say when this will happen. You just need to be prepared for this scenario. COT analysis. The latest COT report on the British pound has witnessed a new strengthening of the "bearish" mood among professional traders. During the week, the Non-commercial group closed 4 thousand buy contracts and opened 1.7 thousand sell contracts. Thus, the net position of non-commercial traders decreased by another 5,700. The net position has been falling for 3 months, which is perfectly visualized by the green line of the first indicator in the illustration above. Or the histogram of the second indicator. The Non-commercial group has already opened a total of 109 thousand sales contracts and only 29 thousand purchase contracts. Thus, the difference between these numbers is already fourfold. This means that the mood of professional traders is now "pronounced bearish" and this is another factor that speaks in favor of continuing the fall of the British currency. Note that in the case of the pound sterling, the COT reports data very accurately reflect what is happening in the market. The mood of traders is "strong bearish", and the pound has been falling against the US dollar for a very long time. We do not see specific signals for the end of the downtrend yet, but usually, a strong divergence of the red and green lines of the first indicator signals the imminent end of the trend and the beginning of another. Therefore, the conclusion is that an uptrend may begin in the near future, but it is dangerous to try to catch its beginning at the lowest point. The pound may well fall by another 200-400 points. Analysis of fundamental events. As we have already said, quite important reports were published in Britain this week. However, the report on inflation in the United States was more important, which showed a value of 8.3% y/y in April. This value was higher than the forecast but lower than the value of the previous month. Thus, something neutral turned out. Initially, the dollar fell after this report, but the next day it grew. We believe that it is too early to conclude. For April, the Fed raised the key rate only once, and that's where all its tightening ends. Therefore, if the rate increase led to a 0.2% drop in inflation, then this is not bad. But this slowdown in the consumer price index could also be a simple accident. After all, even on the upward trend of inflation, there may be rollbacks, slowdowns, and pauses. Thus, according to one report, we would not conclude that now inflation will only decrease. This report also gave no reason to expect the Fed to raise the rate at one of the next meetings by 0.75% since formally inflation has decreased. From our point of view, the next report for May will be important, when it will be possible to see the effect of a 0.5% rate increase. Trading plan for the week of May 16-20: 1) The pound/dollar pair continues its unadjusted decline with a target of 1.2080 – 76.4% Fibonacci. There is no sign of the beginning of an upward correction, so we still recommend selling the pair. Most factors no longer give such a strong advantage to the dollar as before, but the mood of traders remains "strongly bearish", so the fall of the pound may continue for some time. 2) The prospects for the British currency remain rather vague and so far there is no reason to buy the pound/dollar pair. We believe that it is simply impractical to buy a pair on such a strong downtrend, no matter how attractive the current levels look. We believe that it will be possible to open long positions only above the Ichimoku cloud, and such price consolidation is unlikely to happen in the near future. Explanations of the illustrations: Price levels of support and resistance (resistance /support), Fibonacci levels - target levels when opening purchases or sales. Take Profit levels can be placed near them. Ichimoku indicators (standard settings), Bollinger Bands (standard settings), MACD (5, 34, 5). Indicator 1 on the COT charts - the net position size of each category of traders. Indicator 2 on the COT charts - the net position size for the "Non-commercial" group. The material has been provided by InstaForex Company - www.instaforex.com |
| Posted: 14 May 2022 12:23 AM PDT Long-term perspective.
The EUR/USD currency pair has not even tried to start an upward correction again this week. This time there was no collapse, but the European currency still fell by 140 points. During this week, there were a lot of different speeches by ECB and Fed officials. Even US President Joe Biden spoke, who also spoke about inflation and the economy. If you try to put together everything you have heard, you will get the following picture. In the USA - no changes. All Fed officials and the US president are confident that inflation remains a key problem for the economy and it needs to be worked with in order to return it to the target level as soon as possible. The Fed made it clear that a 0.5% rate hike in June and July is practically a settled issue. However, all officials note that not all factors affecting the growth of inflation are within the competence of the central bank. In other words, the Fed cannot influence the coronavirus pandemic in China and local lockdowns in any way, cannot end the military conflict in Ukraine overnight so that oil and gas prices stop rising, cannot mend relations between Russia and the West so that sanctions stop destroying the world economy, cannot establish chains deliveries all over the world. Thus, the Fed will try and try to influence the situation by raising the rate and the QT program, but it is far from a fact that these tools will allow inflation to return to 2%. The technical picture of the pair, of course, has not changed this week. What is there to change if the movement, as it was descending, remains so. We haven't seen a single correction or even a hint of a correction for quite some time. At the moment, the euro is racing towards price parity with the dollar at full speed. COT analysis. The latest COT reports on the euro currency raised more questions than they gave answers. The week before last, for the first time in a long time, the COT report showed a "bearish" mood of traders, which is logical, given the strongest drop in the euro in recent months. However, the new COT report again showed an increase in the "bullish" mood! During the reporting week, the number of buy contracts increased by 19.8 thousand, and the number of shorts from the "Non-commercial" group decreased by 3.1 thousand. Thus, the net position increased by 23 thousand contracts per week. This means that the "bearish" mood has changed to "bullish", since the number of buy contracts now exceeds the number of sell contracts for non-commercial traders by 17 thousand. As a result, we again have a paradoxical picture in which major players buy euros more than they sell, but at the same time the European currency falls down almost like a stone. From our point of view, this is because the demand for the US dollar is much higher than the demand for the euro currency. Even if someone suggested that it was all about the weakening of the "bullish" mood in recent months (the second indicator is a histogram), we recall that in the week between May 4 and May 10, professional traders opened 20 thousand purchase contracts, and the euro currency increased by 30 points over the same period. Thus, it is still impossible to make a correlation between COT reports and what is happening in the market. Forecasts to build on such data, moreover, do not make sense. Analysis of fundamental events. During the current week, the most important event was the report on inflation in the United States. However, there was also a speech by Christine Lagarde, to whom increased attention has recently been focused, since after Luis de Guindos's words about a possible increase in the key rate this summer, everyone was waiting for confirmation of these intentions from the head of the ECB. But they didn't wait. With some half-hints, Lagarde said that the rate could be raised a few weeks after the completion of the quantitative stimulus program. But questions about how much the rate will be raised, how many times the regulator is going to raise the rate, remain open. Of course, the ECB has a small margin of safety for the European economy to raise the rate once or twice. Recall that GDP growth in the Eurozone in the fourth quarter was +0.3%, and in the first - + 0.2%. This is the minimum increase, so it is absolutely not necessary to count on 10 rate increases. If the ECB raises the rate once or twice, at what level will it be? After all, first you need to withdraw the deposit rate at least to a positive area. In general, the maximum for the ECB is now 0.5%. Is such a rate capable of stopping the growth of inflation? Trading plan for the week of May 16-20: 1) On the 24-hour timeframe, the pair continues its downward movement and this week almost worked out to the level of 1.0340 - the minimum for the last 20 years. The next target is 1.0171 - the 127.2% Fibonacci level. Almost all factors still speak in favor of the growth of the US dollar, but still we believe that the fall of the euro currency is already too strong (this is just a feeling, not a trading signal). The price is below the Ichimoku cloud, so there is still little chance of growth for the euro currency, and sales remain the most relevant. 2) As for purchases of the euro/dollar pair, it is not recommended to consider them now. There is not a single technical signal that an uptrend may begin. We would consider only overcoming the Senkou Span B line as the basis for a new upward trend. Explanations to the illustrations: Price levels of support and resistance (resistance /support), Fibonacci levels - target levels when opening purchases or sales. Take Profit levels can be placed near them. Ichimoku indicators (standard settings), Bollinger Bands (standard settings), MACD (5, 34, 5). Indicator 1 on the COT charts - the net position size of each category of traders. Indicator 2 on the COT charts - the net position size for the "Non-commercial" group. The material has been provided by InstaForex Company - www.instaforex.com |
| You are subscribed to email updates from Forex analysis review. To stop receiving these emails, you may unsubscribe now. | Email delivery powered by Google |
| Google, 1600 Amphitheatre Parkway, Mountain View, CA 94043, United States | |


Comments