Forex analysis review
Forex analysis review |
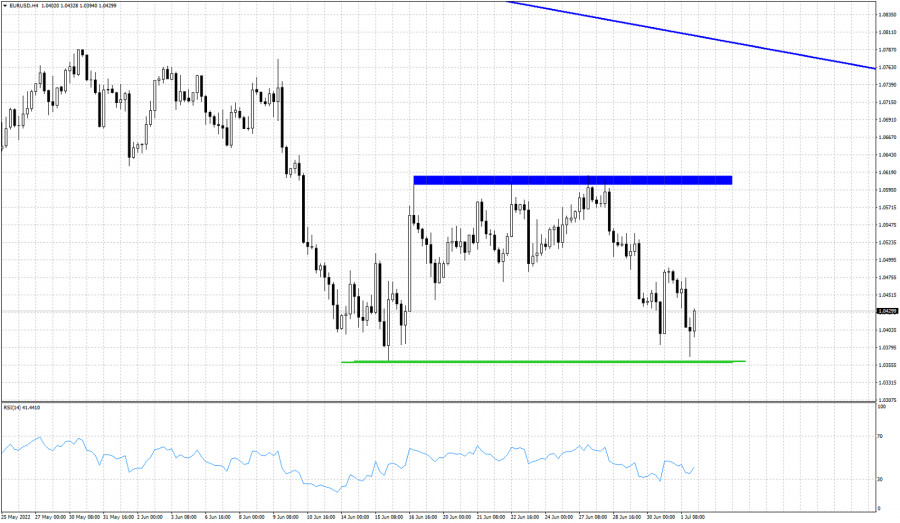
- Double bottom at 1.0367-1.0360.
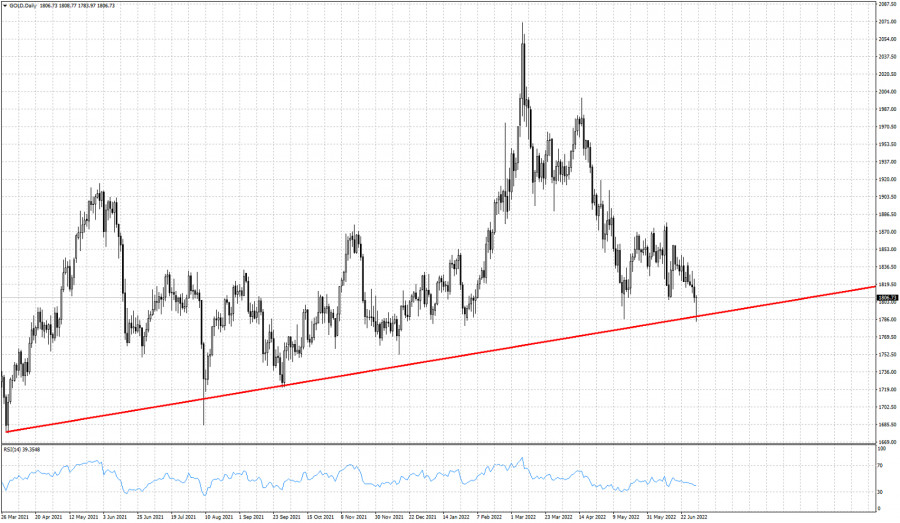
- Gold continues to respect key long-term support trend line at $1,790-$1,800.
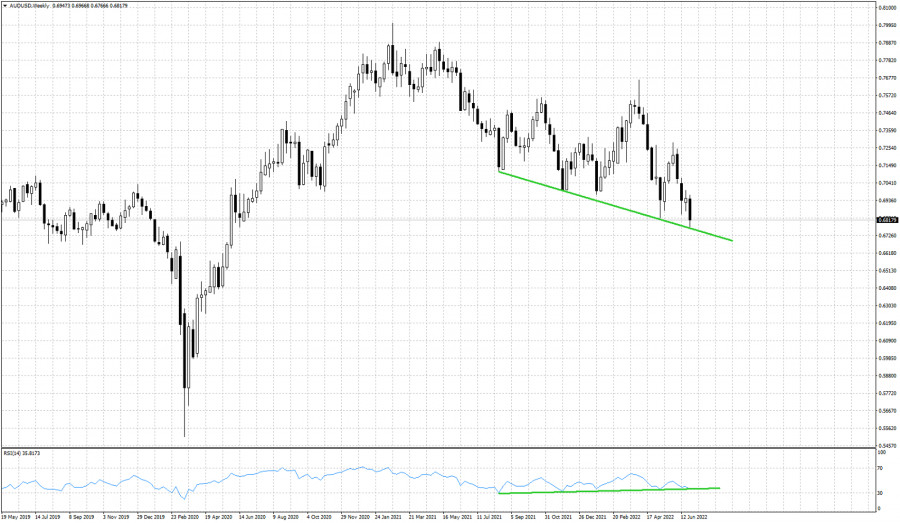
- Weekly bullish RSI divergence in AUSUSD.
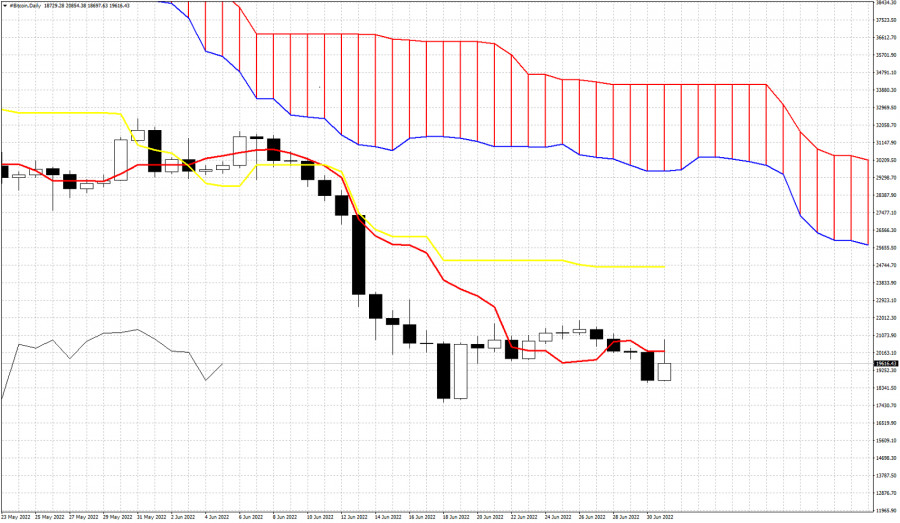
- Ichimoku cloud indicator analysis on Bitcoin for July 1, 2022.
- July 1, 2022 : EUR/USD daily technical review and trading opportunities.
- July 1, 2022 : EUR/USD Intraday technical analysis and trading plan.
- July 1, 2022 : GBP/USD Intraday technical analysis and significant key-levels.
- Technical analysis of EUR/USD for July 01, 2022
- AUD/USD Technical Analysis and Trading Tips for July 1, 2022
- Will Bitcoin raise its head?
- EUR/USD: euro to come under pressure from recession, weak ECB position
- Stock markets close week slightly lower
- Bitcoin investors increase investment potential
- European stocks fall to 2008 lows in past 6 months
- Gold price outlook
- Analysis and forecast for GBP/USD on July 1, 2022
- Saudi Arabia raises oil prices
- Daily Video Analysis: USDCAD, H1 Bullish Bounce Opportunity
- Tips for beginner traders in EUR/USD and GBP/USD on July 1, 2022
- Prices slump despite falling crude oil inventories
- Forex forecast 07/01/2022 GBP/USD, USD/JPY, EUR/JPY, SP500 and Bitcoin from Sebastian Seliga
- Technical analysis recommendations on EUR/USD and GBP/USD for July 1, 2022
- Trading tips for EUR/USD
- Weekly forecast for EUR/USD, USD/JPY, GBP/JPY, USD/CAD, and GOLD from July 1 (simplified wave analysis)
- EUR/USD analysis and forecast for July 1, 2022
| Double bottom at 1.0367-1.0360. Posted: 01 Jul 2022 01:54 PM PDT
Blue rectangle- resistance Green lines- support EURUSD is trading around 1.0427 after making a lower low at 1.0367. EURUSD remains vulnerable to more downside as price continues making lower lows and lower highs. Resistance remains key at 1.06-1.0620 and as long as we trade below this level, we expect trend to remain bearish. Price is bouncing off the horizontal support shown in the chart above with the green horizontal lines. Failure to stay above 1.0360 will be a bearish sign and will most probably lead EURUSD below 1.03. Short-term RSI bullish divergence justifies a bounce at the beginning of next week towards 1.05. The material has been provided by InstaForex Company - www.instaforex.com |
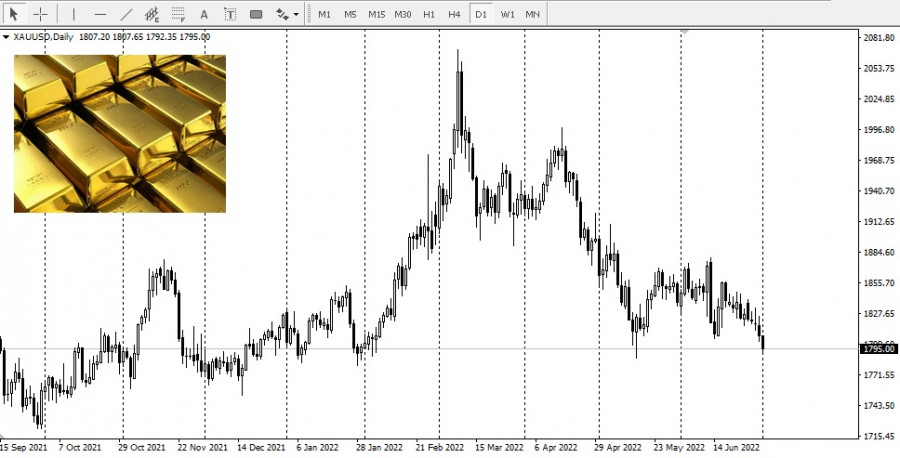
| Gold continues to respect key long-term support trend line at $1,790-$1,800. Posted: 01 Jul 2022 01:48 PM PDT
Red line -support trend line Gold price broke below $1,800 today but near the end of the sessions bulls have managed to push prices back towards the daily highs and above the key long-term support trend line. Next week will be very important for short-term trend of Gold. Gold is bouncing after touching the major support trend line. Will a new upward move start or is this bounce just a short-term relief bounce? A daily close below $1,795 would be a new bearish signal. Until then bulls continue to have hopes. The material has been provided by InstaForex Company - www.instaforex.com |
| Weekly bullish RSI divergence in AUSUSD. Posted: 01 Jul 2022 01:45 PM PDT
Green lines -bullish RSI divergence AUDUSD trend remains bearish as price continues making lower lows and lower highs. Price this week made a new weekly lower low at 0.6766 relative to the 0.6832 previous low. The RSI however did not make a lower low. The RSI provided another higher low. This is the fourth time this happens. As we said many times before, a divergence is not a reversal signal but only a warning. A short-term bounce is justified like in the previous times price made a new lower low and the RSI did not follow. The weekly down trend is weakening. Bears need to be cautious as a major reversal can start any minute. The material has been provided by InstaForex Company - www.instaforex.com |
| Ichimoku cloud indicator analysis on Bitcoin for July 1, 2022. Posted: 01 Jul 2022 01:40 PM PDT
Bitcoin remains in a bearish trend according to the Ichimoku cloud indicator. Price is well below the Kumo (cloud) and remains vulnerable to more downside, as long as price is trading below the tenkan-sen (Red line indicator) and the kijun-sen (yellow line indicator). The most important short-term resistance is at the lower cloud boundary at $29,650. As long as price is below this level, trend is bearish. Short-term resistance is found by the kijun-sen at $24,662. As long as price is below this level, short-term trend is bearish is Bitcoin is expected to continue making lower lows in the near term. The Chikou span (black line indicator) is also below the candlestick pattern confirming trend is bearish. The material has been provided by InstaForex Company - www.instaforex.com |
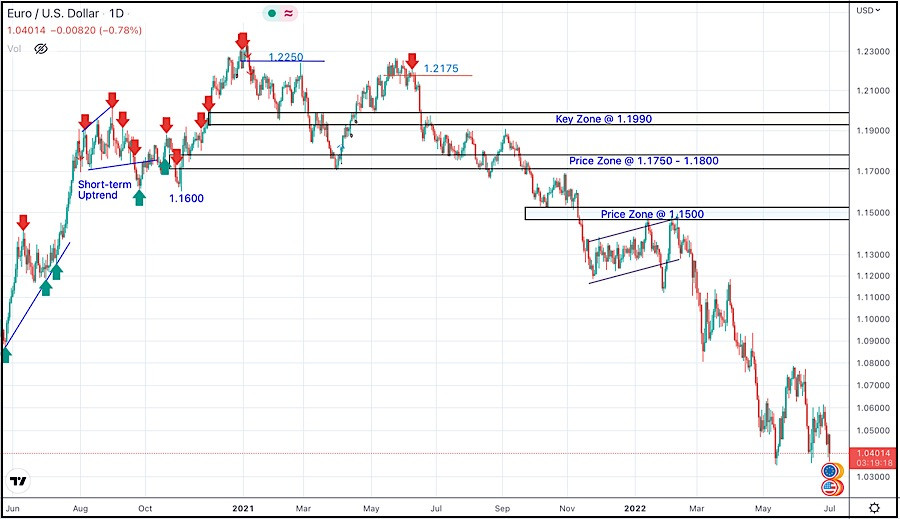
| July 1, 2022 : EUR/USD daily technical review and trading opportunities. Posted: 01 Jul 2022 10:49 AM PDT
In late September, Re-closure below the price level of 1.1700 has initiated downside-movement towards 1.1500 where some recovery was witnessed. Shortly after, Price levels around 1.1700 managed to hold prices for a short period of time before another price decline took place towards 1.1200. Then the EURUSD has temporarily moved-up within the depicted movement channel until downside breakout occurred recently. Since then, the price zone around 1.1500 has applied significant SELLING pressure when a valid SELL Entry was offered upon the previous ascending movement towards it. Shortly after, the EURUSD looked oversold while approaching the price levels of 1.0800 few weeks ago. That's where the recent upside movement was previously initiated. However, the recent movement towards 1.1200 was considered for another SELL Trade which already reached its targets. Any ascending movement towards 1.0800 should be watched for selling pressure and a possible SELL entry. The material has been provided by InstaForex Company - www.instaforex.com |
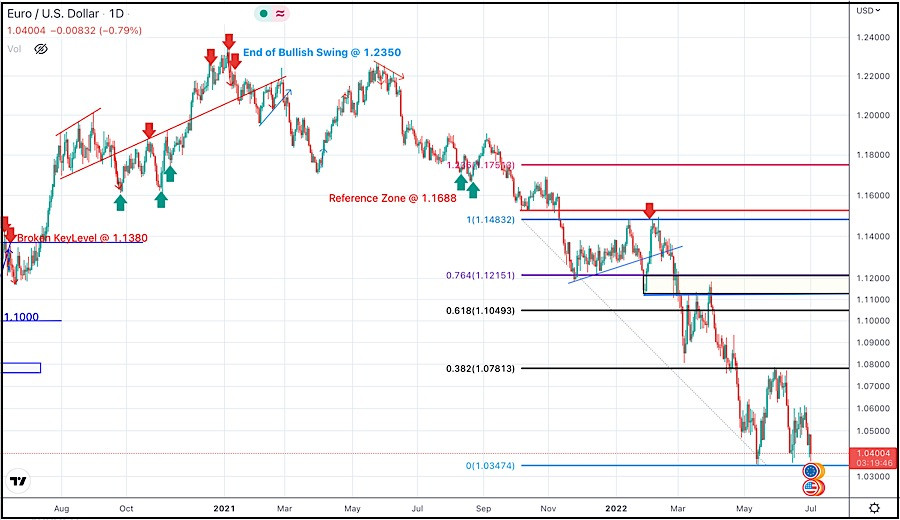
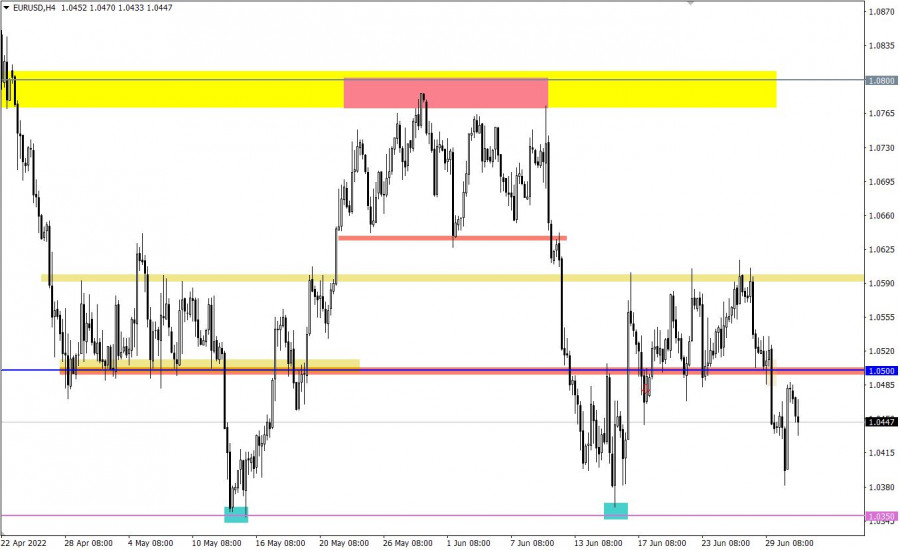
| July 1, 2022 : EUR/USD Intraday technical analysis and trading plan. Posted: 01 Jul 2022 10:47 AM PDT
The EURUSD looked oversold while approaching the price levels of 1.0800. That's when a temporary upside movement was approaching the price levels around 1.1200. This recent movement towards 1.1200 was suggested for another SELL opportunity which already reached its targets beyond the price level of 1.0400. The previous ascending movement above 1.0600 enabled further advancement towards 1.0800 where evident bearish rejection arises again. Currently, the EURUSD pair remains trapped between 1.0350 (the newly recorded Low) and 1.0750 which corresponds to the nearest existing SUPPLY level. On the other hand, the pair remains trapped under selling pressure to challenge the recent daily low around 1.0350 until breakout occurs. The material has been provided by InstaForex Company - www.instaforex.com |
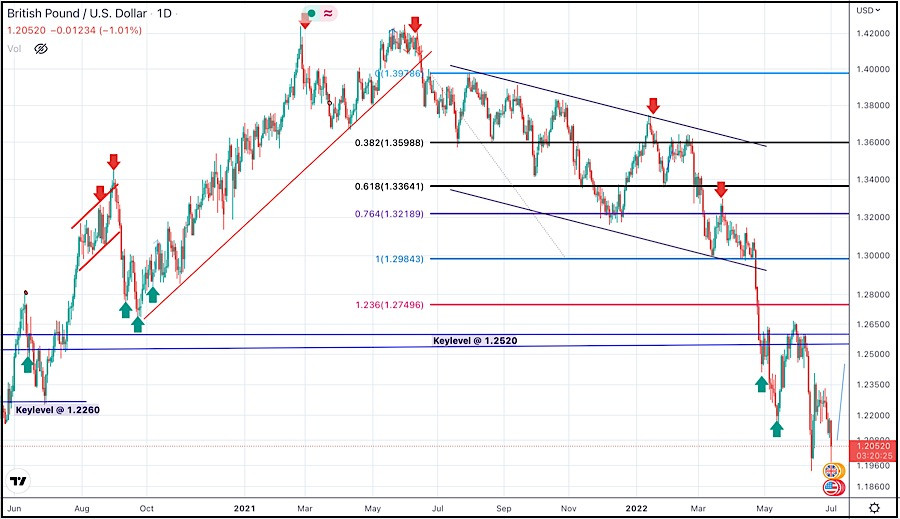
| July 1, 2022 : GBP/USD Intraday technical analysis and significant key-levels. Posted: 01 Jul 2022 10:46 AM PDT
Recently, the GBP/USD pair remained under bearish pressure to challenge the new low around 1.2150 again which was temporarily bypassed few days go. Immediate bullish rejection was expressed around 1.1950 bringing the pair back above 1.2150 again towards higher price levels. Bullish persistence above 1.2300 (when achieved) will probably enable further bullish continuation towards 1.2550 and probably 1.2650 where further decisions can be taken. On the other hand, another bearish visits may be expected to challenge the price level of 1.1950 again if sufficient bearish momentum is expressed. Significant bullish recovery has been witnessed during the recent bearish dip that took place earlier Today. This enhances the bullish scenario towards 1.2520 The material has been provided by InstaForex Company - www.instaforex.com |
| Technical analysis of EUR/USD for July 01, 2022 Posted: 01 Jul 2022 07:01 AM PDT
After finding bids reach to the price of 1.0406, the EUR/USD pair recovered below the levels of 1.0472 and 1.0438. Initial resistance lies near the 1.0472 level (38.2% of Fibonacci retracement levels). A decent breakout and follow-down move below 1.0472 could open the gate for a push towards the 1.0383 level. The main resistance remains near the area of1.0472 and 1.0438. Also it should be noted that the EUR/USD pair and some currencies unite as the bears lose their momentum. The market is indicating a bearish opportunity below the above-mentioned resistance levels, for that the bullish outlook remains the same as long as the 100 EMA is headed to the downside. the EUR/USD pair continues to move downwards from the level of 1.0438. Yesterday, the pair dropped from the level of 1.0438 to the bottom around 1.0383. Today, the first resistance level is seen at 1.0438 followed by 1.0472 (the weekly pivot point), while daily support 1 is found at 1.0383. Also, the level of 1.0472 represents a weekly pivot point for that it is acting as major resistance/support this week. Amid the previous events, the pair is still in a downtrend, because the EUR/USD pair is trading in a bearish trend from the new resistance line of 1.0438 towards the first support level at 1.0383 in order to test it. If the pair succeeds to pass through the level of 1.0383, the market will indicate a bearish opportunity below the level of 1.0383. Therefore, there is a possibility that the EUR/USD pair will move downside and the structure of a fall does not look corrective. In order to indicate the bearish opportunity below 1.0383, re-sell below 1.0383 with the second target at 1.0360 in order to test last week's bottom. However, if a breakout happens at the resistance level of 1.0472, then this scenario may be invalidated. The material has been provided by InstaForex Company - www.instaforex.com |
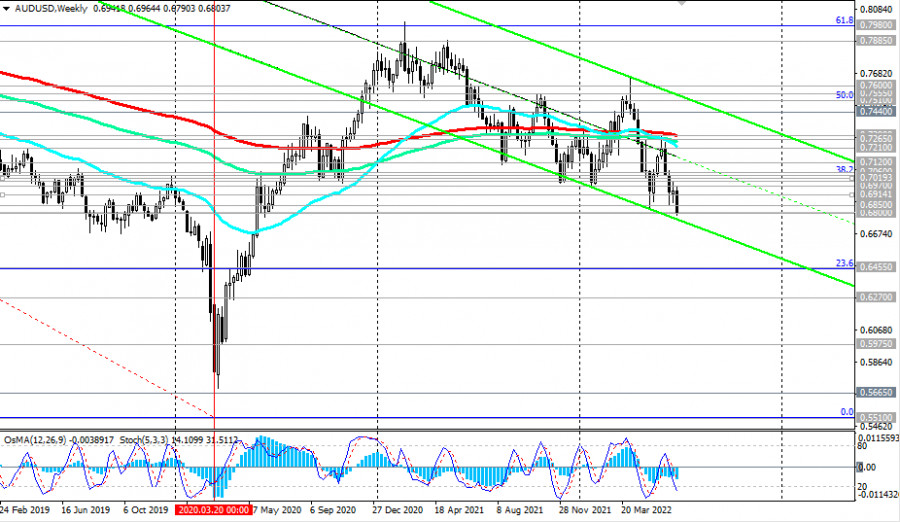
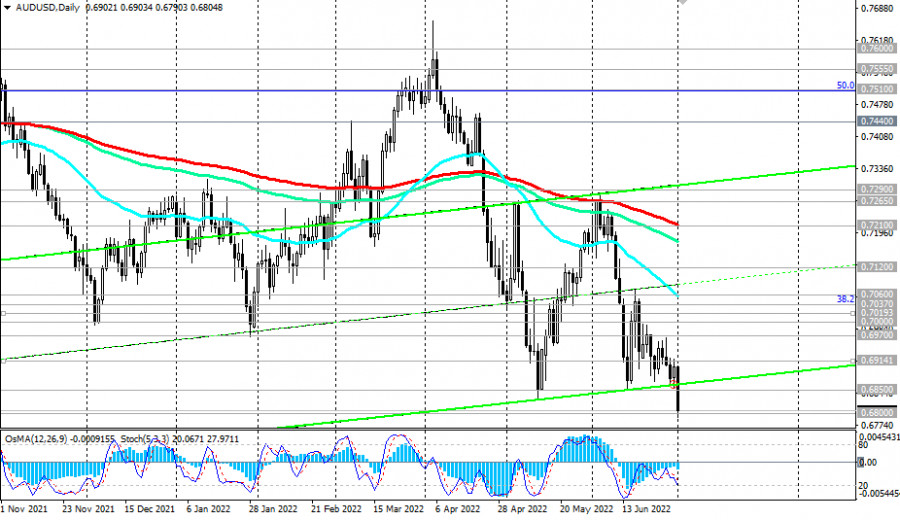
| AUD/USD Technical Analysis and Trading Tips for July 1, 2022 Posted: 01 Jul 2022 06:50 AM PDT
At the beginning of today's European trading session, AUD/USD reached a new local and 25-month low of 0.6790. The main driver of the decline in AUD/USD is the Fed's monetary policy, the most stringent (at the moment) in comparison with other major world central banks.
AUD/USD continues to decline towards the lower border of the descending channel on the daily chart, which is currently passing near the 0.6700 mark. In view of the Fed's tendency to pursue a tighter monetary policy, in anticipation of further strengthening of the US dollar and given the average daily volatility of AUD/USD 60-70 points, most likely, the target of 0.6700 can be reached within the next 1-2 trading days, especially if the RBA disappoints the markets at its July 5 meeting.
As we noted in our previous review dated 06/21/2022, a breakdown of local support levels 0.6850, and 0.6800 will confirm our assumption, and AUD/USD will head towards multi-year lows reached in March 2020 near 0.5665, 0.5510 with intermediate targets at support levels 0.6500, 0.6455 (23.6% Fibonacci retracement to the pair's decline from 0.9500 in July 2014 to 2020 lows near 0.5510), 0.6270, 0.5975. The continued positive upward trend in US 10-year bond yields makes the dollar an attractive asset to invest in, given the prospects for further tightening of the Fed's monetary policy. The dollar is also actively used as a defensive asset, winning over traditional defensive assets such as gold, franc, and yen.
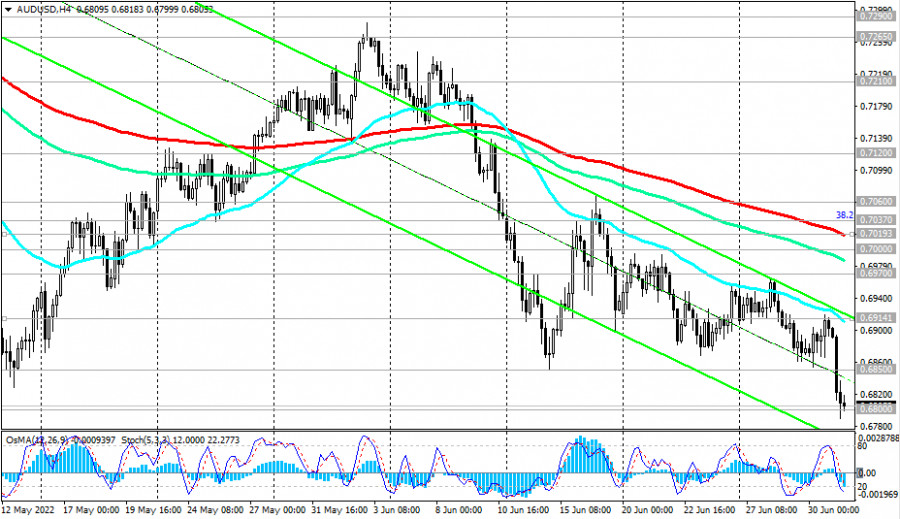
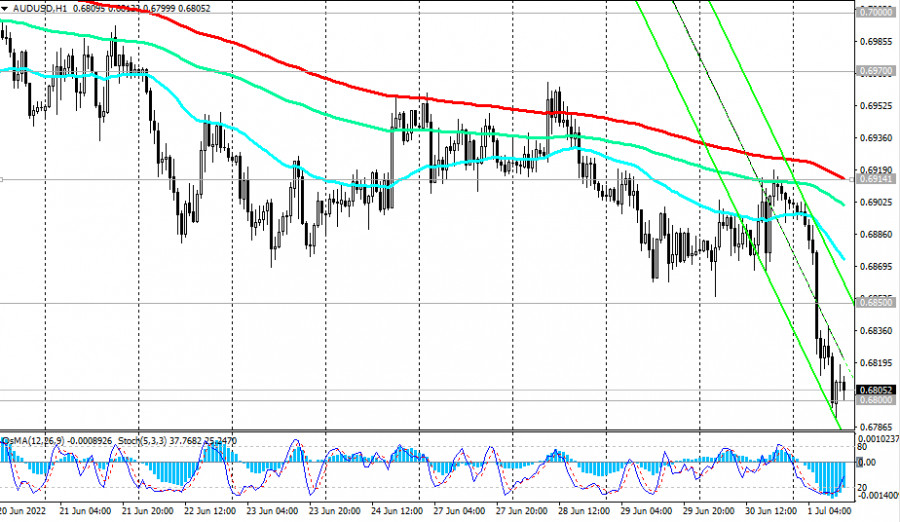
In an alternative scenario, AUD/USD will attempt a correction from the reached support level of 0.6800. In this case, the first signal to open long, for short-term positions, will be a breakdown of the local resistance level of 0.6850, and a confirming one is at a breakdown of the short-term resistance level of 0.6914 (200 EMA on the 4-hour chart). In this case, the upward correction may continue up to the resistance levels of 0.7000, 0.7019 (200 EMA on the 4-hour chart). Below the key resistance levels 0.7210 (200 EMA on the daily chart), 0.7290 (200 EMA on the weekly chart, 50 EMA on the monthly chart), AUD/USD remains in the zone of a long-term bearish market. Only a breakdown of the resistance level of 0.7600 (200 EMA on the monthly chart) will bring AUD/USD into the zone of a long-term bull market. Support levels: 0.6800, 0.6700, 0.6500, 0.6455, 0.6270, 0.5975, 0.5665, 0.5510 Resistance levels: 0.6850, 0.6900, 0.6914, 0.6970, 0.7000, 0.7019, 0.7037, 0.7060, 0.7120, 0.7210, 0.7265, 0.7290 Trading Tips Sell Stop 0.6780. Stop-Loss 0.6860. Take-Profit 0.6700, 0.6500, 0.6455, 0.6270, 0.5975, 0.5665, 0.5510 Buy Stop 0.6860. Stop-Loss 0.6780. Take-Profit 0.6900, 0.6914, 0.6970, 0.7000, 0.7019, 0.7037, 0.7060, 0.7120, 0.7210, 0.7265, 0.7290 The material has been provided by InstaForex Company - www.instaforex.com |
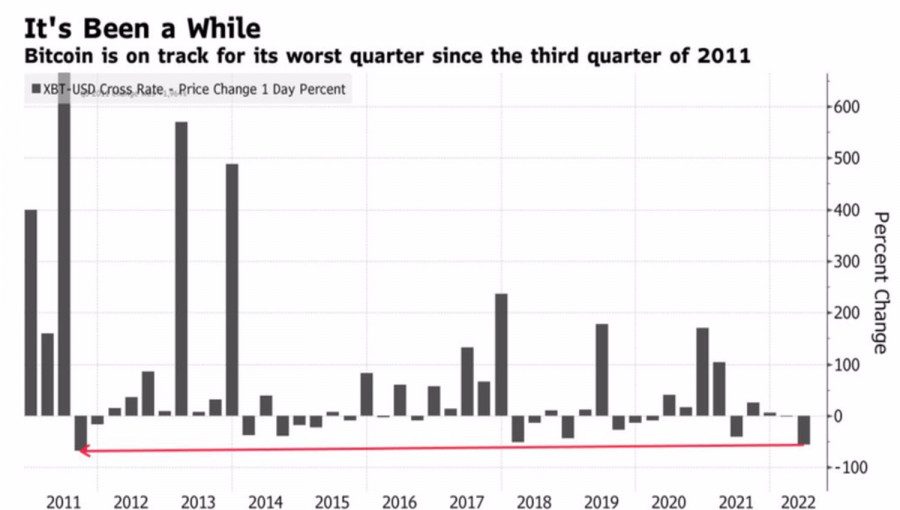
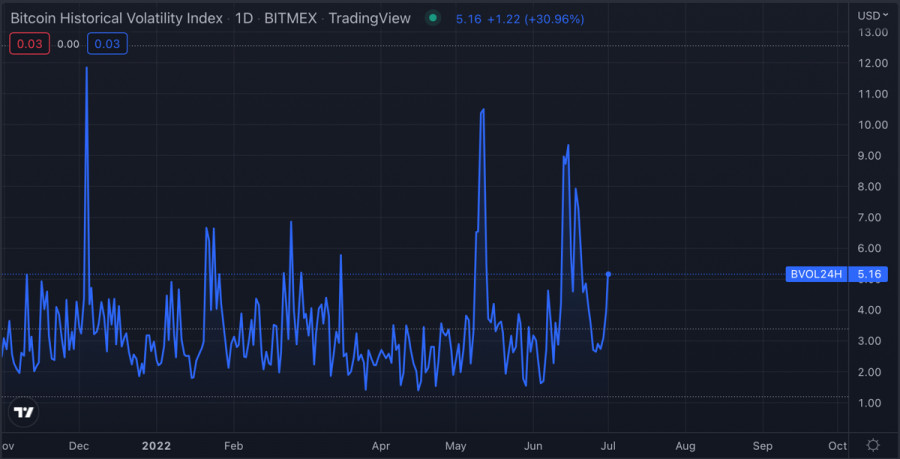
| Posted: 01 Jul 2022 06:30 AM PDT The worst quarter since 2011, the worst month since Bloomberg began tracking bitcoin in 2010. In June, the cryptocurrency leader lost 41% of its value, and in April-June at 58%. The numbers are colossal, but if you remember the high correlation of the token with the US stock market and the saddest first half of the year since 1970 for American stock indices, you can calm down a bit and take a breath. The most important thing is that Bitcoin survived, and there, you see, we will wait for recovery. Quarterly dynamics of BTCUSD
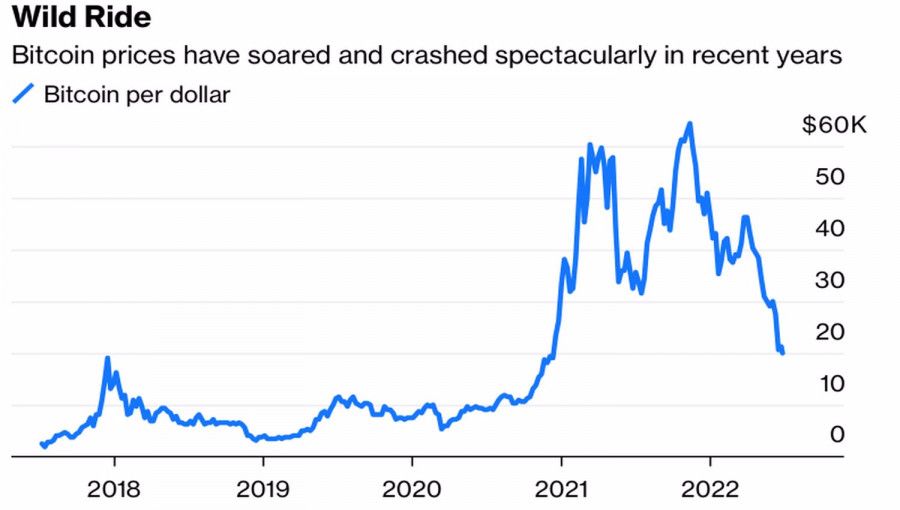
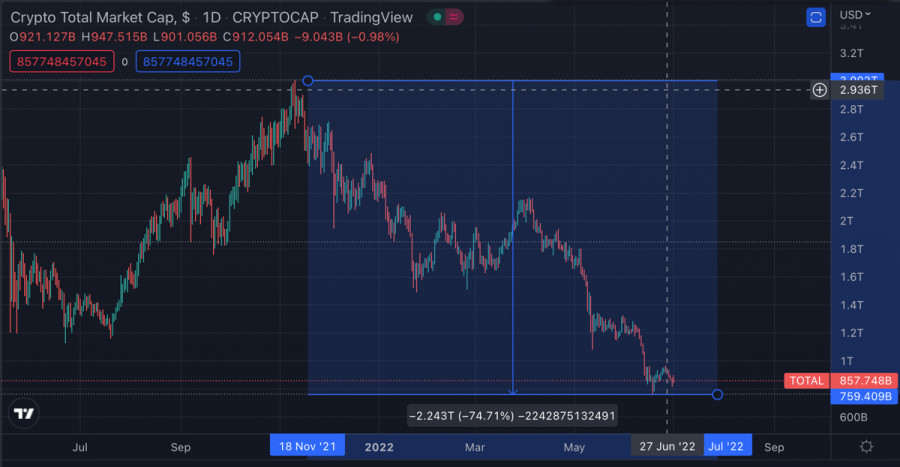
I have repeatedly emphasized that the main reason for the gigantic decline in the capitalization of cryptocurrencies from $3 trillion in November to less than $900 billion was the Fed's change of mind. The central bank began to move away from monetary stimulus, which saved the US economy from recession and allowed stock indices to reach historic highs. As a result, the S&P 500 fell into a bear market territory, and BTCUSD quotes fell to their lowest levels since December 2020. The fall of the token was facilitated by a number of negative news in the field of the crypto industry. The collapse of the stablecoin TerraUSD, the suspension of accepting funds by the lender Celsius Network, the insolvency of the cryptocurrency hedge fund Three Arrows Capital, the refusal of the US Securities and Exchange Commission to convert Grayscale Bitcoin Trust to an exchange-traded fund, and other negative things worsened the mood of bitcoin fans. Large players are leaving the market, and the crowd is following them. At the same time, history shows that you should not sprinkle ashes on your head. Five times, in 1932, 1939, 1940, 1962, and 1970, the S&P 500 fell 15% or less in the first half of the year, but regained ground in the second half, rising by an average of 24% by the end of the year. Just like then, investor pessimism was on the rise. Now, 72% of Deutsche Bank respondents expect a further fall in the stock index, and 90% believe a recession in the US economy until 2023. At present, against the backdrop of an impending downturn, a V-shaped recovery in the stock market looks unlikely, but if the Fed starts to put on the brakes, it will not bring the federal funds rate to the 3.5% expected by CME derivatives, the situation will change radically. No one knows what the growth of bitcoin will be. If after a 50% drop from April and July 2021, prices quickly recovered to a new peak, then after the collapse that started in December 2017, the token took more than two years to return to stable growth. Bitcoin dynamics
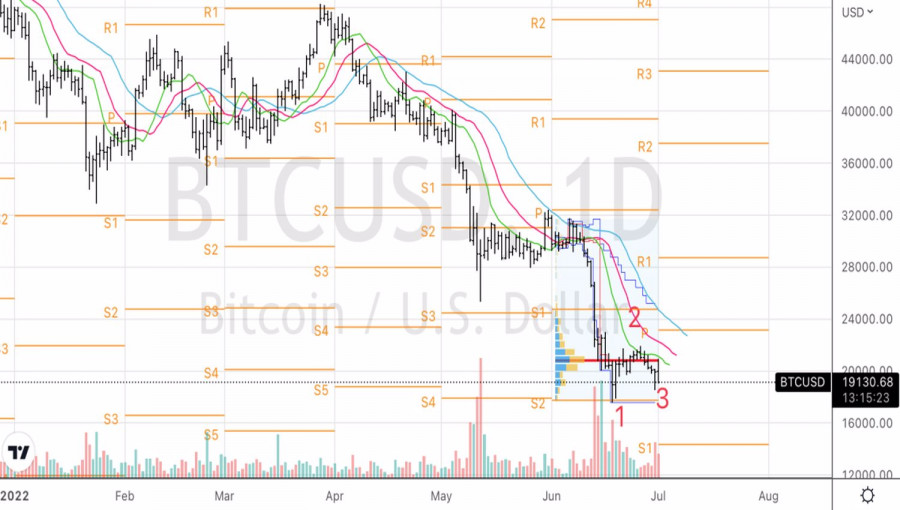
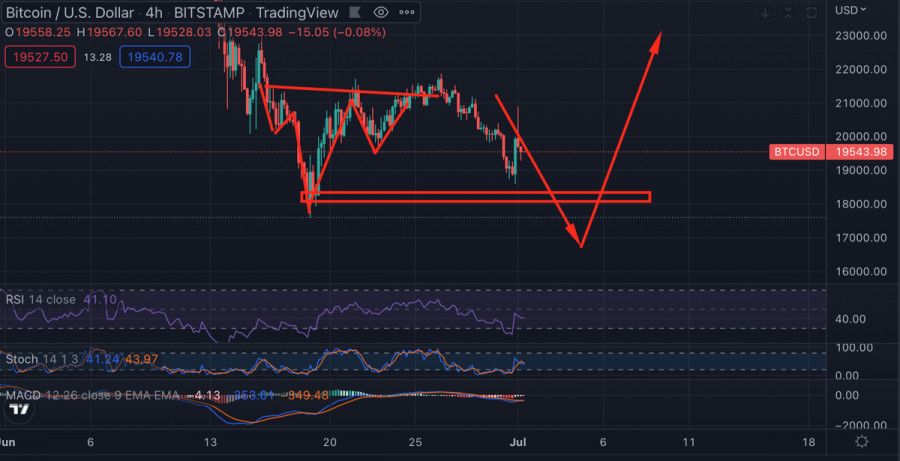
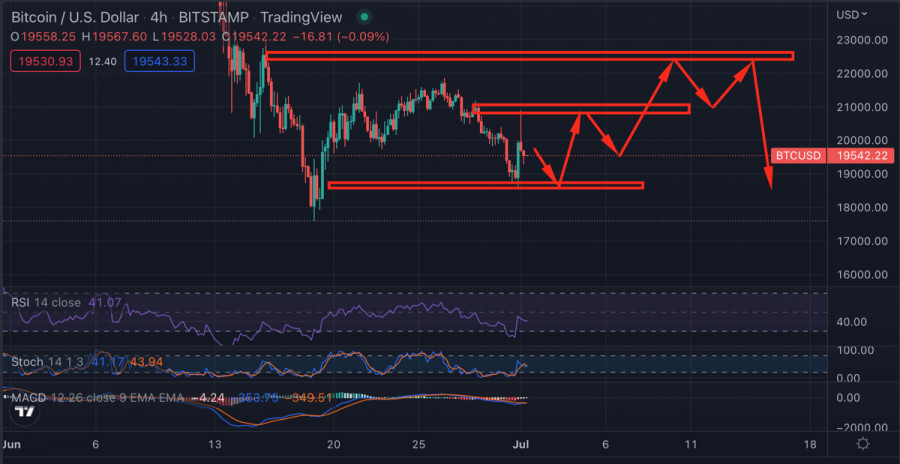
Even though pessimism currently prevails and goes off scale, optimists have not disappeared from the market either. Deutsche Bank expects BTCUSD to rally towards 28,000 by the end of 2022 as the US stock market gradually recovers. Fundstrat considers bitcoin to be a cyclical asset that bottoms out every 90 weeks. If so, then the bottom is not far off. Technically, a 1-2-3 reversal pattern can be formed on the BTCUSD daily chart. In this regard, breaks of fair value at 20,800 and local peak at 22,000 can be used for purchases. The material has been provided by InstaForex Company - www.instaforex.com |
| EUR/USD: euro to come under pressure from recession, weak ECB position Posted: 01 Jul 2022 05:25 AM PDT
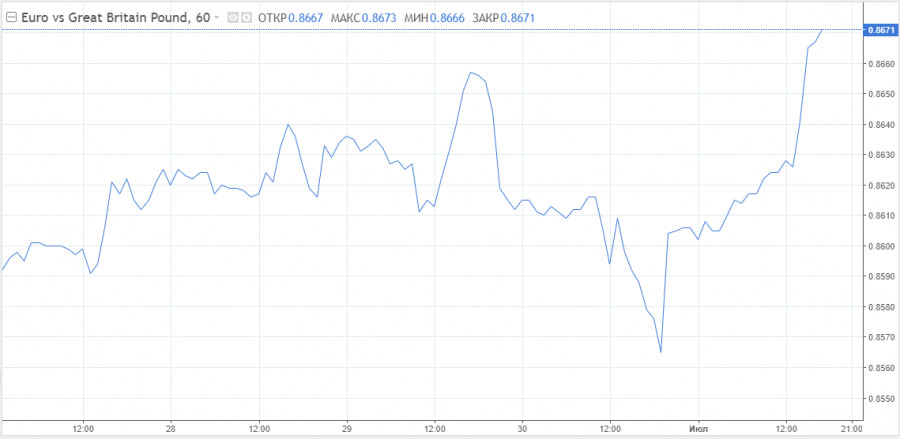
This week, policymakers from the European Central Bank, the Bank of England, and the Federal Reserve met at the ECB Forum on Central Banking in Sintra, Portugal to discuss monetary policy scenarios. Statements by heads of US, EU, and UK central banks signalled their plans on interest rates. According to these statements, neither Christine Lagarde nor Andrew Bailey will be able to match the hawkish position of Jerome Powell in the near future. Out of all central banks, the Fed came closest to meeting current market expectations. Key statements "We're strongly committed to using our tools to get inflation to come down. The way to do that is to slow down growth, ideally keeping it positive," Jerome Powell said. "Is there a risk that would go too far? Certainly, there's a risk. I wouldn't agree that it's the biggest risk to the economy. The bigger mistake to make ... would be to fail to restore price stability.", he added.The Fed chairman explained the regulator's plans while saying nothing that could boost the market's rate hike expectations. Instead, Powell implied that the interest rate outlook would depend on inflation trajectory in the upcoming months. Current market expectations on interest rates have peaked. If inflation slows down, the Fed could put its monetary tightening cycle on hold. Christine Lagarde confirmed that the ECB plans to increase interest rates in July and September. Furthermore, the ECB President repeatedly underlined the regulator's focus on "gradualism and optionality" - the European Central Bank is ready to adjust its policy, if necessary. "I think markets have full understanding and appreciation of what we're doing," she added. Similar to Jerome Powell, Christine Lagarde did not say anything that would increase interest rate hike expectations in the market. The interest rate will likely rise to 1% from -0.50% by the end of this year. In addition, Lagarde did not provide any detailed information about the ECB's long-anticipated measures aimed at warding off instability in Southern European government bond markets. "I think that this risk of fragmentation that is much talked about is something inherent to the European construction and the fact that we have 19 member states that each have respective fiscal policies and financial markets and as a result of that, our unique monetary policy has to be transmitted throughout this imperfect market of ours," Lagarde stated. Earlier, Bank of America noted that the ECB has not developed a policy tool for achieving this goal. "We are being hit by a very large national real income shock, which is coming from outside. The scale of the shock is very substantial and in and of itself it will have an effect, a big effect, because it will reduce domestic demand, and it will pass through into the labor market, and it will pass through into inflation," Andrew Bailey, the governor of the Bank of England, said. "Monetary policy has, of course, a very important role to play because it will act alongside that shock," Bailey added, stating that the BoE would address the shock's impact, as stated in June. "The message that we gave and was in the language of our last meeting was that if we see greater persistence of inflation... then we will act more forcefully," the BoE's governor concluded. The overnight index swap market has priced in a high possibility of the BoE increasing interest rates to 2.75% or more by the end of the year from 1.25%. The BoE's Market Participants Survey expects interest rates to rise to only 2%. Currency outlook Market players are already bearish on the pound sterling. Over the past several months, the FX market braced for an economic slowdown in the UK. However, the predicted recession in the winter of 2022 could have an ever greater impact on the euro. Analysts note that pessimism in the market regarding the British economy and GBP has potentially peaked, making the euro more vulnerable if eurozone growth outlooks are reduced. Barclays has slashed its eurozone GDP outlook for 2023, warning that European countries could enter a technical recession by the end of 2022. Meanwhile, economists at Berenberg Bank say M1 money supply in the eurozone is now flashing red. "Over the past 30 years, no chart or model has served us better to predict Eurozone growth than a look at money. Real M1 money supply often heralds major turning points in the business cycle some two to three quarters in advance. Unfortunately, the message of the chart is clear: judging by the real value of the highly liquid balances of households and non-financial companies, the Eurozone is heading for a downturn," Holger Schmieding, chief economist at Berenberg said. A recession at the beginning of 2023 would mean the ECB has a very limited window in which to raise interest rates in an effort to bring inflation down. Falling rate hike expectations would in turn mechanically weigh on the euro. If market players continue to downgrade eurozone's growth expectations, it would push down the euro against both the US dollar and the pound sterling. According to UBS, EUR/GBP is expected to reach 0.8500 by the end of the year.
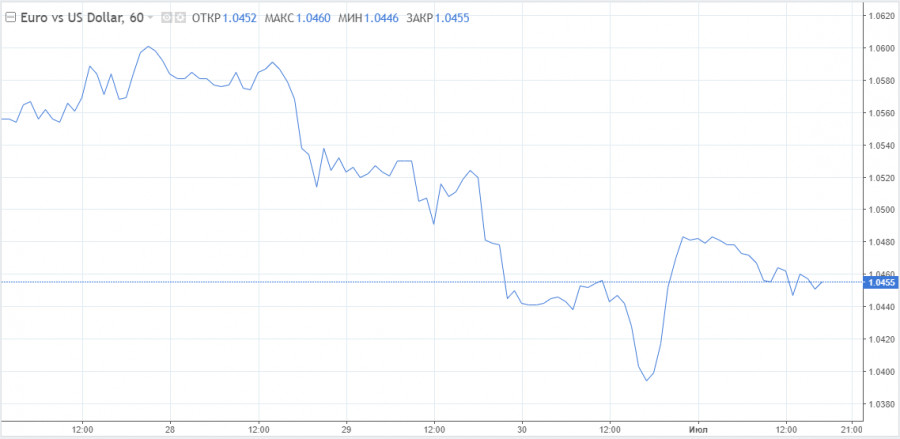
EUR/USD would likely resume its downward movement after its brief correction. It would encounter initial resistance at 1.0470. Bullish traders would likely not act until the pair breaks below this level. The pair's intermediate support can be found at 1.0440, right before the psychological level of 1.0400 and the static level of 1.0380. Bearish traders currently hold the initiative. The areas above 1.0470, 1.0500, and 1.0520 can be regarded as next technical obstacles for GBP/USD.
|
| Stock markets close week slightly lower Posted: 01 Jul 2022 05:24 AM PDT
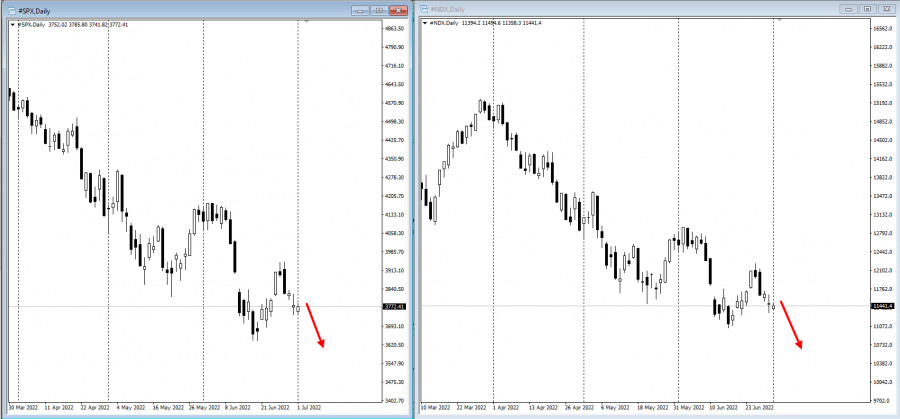
The S&P 500 and Nasdaq 100 slipped even lower after the S&P 500 suffered a heavy fall in the first half of the year. Such a decline has not been seen in more than 50 years. The yield on 10-year US Treasuries fell below 3%, to its lowest since early June.
European stock indices are tumbling following the US ones. There is a chance that they will hit this year's lows. Meanwhile, European equities traded slightly higher, with retail, utilities and real estate outperforming. German government bond yields rose briefly after Euro zone inflation data hit another record high.
On Friday, sellers were focused on risky assets as fears of recession trumped fears of soaring inflation. With Federal Reserve policymakers determined to return price growth to the 2% target, investors are assessing the blow to the economy from a sharp rate hike. "Inflation is the key focus of central bankers; investors losing money is way down their list of concerns," Chris Iggo, chief investment officer at AXA IM Core, wrote in a note to clients. "Interest rate and inflation markets are taking the view that what is priced in terms of monetary tightening will be enough to bring inflation down, but in order for that to happen, there also needs to be a cost to growth." Both stocks and bonds were rocked by outflows this week as investors fear the global economy could contract amid sky-high inflation and hawkish central banks. About $5.8 billion exited global equity funds in the week through June 29, BofA said, citing EPFR Global data. Bonds had redemptions of $17 billion. Global companies have pulled more debt sales in the past six months than in all of 2020. More than 70 deals have been postponed or canceled so far in 2022, according to data compiled by Bloomberg. What to watch this week: US construction spending, ISM Manufacturing, Friday The material has been provided by InstaForex Company - www.instaforex.com |
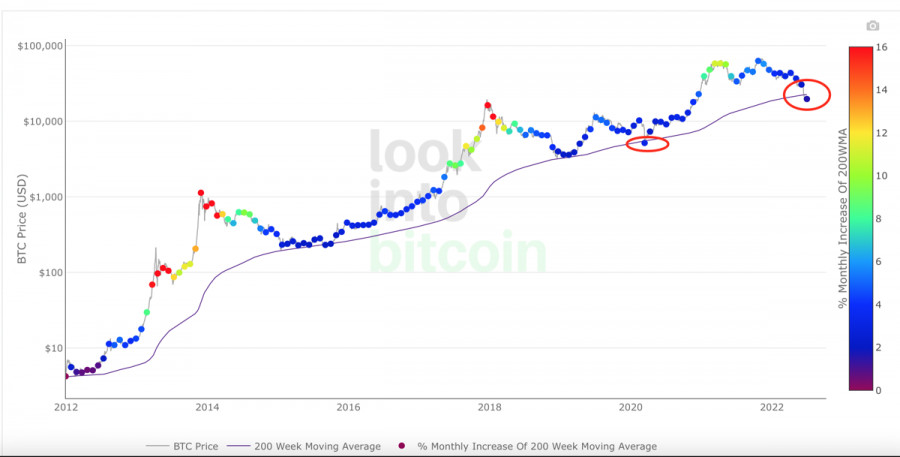
| Bitcoin investors increase investment potential Posted: 01 Jul 2022 05:18 AM PDT Bitcoin has posted its worst financial quarter in 10 years. The price hit a new swing low of $17,700 and continues to be under pressure from sellers. Market sentiment remains pessimistic, although a significant part of the market players has adapted to the new conditions and are preparing to resume investment activity. The relative stability of Bitcoin this week contributes to this. The Fed Chairman's speech once again confirmed Bitcoin's stability, which may indicate that the phase of the most powerful bearish market is over.
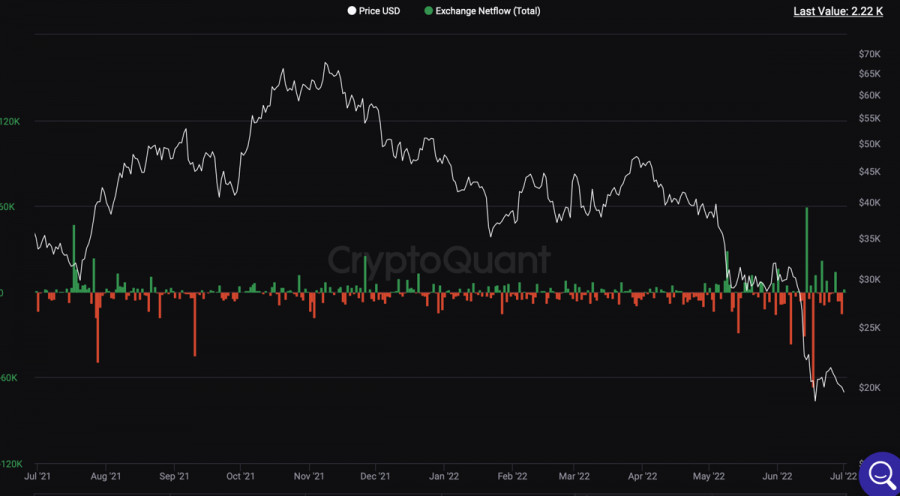
Technical indicators confirm the market is stabilizing. Key indicators have reached the bottom of the Bitcoin market. The profitability level of BTC dropped to 50% and realized losses reached a record. At the same time, the price interacts with the 200-week MA, which indicates the fundamental importance of this metric and a certain dependence of the price on it. This was confirmed after the level of $18,000 was protected during the decline on the night of June 30. In addition, there is a regular outflow of BTC from cryptocurrency exchanges, which is also an important signal for the stabilization of the market.
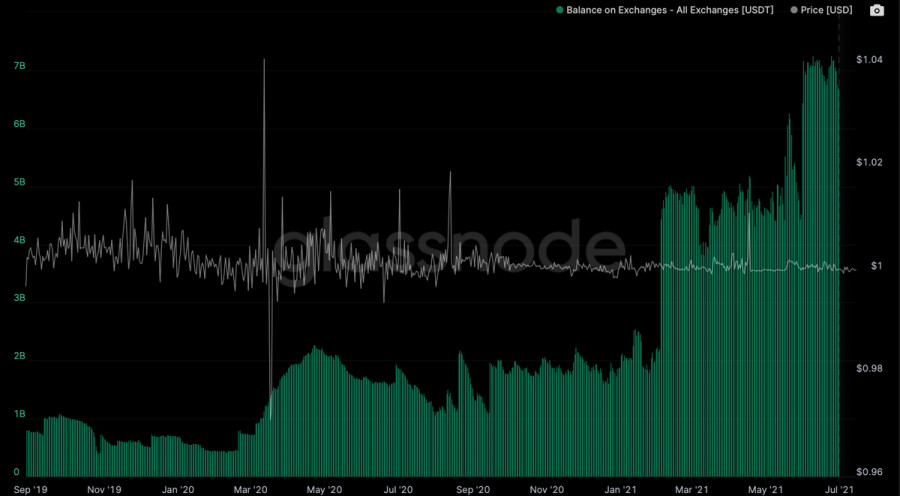
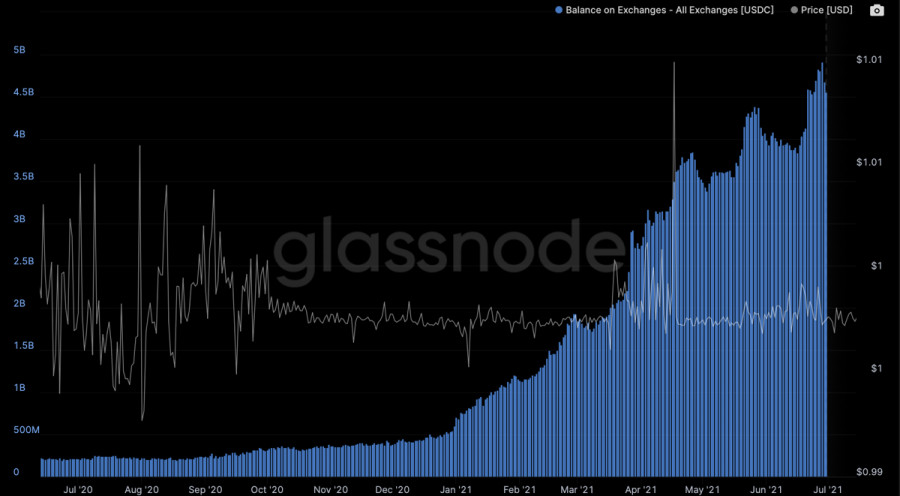
Investors understand this and are preparing to resume investments in Bitcoin. This is evidenced by the significant volumes of stablecoins that are held on cryptocurrency exchanges. Since the start of the bear market, market capitalization has fallen by 70%, while the volume of stablecoins has fallen by only 11%. This indicates investor faith in the cryptocurrency market and a willingness to start buying the asset near the bottom.
Another important factor that contributed to volatility in the Bitcoin market was the substantial amount of leverage. As of July 1, the level of volatility had decreased significantly thanks to several massive liquidations that exceeded $1.5 billion in aggregate volume. This indicates that the market got rid of the most active traders using significant amounts of borrowed funds. As a result, the market has stabilized, and Bitcoin is sometimes jokingly referred to as a stablecoin.
As of July 1, we do not see the beginning of an active buyback reflected in the Bitcoin price. We can assume that the market does not believe in the current bottom at $17,700. We also do not see significant purchases from the major companies. MicroStrategy and El Salvador bought Bitcoin at current prices, but these amounts cannot be called determinative in the context of the whole market movement. Taking this into account, we can assume two scenarios.
The first one suggests that buyers let the price fall below $17,700, which provokes another liquidity shortage. The main victims are miners and mining pools, which begin to sell BTC to cover current expenses. Subsequently, Bitcoin drops below $15,000 and forms a local bottom, which investors start to buy back with the help of stablecoin volumes.
The second scenario seems to be more real because we have already seen certain prerequisites. It lies in the fact that whales play with market expectations and raise the price, provoking premature investment activity. The price falls and big BTC owners get additional liquidity at a discounted price. This scenario seems more probable because we saw for the first time since June 18 a serious activity from buyers and a defense of $18,000.
In any case, optimism and volumes of stablecoins grow in the market, which means that investors have finally adapted to the new reality. At the current stage, there is no active investment activity, because the market is not confident in the formation of a local bottom, and therefore we should expect an outbreak of volatility in an attempt to test the current low. We may assume that the market has passed the bottom of fear but has not reached the low. The material has been provided by InstaForex Company - www.instaforex.com |
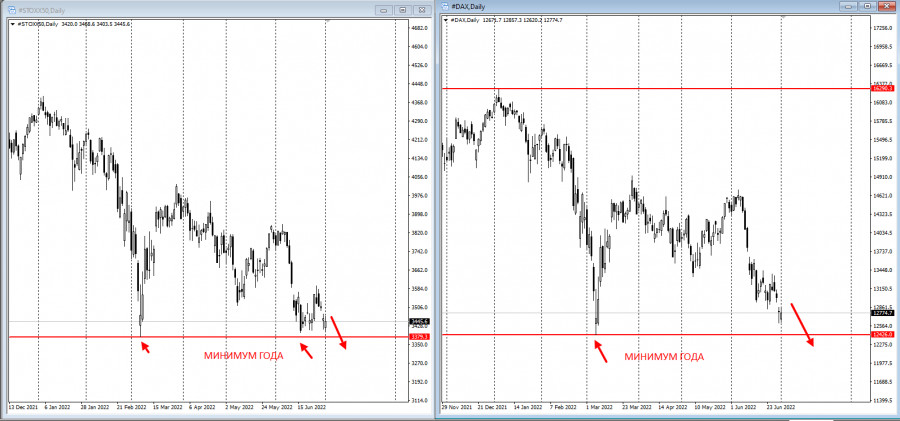
| European stocks fall to 2008 lows in past 6 months Posted: 01 Jul 2022 03:17 AM PDT At the close of Thursday's trading session, European stocks lost about 2% and recorded their biggest drop since 2020. At the same time, European stock indices have collapsed significantly over the past six months since the global economic crisis in 2008. On Thursday, the STOXX Europe 600 index of Europe's leading companies fell by 1.5% to 407.2 points. The index has already lost 16.5% in the past six months. Shares of German energy holding Uniper SE, Norwegian aluminum producer Norsk Hydro ASA and French machine-building company Alstom S.A. topped the list of top losers among the STOXX Europe 600 components. They plunged by 16.37%, 9.4%, and 8.1% respectively. The British FTSE 100 sank by 1.96% to 7,169.28 points, the French CAC 40 dropped by 1.8% to 5,922.86 points and the German DAX fell by 1.69% to 1,783.77 points. Top gainers and losers The day before, British pharmaceutical giant Shield Therapeutics PLC stock plummeted by 37.5%. The company increased its net loss last year and was unable to raise $30 million in capital by issuing shares. Shares of German carmaker Volkswagen dropped by 5.1%. French Renault stock fell by 2.6%, shares of German carmaker BMW and Italian company Stellantis declined by 1.4% and 3.3% respectively. The market capitalization of Italian bank UniCredit SpA sagged by 5.3%. The day before, the company sold a non-performing loans portfolio worth about 1.3 billion euros to Illimity Bank SpA. Reasons for record collapse In April-June, the FTSE 100 index fell by 4.6%, the CAC 40 lost 11.1% and the DAX dropped by 11.3%. As for all three European key stock indices, this quarterly performance was the worst since 2020. In the second quarter of 2022, global stock markets were affected by traders' fears about the prospects of a global economic recession due to tight monetary policy of the world's major central banks. Currently, soaring inflation is the reason why the top central banks have decided to revise the monetary policy and sharply increase the prime rates. Growing geopolitical tensions have become an additional pressure factor for the markets. They stimulate acceleration of price growth despite all attempts of global regulators to reduce soaring prices. What caused investors' major concerns the day before? On Thursday, weak domestic statistics of the EU member states became a significant downward factor for European stock indices. The unemployment rate in 19 EU countries hit an all-time low in May. It fell to 6,6% from 6.7% in April. Moreover, analysts expected the unemployment rate for May to remain unchanged from the previous month. According to the Federal Employment Agency of Germany, in June the unemployment rate in the country rose to 5.3% from 5.0% in May, while experts predicted it would remain unchanged from the previous month. At the same time, the number of unemployed in Germany jumped by 133,000, though analysts expected a decline by 5,000. According to Germany's Federal Statistics Office data, retail sales in the country grew by 0.6% compared to April. Analysts expected the index to rise only by 0.5%. At the same time, consumer prices in Germany advanced by 8.2% year-on-year in June after a record rise in May by 8.7%. In the first quarter of 2022, the UK economy grew by 0.8% compared to the previous three months. The current figure was 0.7% above the pre-pandemic level. According to preliminary data from the National Statistics Office of France Insee, in June consumer prices increased by 6.5% year-on-year, a record growth in the history of the index. At the same time, market experts predicted an average rise in consumer prices only by 6.3%. Earlier, the Spanish Statistical Office reported that in June consumer prices in Spain had risen to the highest level since 1985, i.e. by 10.2% in annual terms, according to preliminary estimates. The material has been provided by InstaForex Company - www.instaforex.com |
| Posted: 01 Jul 2022 03:08 AM PDT
Yesterday's report showed that there is little relief from rising inflation, which continues to soar at a record pace. The Federal Reserve's inflation report and personal consumption expenditure price index were released yesterday. According to the PCE, year-on-year inflation stood at 6.3% in May, in line with the inflationary pressure in April.The PCE rose by 0.6% in May following an increase of 0.2% in April. However, the core PCE price index posted its weakest growth since November 2021. According to the report, on an annualized basis, the core PCE dipped to 4.7% in May, down slightly from 4.9% in April.The initial reaction to yesterday's inflation report caused a bullish market sentiment for gold. The report was expected to reduce the size of the next rate hike at the July FOMC meeting. However, such optimism was short-lived, because an hour and forty-five minutes later, gold was down to $1805.10. It is now continuing to fall.
|
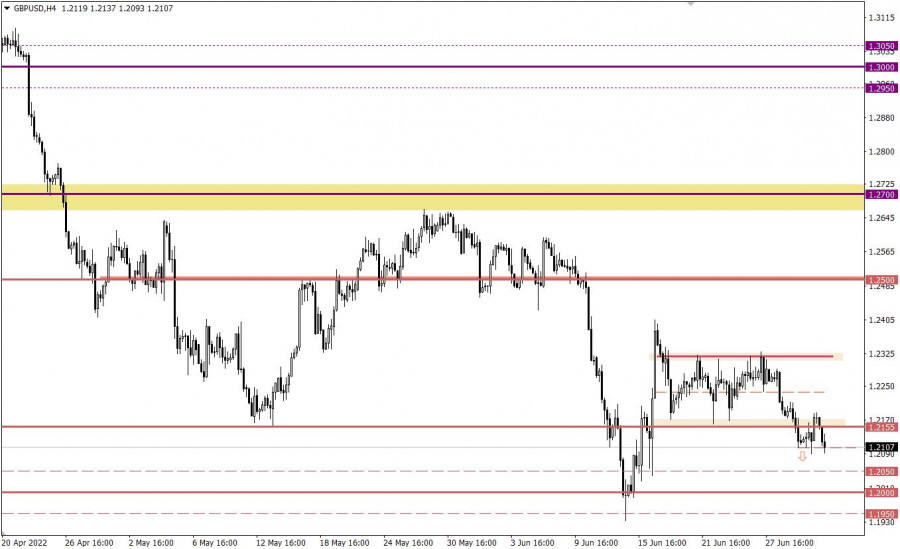
| Analysis and forecast for GBP/USD on July 1, 2022 Posted: 01 Jul 2022 03:02 AM PDT Let's look at how well the British pound sterling has performed when paired with the US dollar since the market ended trading for the first month of summer yesterday, as you are probably aware. But first, a little background on the oldest period. Naturally, trading every month is impossible due to the enormous price fluctuations and the challenging nature of identifying the best entry and exit moments. However, it is important to consider the candle that appears, its closing price, and the maximum and lowest values following each close of monthly trading. All those mentioned above can assist in understanding the course's future path at the beginning of the month. Monthly
Last month, the pound experienced intense selling pressure and dropped as far as 1.2000. The GBP/USD pair did, however, manage to find solid support at 1.1932, after which it entered the correction phase. As a result, the June auction ended at the price of 1.2174, and the candle's lower shadow was rather remarkable. If you look at the history, and the monthly chart is ideal for this, you can see that the pair has frequently established strong support at about 1.2000, following which it has sprinted in the direction of the north. The same thing occurred in 2020, 2019, and 2017. Although the pair fell as low as 1.1410 in 2020, it was able to significantly cut losses by closing the March candle of this year at 1.2412. I want to reiterate that the pound is one of the most volatile currencies and has the potential to experience the greatest falls and the highest ups. The primary interest rate has been raised by the Bank of England numerous times, but the pound has not benefited from these increases. The market's complete disregard for the British Central Bank's hike in the primary interest rate is astonishing. However, nothing in the market is unexpected or impossibly difficult. You should constantly be ready for everything and not pass out when making some extremely powerful motions. The ending of July at 1.2000, and much more so below 1.1932, will significantly help players decrease the rate, according to the technical picture on the most senior timeframe. Only after a genuine breakdown of the resistance levels of 1.2600 and 1.2665 is an upward scenario viable. Daily
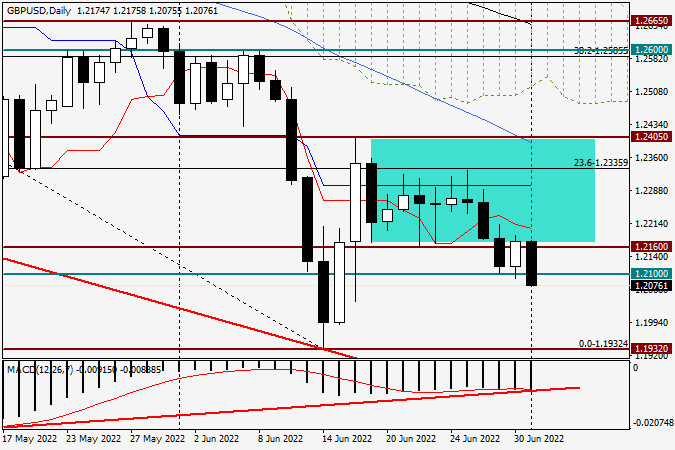
The pound/dollar currency pair rose throughout yesterday's trade, and the start of the higher dynamics was close to another significant and crucial technical mark of 1.2100. Today, when this piece is being finished, the opposite image is visible; the pair is trading lower and is once more attempting to move below the level of 1.2100. Despite the MACD indicator's positive divergence, it is not advantageous for players to drive up the exchange rate. The "Briton" cannot raise his head because of the potential negative consequences. But it might occur at any time. I won't disguise the fact that I anticipate that the pound will still be able to change the direction of trade in a pair with the US dollar in its favor despite the already significant decrease and the daily bullish divergence of the MACD indicator. However, I'm not recommending making any purchases; instead, you should wait for strong indications and do it weekly. It's not the most enjoyable activity to sell on the approach to the historical, technical, and psychological level of 1.2000. Therefore, I advise keeping away from the GBP/USD market for the time being. The material has been provided by InstaForex Company - www.instaforex.com |
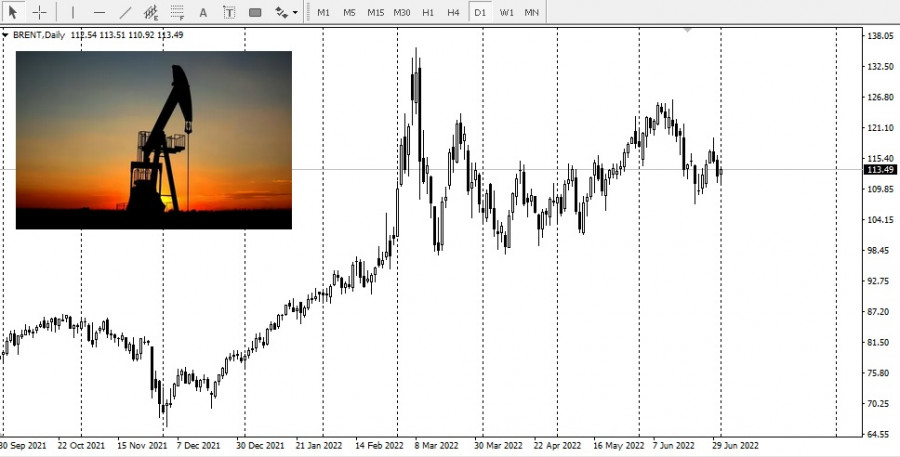
| Saudi Arabia raises oil prices Posted: 01 Jul 2022 02:57 AM PDT
Saudi Arabia may raise the official selling price of its crude oil shipped to Asia for the second month in a row. Reuters reported that Arab Light will cost $2.40 a barrel in August. Earlier, Saudi Arabia already increased the official selling price for July deliveries as China began to reopen after the latest round of Covid-related lockdowns amid strong demand for middle distillates that pushed refiners' margins to margins to record highs. The hike was $2.10 barrel, bringing the total price of premium Arab Light to $6.50 per barrel. Libya, on the other hand, announced that it would suspend exports from a key oil terminal as its political crisis continues to rage. Ecuador also said it may have to suspend all oil production amid anti-government protests.
Worryingly, it appears that the UAE and Saudi Arabia - the OPEC members thought to have the most spare oil production capacity - may actually be much closer to the maximum they can produce than previously believed. Saudi Arabia will most likely announce its official selling prices for August after the OPEC meeting. Changes in the cartel's policy are quite impossible as members agreed last month to increase their monthly production from about 430,000 bpd to 648,000 bpd in both July and August. However, OPEC is still unable to add even the initial 430,000 bpd. The material has been provided by InstaForex Company - www.instaforex.com |
| Daily Video Analysis: USDCAD, H1 Bullish Bounce Opportunity Posted: 01 Jul 2022 02:49 AM PDT Today we take a look at USDCAD. Combining advanced technical analysis methods such as Fibonacci confluence, correlation, market structure, oscillators and demand/supply zones, we identify high probability trading setups. The material has been provided by InstaForex Company - www.instaforex.com |
| Tips for beginner traders in EUR/USD and GBP/USD on July 1, 2022 Posted: 01 Jul 2022 02:42 AM PDT Details of the economic calendar from June 30The final data on UK GDP for the first quarter fully coincided with the preliminary estimate, which means that they have already been taken into account in the quotes. The slowdown in economic growth from 5.5% to 3.5%. During the American trading session, weekly data on jobless claims in the United States were published, which saw a decrease in volume. Statistics details: The volume of continuing claims for benefits decreased from 1.331 million to 1.328 million. The volume of initial claims for benefits decreased from 233,000 to 231,000. Despite the fact that the volume of applications decreased, the data still turned out to be worse than expected. First of all, it is worth noting the revision of previous indicators in favor of growth, and the current data fell significantly less than the forecast. The result disappointed investors, which led to a local sell-off of the US dollar. Analysis of trading charts from June 30During the intensive downward movement, the EURUSD currency pair has come close to the bottom of the downward trend, where there was a reduction in the volume of short positions as a result of a technical pullback. The GBPUSD currency pair, after a short pullback, resumed its decline. The area of the lower border of the previously passed flat 1.2155/1.2320 serves as resistance in the market, allowing sellers to increase the volume of short positions.
Economic calendar for July 1The final data on the index of business activity in the manufacturing sector of Europe, Britain, and the United States will be published today. However, these indicators will have little effect on anything, as they should only confirm preliminary estimates that have already been taken into account by the market. The only thing that can affect the market is the data on inflation in the EU, which is predicted to accelerate from 8.1% to 8.3%. Thus, inflationary pressure increases unrest within the EU economy, which allows for a sell-off of the euro. It is worth noting that the subsequent increase in inflation once again indicates the possibility of an early increase in the ECB interest rate, which should take place during the upcoming meeting of the regulator's board. Time targeting EU inflation – 09:00 UTC Trading plan for EUR/USD on July 31The previously passed level of 1.0500 currently serves as a resistance in the market. Thus, the existing rebound may indicate a consistent recovery of short positions, which in the future allows for a decline in the quote in the direction of 1.0350. An alternative scenario will be considered by traders if the price holds above the 1.0500 level in a four-hour period. In this case, the quote may again resume the cycle of fluctuations within 1.0500/1.0600.
Trading plan for GBP/USD on July 31In this situation, keeping the price below the value of 1.2100 in a four-hour period will lead to a subsequent decrease in the pound sterling. This move allows for a move towards the psychologically important mark of 1.2000.
What is reflected in the trading charts?A candlestick chart view is graphical rectangles of white and black light, with sticks on top and bottom. When analyzing each candle in detail, you will see its characteristics of a relative period: the opening price, closing price, and maximum and minimum prices. Horizontal levels are price coordinates, relative to which a stop or a price reversal may occur. These levels are called support and resistance in the market. Circles and rectangles are highlighted examples where the price of the story unfolded. This color selection indicates horizontal lines that may put pressure on the quote in the future. The up/down arrows are the reference points of the possible price direction in the future. The material has been provided by InstaForex Company - www.instaforex.com |
| Prices slump despite falling crude oil inventories Posted: 01 Jul 2022 02:26 AM PDT
Two days ago, the US Energy Information Administration reported that crude oil inventories fell by 2.8 million barrels over the week. Nevertheless, oil prices tumbled.
The EIA also reported an increase in fuel.According to the EIA, gasoline stocks rose by 2.6 million barrels in the week. This was great news for the US motorists.Gasoline production averaged 9.5m barrels last week, up from the previous week for which the EIA has yet to provide data. The EIA estimated the week's middle distillate inventory had rose by 2.6 million barrels. It was noted that this was about 20% lower than the five-year average for this time of year.Middle distillate production averaged 5.1m barrels a day last week, down from a week earlier, according to the EIA. Fuel supplies in the US remain lower than usual despite record high prices. Because of this, Biden announced last week a four-point plan to cut retail prices.The plan submitted to Congress proposes a three-month suspension of the federal fuel tax and calls on states to suspend state fuel taxes. Earlier this month, the president also urged the oil industry to use its profits to increase refining capacity and retail petrol station owners to pass on the price of electricity to consumers. The material has been provided by InstaForex Company - www.instaforex.com |
| Forex forecast 07/01/2022 GBP/USD, USD/JPY, EUR/JPY, SP500 and Bitcoin from Sebastian Seliga Posted: 01 Jul 2022 02:10 AM PDT Let's take a look at the technical picture of GBP/USD, USD/JPY, EUR/JPY, SP500 and Bitcoin The material has been provided by InstaForex Company - www.instaforex.com |
| Technical analysis recommendations on EUR/USD and GBP/USD for July 1, 2022 Posted: 01 Jul 2022 02:03 AM PDT EUR/USD
Higher timeframes The current decline was again interfered with by the bulls. As a result, yesterday has bullish optimism. Today we are closing the working week, the preservation and strengthening of bullish sentiment based on the results of the closing may contribute to another testing of the strength of the weekly short-term trend and the daily death cross, while the persistence and opportunities for the transition of these boundaries to the side of the bulls will be much higher than before. Currently, the daily cross (1.0499 – 1.0624), the weekly short-term trend of 1.0568, and the monthly support of 1.0539 remain the benchmarks and boundaries of the current movement for the bulls, and the local lows (1.0349–39) are for the bears.
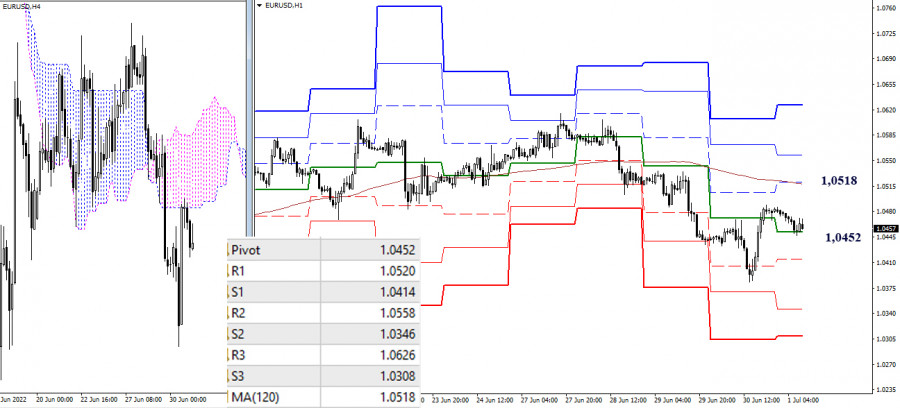
H4 – H1 In the lower timeframes, the pair is currently in the correction zone. Bulls have taken possession of the central pivot point of the day (1.0452) and are now using it as support. The next important reference point for bulls is the weekly long-term trend (1.0518). If the bulls can take over the level, they will change the current balance of power in their favor. Additional reference points in this direction during the day today will be the resistance of the classic pivot points (1.0558 – 1.0626). Bearish benchmarks within the day are the support of the classic pivot points (1.0414 – 1.0346 – 1.0308). *** GBP/USD
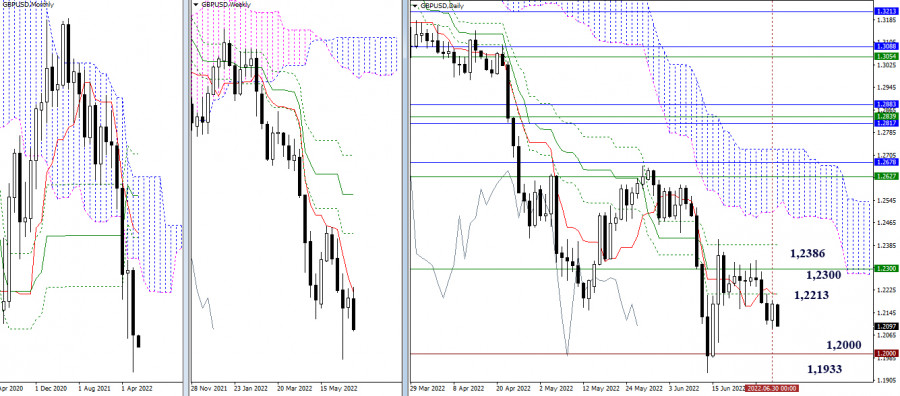
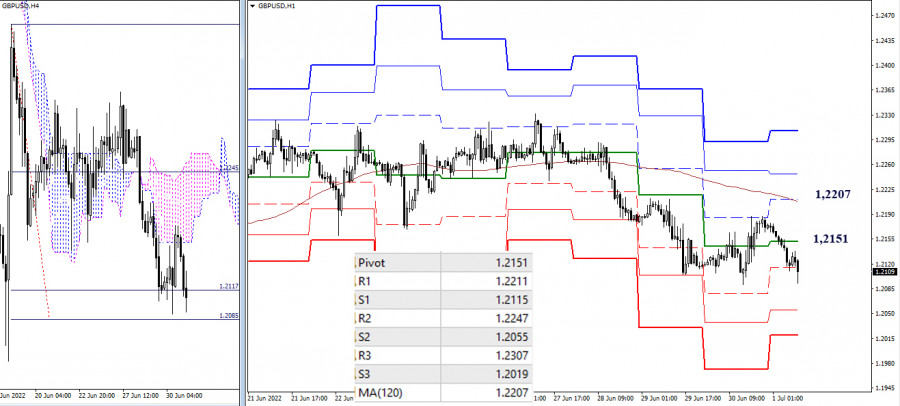
Higher timeframes The bearish offensive was suspended yesterday. The bulls tried to partially restore their positions. As a result, there were no significant changes in the situation, priorities, and benchmarks. We can note the following boundaries: 1.2213 – 1.2300 – 1.2386 (levels of the daily cross + weekly long-term trend) as resistance. The psychological level of 1.2000 and the local low 1.1933 serve as support and nearest downward reference points.
H4 – H1 The advantage in the lower timeframes is on the side of the bears. Their reference points today within the day are—working out the target for the breakdown of the H4 cloud (1.2085) and the support of the classic pivot points (1.2055 – 1.2019). The most important upside targets for players at this stage are the key levels of the lower timeframes at 1.2151 (central pivot point of the day) and 1.2207 (weekly long-term trend). If the corrective movement manages to overcome the key levels and gain a foothold above, then the main advantage will go to the side of the bulls. Further reference points within the day will be the resistance of the classic pivot points (1.2247 – 1.2307). *** In the technical analysis of the situation, the following are used: higher timeframes – Ichimoku Kinko Hyo (9.26.52) + Fibo Kijun levels H1 - Pivot Points (classic) + Moving Average 120 (weekly long-term trend) The material has been provided by InstaForex Company - www.instaforex.com |
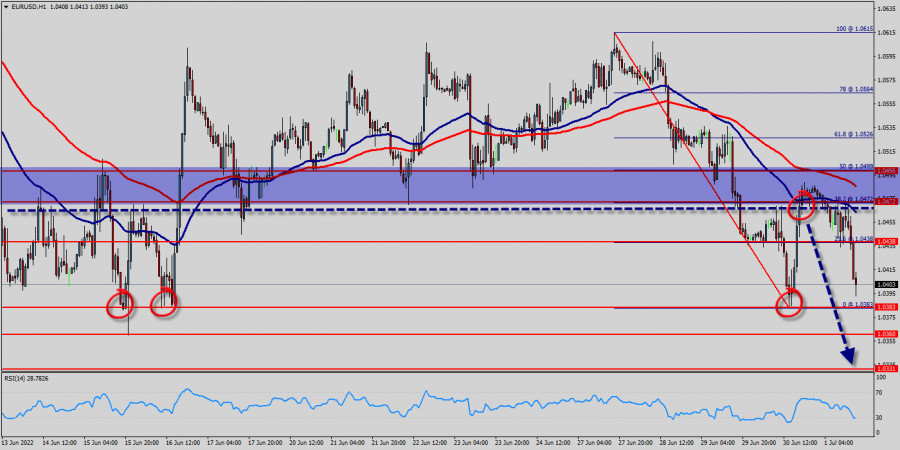
| Posted: 01 Jul 2022 01:46 AM PDT
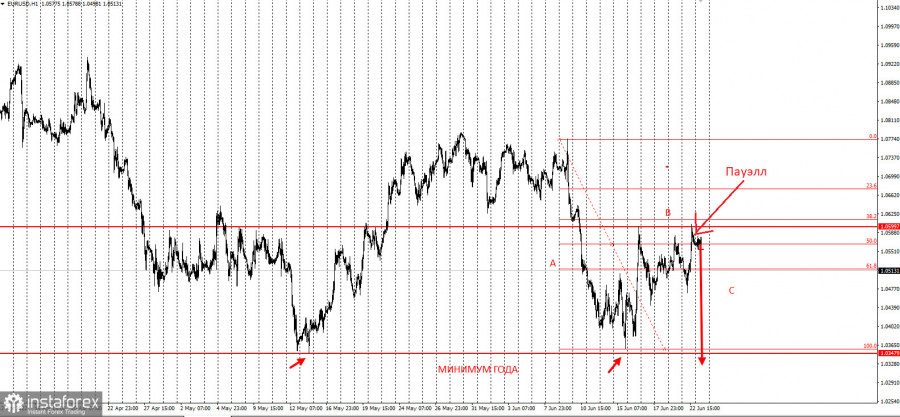
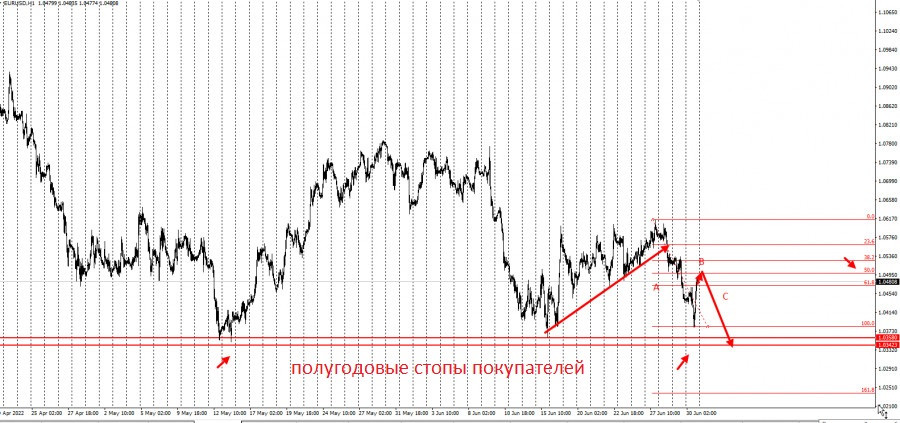
EUR/USD is currently in the process of a large bearish scenario. plan:
There is a corrective movement at the moment, but this is likely to be followed by a dip towards yearly lows. Behind those are the of medium-term buyers stops, which is a good setting for a price decrease.
So, considering that there is a three-wave pattern (ABC), where wave A represents the selling pressure from June 28 to June 30, traders can sell from current prices up to the 61.8% and 50% retracement levels. Stop loss can be set at 1.06, while take profit can be placed on the breakdown of 1.03300. This strategy is based on the Price Action and Stop Hunting methods. Good luck and have a nice day! The material has been provided by InstaForex Company - www.instaforex.com |
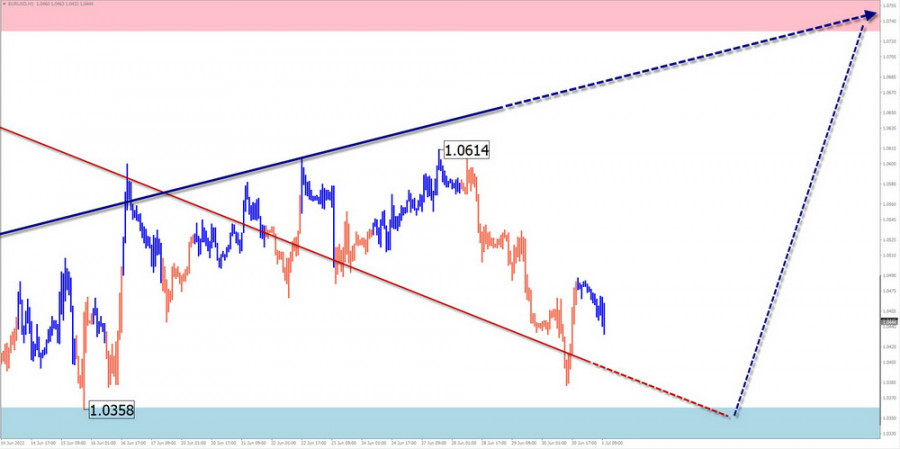
| Posted: 01 Jul 2022 01:40 AM PDT EUR/USD Analysis: The primary euro pair's chart shows that the negative trend that has dominated over the past 1.5 years is still present. Price has climbed to the top of a huge TF's significant potential reversal zone. Price movements have primarily followed the side plane since mid-May, producing a correction of the wave's last segment. Forecast: The general sideways price movement pattern is anticipated to continue the following week. Pressure on the support zone is likely to start the week. Following that, watch for the development of a reversal and the continuation of the upward travel vector.
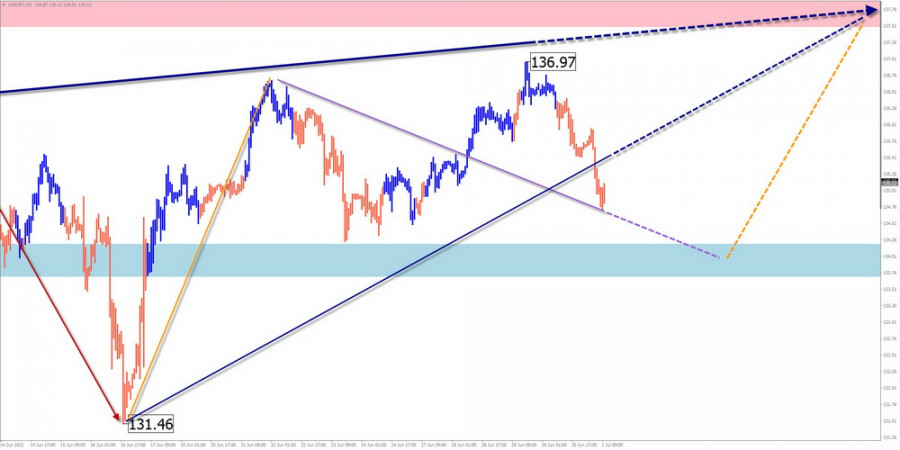
Potential zones for reversals Resistance: - 1.0730/1.0780 Support: - 1.0360/1.0310 Recommendations: In distinct sessions for the upcoming week, trading with a fractional lot may be successful on the euro market. Sales are subject to no conditions. To purchase the instrument in the support area, it is advised to keep an eye out for new signals. USD/JPY Analysis: The key pair's market for the Japanese yen was set on an upward trend, which drove quotes to levels last seen 20 years ago. Price has nearly reached a large resistance zone's lower limit. Since June 16, the wave's incomplete portion has been keeping score. The stretched plane-shaped corrective component of the wave is nearly finished within its boundaries. Forecast: The bearish movement vector's conclusion is anticipated at the start of the upcoming week. Then you can wait for the formation of a reversal in the settlement support area. By the end of the week, the upward course is more likely to resume.
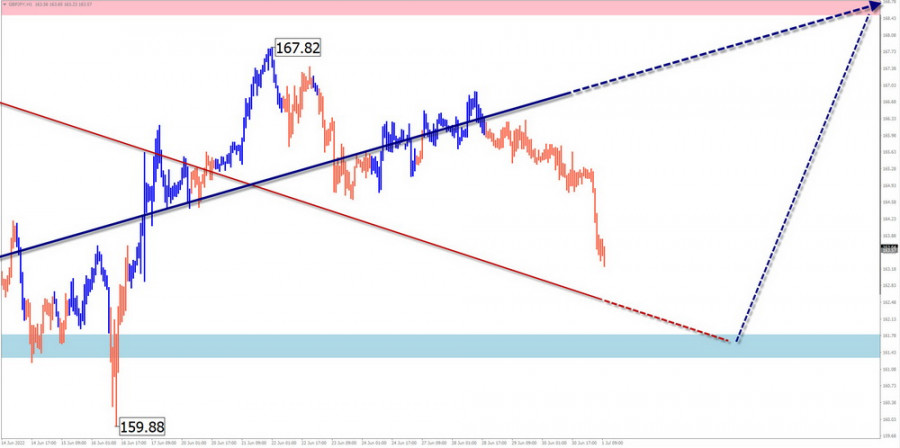
Potential zones for reversals Resistance: - 137.50/138.00 Support: - 134.20/133.70 Recommendations: There won't be any restrictions on trading Japanese yen on the pair's market in the upcoming days. It is advised to hold off on making any purchases until the purchase signals that your car has confirmed appear in the support zone. GBP/JPY Analysis: The pound/yen pair is moving at a rate pointed "north" of the price chart. A two-year trend supports this pattern. Price has surpassed the intermediate resistance's bottom boundary. Since May 12, the wave's incomplete portion has been keeping score. Its structure develops a flat adjustment for the present month. The movement is now in its latter stage. Forecast: We can anticipate a downward movement vector at the start of the upcoming weekly period until the correction waves are finished. The price of the pair is then waiting for a turn around and to resume moving upward. It seems improbable that the move would exceed its predicted range in the upcoming week.
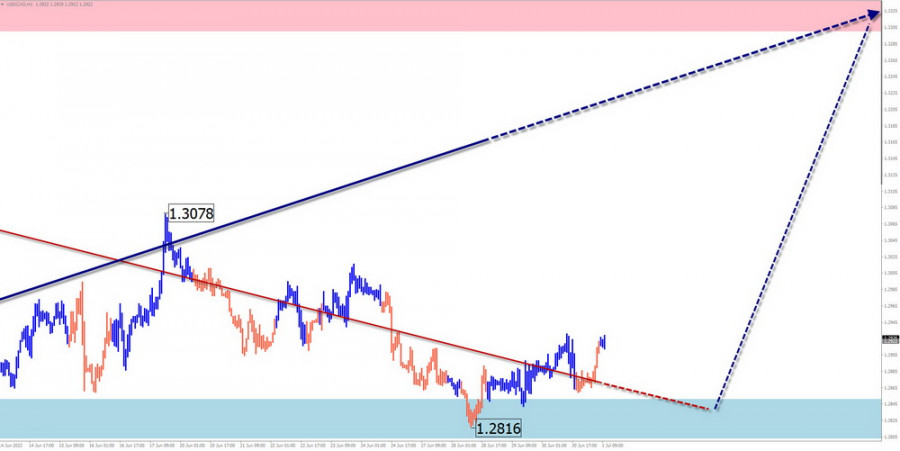
Potential zones for reversals Resistance: - 168.50/169.00 Support: - 161.80/161.30 Recommendations: Within the framework of individual sessions with a smaller lot, sales of the pair in the upcoming days can result in a profit. It is recommended to complete the transaction at the first signal of a reversal. Before making an instrument purchase, it is advised to keep an eye out for new indications in the settlement support sector. USD/CAD Analysis: Since May last year, the primary pair's price movement for the Canadian dollar has been upward trending. The chart's weekly scale, which highlights this movement's corrective nature, may be seen. The incomplete segment began on June 7. The price has mostly been moving sideways during the past two weeks, generating the correction section (B) in the shape of a stretched plane. Forecast: It is anticipated that the flat mood will persist until the first part of next week and that the corrective structure will completely end. We anticipate that the reversal will be finished by the week's end and that the upward movement rate will resume. With the introduction of significant news blocks, there is a high likelihood of volatility growth.
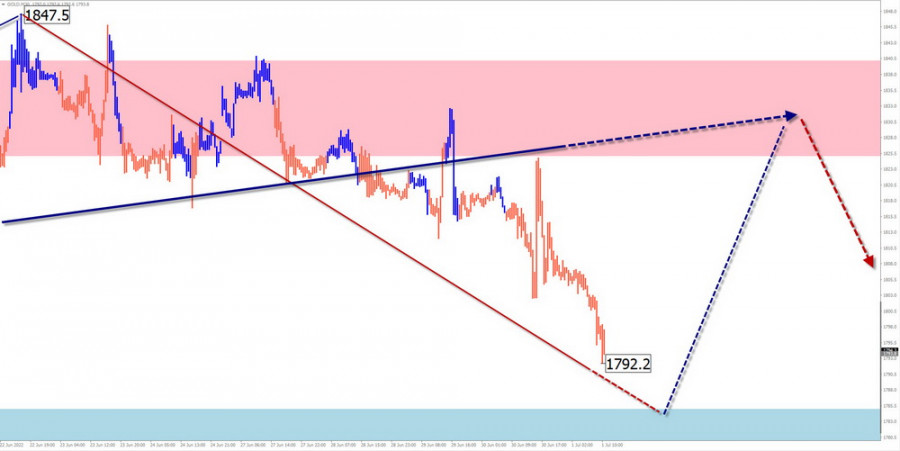
Potential zones for reversals Resistance: - 1.3290/1.3340 Support: - 1.2850/1.2800 Recommendations: It is not advised to sell on the Canadian dollar market because it can be dangerous. Holding off on trading a pair is best until solid buy signals manifest themselves in the support region. GOLD Analysis: On the gold market, the instrument is still in its downward trend, which began in early March. In the past month and a half, a corrective shifting plane that is yet unfinished has been forming in the wave structure. There is a gap in the final climbing segment. Forecast: We may anticipate a downward price movement at the start of this week, continuing until the decline phase is fully completed. In the field of settlement support, a reversal is probable. There is a good chance that the price of gold will rise quickly before the end of the week, reaching resistance levels. The downturn will then pick back up.
Potential zones for reversals Resistance: - 1825.0/1840.0 Support: - 1785.0/1770.0 Recommendations: After the current correction is over in its entirety, conditions for the sale of gold will be established. Before that, counter price increases can thwart any attempts. It is best to avoid buying instruments until the sale signals that your vehicle has confirmed shows in the resistance zone area. Reasons: In the simple wave analysis (UVA), each wave has three components (A-B-C). Only the final and incomplete wave for each TF is examined. The arrows' solid backgrounds display the formed structure, while their dotty backgrounds display the anticipated movements. Be aware that the wave algorithm does not account for how long the instruments' movements in time last! The material has been provided by InstaForex Company - www.instaforex.com |
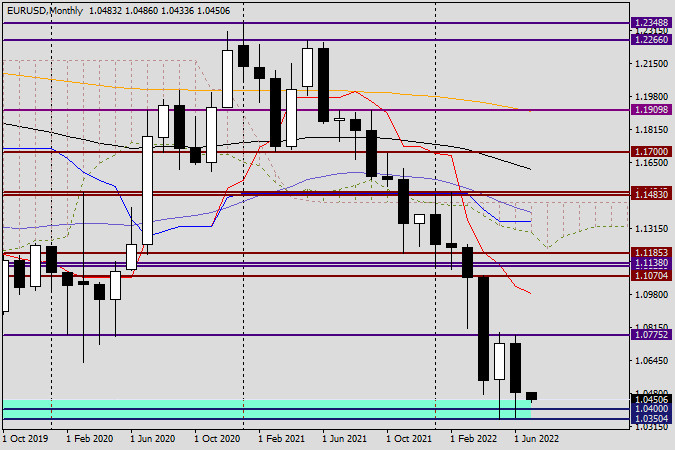
| EUR/USD analysis and forecast for July 1, 2022 Posted: 01 Jul 2022 01:40 AM PDT As a result, the first month of trading in the summer has ended. We must acknowledge that the primary currency pair EUR/USD finished on a rather sad note. The US dollar is still strong, as demonstrated at the June auction when it faced up against all except the Swiss franc's primary rivals. However, this is entirely another tale. And I recommend looking at the most senior timeframe and summarizing the month's outcomes that ended yesterday in today's article on the euro/dollar. Monthly
You will first notice the major support area near 1.0350, which is now indubitably historical. The fall, which had already been noticed in 2017, was stopped by this sturdy technical level, as is evident on the chart. I recall that occasion and how parity, or the level of 1.0000, was expected for the euro/dollar at that time. Instead, the pair took action, turned upward, and not only turned around but also grew decently, rising to the level of 1.2555. Following that, both ups and downs were seen in the price dynamics of the EUR/USD, and as a result of all these moves, the quote fell back to levels last seen five years ago. The relatively large shadows of the last two monthly candles amply illustrate the strength of the 1.0350 level. But nothing endures forever. Once more, I'd guess that the pair would indeed move quickly toward parity in the event of a true collapse of the 1.0350-1.0300 price range. The ending of July trading above 1.0775 will likely pave the way for higher prices, possibly even to the Tenkan red line, which is positioned at 1.0983, or to another significant historical and technical level of 1.1000. This is easy to predict, given the lows and highs of the previous month. If the July trades close at 1.0339 (the January 2017 lows), the pair will undoubtedly anticipate a route to the south, whose ferocity will only grow. Daily
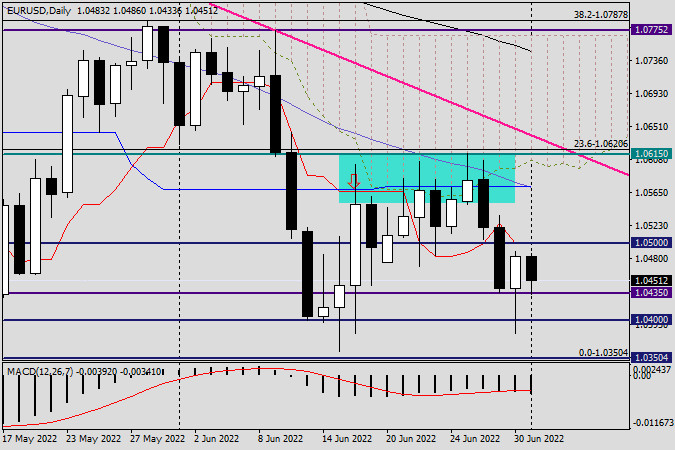
The EUR/USD pair displayed resilience throughout yesterday's trade. After attempting to breach another important key of 1.0400, it found firm support at 1.0383 and figuratively rose from the ashes to close Thursday's session at 1.0483. However, as the euro/dollar is currently trading below the red line of the Tenkan Ichimoku indicator, which is directly at this crucial level and the major psychological level of 1.0500, negative risks for the pair still exist. In this regard, it will be fascinating to see how the market will respond to today's eurozone inflation figures. I want to remind you that all versions of the eurozone consumer price index, including their base value, will be released at 10:00 London time. Since the European regulator has launched and postponed the issue of high inflation, I assume that the growth of consumer prices in the eurozone will be comparable to and, in some cases, even exceeding forecasts. This will support the single currency because it will be clearer that the ECB needs to turn its words into deeds. If technology is our only point of interest, then the bullish candle from yesterday with its lengthy lower shadow provides every reason to anticipate that the EUR/USD expansion may continue today. However, as is customary on the final trading day of the week, I won't provide any specific suggestions for trading. I assure you that this is not the ideal time. The material has been provided by InstaForex Company - www.instaforex.com |


 Yesterday's and today's price declines will lead to lower gold prices throughout the day, week, month and quarter. Yesterday's PCE price index will certainly be decisive for the Federal Reserve's decision to raise rates by 75 basis points at this month's FOMC meeting.
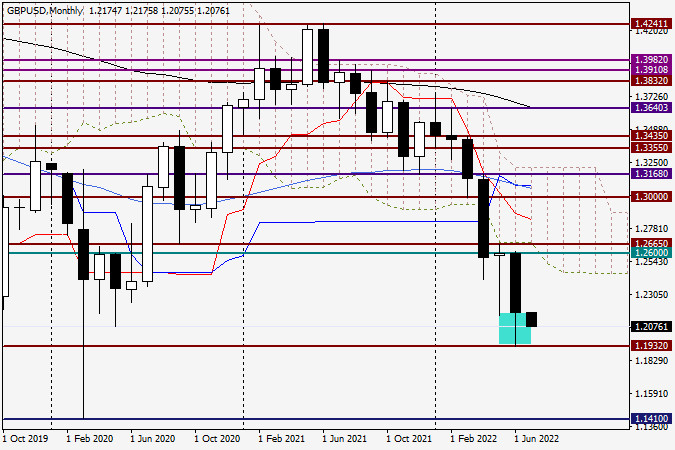


 Earlier, the American Petroleum Institute announced that crude oil inventories had dropped by 3.8 million barrels for the week after reporting the biggest increase in oil stocks since February. It stood at 5.6 million barrels.
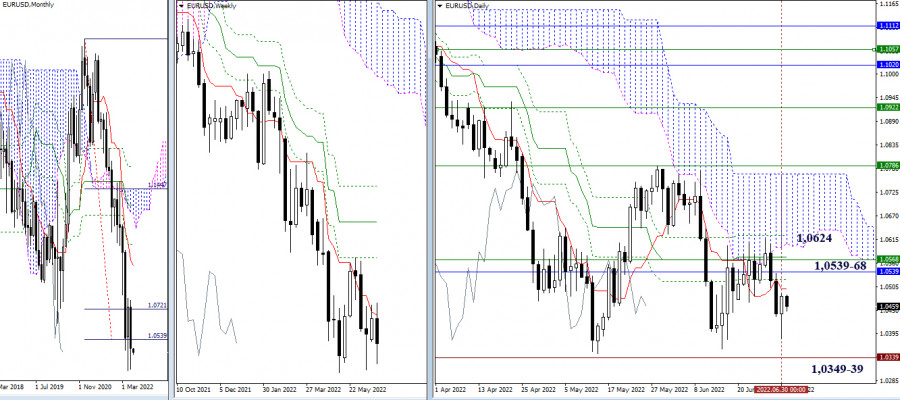

| You are subscribed to email updates from Forex analysis review. To stop receiving these emails, you may unsubscribe now. | Email delivery powered by Google |
| Google, 1600 Amphitheatre Parkway, Mountain View, CA 94043, United States | |


Comments