Forex analysis review
Forex analysis review |
- Daily Video Analysis: EURUSD, H4 Bearish Reversal Opportunity
- Technical analysis recommendations on EUR/USD and GBP/USD for July 20, 2022
- BTC update for July 20,.2022 - Breakout of the key pivot resistance and potential for further rally
- EUR/USD analysis for July 20, 2022 - Breakout of the rising channel in the background
- Analysis of Gold for July 20,.2022 - Breakout of the triangle pattern to the downside
- Technical Analysis of ETH/USD for July 20, 2022
- Technical Analysis of BTC/USD for July 20, 2022
- Technical Analysis of GBP/USD for July 20, 2022
- Bitcoin updates local high: should we expect further upward movement?
- Technical Analysis of EUR/USD for July 20, 2022
- Technical analysis of GBP/JPY
- Video market update for July 20, 2022
- Trading tips for AUD/CAD
- Trading tips for EUR/USD
- Forex forecast 07/20/2022 GBP/USD, GBP/JPY, USD/CAD, USDX and Oil and Ethereum from Sebastian Seliga
- Stocks may bounce back, while dollar will decline (expect the local growth in EUR/USD and EUR/JPY to continue)
- Tips for beginner traders in EUR/USD and GBP/USD on July 20, 2022
- Analysis and trading tips for GBP/USD on July 20
- Indicator analysis: Daily review of GBP/USD on July 20, 2022
- Indicator analysis: Daily review of EUR/USD on July 20, 2022
- EURUSD Potential For Bearish Continuation | 20th July 2022
- GBPUSD Potential For Bullish Continuation | 20th July 2022
- BTCUSDT Potential For Bullish Continuation | 20th July 2022
- Analysis and trading tips for EUR/USD on July 20
- Hot forecast for EUR/USD on 20/07/2022
| Daily Video Analysis: EURUSD, H4 Bearish Reversal Opportunity Posted: 20 Jul 2022 04:55 AM PDT Today we take a look at EURUSD. Combining advanced technical analysis methods such as Fibonacci confluence, correlation, market structure, oscillators and demand/supply zones, we identify high probability trading setups. The material has been provided by InstaForex Company - www.instaforex.com |
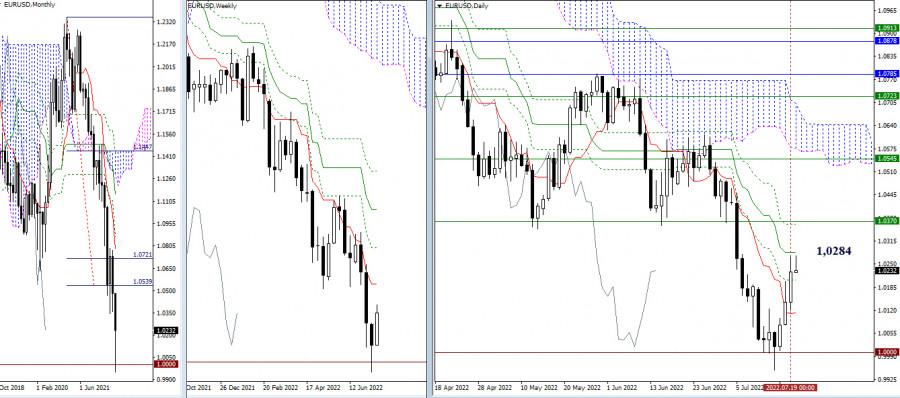
| Technical analysis recommendations on EUR/USD and GBP/USD for July 20, 2022 Posted: 20 Jul 2022 04:50 AM PDT EUR/USD
Higher timeframes There are no significant changes yet. The pair is currently on the outskirts of the daily medium-term trend (1.0284), working in its zone of influence and attraction. The break of the level opens the possibility of testing the levels of 1.0362 (the final level of the daily death cross) and 1.0370 (the weekly short-term trend). The result of interaction with these levels will determine further prospects for movement. If the upward correction is limited by the daily medium-term trend (1.0284), then in the process of restoring the downward trend (local low 0.9952), the supports 1.0205 (Fibo Kijun) – 1.0112 (Tenkan) - 1.0000 (psychological level) may come into operation.
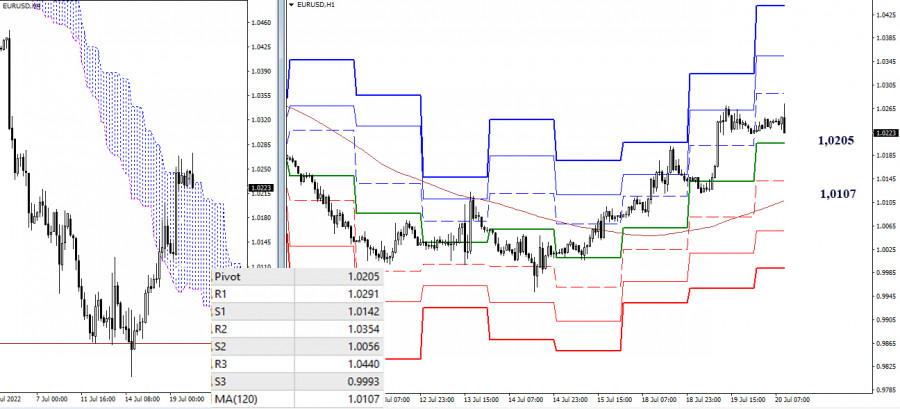
H4 – H1 Bulls currently dominate the lower timeframes. Their intraday targets today are located at 1.0291 – 1.0354 – 1.0440 (resistance of classical pivot points). The key supports of the lower timeframes in the current situation will defend the interests of the bulls at the levels of 1.0205 (central pivot point of the day) and 1.0107 (weekly long-term trend). Consolidation below can change the current balance of power. *** GBP/USD
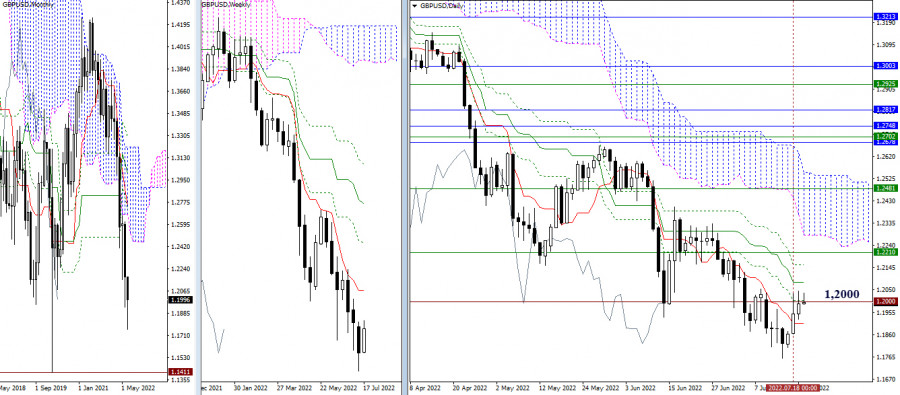
Higher timeframes Yesterday, bulls failed to consolidate above 1.2000. The battle for the level continues. At the same time, bullish players will continue to be interested in 1.2082 (daily medium-term trend) and 1.2210 (weekly short-term trend), and bearish players, in case of activity, will focus on passing 1.1907 (daily short-term trend) and 1.1759 (local low).
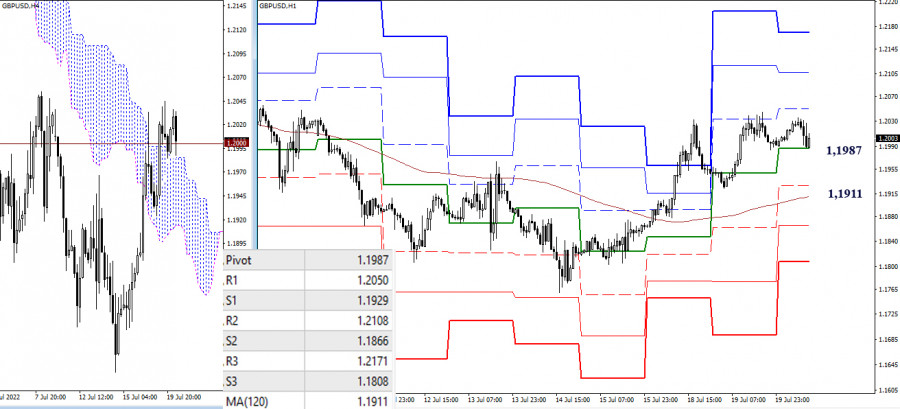
H4 – H1 The main advantage in the lower timeframes is currently on the bulls, but there is no activity and effectiveness on their part yet. Upward targets within the day today can be noted at 1.2050 – 1.2108 – 1.2171 (resistance of the classic pivot points). Now the support of the central pivot point of the day (1.1987) is being tested, then the level of the weekly long-term trend (1.1911) will be important. Its breakdown and the reversal of the moving average will change the current balance of power in favor of bears. Additional targets for bearish activity are 1.1866 (S2) and 1.1808 (S3). *** In the technical analysis of the situation, the following are used: higher timeframes – Ichimoku Kinko Hyo (9.26.52) + Fibo Kijun levels H1 - Pivot Points (classic) + Moving Average 120 (weekly long-term trend) The material has been provided by InstaForex Company - www.instaforex.com |
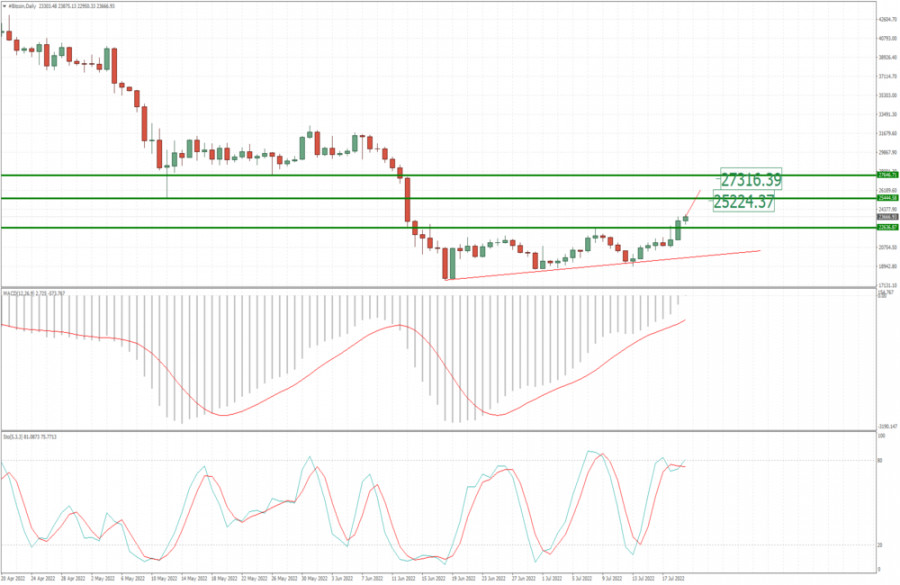
| BTC update for July 20,.2022 - Breakout of the key pivot resistance and potential for further rally Posted: 20 Jul 2022 04:30 AM PDT Technical analysis:
BTCUSD has been trading upside today and I saw the breakout of major resistance level at $22.600, which is good sign for further rise. Trading recommendation: Due to the breakout of the key pivot resistance, I see potential for the upside movement. Watch for potential buying opportunities on the intraday pullbacks with the potential upside objectives at $25.224 and $27.315. Stochastic is showing another fresh upside breakout, which is good sign for further rise... Key support is set at the price of $19.000 The material has been provided by InstaForex Company - www.instaforex.com |
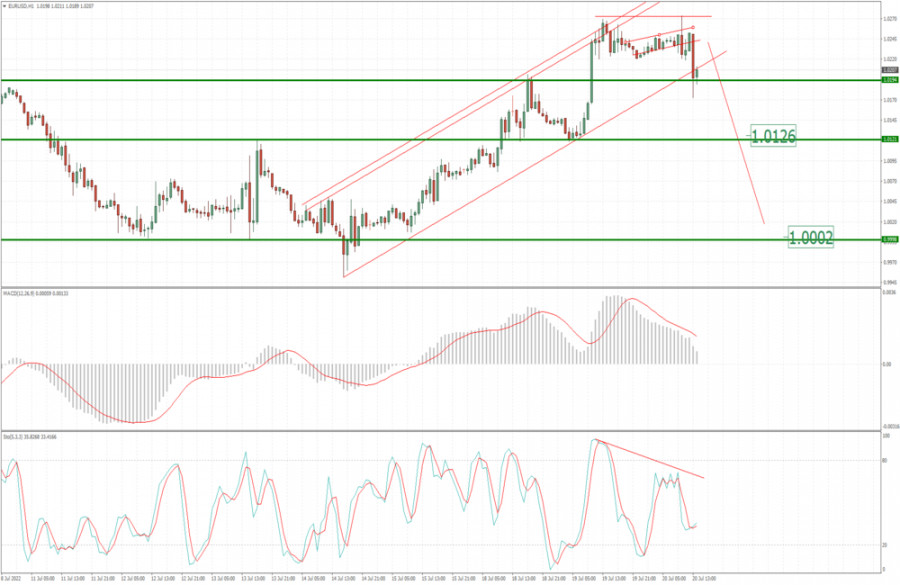
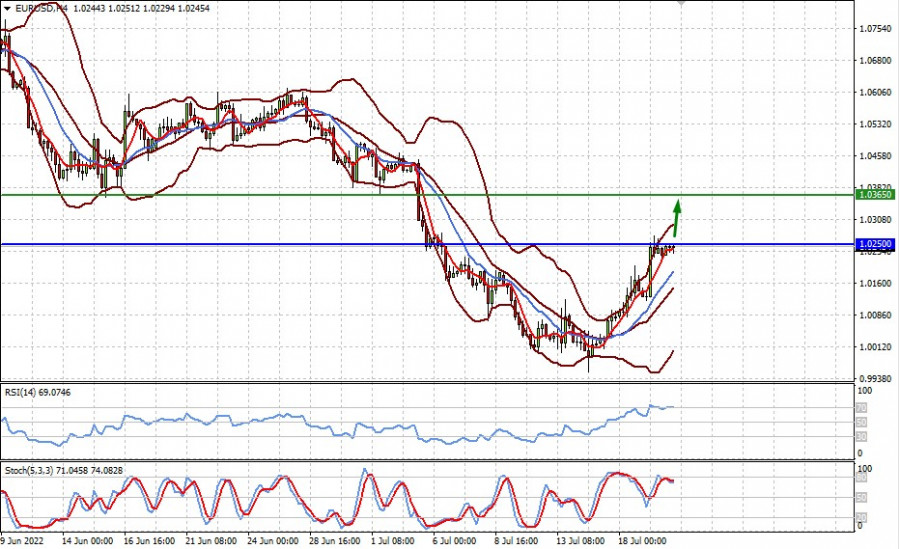
| EUR/USD analysis for July 20, 2022 - Breakout of the rising channel in the background Posted: 20 Jul 2022 04:20 AM PDT Technical analysis:
EUR/USD has been trading downside today and I saw the breakout of rising channel in the background, which is good sign for further downside movement. Trading recommendation: Due to the breakout of the rising channel today, I see potential for further downside continuation of the bear trend in the background. Watch for potential selling opportunities on the intraday rallies with the downside objectives at the price of 1.0125 and 1.000. Key resistance is set at the price of 1.0275 The material has been provided by InstaForex Company - www.instaforex.com |
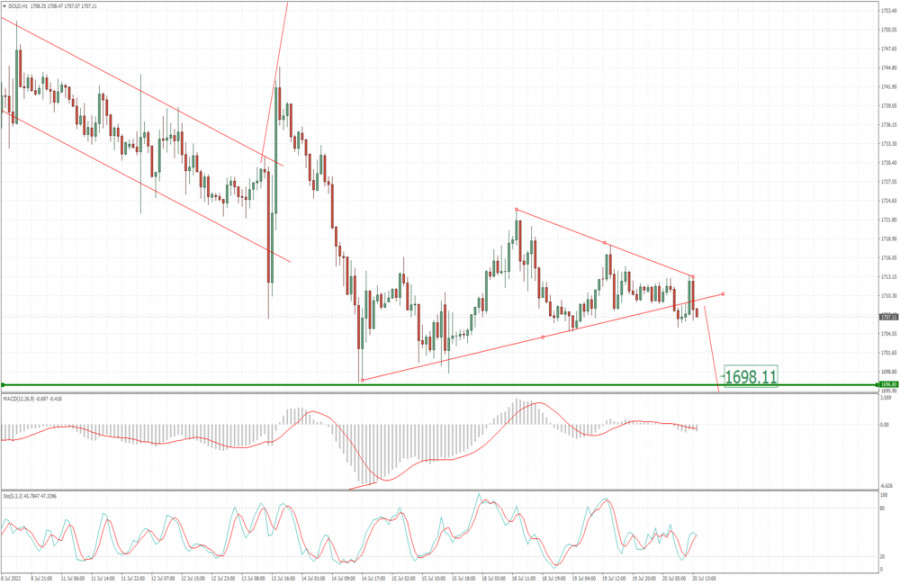
| Analysis of Gold for July 20,.2022 - Breakout of the triangle pattern to the downside Posted: 20 Jul 2022 04:15 AM PDT Technical analysis:
Gold has been trading downside today and I saw the breakout of the triangle pattern, which is good sign for further downside movement. Trading recommendation: Due to the breakout of the symmetrical triangle today, I see potential for fruther downside continuation of the bear trend in the background. Watch for potential selling opportunities on the intraday rallies with the downside objectives at the price of $1.698 and $1.681. Key resistance is set at the price of $1.721 The material has been provided by InstaForex Company - www.instaforex.com |
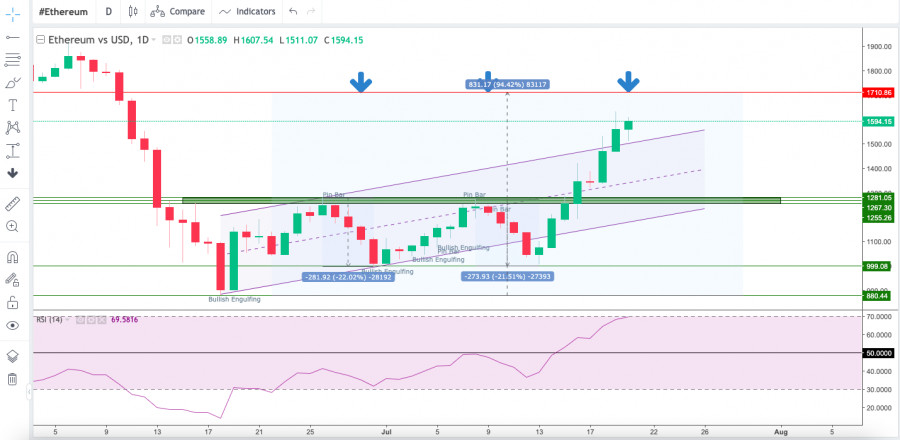
| Technical Analysis of ETH/USD for July 20, 2022 Posted: 20 Jul 2022 04:09 AM PDT Crypto Industry News: Ethereum went up by 48% on a 7-day scale. This is the result of waiting for the Merge, i.e. the network's transition to a new coin mining algorithm (blockchain will stop being Proof-of-Work and start on Proof-of-Stake). The bulls are already seeing the first signs that the downtrend is turning into an uptrend. Is it really so? Changes to the ETH network will reduce the energy consumption of the project's blockchain by more than 99%. However, they will not necessarily reduce transaction fees significantly. The latter will also be done by sharding, but it will not happen until next year. In any case, the Ether market is all green again. 1 ETH is $ 1,590, which is 48% more than a week ago. But let's take a look at a study by Finder, prepared before the last ether price rally. It shows that there are still many negative aspects to Ethereum. A panel of 54 industry experts judged that 1 ETH would be worth $ 1,711 by the end of 2022 and the price would rise to $ 5,739 by 2025. Then, by 2030, the rate will reach USD 14,412. However, analysts said the price would drop to USD 675 before the end of this year. Finder also adds that there are several macroeconomic factors that could cause further declines. The US Federal Reserve is expected to raise interest rates again by 75 basis points. This will happen during her meeting on July 26-27. Further increases in interest rates may already be in the valuation of cryptocurrencies, but there is a risk that this will lead to further drops in BTC and ETH in the short term. Technical Market Outlook: The ETH/USD pair had broken above the supply zone located between the levels of $1,255 - $1,281 and made a new local high at the level of $1,631. The momentum is at the level of 70 points already, so the bulls are now fully controlling the market, however the market conditions are now extremely overbought. The intraday technical support is seen on the level of $1,319 and $1,281. The larger time frame trend remains down, however the recent breakout might be a beginning of a bigger bounce even towards the level of $1,750.
Weekly Pivot Points: WR3 - $1,617 WR2 - $1,509 WR1 - $1,470 Weekly Pivot - $1,401 WS1 - $1,362 WS2 - $1,294 WS3 - $1,185 Trading Outlook: The down trend on the H4, Daily and Weekly time frames had broken below the key long term technical support seen at the level of $1,420 and bears continue to make new lower lows with no problem whatsoever. So far every bounce and attempt to rally is being used to sell Ethereum for a better price by the market participants, so the bearish pressure is still high. The next target for bears is located at the levels below $1,000, like the last swing low seen at $880. Please notice, the down trend is being continued for the 13th consecutive week now. The material has been provided by InstaForex Company - www.instaforex.com |
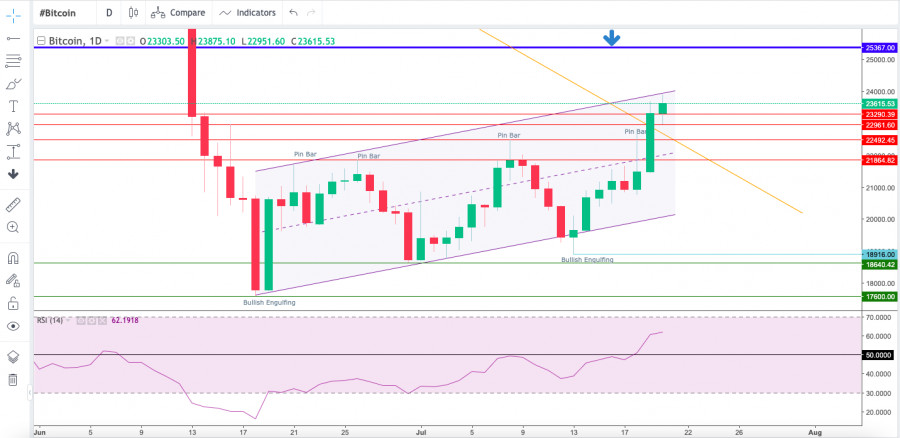
| Technical Analysis of BTC/USD for July 20, 2022 Posted: 20 Jul 2022 04:08 AM PDT Crypto Industry News: The results of a study by Forrester Consulting show that the use and awareness of Bitcoin in emerging markets in Africa, Latin America, the Middle East and Southeast Asia is growing. According to the survey, 74% of consumers in these markets were aware of Bitcoin, while 52% of respondents to the survey indicated that they noticed an increase in BTC use in their country over the past 12 months. Interestingly, 91% of respondents believe that Bitcoin can enable a digital future, especially when it comes to providing a payment and transfer platform that local banks may not be able to offer. The results indicate that despite recent price volatility, BTC use is likely to continue to grow as it fills the digital trading gap. The data from the survey talks about the potential 'jump' effect that occurs when users in emerging markets use Bitcoin for more daily transactions. Additional drivers of Bitcoin use in emerging markets include enabling consumers to gain financial independence, dissatisfaction with existing financial services, and the need for additional ways to make and receive payments or transfers. Technical Market Outlook: The BTC/USD pair has bounced strongly from the lows seen at $18,916 and is about to break out of the ascending channel. The last local high was made at the level of $23,835. In a case of further bounce extension, the next target is seen at the level of $25,367, which is the game changing level, but for a valid breakout, the daily candle must close above this level. The level of $21,867 will now act as a technical support for bulls. The larger time frame outlook for Bitcoin remains bearish, however, we have unconfirmed Bullish Engulfing pattern on the Daily time frame chart, so please stay focused and keep an eye on the key technical levels.
Weekly Pivot Points: WR3 - $23,780 WR2 - $22,629 WR1 - $22,245 Weekly Pivot - $21,487 WS1 - $21,094 WS2 - $20,326 WS3 - $19,175 Trading Outlook: The down trend on the H4, Daily and Weekly time frames continues. So far every bounce and attempt to rally is being used to sell Bitcoin for a better price by the market participants, so the bearish pressure is still high. The key long term technical support at the psychological level of $20,000 had been violated, the new swing low was made at $17,600 and if this level is violated, then the next long-term target for bulls is seen at $13,712. On the other hand, the gamechanging level for bulls is located at $25,367. The material has been provided by InstaForex Company - www.instaforex.com |
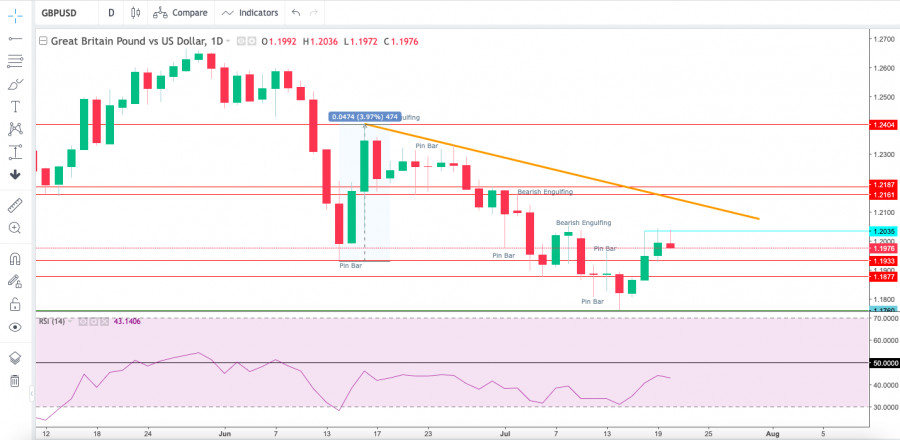
| Technical Analysis of GBP/USD for July 20, 2022 Posted: 20 Jul 2022 04:07 AM PDT Technical Market Outlook: The GBP/USD pair had bounced from the low made at the level of 1.1759 last week and the bulls are trying hard to rally towards the level of 1.1936 or even 1.2161. Nevertheless, the supply zone located between the levels of 1.2160 - 1.2187 is still the main short-term obstacle for bulls that needs to be broken if the rally is expected to be continued. The weak and negative momentum on the daily time frame chart still supports the bearish outlook and the next target for bears is located at the level of 1.1410.
Weekly Pivot Points: WR3 - 1.1965 WR2 - 1.1925 WR1 - 1.1904 Weekly Pivot - 1.1885 WS1 - 1.1864 WS2 - 1.1846 WS3 - 1.1806 Trading Outlook: The price broke below the level of 1.3000 quite long time ago, so the bears enforced and confirmed their control over the market in the long term. The Cable is way below 100 and 200 WMA , so the bearish domination is clear and there is no indication of trend termination or reversal. The bulls are now trying to start the corrective cycle after a big Pin Bar candlestick pattern was made on the weekly time frame chart, however there is no visible progress here yet. The next long term target for bears is seen at the level of 1.1410. Please remember: trend is your friend. The material has been provided by InstaForex Company - www.instaforex.com |
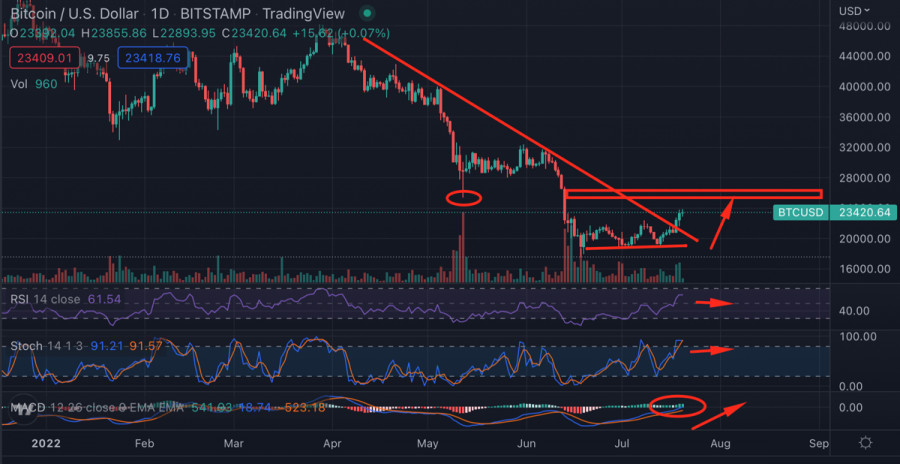
| Bitcoin updates local high: should we expect further upward movement? Posted: 20 Jul 2022 04:07 AM PDT Bitcoin continues its upward movement after the successful breakdown of the downward trend line. Bitcoin reached a local high at $23.6k, and unleashed its hands for the upward movement of the altcoin market. Together with Ethereum, BTC filled the market with liquidity, thanks to which the market capitalization broke through the $1 trillion mark. At the same time, there is an increase in trading volumes and the number of unique addresses in the Bitcoin network. The fear and greed index has reached 30, which indicates a surge of positivity in the market.
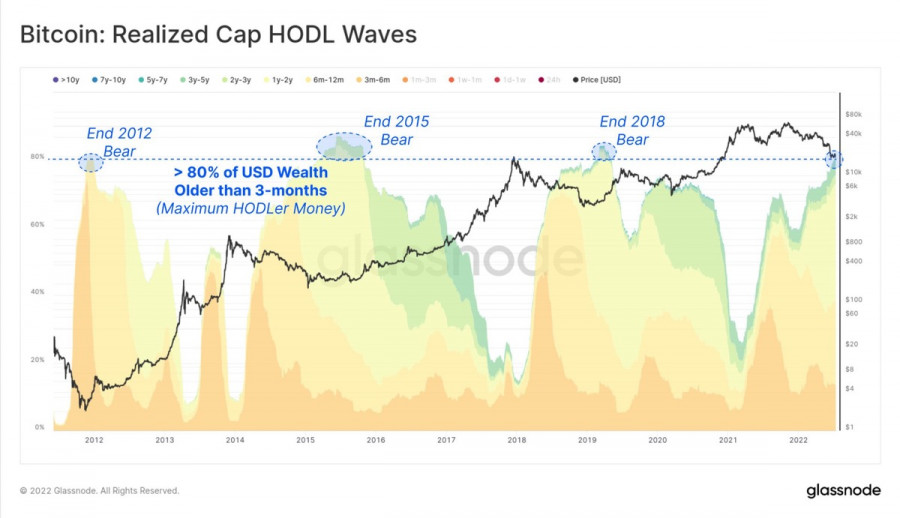
Glassnode's claim that around 80% of Bitcoin investments had been inactive for three months accompanied the market's overall upturn. Historically, this foreshadowed the formation of a local bottom and the end of the capitulation period of market players. The crypto community began to actively discuss the likely completion of the downward movement and the transition to the phase of positional growth.
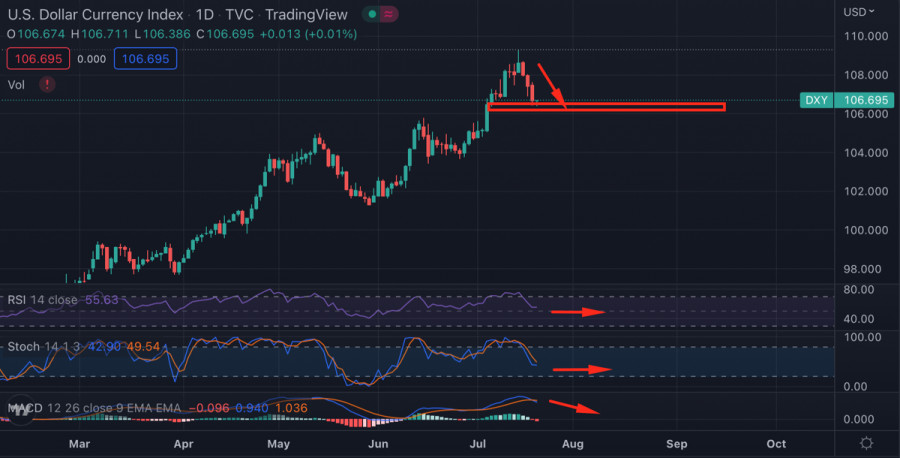
To figure out if everything is so joyful, you need to analyze the US dollar index. The upward movement of Bitcoin and the entire market would be impossible (or would be much more modest) if the DXY index was not in a correction. The dollar hit a 20-year high at 109 before starting to decline. The correction lasted three days, and as of July 20, DXY reached a strong support zone at 106. At the same time, technical indicators point to a gradual stabilization of the situation. The RSI index and stochastic are gaining flat dynamics, but the MACD continues to decline. These factors indicate that Bitcoin and other cryptocurrencies have room for upward movement.
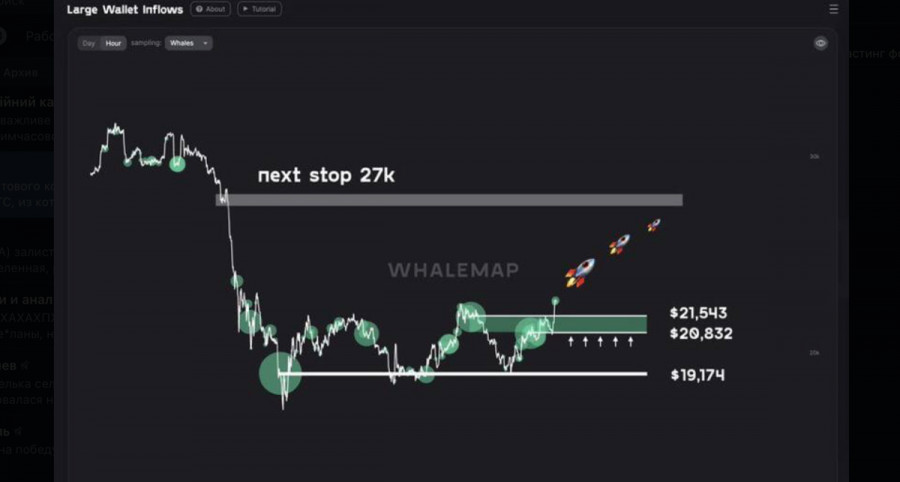
On the Bitcoin daily chart, we see the continuation of bullish signals despite the peaking of technical indicators. The asset broke through the descending trend line and reached $23.5k. Thus, the important area of $22.8k–$23k was broken, where large volumes of wallets with a balance of 1000 BTC were concentrated. Cryptocurrency takes a short pause to gain a foothold above an important resistance level, also indicated by the RSI index and the stochastic oscillator. The metrics have fully implemented the bullish momentum and started to move in a flat direction, indicating a local pause. At the same time, we do not see bearish volumes, indicating the likelihood of further upward movement.
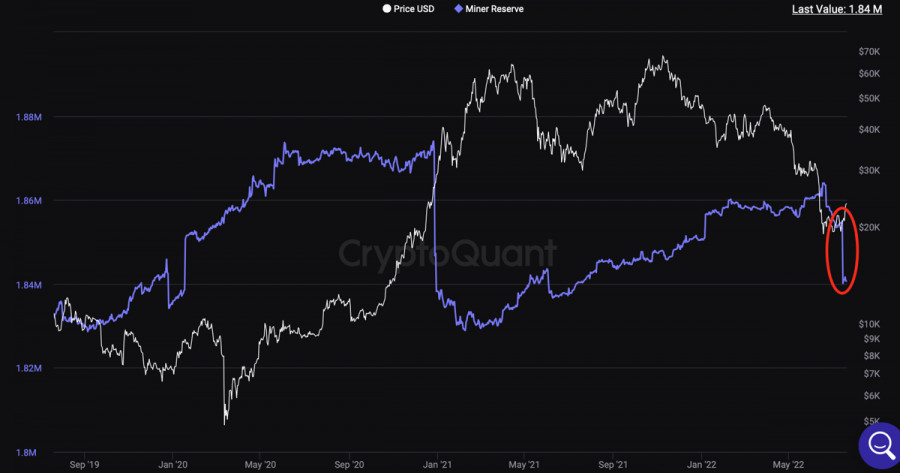
Despite the overall positive, several important factors indicate the imminent end of the bullish movement. The first and most obvious one is related to miners who sold 14,000 BTC just last week to get quick liquidity. It is important not to forget that mining companies have lost about 50% of their usual income, and the rise in the price of Bitcoin pushes them to sell coins to obtain the liquidity needed to reduce the credit burden.
Large investors have also started selling off their coins. Wallets with a balance of 1000 BTC have started selling their stocks since last week. The fourth largest "whale" has sent more than 15,000 BTC to the crypto exchange over the past two days, which put pressure on the price and slowed down the upward movement. The current accumulation rates are not enough to offset the influence of such a powerful factor. And the icing on the cake is the Fed meeting on July 26–27. About a week ago, the regulator was forced to launch a printing press to stabilize the exchange rates of EUR and other currencies. It means that at the next meeting, the Fed will have no choice but to raise the key rate by a record 100 basis points. It will strengthen the US dollar and the DXY index, which means the crypto market will lose liquidity again. The material has been provided by InstaForex Company - www.instaforex.com |
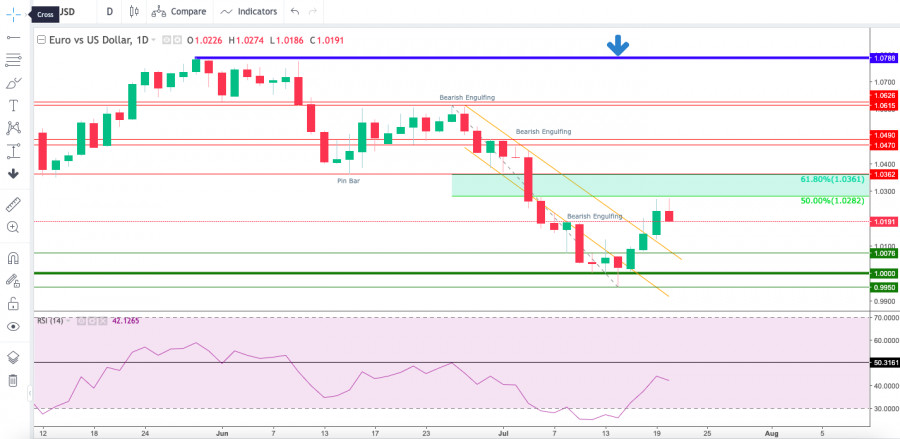
| Technical Analysis of EUR/USD for July 20, 2022 Posted: 20 Jul 2022 04:07 AM PDT Technical Market Outlook: The EUR/USD pair has bounced from the recent swing low made at the level of 0.9953 and almost retraced 50% of the last wave down. The recent higher high was made at the level of 1.0274, while the 50% Fibonacci retracement level is seen at 1.0282. The next technical resistance is seen at the level of 1.0362, the nearest technical support is located at the level of 1.0076 and 1.0000. The last biggest bounce had been capped at the supply zone seen between the levels of 1.0470 - 1.0490, since then all the bounces are shallower and used to short the EUR. The weak and negative momentum on the daily time frame supports the bearish outlook for EUR.
Weekly Pivot Points: WR3 - 1.0162 WR2 - 1.0127 WR1 - 1.0107 Weekly Pivot - 1.0093 WS1 - 1.0073 WS2 - 1.0059 WS3 - 1.0025 Trading Outlook: The market continues to move lower as the down trend is still strong and the monetary parity level is the first target for bears in the long term.Nevertheless, the bullish cycle scenario is confirmed only after a breakout above the level of 1.0726, otherwise the bears will push the price lower towards the next long-term target at the level of 1.0000 or below. The up trend can be continued towards the next long-term target located at the level of 1.1186 only if the complex corrective structure will terminate soon (above 1.0000). The material has been provided by InstaForex Company - www.instaforex.com |
| Posted: 20 Jul 2022 03:57 AM PDT GBPJPY:
The chart shows the movement of GBP/JPY in the four-hour (H4) chart. The advantage of cross-rates is their volatility and the ability to most accurately conduct a technical analysis of their dynamics. This review, for instance, attempts to calculate the local high of the pair, as well as the good price levels for buying and selling. Currently, the best area to enter the market is below 166.00, while the best level to exit (TP) is approximately 163.70. Set stop loss (SL) at 166.4 if the quote exceeds 166.4. That would mean that the trend will no longer turn around. The material has been provided by InstaForex Company - www.instaforex.com |
| Video market update for July 20, 2022 Posted: 20 Jul 2022 03:54 AM PDT Watch for selling opportunities on the Gold.... The material has been provided by InstaForex Company - www.instaforex.com |
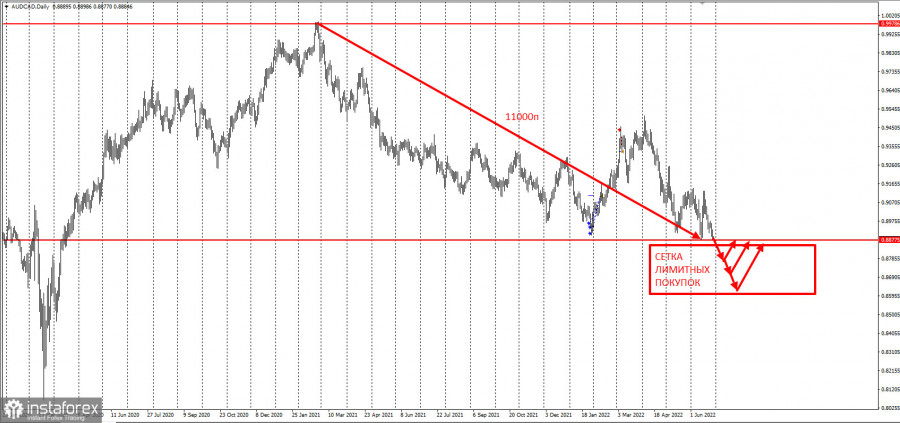
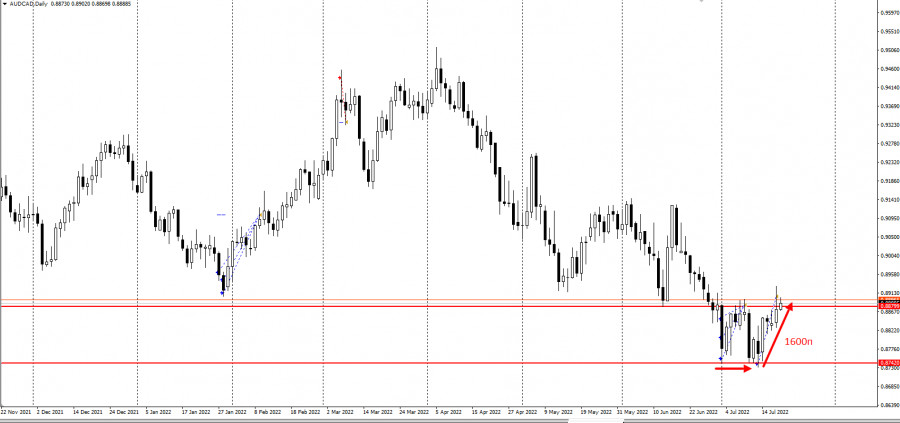
| Posted: 20 Jul 2022 03:50 AM PDT
June 29's trading plan projected an increase in AUD/CAD's quotes after the breakdown of 0.88800. The pair completed this move yesterday during the US session, which led to the closure of many long positions. Plan:
Development:
Huge congratulations to those who followed the strategy! The pair moved by as much as 1,500 pips. Now is the best time to close your positions. The strategy was based on the grid trading method, which is usually used on cross-rates. Good luck and have a nice day! The material has been provided by InstaForex Company - www.instaforex.com |
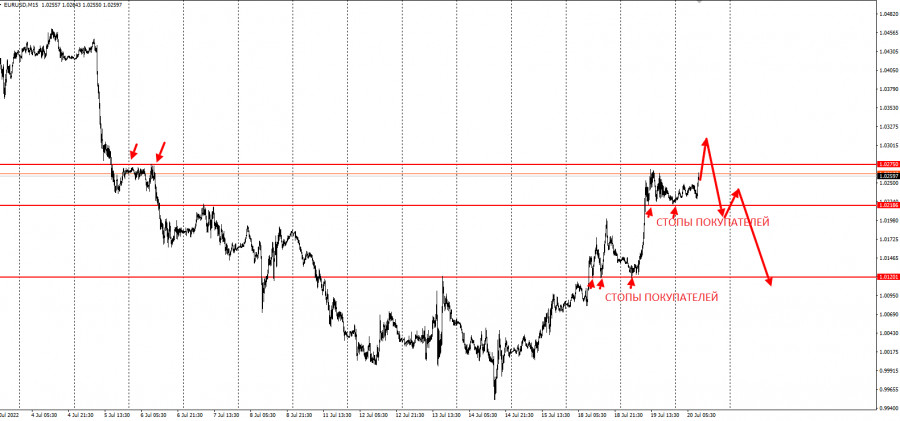
| Posted: 20 Jul 2022 03:42 AM PDT
EUR/USD continues to rally ahead of the ECB's decision over interest rates on Thursday. The price levels it approached looks to be excellent targets for sellers.
First of these is 1.02186, which is the low during yesterday's US session. The second one is 1.01200 - the low during July 18's US session and the daily low last July 19. The trading idea was based on the "Price Action" and "Stop Hunting" methods. Good luck and have a nice day! The material has been provided by InstaForex Company - www.instaforex.com |
| Forex forecast 07/20/2022 GBP/USD, GBP/JPY, USD/CAD, USDX and Oil and Ethereum from Sebastian Seliga Posted: 20 Jul 2022 03:40 AM PDT Let's take a look at the technical picture of GBP/USD, GBP/JPY, USD/CAD, USDX and Oil and Ethereum. The material has been provided by InstaForex Company - www.instaforex.com |
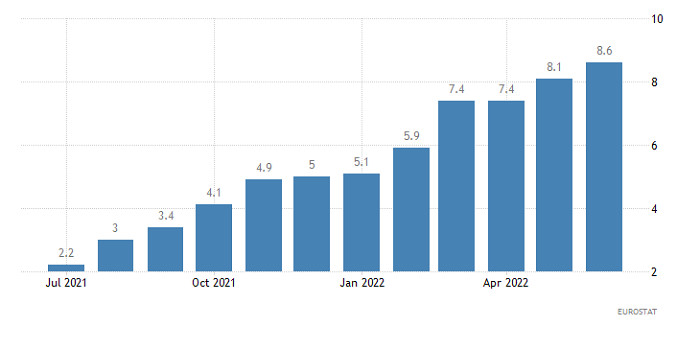
| Posted: 20 Jul 2022 03:34 AM PDT The US stock market continues to rally this week, putting pressure on the dollar, especially against other world currencies. It seems that investors are convinced that equities have already hit bottom, so they started purchasing in the hopes that there will be growth in the near future. This is despite the latest CPI report in the Euro area, which indicated a year-on-year growth from 8.1% to 8.6%, as well as widespread fears that the world economy will fall into recession. Yesterday's strong recovery of the DOW index by almost 755 points also indicates that the market is reassessing the overall situation in the face of good data during the reporting season. As mentioned earlier, the dollar turned down as soon as demand for stocks increased in the market. This is not surprising because the forex market has a tight connection with the stock market and government debt. But all this do not assure that stocks will continue to rally in the future, while the dollar will fall down. It is still early to make predictions because the Fed and other central banks could raise rates even more, and inflationary pressures in Europe, the US and other economically developed countries could continue to grow. After all, too-high inflation and too-high rates will lead to stagflation, which is bad for economies. Forecasts for today:
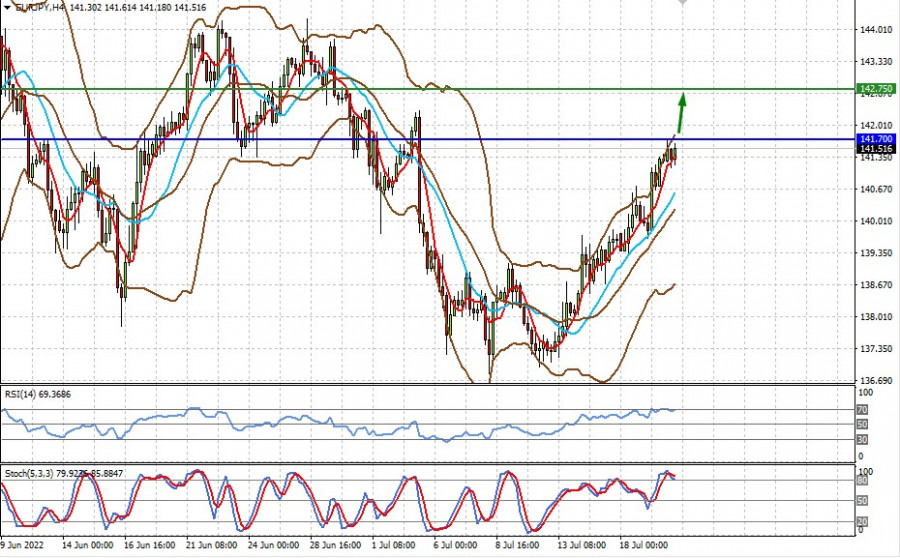
EUR/USD The pair is currently trading below 1.0250. If the rally continues, the price will reach 1.0365. EUR/JPY The pair has come close to the resistance level of 141.70. If the rally continues, it will go to 142.75. The ECB's decision to raise interest rates could play a major role in the pair, especially since the Bank of Japan has so far refrained from such a decision, which is clearly not in favor of yen. The material has been provided by InstaForex Company - www.instaforex.com |
| Tips for beginner traders in EUR/USD and GBP/USD on July 20, 2022 Posted: 20 Jul 2022 02:40 AM PDT Details of the economic calendar from July 19Data on the UK labor market came out not as bad as predicted. The unemployment rate remained at 3.8%, while forecast expected growth to 3.9%. Employment in the country increased by 296,000, while jobless claims fell by 20,000 in June. These became a catalyst for holding long positions on the pound sterling. The main event on Tuesday was the data on inflation in the EU, which again set a record. Consumer prices in the eurozone increased by 8.6% year-on-year in June. It is worth noting that inflation exceeds the ECB's target of 2% by more than four times. Thus, at the upcoming meeting of the ECB, the regulator is likely to raise interest rates. Analysis of trading charts from July 19The EURUSD currency pair broke through the resistance level of 1.0150 during the corrective movement. As a result, the market experienced a subsequent increase in the volume of long positions, which led to a prolonged correction. In less than a week, the euro has strengthened in value by more than 300 points. It is a strong price movement, which may lead to an overheating of long positions in the short term. The GBPUSD currency pair reached the psychological level of 1.2000 during the corrective movement, where it formed a stagnation within its borders. In fact, we still have a tight correlation between EURUSD and GBPUSD.
Economic calendar for July 20With the opening of the European session, data on inflation in the UK were published, which accelerated from 9.1% to 9.4%. It again indicates that the Bank of England may undertake a stronger increase in the interest rate at the upcoming meeting. Trading plan for EUR/USD on July 20Stagnation at the peak of the corrective course is a process of accumulation of trading forces. As a result, a new wave of speculation will arise in the market, where, based on the price consolidation points relative to stagnation, the subsequent course of the price will be clear. We concretize the above into trading signals: Buy positions on the currency pair should be considered after holding the price above the value of 1.0280 in a four-hour period. Sell positions should be considered after holding the price below 1.0200 in a four-hour period.
Trading plan for GBP/USD on July 20In this situation, the boundaries of the deviation of the psychological level 1.1950//1.2000//1.2050 are the focus of traders' attention. So, holding the price above the value of 1.2060 in a four-hour period will lead to a prolonged correction. Meanwhile, a price return below 1.1920 in a four-hour period may indicate a gradual recovery of dollar positions.
What is reflected in the trading charts?A candlestick chart view is graphical rectangles of white and black light, with sticks on top and bottom. When analyzing each candle in detail, you will see its characteristics of a relative period: the opening price, closing price, and maximum and minimum prices. Horizontal levels are price coordinates, relative to which a stop or a price reversal may occur. These levels are called support and resistance in the market. Circles and rectangles are highlighted examples where the price of the story unfolded. This color selection indicates horizontal lines that may put pressure on the quote in the future. The up/down arrows are the reference points of the possible price direction in the future. The material has been provided by InstaForex Company - www.instaforex.com |
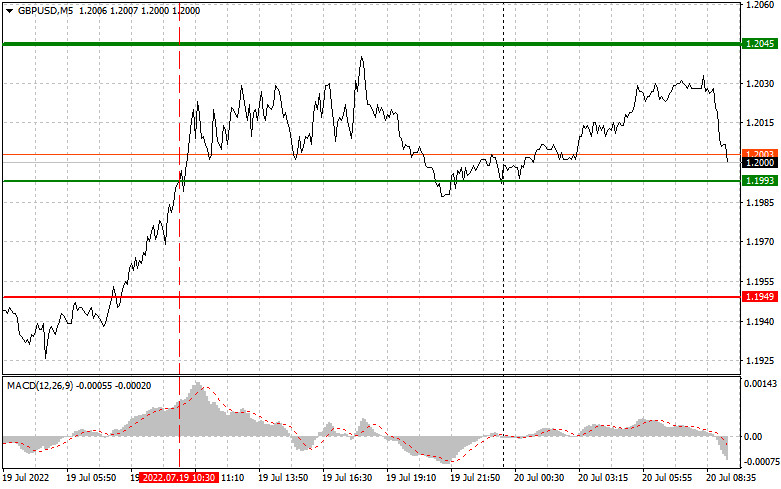
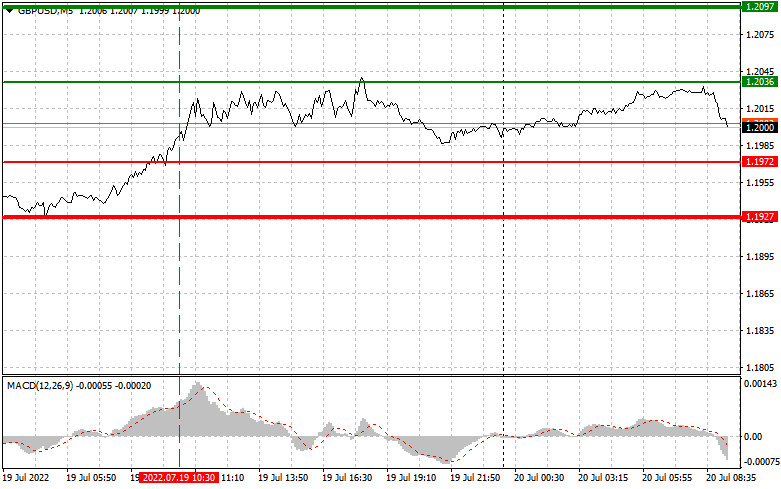
| Analysis and trading tips for GBP/USD on July 20 Posted: 20 Jul 2022 02:17 AM PDT Analysis of transactions in the GBP / USD pair When GBP/USD tested 1.1993, the MACD line was far from zero, so the upside potential was limited. Meanwhile, before the test of 1.2045, there were 3-4 pips missing, so sell-offs did not occur. No other signals appeared for the rest of the day.
Although the change in jobless claims in the UK was better than expected and the unemployment rate fell, there was a problem in average wages because the rate at which it was growing slowed down, making inflation-adjusted household incomes become lower. If reports continue to indicate a further rise in inflation, the crisis in the cost of living will exacerbate and the Bank of England will be forced to ramp up interest rates, which will slow the pace of economic growth. It will also mean that the upward potential of the pound will be limited. In the US, reports over the housing market and mortgage loans will be coming, but they are of little interest, so volatility will be fairly subdued. For long positions: Buy pound when the quote reaches 1.2036 (green line on the chart) and take profit at the price of 1.2097 (thicker green line on the chart). There is a chance for a rally today, but only if reactions to the UK inflation data are positive, which is unlikely. Take note that when buying, the MACD line should be above zero or is starting to rise from it. It is also possible to buy at 1.1972, but the MACD line should be in the oversold area as only by that will the market reverse to 1.2036 and 1.2097. For short positions: Sell pound when the quote reaches 1.1972 (red line on the chart) and take profit at the price of 1.1927. Pressure will return if strong inflationary pressures destroy the UK economy. Take note that when selling, the MACD line should be below zero or is starting to move down from it. Pound can also be sold at 1.2036, but the MACD line should be in the overbought area, as only by that will the market reverse to 1.1972 and 1.1927.
What's on the chart: The thin green line is the key level at which you can place long positions in the GBP/USD pair. The thick green line is the target price, since the quote is unlikely to move above this level. The thin red line is the level at which you can place short positions in the GBP/USD pair. The thick red line is the target price, since the quote is unlikely to move below this level. MACD line - when entering the market, it is important to be guided by the overbought and oversold zones. Important: Novice traders need to be very careful when making decisions about entering the market. Before the release of important reports, it is best to stay out of the market to avoid being caught in sharp fluctuations in the rate. If you decide to trade during the release of news, then always place stop orders to minimize losses. Without placing stop orders, you can very quickly lose your entire deposit, especially if you do not use money management and trade large volumes. And remember that for successful trading, you need to have a clear trading plan. Spontaneous trading decision based on the current market situation is an inherently losing strategy for an intraday trader. The material has been provided by InstaForex Company - www.instaforex.com |
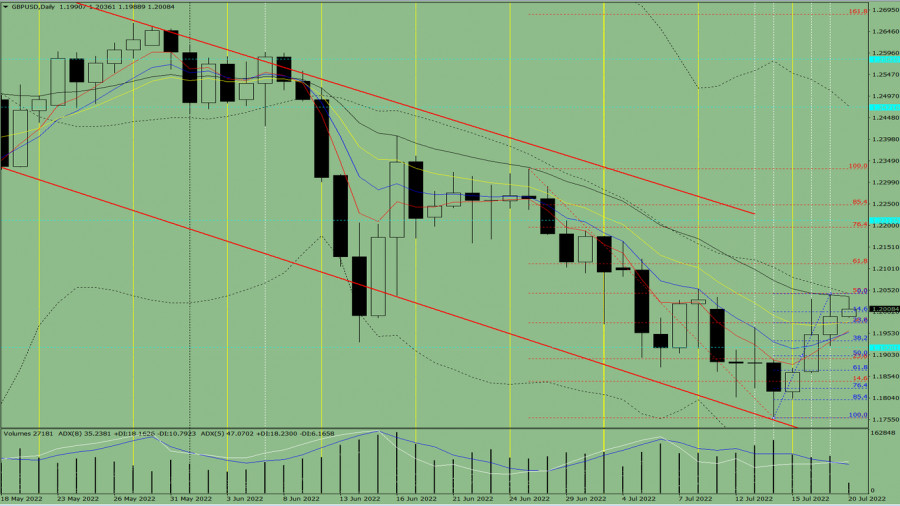
| Indicator analysis: Daily review of GBP/USD on July 20, 2022 Posted: 20 Jul 2022 02:11 AM PDT Trend analysis (Fig. 1). The pound-dollar pair may move downward from 1.1991 (close of yesterday's daily candle) to 1.1977, the 23.6% retracement level (blue dotted line). In the case of testing this level, an upward movement is possible with the target of 1.2112, the 61.8% retracement level (red dotted line). From this level, the price may move down.
Fig. 1 (daily chart). Comprehensive analysis:
General conclusion: Today, the price may move downward from 1.1991 (close of yesterday's daily candle) to 1.1977, the 23.6% retracement level (blue dotted line). In the case of testing this level, an upward movement is possible with the target of 1.2112, the 61.8% retracement level (red dotted line). From this level, the price may move down. Alternative scenario: from the level of 1.1991 (close of yesterday's daily candle), the price may move downward to 1.1935, the 38.2% retracement level (blue dotted line). In the case of testing this level, an upward movement is possible with the target of 1.2044, the 50.0% retracement level (red dotted line). From this level, the price may move up. The material has been provided by InstaForex Company - www.instaforex.com |
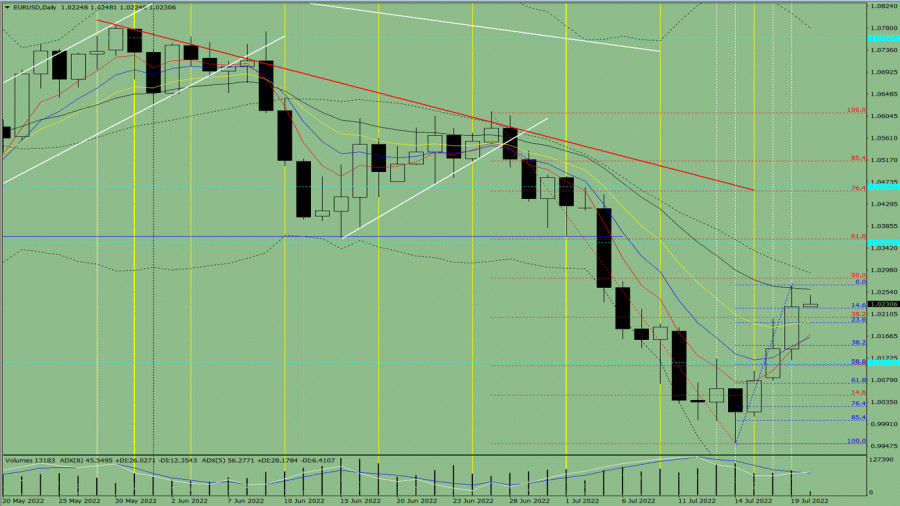
| Indicator analysis: Daily review of EUR/USD on July 20, 2022 Posted: 20 Jul 2022 02:01 AM PDT Trend analysis (Fig. 1). The euro-dollar pair may move downward from the level of 1.0225 (close of yesterday's daily candle) to 1.0193, the 23.6% retracement level (blue dotted line). After testing this level, the price may rise to 1.0282, the 50.0% retracement level (red dotted line). Upon reaching this level, continued upward movement is possible.
Fig. 1 (daily chart). Comprehensive analysis:
General conclusion: Today, the price may move downward from the level of 1.0225 (close of yesterday's daily candle) to 1.0193, the 23.6% retracement level (blue dotted line). After testing this level, the price may rise to 1.0282, the 50.0% retracement level (red dotted line). Upon reaching this level, continued upward movement is possible. Alternative scenario: from the level of 1.0225 (close of yesterday's daily candle), the price may move down with the target of 1.0222, the 14.6% retracement level (blue dotted line). After testing this level, an upward movement is possible with the target of 1.0282, the 50.0% retracement level (red dotted line). Upon reaching this level, the price may move up. The material has been provided by InstaForex Company - www.instaforex.com |
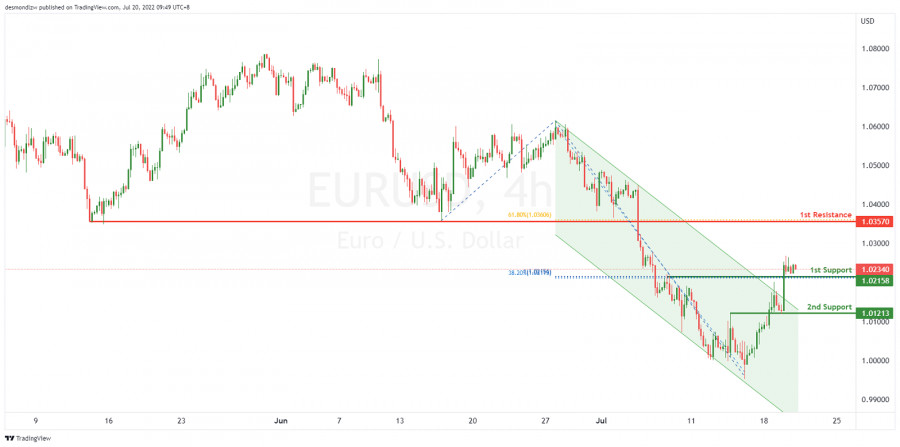
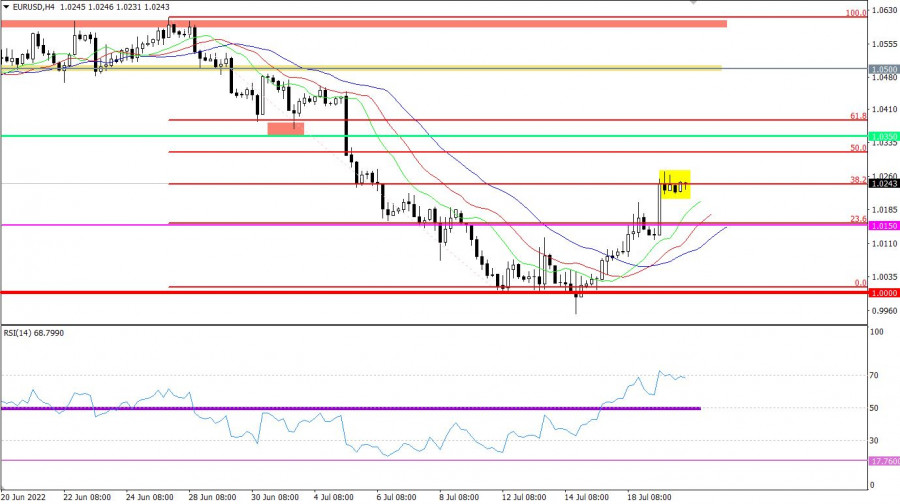
| EURUSD Potential For Bearish Continuation | 20th July 2022 Posted: 20 Jul 2022 01:36 AM PDT
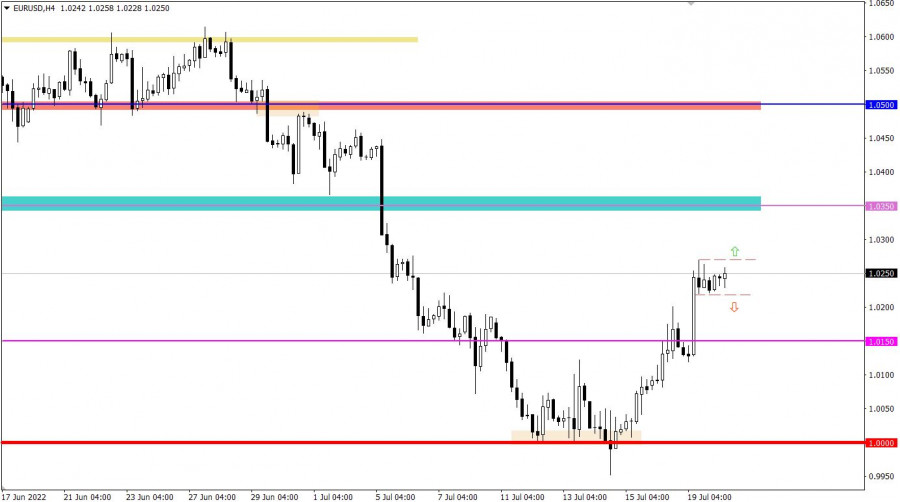
On the H4, with price recently breaking out of the descending trend channel, we have a bullish bias that price will continue to rise from the 1st support at 1.02158 in line with the 38.2% fibonacci retracement and 100% fibonacci projection to the 1st resistance at 1.03570 at the pullback resistance in line with the 61.8% fibonacci retracement. Alternatively, price may reverse off the 1st support and drop to the 2nd support at 1.01213 at the pullback support. Trading Recommendation Entry: 1.02158 Reason for Entry: 38.2% fibonacci retracement and 100% fibonacci projectionTake Profit: 1.03570 Reason for Take Profit:Pullback resistance in line with the 61.8% fibonacci retracement Stop Loss: 1.01213 Reason for Stop Loss: Pullback support The material has been provided by InstaForex Company - www.instaforex.com |
| GBPUSD Potential For Bullish Continuation | 20th July 2022 Posted: 20 Jul 2022 01:35 AM PDT
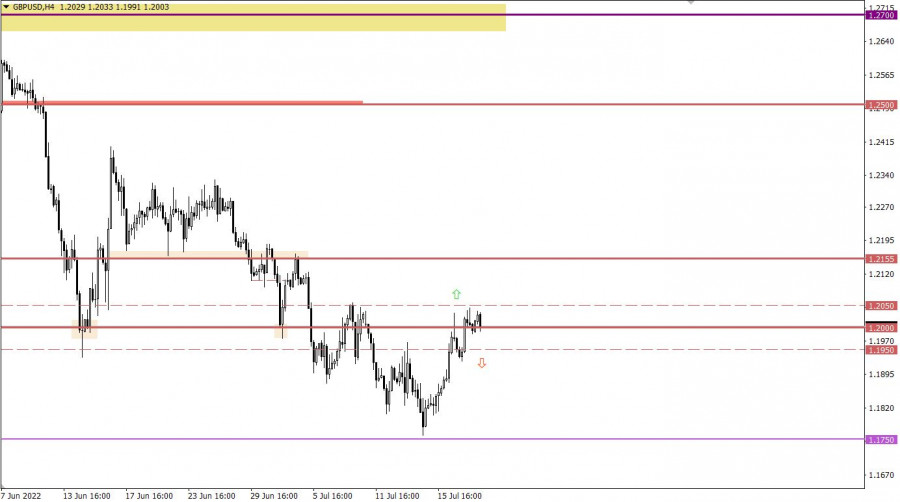
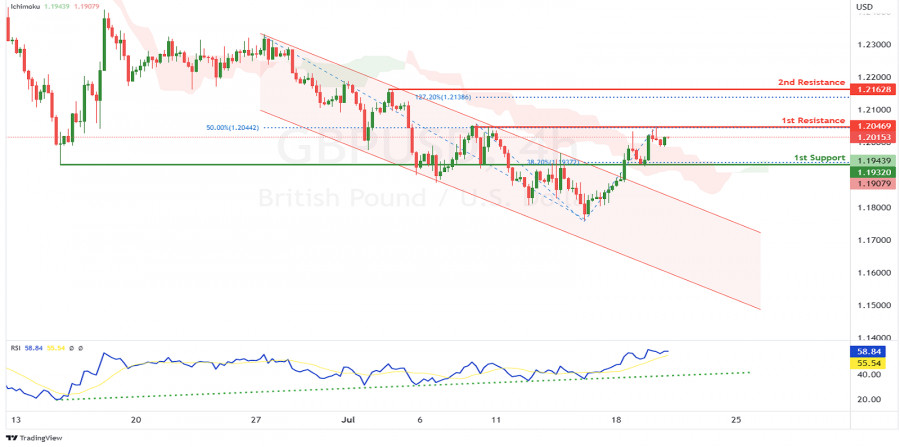
On the H4, with prices bouncing off the ichimoku indicator, RSI moving in an ascending trendline and price has broken out of the descending channel, we have a bullish bias that price will rise to the 1st resistance at 1.20469 where the 50% fibonacci retracement and swing high resistance are. Once there is upside confirmation that price has broken the 1st resistance, we would expect bullish momentum to carry prices to 2nd resistance at 1.21628 where the swing high resistance and 127.2% fibonacci extension are. Alternatively, price could drop to the 1st support at 1.19320 where the pullback support and 38.2% fibonacci retracement are. Trading Recommendation Entry: 1.20469 Reason for Entry: 50% fibonacci retracement and swing high resistance Take Profit: 1.21628 Reason for Take Profit:Swing high resistance and 127.2% fibonacci extension Stop Loss: 1.19320 Reason for Stop Loss: Pullback support and 38.2% fibonacci retracement The material has been provided by InstaForex Company - www.instaforex.com |
| BTCUSDT Potential For Bullish Continuation | 20th July 2022 Posted: 20 Jul 2022 01:31 AM PDT
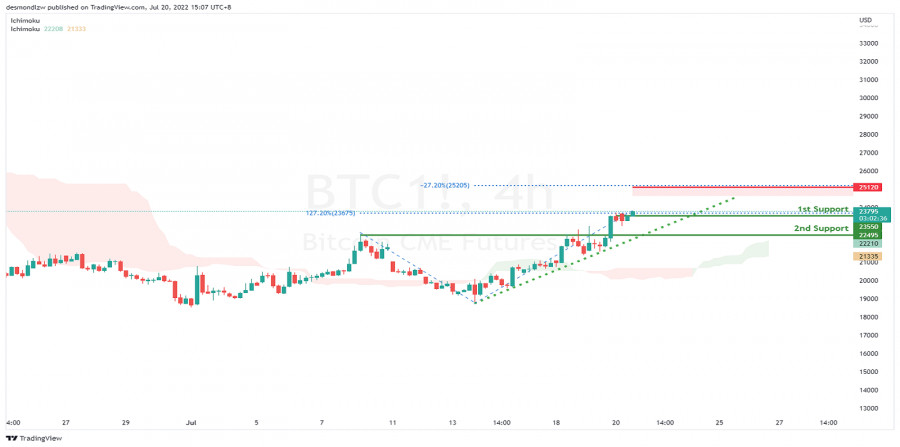
On the H4, with price moving in an ascending trendline and above ichimoku indicator , we have a bullish bias that price will rise from our 1st support at 23584.03 where is in line with the 127.2% fibonacci retracement to the 1st resistance at 24713.74 in line with the -27.2% fibonacci retracement. Alternatively, price may break the support structure at the 1st support and drop to the 2nd support at 22810.14, which is in line with the pullback support and 23.6% fibonacci retracement. Trading Recommendation Entry: 23584.03 Reason for Entry:127.2% fibonacci retracementTake Profit: 24713.74 Reason for Take Profit: -27.2% fibonacci retracement Stop Loss: 22810.14 Reason for Stop Loss: Pullback support and 23.6% fibonacci retracement The material has been provided by InstaForex Company - www.instaforex.com |
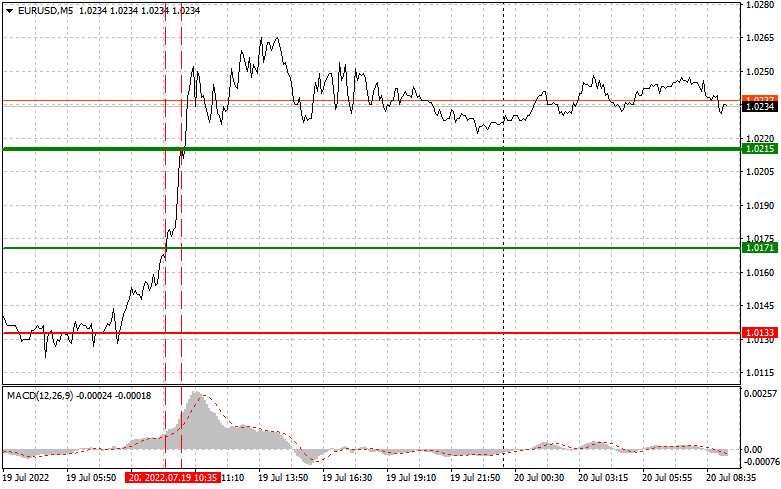
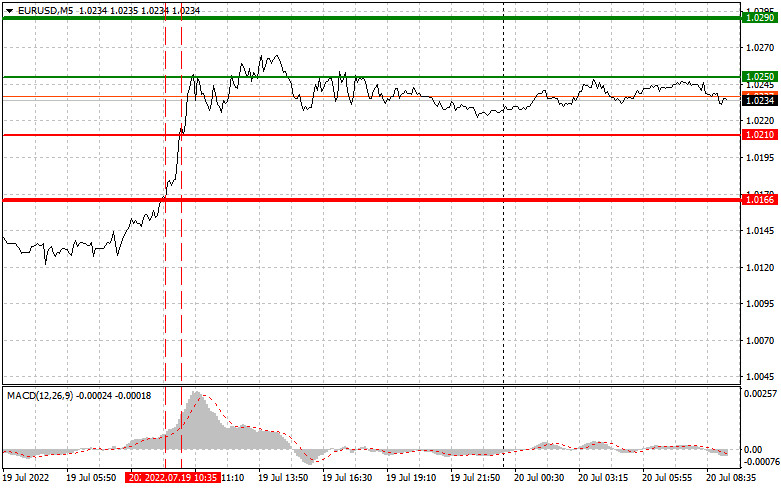
| Analysis and trading tips for EUR/USD on July 20 Posted: 20 Jul 2022 01:21 AM PDT Analysis of transactions in the EUR / USD pair When EUR/USD tested 1.0171, the MACD line was far from zero, so the upside potential was limited. Likewise, when it tested 1.0215, there were only losses. No other signals appeared for the rest of the day.
Given that the rate at which consumer prices are growing was better than expected, demand for euro rose, leading to an increase in EUR/USD quotes yesterday. Meanwhile, data on issued building permits in the US and volume of construction of new homes were ignored, so the dollar did not have any chance to rally in the market. However, today, there are no important statistics that could extend the growth of the euro, so expect some downward correction in the pair. Upcoming reports over the US housing market and mortgage loans are also of little interest, so volatility should be fairly subdued. For long positions: Buy euro when the quote reaches 1.0250 (green line on the chart) and take profit at the price of 1.0290 (thicker green line on the chart). There is a chance for a rally today, but only if reports on Germany and the Euro area exceed expectations. Take note that when buying, the MACD line should be above zero or is starting to rise from it. Euro can also be bought at 1.0210, but the MACD line should be in the oversold area as only by that will the market reverse to 1.0250 and 1.0290. For short positions: Sell euro when the quote reaches 1.0210 (red line on the chart) and take profit at the price of 1.0166. However, pressure will return only after an unsuccessful attempt to consolidate at weekly highs. Take note that when selling, the MACD line should be below zero or is starting to move down from it. Euro can also be sold at 1.0250, but the MACD line should be in the overbought area, as only by that will the market reverse to 1.0210 and 1.0166.
What's on the chart: The thin green line is the key level at which you can place long positions in the EUR/USD pair. The thick green line is the target price, since the quote is unlikely to move above this level. The thin red line is the level at which you can place short positions in the EUR/USD pair. The thick red line is the target price, since the quote is unlikely to move below this level. MACD line - when entering the market, it is important to be guided by the overbought and oversold zones. Important: Novice traders need to be very careful when making decisions about entering the market. Before the release of important reports, it is best to stay out of the market to avoid being caught in sharp fluctuations in the rate. If you decide to trade during the release of news, then always place stop orders to minimize losses. Without placing stop orders, you can very quickly lose your entire deposit, especially if you do not use money management and trade large volumes. And remember that for successful trading, you need to have a clear trading plan. Spontaneous trading decision based on the current market situation is an inherently losing strategy for an intraday trader. The material has been provided by InstaForex Company - www.instaforex.com |
| Hot forecast for EUR/USD on 20/07/2022 Posted: 20 Jul 2022 12:11 AM PDT The single European currency quite easily exceeded 1.0200, so the local correction can be considered complete. At the same time, the market basically ignored the data on inflation in the euro area, although the growth rate of consumer prices accelerated from 8.1% to 8.6%. But the fact is that the final data was published yesterday, which only confirmed the preliminary assessment. So there is nothing new in these data. Inflation (Europe):
Today, we don't have any report that could somehow seriously affect the market. Moreover, the meeting of the board of the European Central Bank will take place tomorrow, and investors clearly do not intend to take risks. Although the issue of raising the refinancing rate is generally considered closed, there is some uncertainty about the ECB's succeeding actions. Much will depend on the subsequent statements of ECB President Christine Lagarde. And the most important issue is the pace and scale of the interest rate hike. They will determine not only the scale of growth of the single currency right at the moment, but also the direction of the market in the medium term. The results of tomorrow's meeting will determine the mood of investors for the coming year. So it is not surprising that the market is now frozen in place. Investors do not intend to take risks without a reason. The EURUSD currency pair managed to overcome the resistance level of 1.0150 during the corrective movement. As a result, a subsequent increase in the volume of long positions appeared on the market, which led to the prolongation of the current correction. In less than a week, the euro has appreciated in value by more than 300 points. This is a strong price move that could well lead to overheating of long positions in the short term. The technical instrument RSI H4 is moving within the oversold zone, which indicates that long positions are overheated. RSI D1 approached the middle line 50 during the correction. There is no signal about the transition to the elongated correction mode. The moving MA lines on the Alligator H4 indicators are directed upwards, which corresponds to a corrective move. Alligator D1 ignores intraday reversals. The medium-term trend is still downward.
Expectations and prospects Stagnation at the peak of a corrective move is a process of accumulation of trading forces. As a result, a new wave of speculation will appear on the market, where, based on the price fixation points relative to stagnation, the subsequent price movement will be clear. We concretize the above into trading signals: Long positions on a currency pair are taken into account after keeping the price above the value of 1.0280 in a four-hour period. Shorts should be considered after keeping the price below 1.0200 in a four-hour period. Complex indicator analysis has a variable signal in the short term due to stagnation. Indicators in the intraday period signal a long due to the current corrective move. Technical instruments in the medium term give a sell signal due to a downward trend. The material has been provided by InstaForex Company - www.instaforex.com |


| You are subscribed to email updates from Forex analysis review. To stop receiving these emails, you may unsubscribe now. | Email delivery powered by Google |
| Google, 1600 Amphitheatre Parkway, Mountain View, CA 94043, United States | |


Comments