Forex analysis review
Forex analysis review |
- Forecast and trading signals for GBP/USD for July 22. COT report. Detailed analysis of the pair's movement and trade deals.
- Forecast and trading signals for EUR/USD for July 22. COT report. Detailed analysis of the pair's movement and trade deals.
- Forecast for EUR/USD on July 22, 2022
- Forecast for GBP/USD on July 22, 2022
- Forecast for USD/JPY on July 22, 2022
- How to trade GBP/USD on July 22? Simple tips for beginners.
- How to trade EUR/USD on July 22? Simple tips for beginners.
- EUR/USD. The results of the July ECB meeting: hawkish, vague prospects
- The euro will plunge into chaos
- EUR/USD. Euro's winter dream on a summer night: the ECB should try very hard to help the single currency
- NZD/USD: Commodity currencies decline against the dollar
- European stocks start falling
- Technical analysis of AUD/USD for July 21, 2022
- BTC/USD retests buyers
- GBP/USD trapped within range
- USD/JPY crashes but buyers still in game
- Trading Signal for Gold (XAU/USD) for July 21 - 22, 2022: buy above $1,706 (3/8 Murray - 21 SMA)
- EUR/USD erasing today's gains after ECB shock
- July 21, 2022 : EUR/USD daily technical review and trading opportunities.
- July 21, 2022 : EUR/USD Intraday technical analysis and trading plan.
- July 21, 2022 : GBP/USD Intraday technical analysis and significant key-levels.
- GBP/USD analysis on July 21. Scotland has appealed to the Supreme Court to allow the referendum to be held.
- EUR/USD analysis on July 21. The ECB did not stand on ceremony and raised the rate by 50 basis points.
- BTC declines sharply after previous dramatic rise
- Tesla has sold about 75% of its bitcoins
| Posted: 21 Jul 2022 09:57 PM PDT GBP/USD 5M
The GBP/USD currency pair continued to trade almost identically to the EUR/USD pair on Thursday. Even at the time when the results of the European Central Bank meeting were announced, which had nothing to do with the pound, both pairs showed the same movements. By the end of the day, the pound managed to stay above the lines of the Ichimoku indicator, so formally the upward trend continues. At the same time, the pair failed to overcome the level of 1.2033 three times, so further upward movement is a big question. Now we need the price to get out of the horizontal channel between the Kijun-sen line and the level of 1.2033. No important report from either the US or the UK on Thursday. However, as we can see, this did not prevent traders from being active. The pound continues to follow the euro with might and main, which really raises big questions. There were plenty of trading signals on Thursday. The price overcame the Senkou Span B line area even at the European trading session - the level of 1.1974, having formed a sell signal. After that, it dropped to the critical line, from which it rebounded and formed a buy signal. Shorts should be closed on this signal and longs opened. Unfortunately, as part of the upward movement, the pair failed to reach the nearest target level of only 4 points, after which it returned to the critical line. Therefore, the long position was closed at breakeven by Stop Loss. A new buy signal was formed during the announcement of the results of the ECB meeting and traders would not have had time to work it out, even if they wanted to. The next sell signal was formed again in the area of 1.1974-1.1985, after which the quotes went even below the critical line. And the shorts should have been closed after consolidating above the Kijun-sen line, also in profit. The last buy signal near the critical line was also workable, and it also allowed traders to earn profit, as the price managed to ideally rise to the level of 1.1974. The rebound from 1.1974 should not have been worked out, since this signal was formed rather late. In total, it was possible to earn about 80 points on Thursday. COT report:
The latest Commitment of Traders (COT) report on the British pound again showed insignificant changes. During the week, the non-commercial group closed 5,700 longs and 2,800 shorts. Thus, the net position of non-commercial traders increased by 2,900. But what does it matter if the mood of the big players still remains "pronounced bearish", which is clearly seen in the second indicator in the chart above? And the pound, in spite of everything, still cannot show even a tangible upward correction? The net position fell for three months, then grew for some time, but what's the difference if the British currency still continues to depreciate against the US dollar? We have already said that the COT reports do not take into account the demand for the dollar, which is probably still very high right now. Therefore, even for the strengthening of the British currency, the demand for it must grow faster and stronger than the demand for the dollar. The non-commercial group currently has a total of 93,000 shorts open and only 34,000 longs. The net position will have to show growth for a long time to at least equalize these figures. Neither macroeconomic statistics nor fundamental events support the UK currency. As before, we can only count on corrective growth, but we believe that in the medium term, the pound will continue to fall. We recommend to familiarize yourself with:Overview of the EUR/USD pair. July 22. The ECB is the last of the major central banks to join the fight against inflation. Overview of the GBP/USD pair. July 22. Elections in the UK: two candidates left. Forecast and trading signals for EUR/USD on July 22. Detailed analysis of the movement of the pair and trading transactions. GBP/USD 1H
The pound is desperately trying to maintain an upward trend and stay above the lines of the Ichimoku indicator. If it succeeds, then it will be possible to count on another test of the level of 1.2033. Otherwise, the downward trend will resume. We highlight the following important levels for July 22: 1.1807, 1.1874, 1.1974, 1.2033, 1.2106, 1.2175. The Senkou Span B (1.1907) and Kijun-sen (1.1925) lines can also be sources of signals. Signals can be "rebounds" and "breakthrough" of these levels and lines. The Stop Loss level is recommended to be set to breakeven when the price passes in the right direction by 20 points. Ichimoku indicator lines can move during the day, which should be taken into account when determining trading signals. The chart also contains support and resistance levels that can be used to take profits on trades. Indexes of business activity in the services and manufacturing sectors will be published in the UK and the US, which will be able to provoke a market reaction only if they turn out to be much lower than forecasts. A report on retail sales will also be released in the UK, which is about the same degree of importance as the indices. Explanations for the chart:Support and Resistance Levels are the levels that serve as targets when buying or selling the pair. You can place Take Profit near these levels. Kijun-sen and Senkou Span B lines are lines of the Ichimoku indicator transferred to the hourly timeframe from the 4-hour one. Support and resistance areas are areas from which the price has repeatedly rebounded off. Yellow lines are trend lines, trend channels and any other technical patterns. Indicator 1 on the COT charts is the size of the net position of each category of traders. Indicator 2 on the COT charts is the size of the net position for the non-commercial group. The material has been provided by InstaForex Company - www.instaforex.com |
| Posted: 21 Jul 2022 09:53 PM PDT EUR/USD 5M
The EUR/USD pair showed an enviable "swing" on Thursday, which, however, did not surprise anyone. From the very beginning of the week, we have been saying that the European Central Bank meeting could provoke strong movements, and most importantly, unpredictable movements. However, in reality, we received not only unpredictable movements, we also received a surprise from the ECB in the form of a rate hike by 0.5% at once. Recall that this was the least likely of the two options. However, as we see, the ECB decided on such a decision, which was supposed to provoke the euro's growth. It provoked it, but only for a very short period of time, afterwards the euro collapsed. Why did it happen? We don't even bother to try to figure it out, because it doesn't make any sense. Very often, after the meetings of the central banks, we see such movements that it would be impossible to imagine before the meeting. And yesterday's meeting was no exception. Thus, the euro remains close to its local highs, in close proximity to 20-year lows and has failed to overcome the level of 1.0269 three times. If the Ichimoku indicator lines are broken, then the long-term downward trend will resume. As for trading signals, everything was complicated on Thursday. Let's start with the fact that the movements were quite calm in the first half of the day. Only one signal was formed, and even that one was false, since the price could not fall to the critical line. But the short position was still closed at breakeven by Stop Loss. Then a buy signal was formed near the Senkou Span B line, but it was formed at the time when the ECB announced the results of the meeting. Therefore, it was not necessary to take risks and work it out. Then there was a good signal near the critical line, which could earn a couple of tens of points, but all subsequent signals near the Senkou Span B line should have been ignored, since the first two turned out to be false. COT report:
Commitment of Traders (COT) reports on the euro over the past six months have raised a huge number of questions. The chart above clearly shows that they showed a blatant bullish mood of commercial players, but at the same time, the euro was falling. At this time, the situation has changed, and NOT in favor of the euro. If earlier the mood was bullish, but the euro was falling, now the mood has become bearish and... the euro is also falling. Therefore, for the time being, we do not see any grounds for the euro's growth, because the vast majority of factors remain against it. During the reporting week, the number of long positions increased by 100, and the number of shorts in the non-commercial group increased by 8,500. Accordingly, the net position decreased again, by almost 8,500 contracts. The mood of the big players remains bearish and has even increased slightly in recent weeks. From our point of view, this fact very eloquently indicates that at this time even commercial traders do not believe in the euro. The number of longs is lower than the number of shorts for non-commercial traders by 25,000. Therefore, we can state that not only the demand for the US dollar remains high, but also the demand for the euro is quite low. This may lead to a new, even greater fall of the euro. In principle, over the past few months or even more, the euro has not been able to show even a tangible correction, not to mention something more. The highest upward movement was about 400 points. We recommend to familiarize yourself with:Overview of the EUR/USD pair. July 22. The ECB is the last of the major central banks to join the fight against inflation. Overview of the GBP/USD pair. July 22. Elections in the UK: two candidates left. Forecast and trading signals for GBP/USD on July 22. Detailed analysis of the movement of the pair and trading transactions. EUR/USD 1H
The nature of the pair's movement from yesterday is clearly visible on the hourly timeframe. We even fear that now a flat may begin between the Kijun-sen line and the level of 1.0269. Formally, the euro may continue to grow, as it continues to settle above the lines of the Ichimoku indicator. We highlight the following levels for trading n Friday - 1.0000, 1.0072, 1.0120, 1.0269, 1.0340-1.0366, 1.0485, as well as Senkou Span B (1.0113) and Kijun lines -sen (1.0160). Ichimoku indicator lines can move during the day, which should be taken into account when determining trading signals. There are also secondary support and resistance levels, but no signals are formed near them. Signals can be "rebounds" and "breakthrough" extreme levels and lines. Do not forget about placing a Stop Loss order at breakeven if the price has gone in the right direction for 15 points. This will protect you against possible losses if the signal turns out to be false. Indexes of business activity will be published in the US and the European Union. If one or more indexes fall below the critical level of 50.0, this may provoke a market reaction. Explanations for the chart:Support and Resistance Levels are the levels that serve as targets when buying or selling the pair. You can place Take Profit near these levels. Kijun-sen and Senkou Span B lines are lines of the Ichimoku indicator transferred to the hourly timeframe from the 4-hour one. Support and resistance areas are areas from which the price has repeatedly rebounded off. Yellow lines are trend lines, trend channels and any other technical patterns. Indicator 1 on the COT charts is the size of the net position of each category of traders. Indicator 2 on the COT charts is the size of the net position for the non-commercial group. The material has been provided by InstaForex Company - www.instaforex.com |
| Forecast for EUR/USD on July 22, 2022 Posted: 21 Jul 2022 08:25 PM PDT Yesterday, the European Central Bank raised the main rate from 0.00% to 0.50%. Preliminary preparation of the market through the media was successful - by now the euro is at the level of the ECB release - market participants were not inspired by this decision. As a result, we observe the traditional market rule - if the asset does not grow, then it will fall.
For a medium-term fall of the euro, you need to go under the support level of 1.0150. Targets will open: 1.0020, 0.9950, 0.9850. The Marlin Oscillator is turning down on its approach to the neutral zero level. The signal line of the oscillator fits into the framework of the descending channel.
The price is still above the balance and MACD indicator lines on the H4 chart. The MACD line already cancels the intention to turn up, now it is moving horizontally. The Marlin Oscillator, after sharp fluctuations above the zero line, breaks it down. We are waiting for further development of the euro's downward movement. Supports: 1.0150, 1.0092, 1.0020, 0.9950. The material has been provided by InstaForex Company - www.instaforex.com |
| Forecast for GBP/USD on July 22, 2022 Posted: 21 Jul 2022 08:25 PM PDT The pound fluctuated in a range of 112 points due to the European Central Bank's decision to raise rates by 0.50%, closing the day up 24 points. Now the price is in Tuesday's range and by its nature intends to resume the decline.
The MACD indicator line goes under the target level of 1.2100 on the daily timeframe, which indicates a very low probability of the price working it out. The Marlin Oscillator is turning down in front of the zero line. The target is the 1.1800 level, followed by the 1.1660 target.
The price reverses to a repeated attack of the support of the MACD line (1.1919) on the four-hour chart. Leaving the area under it opens the first target at 1.1800. The signal line of the Marlin Oscillator, after a short-term consolidation at the zero line, went into negative territory. The pressure on the price intensifies. The material has been provided by InstaForex Company - www.instaforex.com |
| Forecast for USD/JPY on July 22, 2022 Posted: 21 Jul 2022 08:25 PM PDT Yesterday, the USD/JPY pair tried to overcome the resistance of the embedded price channel line (138.88), but the attempt failed due to fluctuations in adjacent currencies at the European Central Bank meeting, which raised the base rate by 0.50%. The dollar was not even supported by the dovish mood of the Bank of Japan, whose meeting was held on the same day and kept the monetary policy unchanged with soft speeches by the head of the central bank, Haruhiko Kuroda.
The pair eventually fell by 90 points and even pierced the support of the nearby line of the price channel (137.55). But in today's Asian session the price returns to the area above 137.55 and is preparing for another attack on the resistance at 138.88. The Marlin Oscillator will help the price, which is turning up from the zero line - from the border with the downward trend area. If the price goes above 138.88, a target opens along the next parallel channel line at 140.70.
The price is settled below the MACD line on the four-hour chart, which creates some difficulties for growth. Also, the Marlin Oscillator has not yet left the downward trend zone. Therefore, a confirming sign of the sufficient strength of the dollar to continue the growth will be the exit of the price above the MACD line, above the level of 138.00. If the growth is suppressed, then the price will be able to recover at the MACD line of the daily scale, at the level of 136.25 (or slightly lower, closer to the price channel line). The material has been provided by InstaForex Company - www.instaforex.com |
| How to trade GBP/USD on July 22? Simple tips for beginners. Posted: 21 Jul 2022 02:40 PM PDT Analysis of Thursday's deals:30M chart of the GBP/USD pair
The GBP/USD pair also traded rather volatile and in different directions on Thursday. Moreover, the pound did not have sufficient grounds for this. If the results of the European Central Bank meeting were just announced in the European Union, which is always important, and later ECB President Christine Lagarde had a press conference, then in the UK, there was nothing interesting. Thus, it is a mystery why the British pound showed similar movements. However, the pound also consolidated below the rising trend line a day earlier, so the upward trend has been reversed here as well. And this is also a moment that raises questions. Recall that the euro and the pound have been demonstrating some fantastic level of correlation with each other in recent months, although the fundamental and macroeconomic backgrounds for the two pairs often differ. Since the British pound failed to overcome the important level of 1.2033 with three attempts (as well as the euro/dollar pair!!!), its further growth prospects also remain very vague. We are inclined to believe that the euro and the pound will resume their decline in the near future. The calendar of macroeconomic events was also empty in the US, except for the ordinary report on applications for unemployment benefits. 5M chart of the GBP/USD pair
The movement and signals on the 5-minute timeframe were also quite attractive on Thursday. But not everything is so clear. The first sell signal was formed near the level of 1.1967 and after it was formed the price went down 33 points. This was enough to place a Stop Loss order at breakeven, at which the deal was closed, since the target level of 1.1898 was not reached. Then another sell signal formed near the same level, also false, and also closed at Stop Loss at breakeven. Since by the time the signal to buy was formed near the level of 1.1898, two false signals had already formed, all subsequent ones should not have been worked out. Thus, novice players could open a deal only on a buy signal near the level of 1.1898, which allowed them to make good money in the end. The price went up about 60 points after this signal was formed and reached the level of 1.1967. Profit on this transaction amounted to about 40 points. How to trade on Friday:The pair has already managed to cancel the upward trend on the 30-minute timeframe and can now resume a long-term downward trend, which is best seen on higher timeframes. This week, bulls on the British pound have shown that they are not ready for serious long positions, so the pair could likely fall. On the 5-minute TF on Friday it is recommended to trade at the levels 1.1807-1.1827, 1.1898, 1.1967, 1.2033, 1.2106, 1.2170. When the price passes after opening a deal in the right direction for 20 points, Stop Loss should be set to breakeven. Indexes of business activity in the services and manufacturing sectors for July and retail sales will be released in the UK. America only has the indexes of business activity. The reaction to these reports can follow only if their values will be very different from the forecast. Basic rules of the trading system:1) The signal strength is calculated by the time it took to form the signal (bounce or overcome the level). The less time it took, the stronger the signal. 2) If two or more deals were opened near a certain level based on false signals (which did not trigger Take Profit or the nearest target level), then all subsequent signals from this level should be ignored. 3) In a flat, any pair can form a lot of false signals or not form them at all. But in any case, at the first signs of a flat, it is better to stop trading. 4) Trade deals are opened in the time period between the beginning of the European session and until the middle of the US one, when all deals must be closed manually. 5) On the 30-minute TF, using signals from the MACD indicator, you can trade only if there is good volatility and a trend, which is confirmed by a trend line or a trend channel. 6) If two levels are located too close to each other (from 5 to 15 points), then they should be considered as an area of support or resistance. On the chart:Support and Resistance Levels are the Levels that serve as targets when buying or selling the pair. You can place Take Profit near these levels. Red lines are the channels or trend lines that display the current trend and show in which direction it is better to trade now. The MACD indicator (14,22,3) consists of a histogram and a signal line. When they cross, this is a signal to enter the market. It is recommended to use this indicator in combination with trend lines (channels and trend lines). Important speeches and reports (always contained in the news calendar) can greatly influence the movement of a currency pair. Therefore, during their exit, it is recommended to trade as carefully as possible or exit the market in order to avoid a sharp price reversal against the previous movement. Beginners on Forex should remember that not every single trade has to be profitable. The development of a clear strategy and money management are the key to success in trading over a long period of time. The material has been provided by InstaForex Company - www.instaforex.com |
| How to trade EUR/USD on July 22? Simple tips for beginners. Posted: 21 Jul 2022 02:40 PM PDT Analysis of Thursday's deals:30M chart of the EUR/USD pair
The EUR/USD currency pair showed rather high volatility and multidirectional movements on Thursday. However, this is not surprising, since the results of the European Central Bank meeting were just announced, and it became known that the central bank raised the rate not by 0.25%, as most traders expected, but by 0.5%. This did not help the euro as much, although in this situation one could expect a sharp strengthening of this currency. However, the euro first rose to the level of 1.0269, which had already tried to overcome it twice, and then fell to the level of 1.0156. As a result, the day ends approximately where it began. Of course, tomorrow we can see the continuation of the results of the ECB meeting. European traders did not have enough time for this on Thursday. But in any case, now the technical picture is not the most appealing. The price settled below the ascending trend line and failed to overcome the level of 1.0269 three times. Thus, the upward trend is broken, and the prospects for the euro's succeeding growth remain vague. Moreover, the pair may now stay inside the horizontal channel at 1.0156-1.0269 for some time, which is also not good. 5M chart of the EUR/USD pair
Trading signals on the 5-minute timeframe were very good on Thursday, but the problem is that they were extremely difficult to work out. The pair traded rather sluggishly and formed only two signals during the European trading session. One for short positions near the 1.0190 level, which turned out to be false. The second is near the same level, after which strong growth began. However, this growth began exactly at the time when the results of the ECB meeting were announced, that is, the market reaction could be completely unpredictable and it was better not to take risks. But the next sell signal, when the price rebounded from the area of 1.0269-1.0277, could already be processed. After that, the pair went down about 100 points and rebounded from the level of 1.0156, forming a buy signal. This signal should be used to close shorts (profit 86 points) and open new long positions. Later the pair began to "dance" around the level of 1.0190, settling either above it or below it, but this is normal price behavior within a strong fundamental background. The long should be closed at the first opportunity and no longer work out signals near the level of 1.0190. How to trade on Friday:The upward trend has been reversed on the 30-minute timeframe. The euro's growth may resume, as the ECB still raised its key rate by as much as 0.50%. However, now, in order to identify further growth, we should wait for the price to settle above the level of 1.0269. There is also a certain degree of probability of the start of a flat between the levels of 1.0156 and 1.0269. On the 5-minute TF on Friday, it is recommended to trade at the levels of 1.0072, 1.0123, 1.0156, 1.0235, 1.0269-1.0277, 1.0354. When passing 15 points in the right direction, you should set Stop Loss to breakeven. The European Union and America will publish only indexes of business activity in the services and manufacturing sectors. Not the most important reports in the current circumstances, but if the actual values of one or more of them are much lower than forecasts, this may provoke a market reaction. Basic rules of the trading system:1) The signal strength is calculated by the time it took to form the signal (bounce or overcome the level). The less time it took, the stronger the signal. 2) If two or more deals were opened near a certain level based on false signals (which did not trigger Take Profit or the nearest target level), then all subsequent signals from this level should be ignored. 3) In a flat, any pair can form a lot of false signals or not form them at all. But in any case, at the first signs of a flat, it is better to stop trading. 4) Trade deals are opened in the time period between the beginning of the European session and until the middle of the US one, when all deals must be closed manually. 5) On the 30-minute TF, using signals from the MACD indicator, you can trade only if there is good volatility and a trend, which is confirmed by a trend line or a trend channel. 6) If two levels are located too close to each other (from 5 to 15 points), then they should be considered as an area of support or resistance. On the chart:Support and Resistance Levels are the Levels that serve as targets when buying or selling the pair. You can place Take Profit near these levels. Red lines are the channels or trend lines that display the current trend and show in which direction it is better to trade now. The MACD indicator (14,22,3) consists of a histogram and a signal line. When they cross, this is a signal to enter the market. It is recommended to use this indicator in combination with trend lines (channels and trend lines). Important speeches and reports (always contained in the news calendar) can greatly influence the movement of a currency pair. Therefore, during their exit, it is recommended to trade as carefully as possible or exit the market in order to avoid a sharp price reversal against the previous movement. Beginners on Forex should remember that not every single trade has to be profitable. The development of a clear strategy and money management are the key to success in trading over a long period of time. The material has been provided by InstaForex Company - www.instaforex.com |
| EUR/USD. The results of the July ECB meeting: hawkish, vague prospects Posted: 21 Jul 2022 02:40 PM PDT So, following the results of the July meeting, the European Central Bank raised interest rates by 50 basis points, realizing the most hawkish scenario. The overwhelming majority of economists polled by Reuters (62 out of 63) predicted a 25-point increase. In general, many ECB representatives, including ECB President Christine Lagarde, ahead of the July meeting also said that it is necessary to follow the path of normalization of monetary policy at a smooth pace, taking into account the existing risks for the debt market. In particular, one of the members of the Governing Council – Olli Rehn – last week stated that the ECB is preparing to raise the rate by 25 points.
But the ECB still deviated from the basic scenario. It not only raised interest rates for the first time in the last 11 years, but also surprised the markets with its determination, which is not inherent in the ECB a priori. According to the results of the July meeting, from July 27, the interest rate on the main refinancing operations and interest rates on the margin credit line and deposit line will be increased to 0.50%, 0.75% and 0.00%, respectively. Also, the European Central Bank did not rule out further steps in this direction at the next meetings this year. The euro-dollar pair reacted accordingly to this decision, impulsively rising to the level of 1.0268. However, EUR/USD bulls could not hold their positions: just a few hours after the meeting, the bears intercepted the initiative. The fact is that a few days before the July meeting (namely on Monday), the journalists of the Reuters news agency, referring to their anonymous sources in the ECB, said that the option of a 50-point rate hike "is still on the agenda." At the same time, it was argued that the pendulum may swing in the direction of this decision, despite the general market sentiment for a 25-point increase. Amid these hawkish rumors, the euro has significantly strengthened its position against the dollar. EUR/USD bulls were able to extinguish the threat of a resumption of the downward trend – they moved away from the parity level by more than 200 points. As a result, the Reuters insider was confirmed. Contrary to forecasts, the central bank really decided to raise rates at a sharper pace. But de facto, the journalists did the euro a disservice: by announcing a 50-point increase, they increased the hawkish expectations of traders, thereby offsetting the effect of surprise, which is very important in such situations. "At the moment", the EUR/USD pair could overcome the resistance level of 1.0300, thereby changing the price echelon for further offensive. But after the insider revealed the information, the blitzkrieg option was basically impossible: traders reacted reflexively to the very fact of the rate hike, but then lost the initiative. For the development of the upward movement, EUR/USD bulls needed an additional information occasion, but they did not receive it. Moreover, Lagarde voiced rather vague formulations regarding the prospects for further tightening of monetary policy. According to the head of the ECB, the pace of rate hikes will depend on incoming data. At the same time, she acknowledged that economic activity in the eurozone is slowing down, while risks to the inflation forecast remain: they are shifting upward and are getting stronger. Lagarde said that energy prices in the world will remain at a high level in the near future, but in the absence of interruptions, "they should stabilize." In other words, Lagarde made it clear that at the moment there is no predetermined trajectory for increasing rates: the approach will change from meeting to meeting. In the current circumstances, the ECB will act cautiously, because on one side of the scale is the fight against inflation, on the other is the risk of recession. The central bank is forced to maneuver "between the raindrops", so there is no pre-approved algorithm of actions: the further path of raising the rate will depend on the incoming data. Such vague prospects did not allow EUR/USD bulls to develop success. The "surprise effect" of the 50-point hike was offset, while the ECB did not provide any additional reasons for a significant strengthening of the euro. As a result, the pair flared up and immediately faded away.
Speaking about the results of the July meeting, it is impossible not to mention a new tool to combat fragmentation. A special mechanism called the Transmission Protection Instrument (TPI) was created to help the eurozone countries with more debt to prevent financial fragmentation in the currency bloc. It is indicated that the scale of asset repurchase within the TPI "will depend on the degree of risk." Summarizing the results of the July ECB meeting, we can conclude that the central bank simultaneously surprised the markets with its hawkish decision, and at the same time disappointed with vague rhetoric regarding further prospects for tightening the monetary policy. The single currency could not turn the situation in its favor, and this is also because of the insider's information that was revealed the day before. Therefore, the EUR/USD pair remains in standby mode. Now the focus of the market's attention will shift to the Federal Reserve, which will announce the results of the next meeting next week. From a technical perspective, EUR/USD bulls not only failed to enter the area of the 3rd figure, but did not even overcome the resistance level of 1.0270 (the middle line of the Bollinger Bands indicator coinciding with the Kijun-sen line). The price is located between the middle and lower lines of the Bollinger Bands indicator, as well as under the Kumo cloud. In my opinion, it is advisable to use corrective bursts to open short positions. The downward targets are 1.0110 (the Tenkan–sen line on D1) and 1.0050 (the lower Bollinger Bands line on the W1 timeframe). The material has been provided by InstaForex Company - www.instaforex.com |
| The euro will plunge into chaos Posted: 21 Jul 2022 02:40 PM PDT Europe got its gas, but lost Mario Draghi. The ex-head of the European Central Bank, with his authoritarian management style, scared the main Italian parties, which boycotted the vote of confidence. As a result, the country will plunge into political chaos and go to early elections in early October. An unprecedented story for Italy, given that in the autumn the parliament has to deal with the budget, and the government has to deal with a €200 billion aid package from the EU. Not everything is as smooth as we would like with the Nord Stream. Yes, it resumed work, according to the history of the shutdown, they will probably repeat themselves. In such difficult conditions, the ECB is forced to make difficult decisions. How difficult it is to be ECB President Christine Lagarde! Of course, the political crisis in Italy ties the ECB's hands, but the elections are far away, and the growth of the yield spread of local 10-year bonds and their German counterparts to 230 bps does not create a sense of panic. In mid-June, there were 250, and the central bank was forced to announce an emergency meeting. Now he has to present an anti-fragmentation program. If it satisfies investors, and the deposit rate rises to a dizzying level of zero percent, EURUSD will have the opportunity to develop a correction to a downward trend. Otherwise, you will have to return to parity. It is curious that the futures market in such difficult conditions continues to raise the estimated deposit rate at the end of the year. Dynamics of the estimated ECB deposit rate by the end of July and December
In my opinion, investors' faith in accelerating the ECB's monetary restriction process has a shaky foundation. As the snap elections in Italy approach, the political chaos will intensify. Despite the resumption of the work of the Nord Stream, stories with its shutdown will be repeated. It is advantageous for Russia to maintain high gas prices, thanks to the supply of which to Europe, it earns €100 million a year. Yes, there is a reduction in exports in kind, but all this is more than compensated by the price. Dynamics of Russian gas supplies to Europe
Thus, even if the ECB shows determination and raises the deposit rate by 50 bps, this will provide the euro with only temporary support. The situation of the eurozone economy looks too shaky. According to the International Monetary Fund, it may be threatened by a 5% recession amid the transition of the governments of the countries of the currency bloc to rationing the use of gas. It may be threatened with disintegration due to the inability of Italian politicians to compromise. All this constrains the ECB and continues to do this on the medium-term investment horizon, allowing us to assert that there can be no question of any break in the downward trend for EURUSD. Technically, on the 4-hour chart of the main currency pair, the bears faced support in the form of moving averages and the 23.6% Fibonacci level from the 4-5 wave of the Expanding Wedge pattern. A drop below 1.015 is a reason to sell EURUSD. On the contrary, the growth of the euro above $1,023 will give an opportunity to buy it. At least for a while. The material has been provided by InstaForex Company - www.instaforex.com |
| Posted: 21 Jul 2022 02:40 PM PDT
Last week, the EUR/USD pair played cat and mouse with parity and even sank below this important ridge twice, reaching the lowest levels since December 2002 in the area of 0.9950. After the Nord Stream-1 gas pipeline was closed for preventive maintenance last Monday, there was talk on the market that it would not resume work, which in turn threatens to aggravate the energy problems of the eurozone and provoke a recession in the region. Concerns in this regard have dealt a significant blow to the single currency. The news announced on July 13 that inflation in the United States reached 9.1% in June, which was another four-decade high, added fuel to the fire of the euro's decline. This has increased expectations that the Federal Reserve will raise the rate by a whole percentage point, as a result of which the European Central Bank will fall even further behind its American counterpart in terms of normalizing policy. The euro has also suffered due to political turmoil in Italy, which not only threatens to undermine calm in the country after several months of relative stability, but also provokes a sharp jump in the yield of national government bonds. The latter complicates the work of the ECB, which is facing accelerating inflation and a sharp slowdown in economic growth. Almost a decade ago, while at the helm of the ECB, Mario Draghi promised to do everything possible to save the euro. Ten years later, the situation has not changed, and the single currency is again in a deplorable state. Will the ECB make every effort to ease the fate of the euro? On the one hand, the weakening of the single currency exacerbates inflation, which has already significantly exceeded the ECB's target of 2%, on the other hand, a more hawkish position on strengthening the currency or a faster increase in rates may harm economic growth. "They know that it is quite dangerous to fall into the trap of trying to support their currency through the actions of the central bank, because in this case they will need to tighten policy too much, which will damage not only the economy, but also the currency," Janus Henderson analysts said.
After the EUR/USD pair fell to parity for the first time in almost 20 years, the ECB representative said that the central bank was not aiming for a certain exchange rate. "However, we always closely monitor the impact of the exchange rate on inflation in accordance with our mandate to ensure price stability," the ECB spokesman said. Difficult Choice for the ECB The EUR/USD bears took a break ahead of the ECB's July meeting, following which on Thursday it should raise interest rates for the first time in 11 years. In anticipation of this event, the euro cheered up somewhat and even regained about half of the losses incurred earlier this month. The EUR/USD rally stalled near the upper limit of the short-term descending channel formed at the end of May. This barrier in the area of 1.0275-1.0280 is followed by the level of 1.0300, the breakdown of which will allow the bulls to aim for a return to the level of 1.0400. On the other hand, the 1.0150 level is an immediate support that should help limit the decline. Further shorts may negate the current positive mood and make the pair vulnerable to a break below 1.0100. The subsequent drop will lead to a retest of the parity level and a multi-year low in the area of 0.9950. Although the main currency pair has recovered by about 200 points from the two-decade "bottom", its further fate depends not only on the decisions of ECB President Christine Lagarde and her colleagues, but also on a number of other factors. Experts disagreed on whether ECB policymakers would adhere to the previously outlined plan to raise rates by 25 bps or go for a 50 bps increase at once.According to Citi strategists, raising rates by 50 bps at once would be a risky move. "We see a number of reasons why many ECB leaders may want a more substantial increase (by 50 bps). However, if they do this without explicit warning and visible reasons, we fear that this may cast a shadow on other promises, including the fight against fragmentation in the region," – stated in Citi.
Analysts at Berenberg Bank also expect that the ECB will raise rates by only 25 bps on Thursday, and then by 50 bps in September and by another 25 bps in December. ABN Amro economists believe that the ECB should stick to its preliminary commitment to raise rates by 25 basis points. As for the future increase in interest rates, it will depend on the incoming data, namely, how inflation will develop in the medium term, they noted. "Ahead of the ECB's next monetary policy decision, speculation has intensified that the central bank may raise the rate by 50 bps instead of the planned 25 bps. Given how far the ECB is behind schedule, it is reasonable to take this unexpected scenario seriously," TD Securities analysts believe. NAB analysts expect the ECB rate to rise by half a point and predict another increase by half a point in September. In their opinion, the central bank will seek to raise the rate ahead of schedule in anticipation of worsening conditions later in 2022 and in 2023, when the room for maneuver may be more limited. The EURUSD pair risks resuming its downward trend if the ECB announces a widely expected rate hike of 25 bps. Although a double dose of an increase can restore confidence in the ECB in the fight against inflation, it can only give a temporary boost to the euro. In any case, rates in Europe will remain at the lowest level among all developed countries, especially compared to America, where the Fed may raise the cost of borrowing by 0.75% again next week. From this we can conclude that the dollar will continue to look in a more favorable light. This, in turn, will contribute to further capital inflows to the United States. The Gas Epic is Far From Over Contrary to fears, Russian gas supplies to Europe via the Nord Stream-1 pipeline resumed on Thursday. However, Danske Bank strategists believe that the risk of a complete cessation of supplies of blue fuel from the Russian Federation to the eurozone should still not be discounted. "According to officials, the EU can replace up to 70% of Russian gas imports by increasing LNG supplies and imports via pipes from other regions, green gas, renewable energy sources, as well as by reducing demand. This means that about 1/3 of Russian imports cannot be easily replaced in the short term," they noted.
"If gas flows from Russia completely stop, European governments will most likely be forced to resort to emergency measures, such as energy rationing. In this case, the energy needs of households will be prioritized over the needs of industry, and enterprises operating, in particular, in the chemical, metallurgical and cement industries may be forced to stop production," Danske Bank believes. Acute energy shortages and increased energy prices will put a burden on all European consumers in the coming winter, but households in Germany, Italy, the Netherlands and Belgium will suffer the most. Thus, a full-scale gas crisis will bring Europe to its knees, the bank's analysts warn. According to the German Federal Network Agency, as of July 17, the country's gas storage facilities were 65% full. However, the head of the department, Klaus Mueller, believes that the available reserves are not enough for Germany to survive the winter of 2022/2023 without gas supplies from Russia. Meanwhile, Shell CEO Ben van Beurden said that the problem that the German authorities are very concerned about actually concerns Europe as a whole. And the countries of the region will probably have to introduce rationing of natural gas consumption this winter. Russian gas is being piped back to the eurozone. But the acute energy crisis is by no means averted, according to analysts at Commerzbank. "The European Union yesterday called for a significant reduction in gas consumption by 15% over the next eight months and threatens mandatory rationing. The EU continues to almost blindly wade through the crisis. It is impossible to reliably assess either the success of gas saving measures, or what gas supplies it will be able to count on at all. The Russian president has already announced a possible reduction in the volume of supplies next week, and we cannot rule out their complete freezing," the bank's specialists said. "This means that a significantly higher risk premium for the euro remains justified. This is due to the fact that the threat of a gas shortage puts a double burden on the single currency. Even if rationing can be avoided, the eurozone economy will face significant structural changes associated with the rejection of cheap Russian gas, which will negatively affect the prospects for potential economic growth and profitability in the currency bloc. Meanwhile, high gas prices fuel inflation and reduce the purchasing power of the euro," Commerzbank reported.
The Italian card has not been played to the end yet On Thursday, Italian Prime Minister Mario Draghi again submitted his resignation. This time, the President of the Republic Sergio Matarella accepted the resignation of the head of government. Draghi was prompted to take such a step by the vote held on Wednesday in the upper house of the national parliament. On the one hand, the senators supported the resolution on confidence in the Council of Ministers, and on the other – it became clear that there is no longer a coalition uniting the leading parties of Italy. Draghi will remain as interim head of government until the elections to be held in September or October, in which, according to polls, the conservative bloc, including the far-right Italian Brothers party, may win. "Do I have a ready-made team of ministers? I have my own ideas about how this country should be governed, what should be done, what its industrial strategy should be," said the leader of the Brothers of Italy, Giorgia Meloni, who, according to forecasts, may become the next prime minister. The political turmoil comes at a difficult time for debt-laden Italy, the eurozone's third-largest economy, where borrowing costs have soared as the ECB begins to tighten its monetary policy. The head of the center-left Democratic Party of Italy called last Wednesday a "crazy day," noting that the national parliament went against the will of the people. "Italians will show that they are wiser than their politicians at the ballot box," he said. The material has been provided by InstaForex Company - www.instaforex.com |
| NZD/USD: Commodity currencies decline against the dollar Posted: 21 Jul 2022 02:40 PM PDT
After falling in Asia, the dollar index again turned to growth at the beginning of Thursday's European trading session. At a point, DXY futures were trading near 107.10, 87 points above Wednesday's local intraweek low of 106.23. Given the strong bullish momentum and the long-term upward trend in DXY, a breakdown of the local resistance level at 109.00 will be a signal to increase long positions in DXY futures "with the prospect of growth towards multi-year highs of 121.29 and 129.05, reached, respectively, in June 2001 and November 1985. If the strengthening of the dollar against the main European currencies is rather restrained, then it is noticeably strengthening against the main commodity currencies: Canadian, Australian, New Zealand dollars. As for the latter, last week (Thursday) it reached a new 26-month low at 0.6060, moreover, after the Reserve Bank of New Zealand raised the official rate (OCR) by 50 bp for the third consecutive time last Wednesday, up to 2.5%. The accompanying RBNZ statement said: "The Committee agreed that it remains prudent to continue to tighten monetary conditions at the pace necessary to maintain price stability and support maximum sustainable employment. The Committee acknowledged that there is a risk of higher consumer price inflation in the near term and downside risks are emerging in the medium term." RBNZ leaders also decided to keep raising the OCR (official money rate) to a level where they are confident that "consumer price inflation will settle within the target range." The RBNZ acknowledged that a sharp rise in consumer prices is possible in the short term, as the situation in the energy market remains highly uncertain (at the moment, the annual inflation rate is 7.3%, which is the absolute peak in 30 years).Economists predict that by the end of 2022, the RBNZ interest rate may be increased to 3.5%, and up to 4% by 2024. The New Zealand dollar and the NZD/USD pair reacted rather reservedly to this rather tough RBNZ decision, perhaps because it was expected. Commodity currencies are under pressure from the news that the Nord Stream 1 gas pipeline has resumed gas supply after 10 days of maintenance. Gas and oil prices were falling on Thursday. The next 2-week report of the Global Dairy Trade was also published on Tuesday. According to published data, the dairy price index, which reflects the weighted average price changes in percentage terms, again decreased in the previous reporting period and came out with a value of -5.0% (after a decrease of -4.1%, -1.3% in the previous periods). The economy of New Zealand in many ways still has signs of raw materials. Moreover, the main share of New Zealand exports falls on dairy products and food products of animal origin. No particularly important economic news in New Zealand is expected for this week and the next. Therefore, the dynamics of the NZD/USD pair will depend on the general situation on the commodity market and on the dynamics of the US dollar. For now, it continues to dominate the FX market, while NZD/USD, having declined since the opening of Thursday, is trading in the zone of an important short-term support level of 0.6186.
Market participants were closely following the course of the European Central Bank press conference. It was expected that following this meeting, the key interest rate will be raised by 0.25% (up to -0.25%), and the ECB's rate on deposits for commercial banks - up to 0.25%. During the press conference, ECB President Christine Lagarde will explain the bank's decision on rates and likely outline the prospects for the central bank's monetary policy in the coming months. You need to be prepared for a sharp increase in volatility during this period of time. The material has been provided by InstaForex Company - www.instaforex.com |
| Posted: 21 Jul 2022 11:40 AM PDT At the trading on Thursday, the key stock exchange indicators in Western Europe are declining in anticipation of the disclosure of the results of the European Central Bank meeting. Thus, at the time of writing, the composite indicator of Europe's leading companies STOXX Europe 600 fell by 0.4% - to 420.84 points. Meanwhile, British FTSE 100 declined by 0.32% - to 7,247 points, French CAC 40 lost 0.15% and was at 6,175.17 points, German DAX dropped by 0.364% to 13,240.02 points.
Top gainers and losers The value of securities of SAP SE, producer of German software for business management, fell by 3.9%. At the end of the second quarter of this fiscal year, operating profit decreased more than market forecasts. In addition, the day before the German group lowered its profit forecast for 2022 due to an armed conflict between Ukraine and Russia. The share price of Swiss robotics company ABB rose 0.5% on the report of a sharp increase in orders in the second quarter, despite supply chain restrictions due to strict anti-pandemic measures in China. At the time of writing, shares of Finnish telecommunications equipment maker Nokia Corp. soared 6.9 percent. The day before the company reported net profit above market forecasts in April-June 2022. The market capitalization of Swiss pharmaceutical company Roche Holding AG fell 0.6%. Even the company's strong corporate report, according to which its quarterly net profit rose 9%, couldn't help the stock price. The value of securities of French defense technology group Thales fell by 1.8%. On the eve of the management of the company announced that its aerospace division might incur losses of 70 million euros in 2022 amid the stoppage of business in Russia. Market sentiment On Thursday, the European investors' attention is focused on the forthcoming publication of the results of the European Central Bank meeting. Many experts expect the ECB to raise interest rates for the first time since 2011. According to analysts, the regulator can raise it by 25 basis points or by 50. The results of the regulator's meeting will be announced this afternoon. Such assumptions are based on the June data on inflation in the countries of the Euro-region. Recall, according to the EU Statistical Office, last month consumer prices in the euro area countries rose by 8.6% in annual terms. By the way, the obtained indicator was the highest since the beginning of data calculation. To date, the inflation rate in the countries of the European Union exceeds the target of 2% from the Central Bank more than four times. In addition, today the ECB will present a new instrument against fragmentation. It is a bond-buying option designed to curb fluctuations in the debt market as borrowing costs fall. The special attention of European investors on Thursday is focused on the key indicator of the Italian stock market FTSE MIB, which by the time of writing has collapsed by 2.7%. Analysts call the resignation of Italian Prime Minister Mario Draghi the main catalyst for the sharp fall of the stock index into the red zone. The main upward factor for Europe's stock market on Thursday was the resumption of Russian gas supplies to Europe via Europe's largest pipeline, Nord Stream, following a 10-day maintenance shutdown. Although it will take time to restore gas flow to the required level, the resumption of Nord Stream has eased investor fears about the prospects of a European energy crisis. Trading results day before On Wednesday, European stock exchange indicators showed a drop ahead of the upcoming meeting of the European Central Bank. The day before, investors also evaluated the next portion of corporate reports of the largest companies in the euro region. As a result, the composite indicator of Europe's leading companies STOXX Europe 600 shed 0.21% to 422.51 points. British FTSE 100 was down 0.44% to 7,264.31 points, French CAC 40 lost 0.27% to 6,184.66 points and German DAX was down 0.2% to 13,281.98 points. Market capitalization of the Dutch semiconductor equipment manufacturer ASML Holding NV had soared by 3.4% the day before. Although the company increased its revenue and net profit in the second quarter, its managers worsened their forecast for revenue growth to the end of 2022 to 10% from 20%. In addition, the management of ASML Holding NV warned of the prospect of lower supply revenue and rising costs. UK mail and parcel delivery service Royal Mail Plc gained 0.2 percent on Wednesday after falling sharply by 5 percent early in the trading session. Earlier, the company reported an 11.5% drop in revenue in its first fiscal quarter due to a decline in online purchases amid record inflation. In addition, the day before, Royal Mail announced that it was considering splitting up Royal Mail and GLS if Royal Mail's performance in the U.K. does not start to increase soon. An important downward factor for the European stock exchanges the previous day became the data on annual inflation in Great Britain. Thus, according to the National Statistics Office of the country (ONS), at the end of last month this index accelerated to a record since 1982 9.4% from the May 9.1%. At the same time, economists on average predicted an increase to only 9.3%. The main catalyst for the growth in inflationary pressures in the UK experts from the ONS called the rise in food and energy prices. This state of affairs provokes investors' concern about a possible large increase in interest rates by the Bank of England in the near future. Many analysts speculate that the regulator will raise the prime rate by 50 basis points at the next meeting. The nearest meeting of the British Central Bank is scheduled for early August. On the eve of the need for drastic measures said the head of the Bank of England Andrew Bailey. During his speech, the regulator said that the return of inflation in the country to the target of 2% is the absolute priority for the central bank. The material has been provided by InstaForex Company - www.instaforex.com |
| Technical analysis of AUD/USD for July 21, 2022 Posted: 21 Jul 2022 11:28 AM PDT
The AUD/USD (Australian Dollar/US Dollar or Aussie) pair has plunged up for a fresh two weeks high. Prices pushed above a key retracement from a Fibonacci setup that spans from the lowest price of 0.6838 (61.8% of Fibonacci on the hourly chart), for that buyers pulled the bid back-above that level by the end of the week. Yesterday the AUD/USD pair traded up and closed the day in the red area near the price of 0.6838. Today it rose a little, rising above 0.6890. On the hourly chart, the AUD/USD pair continues to test the strength of the resistance - the moving average line MA (100) H1 (0.6878). On the four-hour chart, the AUD/USD pair is also still above the MA 500 H4 line. Based on the above, it is probably worth sticking to the north direction in trading, and as long as the the AUD/USD pair remains below MA 50 H4, it may be necessary to look for entry points to buy at the end of the correction. The AUD/USD pair faced resistance at the level of 0.7000, while minor resistance is seen at 0.6933. Support is found at the levels of 0.6838 and 0.6769. Also, it should be noted that a daily pivot point has already set at the level of 0.6838. Equally important, the AUD/USD pair is still moving around the key level at 0.6838, which represents a daily pivot in the H1 time frame at the moment. That elongated wick on the underside of last week's candle has led to a continued bullish run so far this week, and prices have broken out of a rising wedge formation, which keeps the gate open for bullish continuation strategies. Yesterday, the AUD/USD pair continued to move upwards from the level of 0.6838. The pair rose from the level of 0.6838 (this level of 0.6838 coincides with the key level of the golden ration 61.8%) to the top around 0.6933. In consequence, the AUD/USD pair broke resistance, which turned strong support at the level of 0.6838. The level of 0.6838 is expected to act as major support today. From this point, we expect the AUD/USD pair to continue moving in the bullish trend from the support level of 0.6838 towards the target level of 0.6933. If the pair succeeds in passing through the level of 0.6933, the market will indicate the bullish opportunity above the level of 0.6933 in order to reach the second target at 0.7000. On the other hand, in the very short term the general bullish sentiment is confirmed by technical indicators. Therefore, a small upwards rebound in the very short term could occur in case of excessive bearish movements. The material has been provided by InstaForex Company - www.instaforex.com |
| Posted: 21 Jul 2022 10:45 AM PDT Bitcoin dropped after reaching the 24,280 level in yesterday's trading session. In the short term, it has retreated and it has retested the immediate downside obstacles, trying to accumulate more bullish energy. It was traded at 23,071 at the time of writing above 22,340 today's low' BTC/USD dropped by 7.99% from yesterday's high to today's low. The sell-off forced the altcoin to drop as well. In the last 24 hours, BTC/USD is down by 2.29% but it's still up by 14.35% in the last 7 days. Bitcoin Retreat!
I've told you in my previous analysis that BTC/USD could come back down in the short term if it invalidates its breakout above the channel's upside line. Now, it has found support on the 22,401 level and it tries to come back higher. It challenges the weekly R2 (23,216) which stands as a static resistance. As long as it stays above 22,401, BTC/USD could try to approach 24,280 yesterday's high again. BTC/USD Prediction!A larger upside movement could be activated only by a new higher high, after making a valid breakout above the 24,280. Dropping and stabilizing below 22,401 could signal more declines in the short term. The material has been provided by InstaForex Company - www.instaforex.com |
| Posted: 21 Jul 2022 10:44 AM PDT
GBP/USD Upside Seems Over!The GBP/USD pair climbed as much as 1.2030 where it has found a strong supply. Now, it is trading at 1.1954. In the short term, it is trapped between 1.2030 and 1.1925 levels. Escaping from this range could bring new opportunities. Technically, after dropping below the uptrend line the pair signaled that the upside movement is over and that the price could drop again. GBP/USD Trading Conclusion!Dropping below 1.1925 former low which stands as a downside obstacle may signal a deeper drop. The material has been provided by InstaForex Company - www.instaforex.com |
| USD/JPY crashes but buyers still in game Posted: 21 Jul 2022 09:38 AM PDT The USD/JPY pair climbed as much as 138.87 level where it found resistance and now it has plunged. It was traded at 137.98 at the time of writing above 137.71 today's low. I've told you in my previous analysis that the pair could register sharp movements after the BOJ. Technically, the bias remains bullish despite the current sell-off. The rate stands above strong downside obstacles. Today, the Bank of Japan maintained the BOJ Policy Rate unchanged at -0.10% as expected. In addition, the Trade Balance came in at -1.93T below -2.10T expected. Fundamentally, the USD is sluggish in the short term after the Unemployment Claims indicator was reported at 251K versus 240K estimated. Also, the CB Leading Index and the Philly Fed Manufacturing Index came in worse than expected. USD/JPY BOJ Brought High Volatility!
As you can see on the H1 chart, the rate failed to stay above the 138.37 key level and now it has challenged the uptrend line and the 137.75 which represent downside obstacles. As long as it stays above these levels, the USD/JPY pair could try to come back higher. Only a valid breakdown of the near-term downside obstacles could open the door for a deeper drop. This scenario could take shape if the DXY drops deeper and if the Japanese Yen Futures will rebound. USD/JPY Forecast!A new lower low, a valid breakdown below 137.71 could activate more declines. This scenario could short signals. Still, as long as it stays above the uptrend line, we could look for long opportunities. False breakdowns (pin par) or a bullish pattern (bullish engulfing) could signal new bullish momentum. The material has been provided by InstaForex Company - www.instaforex.com |
| Trading Signal for Gold (XAU/USD) for July 21 - 22, 2022: buy above $1,706 (3/8 Murray - 21 SMA) Posted: 21 Jul 2022 08:33 AM PDT
Early in the American session, XAU/USD made a good technical rebound from the zone of 1,680.89, its lowest level since March 2021. Within a few hours, gold recovered more than $30, reaching the price of 1,710. According to the 4-hour chart, gold has left a bullish engulfing candle. This technical figure is a sign that gold could continue to rise in the coming days. The first barrier ahead is the top of the downtrend channel formed on July 5. A sharp break of the downtrend channel and a daily close above 1,716 will be a clear sign of a recovery in gold. Conversely, as long as XAU/USD trades within the downtrend channel, it is likely to find support at 3/8 Murray located at 1,687. The European Central Bank (ECB) made a large rate hike of 50 basis points, against the consensus of 25 basis points, and also indicated that rates would continue to rise in future meetings. This decision gave strong volatility to gold, which helped to rebound from the low of 1,680. The price is now located above the 21 SMA, which adds to a bullish outlook for the next few days. Our trading plan for the next few hours is to buy above the 21 SMA around 1,706, with targets at 1,716, 1,750 (4/8 Murray), and 1,778 (200 EMA). The material has been provided by InstaForex Company - www.instaforex.com |
| EUR/USD erasing today's gains after ECB shock Posted: 21 Jul 2022 08:27 AM PDT The EUR/USD pair was trading at 1.0182 at the time of writing. In the short term, it has registered sharp movements in both directions around the ECB announcements. Technically, the price action signaled that the upside movement could be over and that the rate could come back down. As you already know from my analyses, the EUR/USD pair rallied only because the Dollar Index was in a corrective phase. You knew from my previous analysis that the ECB meeting is seen as a high-impact event and it could bring sharp movements today. As you already know, the European Central Bank increased the Main Refinancing Rate from 0.00% to 0.50% above 0.25% expected. Further rate hikes are likely to follow in the next monetary policy meeting. On the other hand, the US reported worse than expected data. The Unemployment Claims, Philly Fed Manufacturing Index, and the CB Leading Index reported poor data. EUR/USD Range Pattern!
As you can see on the H1 chart, the rate is trapped between 1.0269 and 1.0155. It could continue to move sideways in the short term before escaping from this pattern. Having dropped below the uptrend line, EUR/USD signaled that the leg higher ended. Still, only a new lower low could activate a downside reversal in the short term. The 1.0173 - 1.0155 is seen as a strong obstacle after registering only false breakdowns. EUR/USD Outlook!A new lower low, making a valid breakdown below 1.0155 could activate more declines and could bring selling opportunities with a potential downside obstacle at the pivot point of 1.0070. The material has been provided by InstaForex Company - www.instaforex.com |
| July 21, 2022 : EUR/USD daily technical review and trading opportunities. Posted: 21 Jul 2022 08:26 AM PDT
In late September, Re-closure below the price level of 1.1700 has initiated downside-movement towards 1.1500 where some recovery was witnessed. Shortly after, Price levels around 1.1700 managed to hold prices for a short period of time before another price decline took place towards 1.1200. Then the EURUSD has temporarily moved-up within the depicted movement channel until downside breakout occurred recently. Since then, the price zone around 1.1500 has applied significant SELLING pressure when a valid SELL Entry was offered upon the previous ascending movement towards it. Shortly after, the EURUSD found support while approaching the price levels of 1.0800 few weeks ago. That's where the recent upside movement was previously initiated. However, the recent movement towards 1.1200 was considered for another SELL Trade which already reached its targets. Any ascending movement towards 1.0800 should be watched for selling pressure where a new downside movement can be established. The material has been provided by InstaForex Company - www.instaforex.com |
| July 21, 2022 : EUR/USD Intraday technical analysis and trading plan. Posted: 21 Jul 2022 08:24 AM PDT
The recent movement towards 1.1200 was suggested for another SELL opportunity which already reached its targets beyond the price level of 1.0400. The previous ascending movement above 1.0600 enabled further advancement towards 1.0800 where evident bearish rejection arised again. The EURUSD pair had been trapped between 1.0350 (the newly recorded Low) and 1.0750 which corresponds to the nearest existing SUPPLY level until bearish breakout below 1.0350 was recently achieved. Shortly after, the pair was approaching new price levels around 1.0000 that haven't been visited since 2002. That's where price action was watched for significant bullish recovery especially around such an important psychological support. The nearest supply level is located around 1.0350. The material has been provided by InstaForex Company - www.instaforex.com |
| July 21, 2022 : GBP/USD Intraday technical analysis and significant key-levels. Posted: 21 Jul 2022 08:23 AM PDT
Recently, the GBP/USD pair remained under bearish pressure to challenge the new low around 1.2150 again which was temporarily bypassed few days go. Immediate bullish rejection was expressed around 1.1950 bringing the pair back above 1.2150 again towards higher price levels. Bullish persistence above 1.2300 (when achieved) will probably enable further bullish continuation towards 1.2550 and probably 1.2650 where further decisions can be taken. On the other hand, more bearish visits were expected to challenge the price level of 1.1950 when sufficient bearish momentum was expressed. Significant bullish recovery has been witnessed during the recent bearish dip that took place earlier few weeks ago. Recently the pair looked oversold while approaching these price levels. This favours the bullish scenario at least towards 1.2520 unless bearish persistence below 1.1900 is achieved towards 1.1650. The material has been provided by InstaForex Company - www.instaforex.com |
| Posted: 21 Jul 2022 07:11 AM PDT
The wave marking for the pound/dollar instrument required clarifications, which were made. The upward wave constructed between May 13 and May 27 does not currently fit into the overall wave picture, but it can still be regarded as a segment of the downward trend. Thus, we can now definitively state that the building of the upward correction phase of the trend has been canceled, and the downward component of the trend will have a longer and more complex shape. I'm not a big fan of continually complicating the wave marking when dealing with a highly elongating trend zone. I believe it would be far more efficient to recognize rare corrective waves, following which new impulse structures can be constructed. Now that waves 1 and 2 have been completed, we may infer that the instrument is in the process of constructing wave 3. However, this wave proved unconvincing (if finished at this time), as its low is not significantly lower than wave 1's low. Consequently, the current downturn cannot be characterized as impulsive, but it may be a complex correction. Focus on the wave marking of the EUR/USD instrument in this regard. The British no longer have any economic news, but there are others. The pound and dollar exchange rates declined by 75 basis points on July 21. Although there was no news context for the pound today, it mimicked the euro's actions practically verbatim, which I find pretty odd. The conclusions of the ECB meeting were summarized today in the European Union, and President Christine Lagarde will deliver a speech shortly. Consequently, the sharp and significant euro swings do not raise any concerns. But why did the pound move with the same sharpness and vigor? The question remains open. The most significant reports of the week have already been released in the United Kingdom. Tomorrow, there will be a retail trade report, which is less significant than reports on inflation or unemployment. Nonetheless, there is additional news from Scotland. Edinburgh has not abandoned the notion of holding a referendum, but it wants to hold a consultative referendum first, for which it must also receive authorization from London. The Scottish National Party, led by Nicola Sturgeon, who promised the Scots a referendum by the end of 2023 but was unable to secure authorization, petitioned the Supreme Court of Great Britain to explain the difficulty of obtaining permission from London. According to reports, if the Supreme Court declines, Sturgeon would push the issue of a referendum to the 2024 general election. In this event, the SNP will make independence from the United Kingdom the central issue in the upcoming election. Therefore, Edinburgh will not forsake the independence referendum, and a change in the British Prime Minister could work in his favor. Boris Johnson categorically rejected any referendum, noting that a referendum had already been held in 2014, and the majority of Scots voted in favor of a union between the United Kingdom and Scotland. But perhaps the incoming Prime Minister will alter the situation. General observations. The increased complexity of the wave structure of the pound/dollar pair signals a further downturn. For each "down" MACD signal, I recommend selling the instrument with objectives at the estimated mark of 1.1708, corresponding to 161.8 percent Fibonacci. Now, there is a prospect of an upward wave forming, but I do not anticipate it to be robust and protracted.
At the higher wave scale, the image closely resembles the euro/dollar instrument. The same ascending wave does not conform to the present wave pattern, followed by the same three descending waves. Thus, one thing is unmistakable: the downward segment of the trend continues to develop and can reach practically any length. The material has been provided by InstaForex Company - www.instaforex.com |
| Posted: 21 Jul 2022 07:05 AM PDT
A few weeks ago, the wave markings on the 4-hour chart for the euro/dollar instrument got more complex and no longer had a holistic appearance. There was a successful attempt to break through the 261.8 percent Fibonacci level, which was also the low of the waves E and b; hence, these waves are no longer E and b. Thus, I have constructed a new wave markup that does not yet account for the ascending wave indicated by a bold red line. I've already stated that the entire wave structure can be complicated indefinitely. This is the drawback of wave analysis, as any structure is always capable of assuming a more complicated and extensive shape. Consequently, I propose to now focus on simpler wave structures, including waves of a smaller scale. As shown, the creation of an upward wave, which may be wave 4 of a new downward trend section, is proceeding. If this estimate is accurate, the instrument might gain another 100-150 basis points before resuming its slide within wave 5 with objectives below 1.0000. Additionally, the development of the fifth wave may have already begun. So far, I see no reason to anticipate additional instrument moves. The market had a mixed reaction to the ECB meeting. Thursday saw a rise of 10 basis points in the euro/dollar exchange rate. The amplitude of the movements was extremely strong, and the difference between the present rate and the rate at the start of the day was 10 percentage points. The instrument rose by 100 basis points throughout the day before falling drastically. These big changes occurred in the hours following the summary of the ECB meeting - the most significant event of the week. The market did not anticipate the increase of 50 basis points in the interest rate, which I will state immediately. Some analysts expected a gain of precisely 50 points, but there are always some who disagree with the consensus, and their predictions are not always accurate. This time, they were realized. There are currently no remarks on monetary policy, and Christine Lagarde's address will begin shortly. It will be able to get a great deal of crucial information from it, but for the time being, we shall assess what we now have. A rate increase of 50 basis points indicates that the ECB has begun to worry about more price hikes. The most recent inflation report shows an 8.6% increase compared to June of the previous year. This inflation rate is the highest in decades. Although ECB experts and economists anticipate a reduction in the impact of variables on price growth, they are still uncertain about this. Therefore, the regulator was forced to resort to more robust instruments. The primary question is whether the ECB will hike rates in the future. If this is the sole rise in 2022, it will serve little purpose. At least in terms of combating inflation. As we can see, demand for the euro has not increased due to this occurrence, and wave 5 of its decline can now commence. General observations. I infer based on my findings that construction of the downward trend segment continues. If this is the case, it is now viable to sell the instrument with goals at the estimated 0.9397 level, which corresponds to 423.6 percent Fibonacci, for each "down" MACD signal generated during the development of wave 5. Wave 4 is currently completeable.
At the larger wave size, the wave marking of the descending trend segment becomes considerably more complex and extends in length. It can assume virtually any length, so I believe it is best to focus on three and five-wave conventional wave shapes for the time being. The material has been provided by InstaForex Company - www.instaforex.com |
| BTC declines sharply after previous dramatic rise Posted: 21 Jul 2022 06:59 AM PDT On Thursday, Bitcoin started falling. At the time of writing, it is trading at $23,019. According to CoinMarketCap, Bitcoin hit a low of $22,707 and a high of $24,196 over the past 24 hours.
However, cryptocurrency market players did not expect BTC to drop today, as the cryptocurrency has been rising steadily since the start of the week. Therefore, the value of BTC has increased by 14% since Monday. Meanwhile, on Tuesday, the asset returned to its significant key level of $22,000 for the first time since June 8 as many bears ceased to exert the pressure on cryptocurrencies. Moreover, the stocks of digital assets companies were also bullish amid BTC rapid growth the day before. Thus, the North American company Applied Blockchain, Inc., a builder and operator of next-generation data centers, became the top gainer (+100%) in the past three days. Meanwhile, the shares of prominent crypto mining giant Marathon Digital Holdings, Inc. jumped by 32.17%. Besides, Bitcoin has already lost about 70% since November 2021 despite its significant gains in the last few days. Last year, the cryptocurrency renewed its all-time high of above $69,000. At the same time, many other digital assets have plummeted from their record levels. Altcoin Market Bitcoin's main rival, altcoin Ethereum, also dropped on Thursday. At the time of writing, it fell to $1,488. At the same time, Ethereum has been rising steadily since the end of last week and has gained more than 30%. One of the project developers announced that the Ethereum blockchain might switch to a new Proof-of-Stake algorithm in mid-September. This news became the major catalyst for ETH soaring price. Currently, the altcoin is still 71% below its all-time high recorded in November 2021 despite its successful attempts to return to previous highs. As for cryptocurrencies from the top 10 by capitalization, all major cryptocurrencies, except for Binance USD and some stablecoins, followed the market flagships into the red zone. At the same time, Dogecoin (DOGE) and Shiba Inu (SHIB) meme coins incurred the maximum losses. Both of these altcoins lost more than 8% in the past 24 hours. According to CoinGecko, in the last 24 hours, among the top 100 most capitalized digital assets, Evmos coin (+4.1%) topped the list of leaders, while Polygon (-14.6%) took the top spot in the fall list. According to the results of the past week, Ethereum Classic (+57.2%) showed the best results among the hundred strongest cryptocurrencies, while PAX Gold (-2.8%) showed the worst results. Forecasts by experts The unpredictable behavior of the digital coin market makes cryptoanalysts make the most unexpected predictions about its future. Thus, the day before, having analyzed the movement of the first cryptocurrency, famous Bitcoin analyst Willie Wu came to the conclusion that digital gold could break the capitulation structure and start to form the real bottom. According to the expert, the breakdown of the surrender structure means that investors who bought bitcoin at a high price began to sell it in mass, while other market participants instantly bought back those volumes. Traditionally, such a market situation is followed by the cryptocurrency reaching a real bottom. Earlier, analysts from Glassnode said that the capitulation in the crypto-assets market will continue amid the ongoing extraordinary financial stress. Experts suggested that future pressures on the virtual coin market will continually increase and eventually trigger Bitcoin to fall below the $20,000 mark. Former CEO of BitMEX Arthur Hayes also announced his prediction about BTC future. The American businessman said in his blog that Bitcoin will soon hit rock bottom and will quickly recover because the US Federal Reserve will "print trillions of dollars again. Analysts prepared forecast of BTC major rival. For example, many industry experts suggested that Ethereum could more than double in value by the end of this year. Recently, experts from Finder updated their forecasts about the rate of altcoin, and most of them said that the coin would be at risk of falling to $675 by the end of 2022. Despite the negative short-term forecast, crypto experts from Finder still believe in the bright future of altcoin in the long term. So, analysts expect that by 2025 the price of Ethereum will grow up to $5,739 and by 2030 it will reach $14,412. Notably, back in January 2022, a team of economists from Finder predicted that ETH would surge to $26,338. At the same time, according to the results of its quarterly survey, 43% of respondents believe that now is the right time to invest in Ethereum, 41% believe it is worth to hold, and only 16% of respondents believe that it is time to sell ETH. The material has been provided by InstaForex Company - www.instaforex.com |
| Tesla has sold about 75% of its bitcoins Posted: 21 Jul 2022 06:30 AM PDT Since July 13, Bitcoin and Ether have experienced a moderate correction. As long as the technical correction remains under the control of purchasers, it is not viable to assert that there is a significant risk of a greater decline. We will discuss the additional strategy below. I want to say a few things regarding Tesla and its current relationship with Bitcoin. Let me remind you that Tesla invested $ 1.5 billion in bitcoin at the beginning of the year. The producer of electric vehicles stated that he anticipated long-term promise in bitcoin. The corporation has already sold three-quarters of its assets; perhaps the potential was not long-term, or the money was needed fast - we cannot say.
According to the report, as of the end of the second quarter, the corporation had converted nearly 75% of its bitcoin assets into fiat currency. The total transaction amount was $ 936 million. Elon Musk, the CEO, is quite fond of pushing numerous tokens and alternative cryptocurrencies. When his company acquired a large amount of bitcoin last year, he was doing the same thing. Musk frequently tweets about various digital currencies that have substantial reactions to this. Many analysts have determined that the so-called "crypto winter" has arrived, as the price of bitcoin has dropped by half in the past four months, and Tesla appears to have decided that cash is now much more important than digital. The fair market value of Tesla's bitcoin holdings reached $ 2.48 billion in the first quarter of 2021 and was approximately $2 billion by year's end. The corporation did not disclose its selling price. It is important to note that the sales took place during the second quarter when the price of bitcoin fluctuated between $46,000 and $19,000. Due to the transaction, Tesla's total bitcoin losses are now projected to be over $460 million, according to experts. In an interview, Musk stated, "We sold a portion of our bitcoin holdings since we did not know when the COVID limitations in China would be lifted, so we needed to optimize our cash position and build up our cache." This should not be interpreted as a verdict on the bitcoin market; funds were required. He added that Tesla is open to expanding its cryptocurrency holdings in the future. When Tesla acquired bitcoin for a substantial amount in the first quarter of 2021, the firm cited the diversity of income and expenses as the reason. As the exchange rate soared, the corporation rapidly sold 10 percent of its shares, generating a profit of $ 101 million. Then it was revealed that Tesla would sell automobiles for bitcoins, but after some time, Elon Musk stated that Tesla would no longer accept cryptocurrency payments owing to the negative environmental effects of cryptocurrency mining, adding that the company would not sell bitcoins. After more than a year, around 15% of the purchase price remains on Tesla's financial sheet. We talk one thing yet act differently. Regarding the technical outlook for bitcoin, the balance of power has shifted slightly toward sellers. In the case of a further decrease in the trading instrument, speculators will defend the $22,185 support level, which plays a crucial role. Its collapse and consolidation beneath this range will cause the trading instrument to return to the lows: $21,400 and $20,700, and from there to $19,960 and $19,230. If the demand for bitcoin resumes, it will be necessary to break above $ 23,070 to establish an upward trend. Fixing higher will drive the trading instrument to a maximum of $23,600, which is extremely near to the level of $24,280. A further-off objective will be the $25,780 region. Buyers of ether are now concentrating on the $1,540 resistance. Only after growth above this level can we anticipate a sharper surge with the repeat of the highs of $1,630 and $1,740, as well as the possibility of constructing a medium-term upward trend. A return to $1,740 and consolidation on that level will spur new purchases to update the $1,830 resistance, for which a fierce battle will resume. In the event of ETH pressure, bulls will attempt to defend $1,460. At the breakdown of this range, it is prudent to anticipate purchases between $1,390 and $1,320. The material has been provided by InstaForex Company - www.instaforex.com |
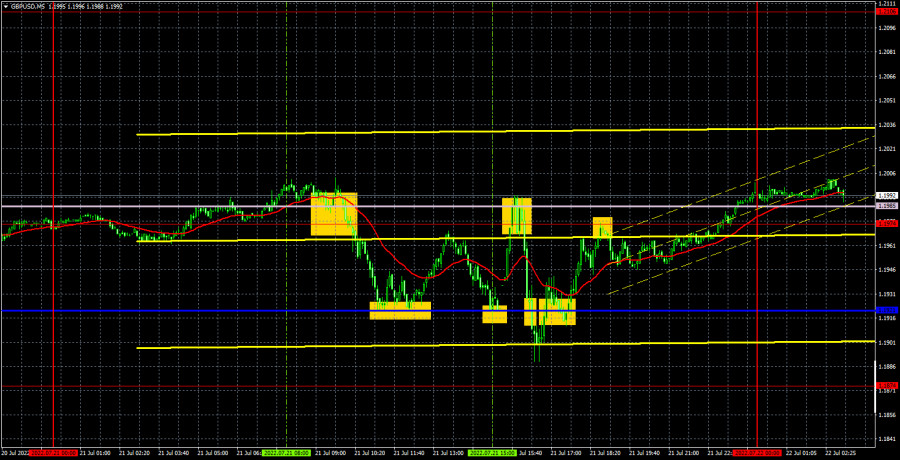
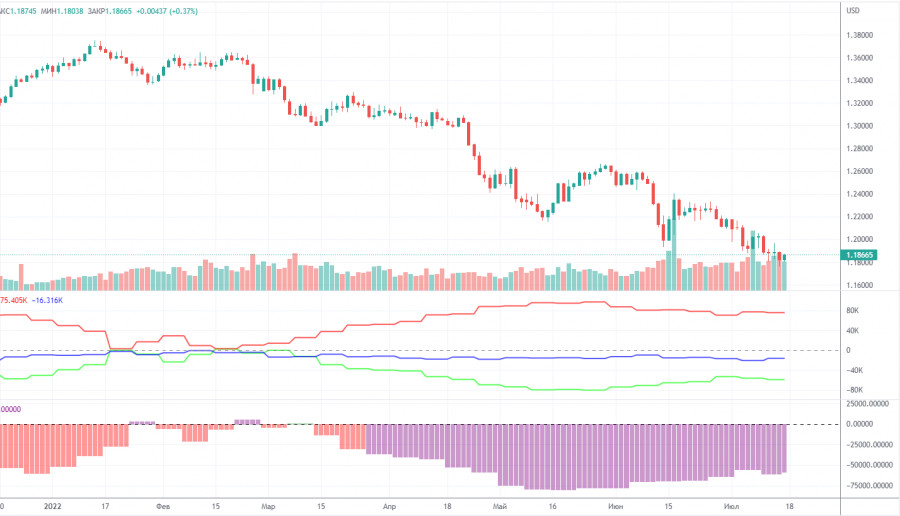
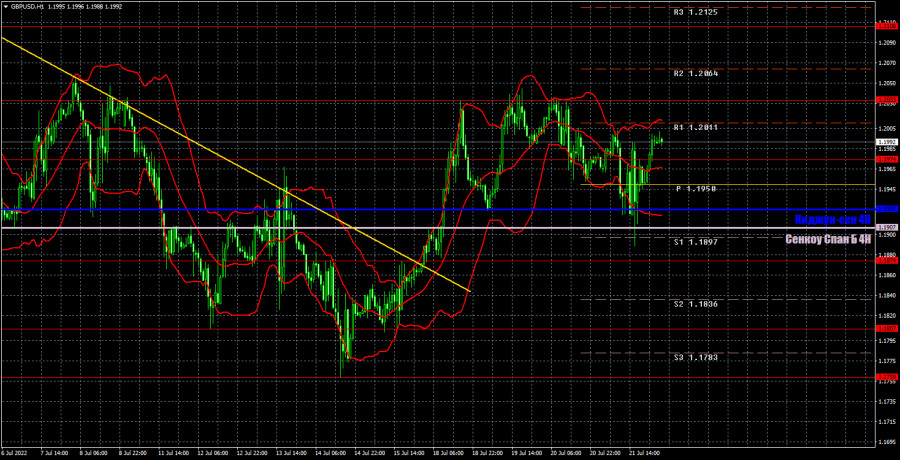
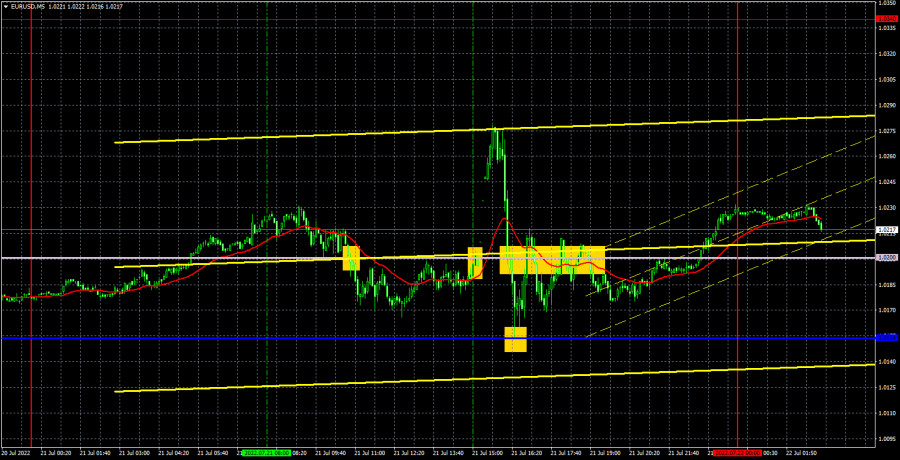
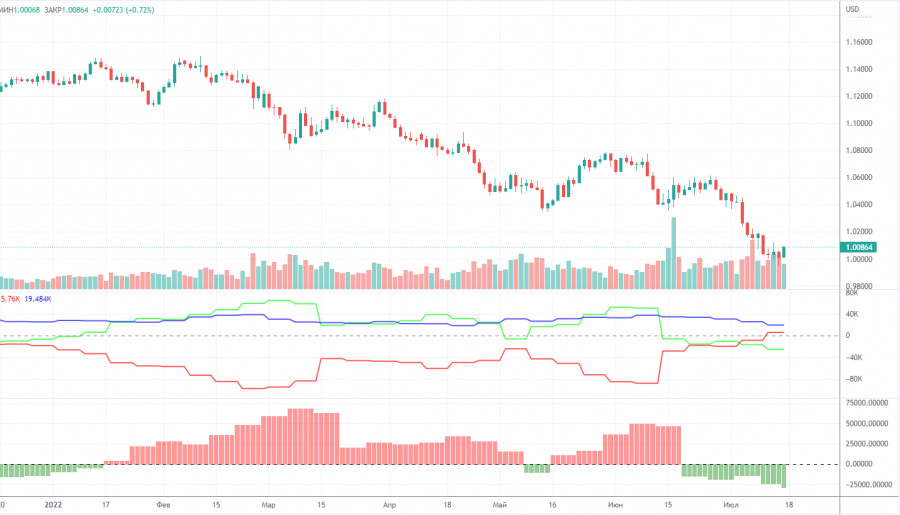
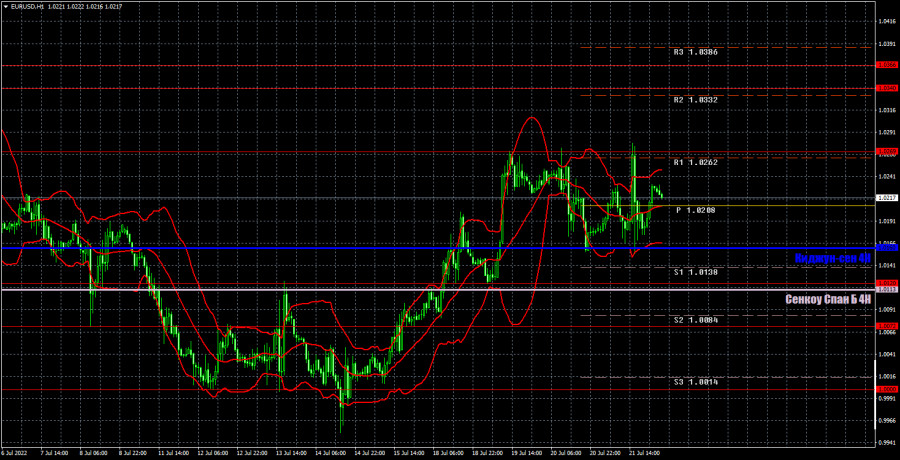
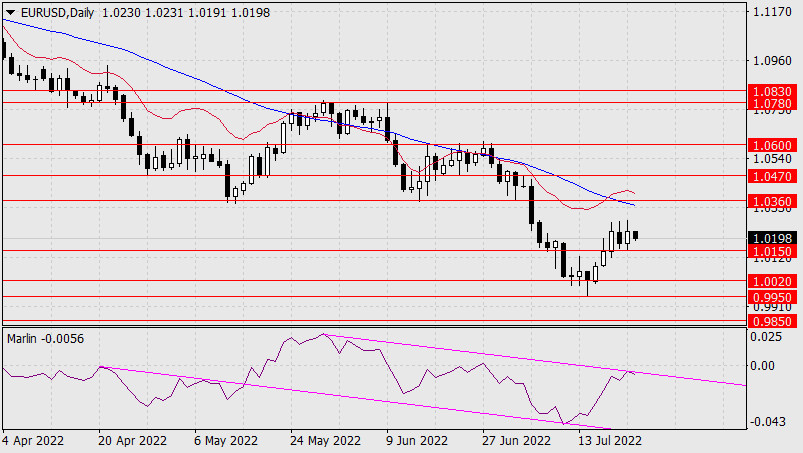
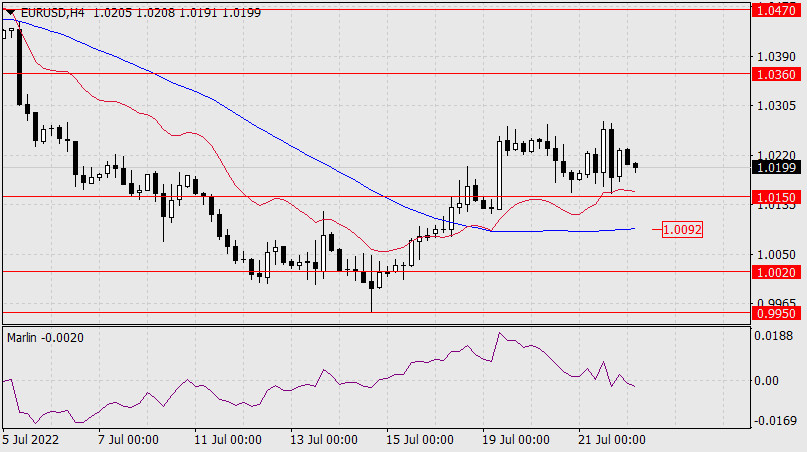
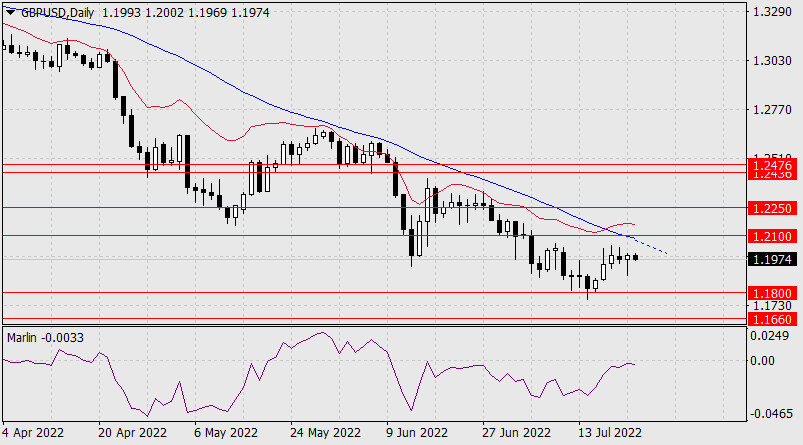
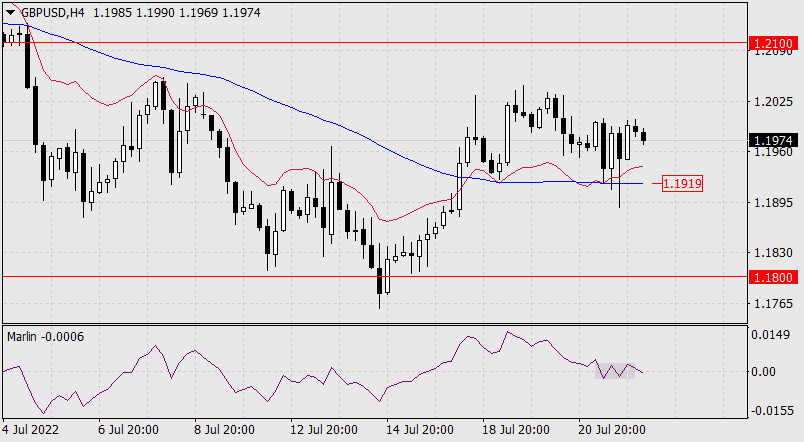
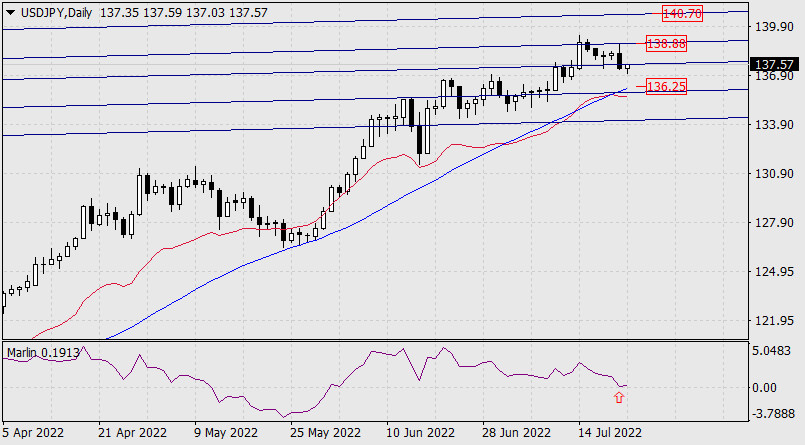
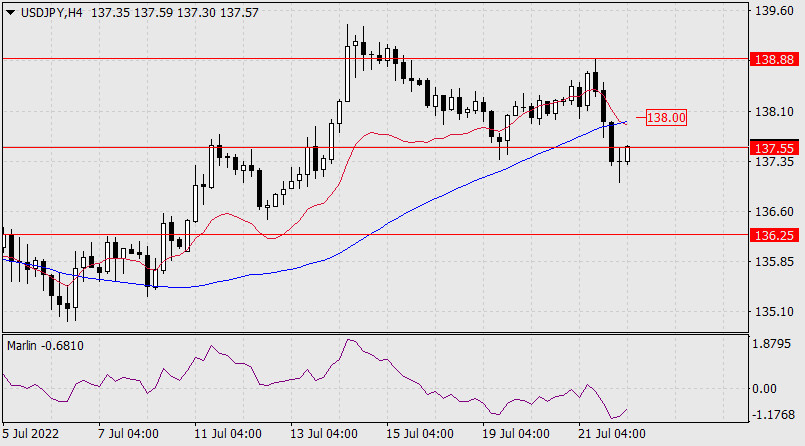
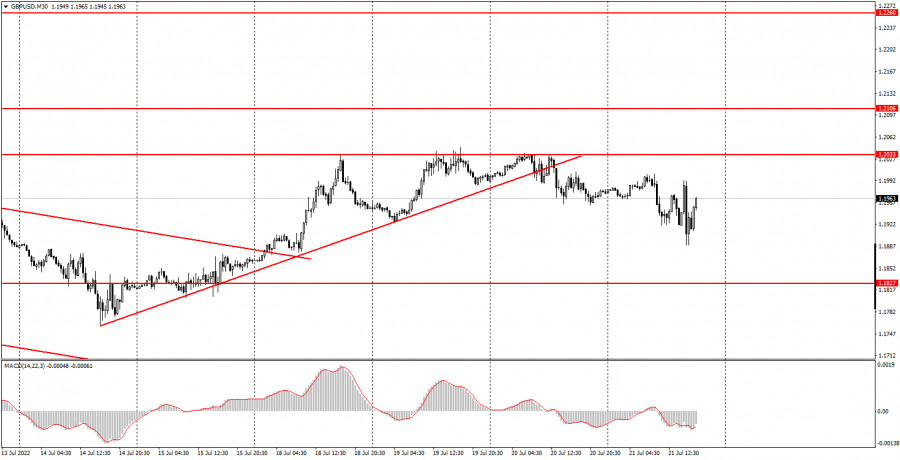
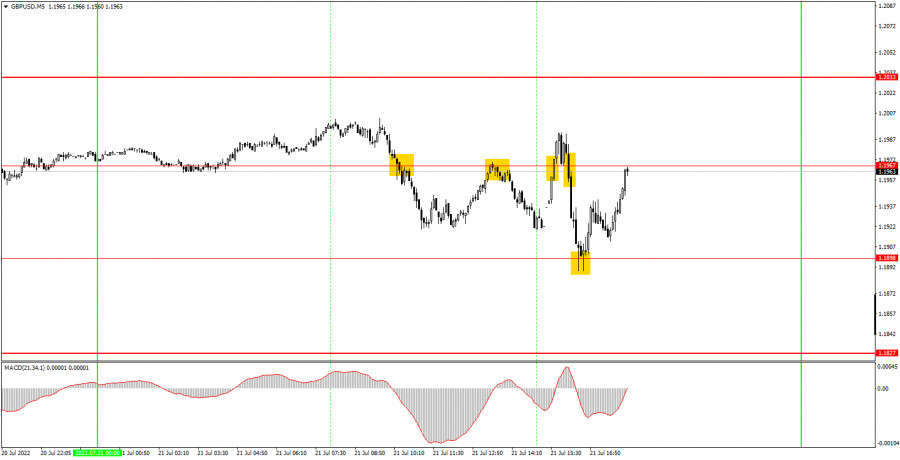
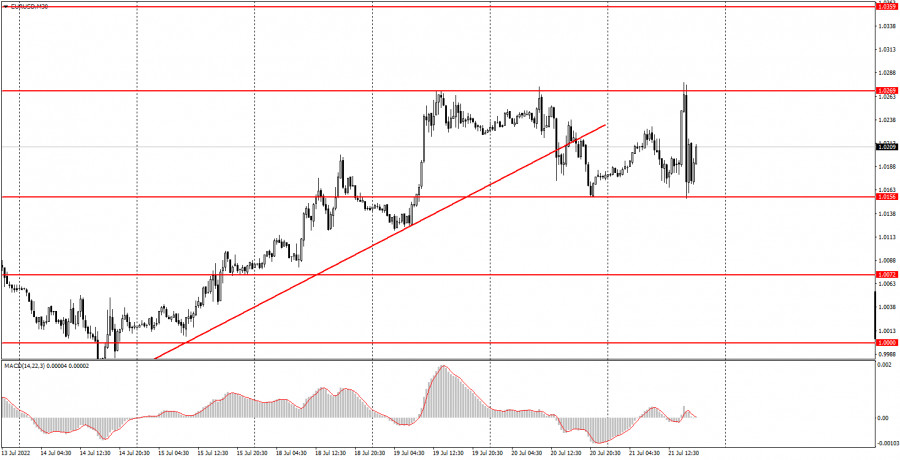
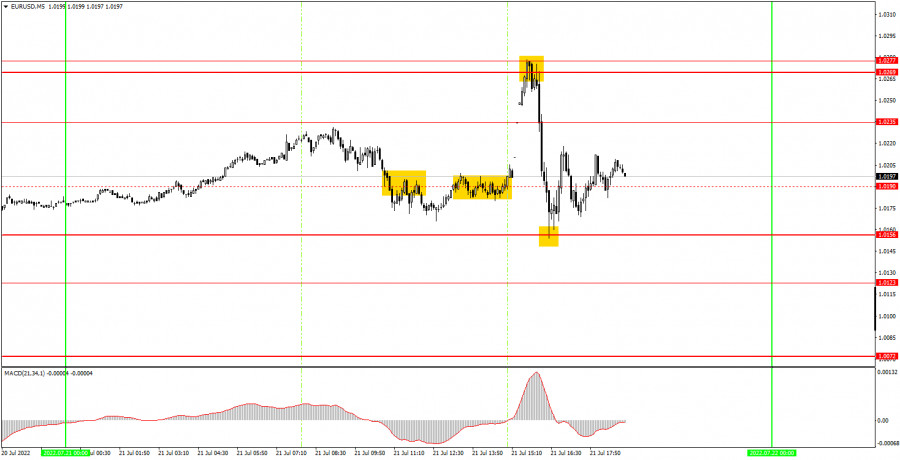
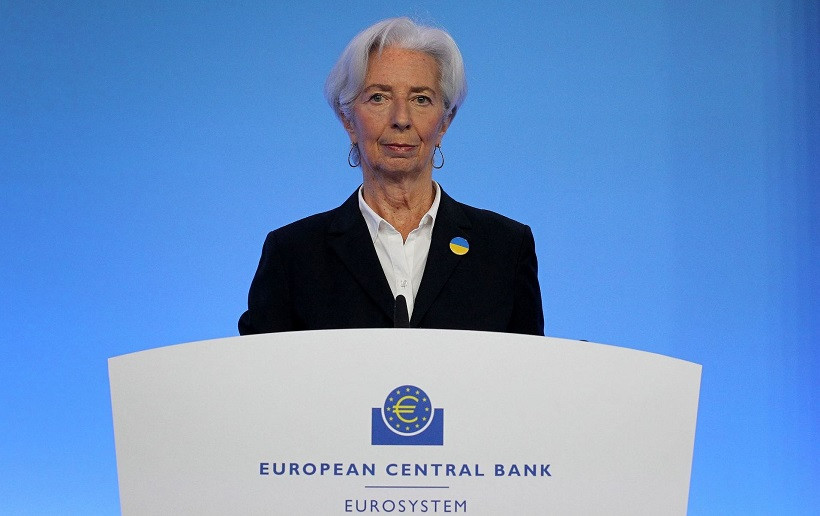
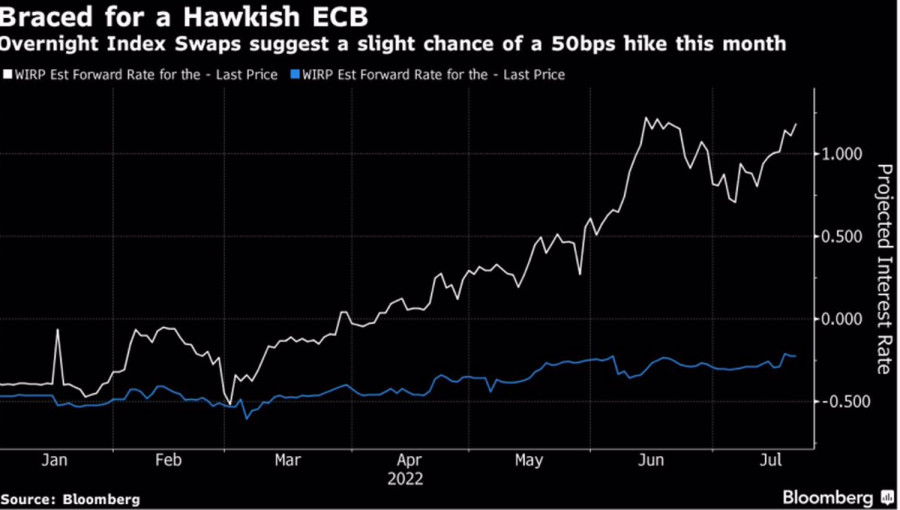
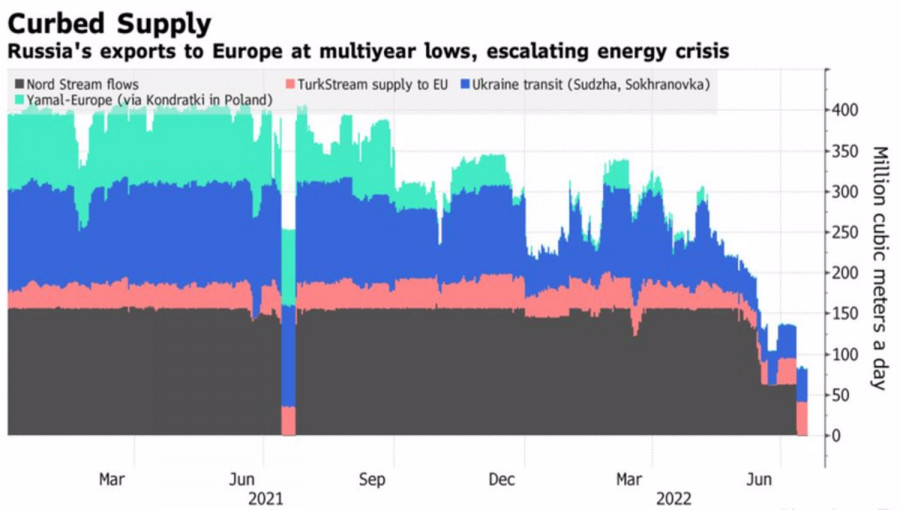
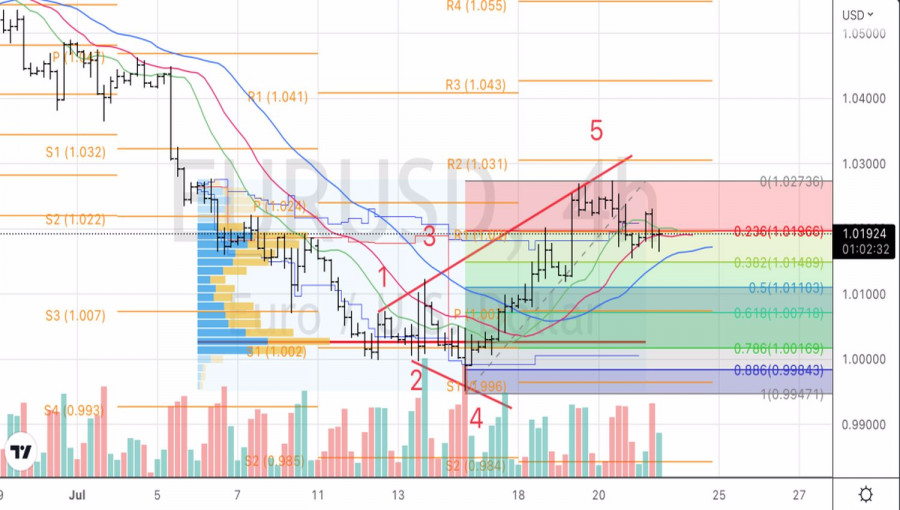

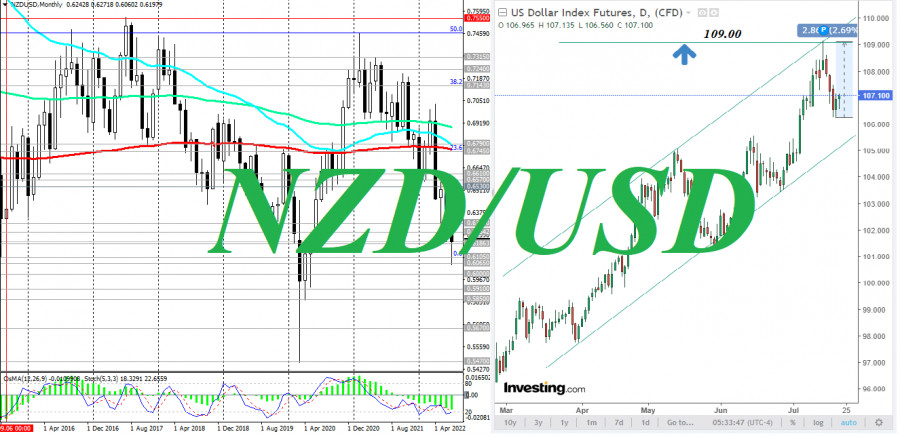
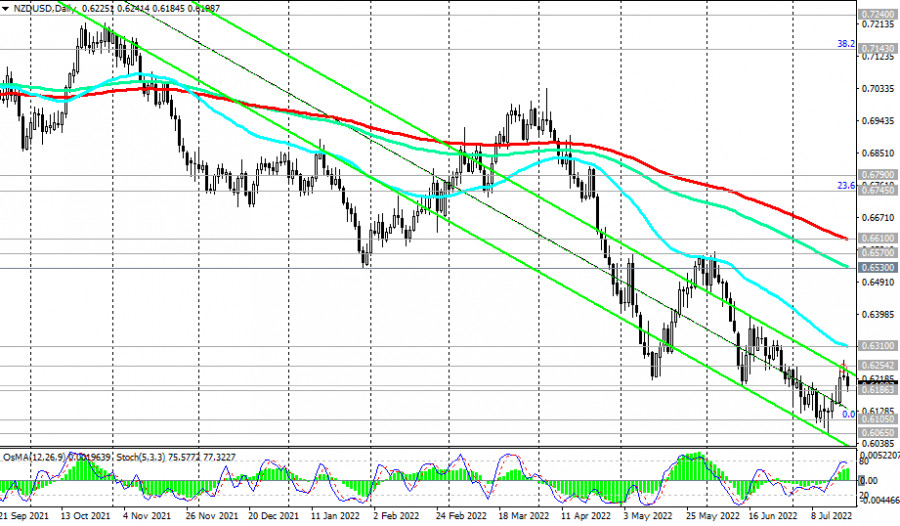

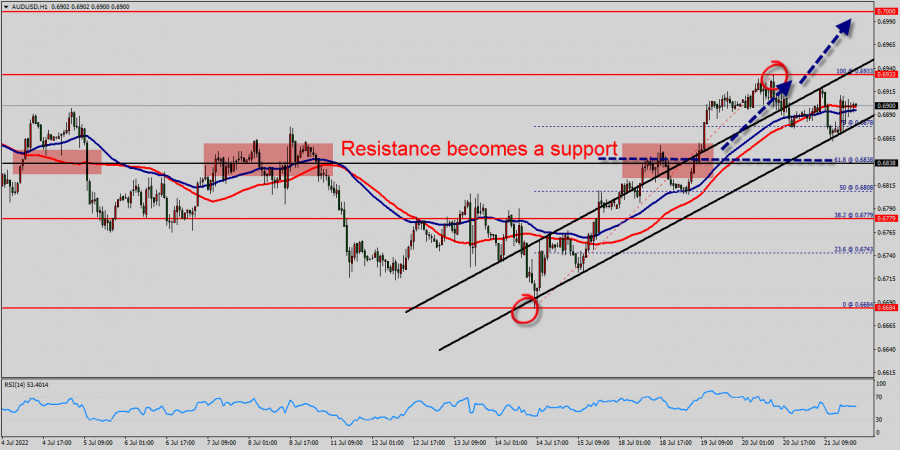
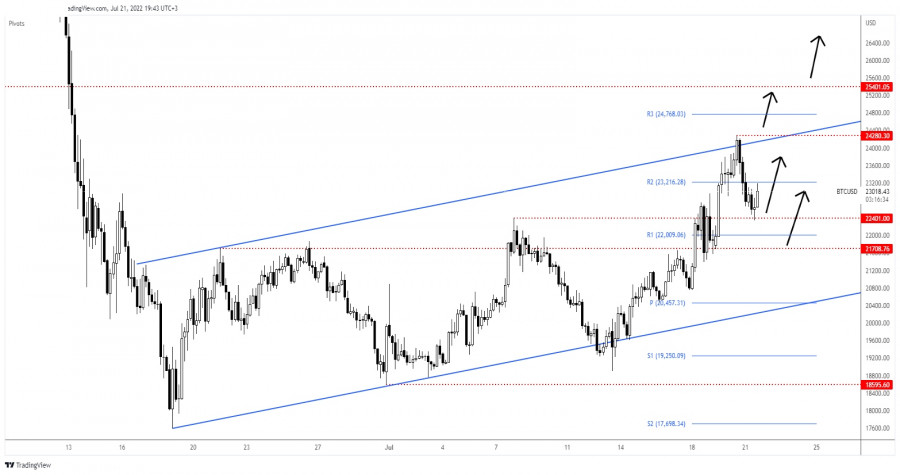
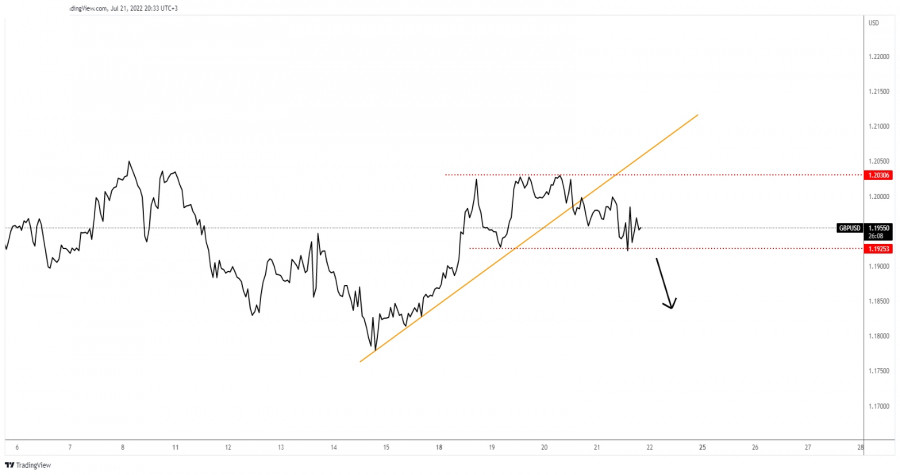
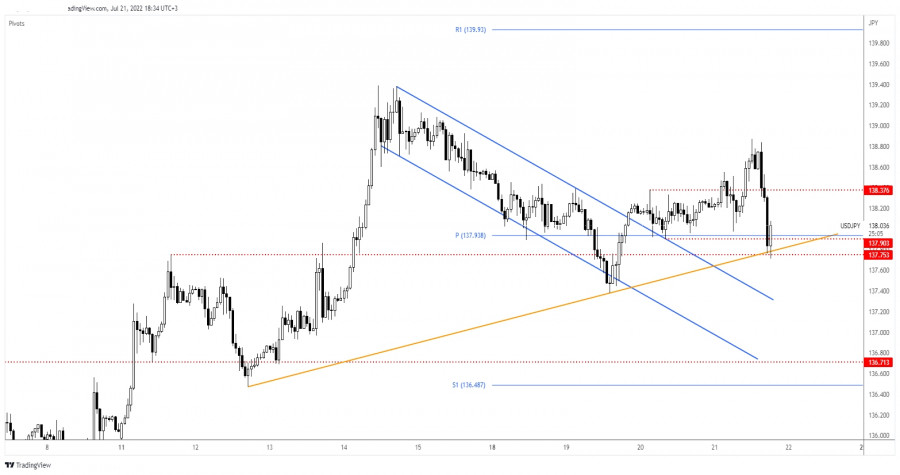
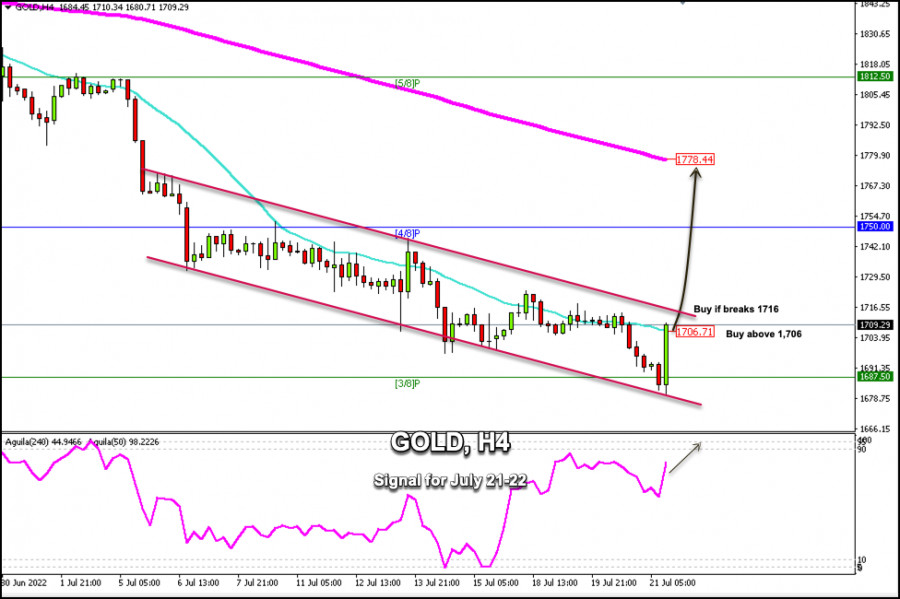
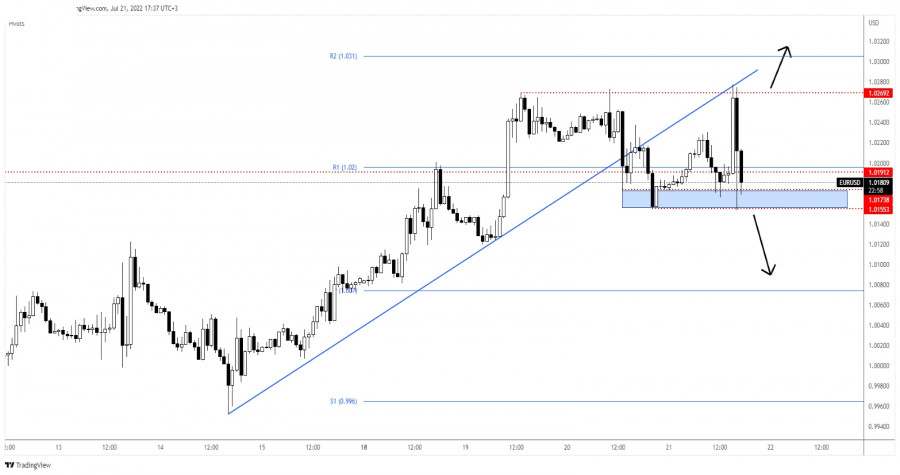
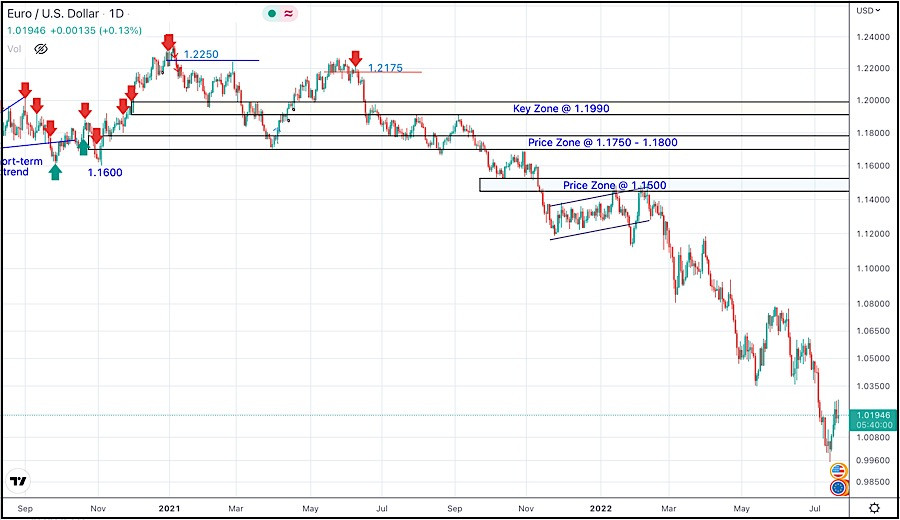
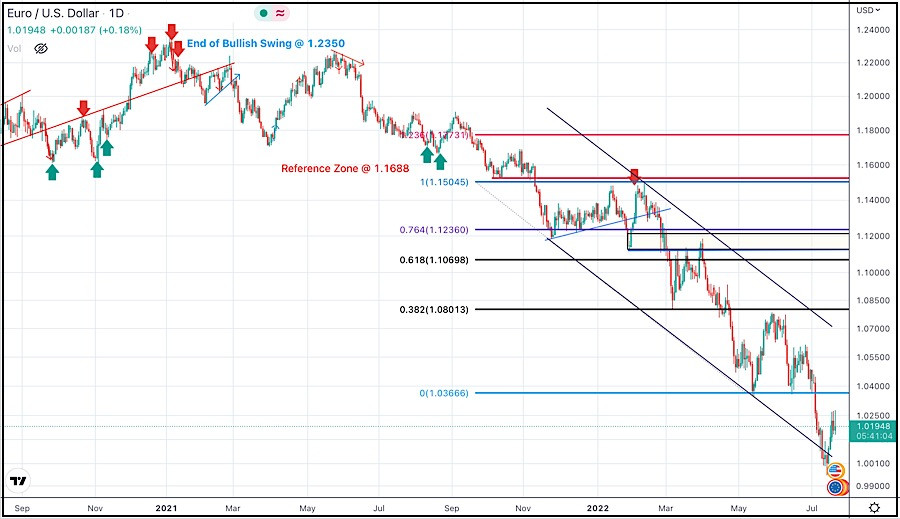
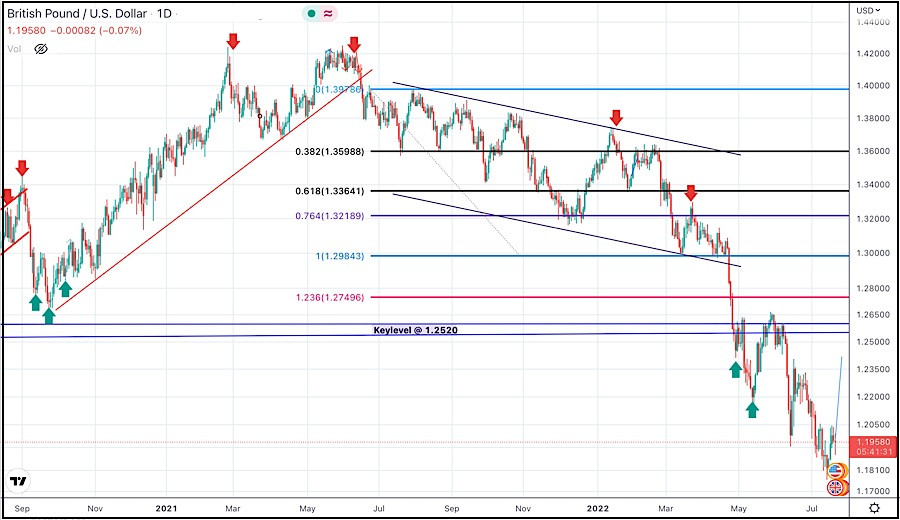
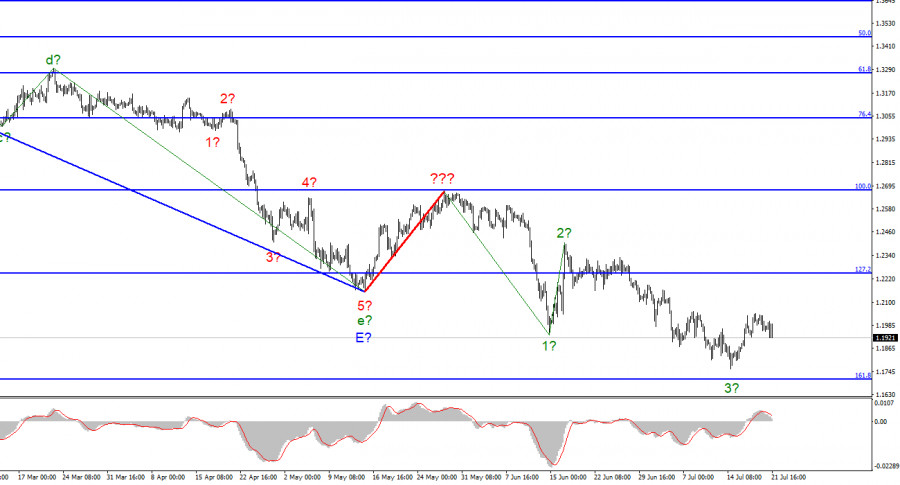
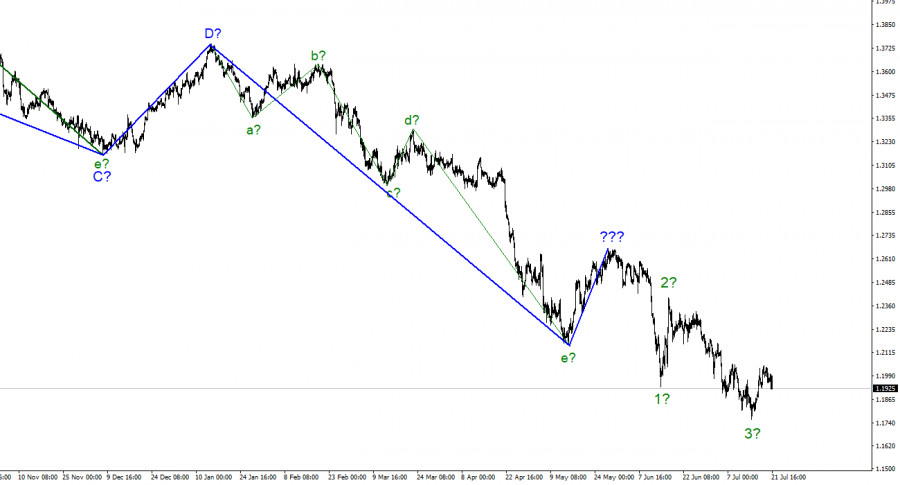
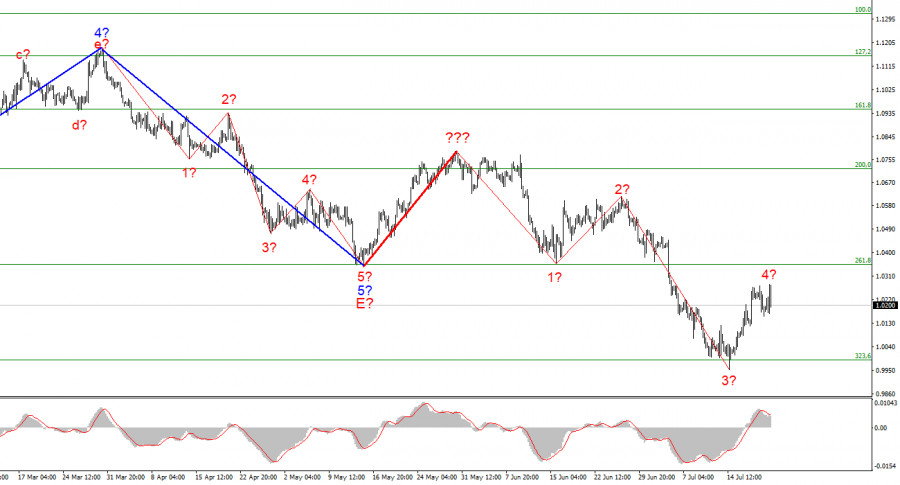
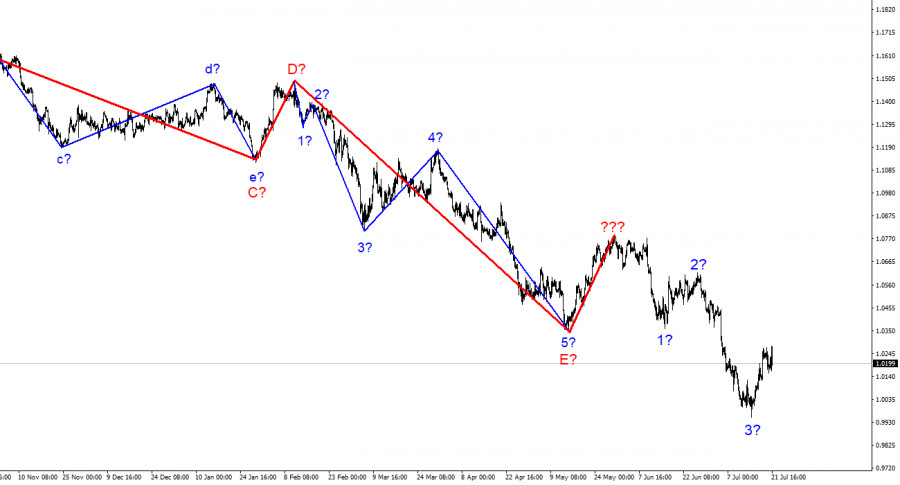

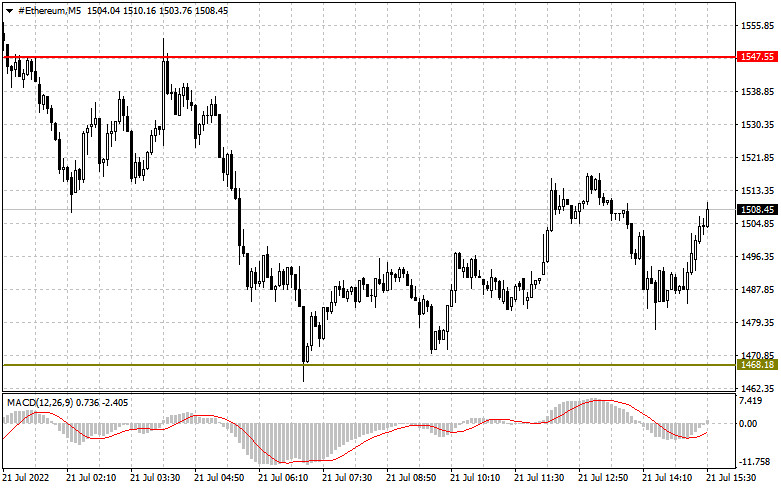
| You are subscribed to email updates from Forex analysis review. To stop receiving these emails, you may unsubscribe now. | Email delivery powered by Google |
| Google, 1600 Amphitheatre Parkway, Mountain View, CA 94043, United States | |


Comments