Forex analysis review
Forex analysis review |
- Bitcoin: attention at resistance
- USD/CHF: upside continuation signaled
- Dollar in a win-win situation
- EUR/USD: European Gas Crisis, Fed Minutes, and Priority of Short Positions
- Trading plan for Ripple on July 07, 2022
- Trading Signal for EUR/USD for July 07 - 08, 2022: buy above 1.0130 (3/8 Murray)
- Gold: fresh bearish continuation pattern
- EUR/USD: further downside ahead
- US stock market posts modest gains
- AUDUSD potential bounce imminent
- Gold could bounce towards $1,770
- Ichimoku cloud indicator analysis on EURUSD for July 7th, 2022.
- Bitcoin continues to trade inside the short-term trading range.
- XAU/USD Technical Analysis and Trading Tips for July 7, 2022
- EUR/USD on July 7. Fed minutes provide traders with no new information
- EUR/USD analysis on July 7. The market is preparing for the nonfarm payroll report on Friday.
- Technical analysis recommendations on EUR/USD and GBP/USD for July 7, 2022
- US premarket trading analysis for July 7: traders continue to buy dip
- GBP/USD: plan for US trade on July 7. Demand for GBP increases amid Boris Johnson's resignation
- EUR/USD: trading plan for American session on July 07 (overview of morning trades). EUR stuck in narrow range
- Trading plan for Ethereum on July 07, 2022
- GBP/USD on July 7, 2022
- Trading plan for Bitcoin on July 07, 2022
- US market resists negative sentiment from Fed
- Daily Video Analysis: GBPUSD, H4 Bearish Continuation Strategy
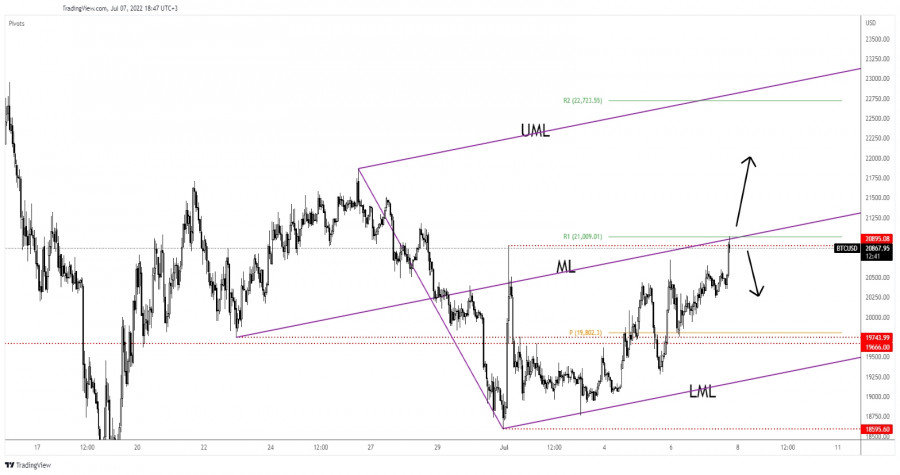
| Bitcoin: attention at resistance Posted: 07 Jul 2022 09:23 AM PDT Bitcoin rallied in the short term and now is trading at 20,859. It has climbed as much as 21,017 today where it has found temporary resistance. BTC/USD increased by 6.42% from yesterday's low of 19,750 to today's high. In the last 24 hours, BTC/USD is up by 3.55% and by 8.95% in the last 7 days. The current rally boosted the altcoins as well. Now, the token has reached strong resistance levels, it remains to see how it will react. BTC/USD Challenges Upside Obstacles!
BTC/USD reached the median line (ml), 20,870 former high, and the weekly R1 (21,009). These represent upside obstacles, so only a valid breakout may signal an upside continuation. Technically, we have a strong supply zone around these upside obstacles. False breakouts or a strong bearish pattern could announce a new sell-off. Still, in the short term, its failure to stay under 19,666 signaled strong upside pressure. BTC/USD Forecast!A valid breakout above the median line (ml) and through the R1 (21,009) could confirm further growth and could help the buyers to catch a larger swing higher. The material has been provided by InstaForex Company - www.instaforex.com |
| USD/CHF: upside continuation signaled Posted: 07 Jul 2022 09:22 AM PDT
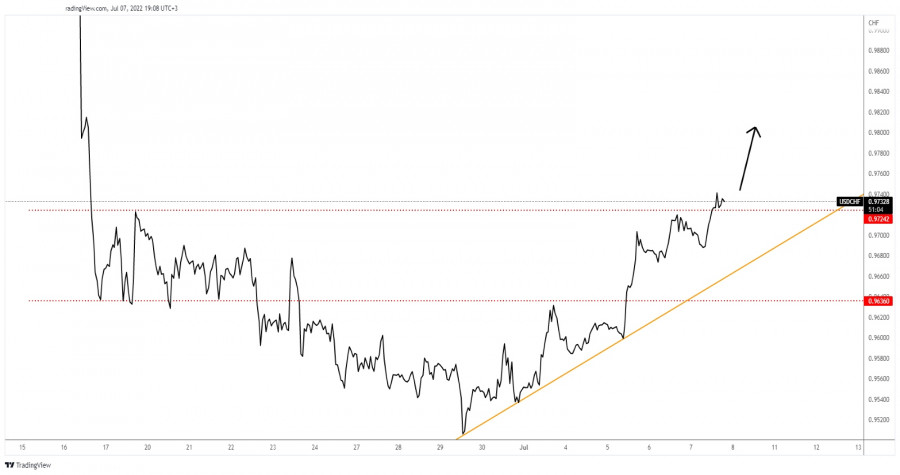
USD/CHF New Higher High!The USD/CHF pair extended its growth and now it has managed to jump above the 0.9724 former high which represented an upside obstacle. The price is located far above the uptrend line which stands as a downside obstacle. As long as it stays above this line, the USD/CHF pair could approach and reach new highs. Its failure to come back to test and retest the uptrend line signaled strong buyers and potential upside continuation. USD/CHF Trading Conclusion!The current breakout above the 0.9724 former high could activate further growth. You can see that the rate has tried to test the broken upside obstacle confirming the breakout. Jumping above 0.9742 today's high could confirm an upside continuation. The material has been provided by InstaForex Company - www.instaforex.com |
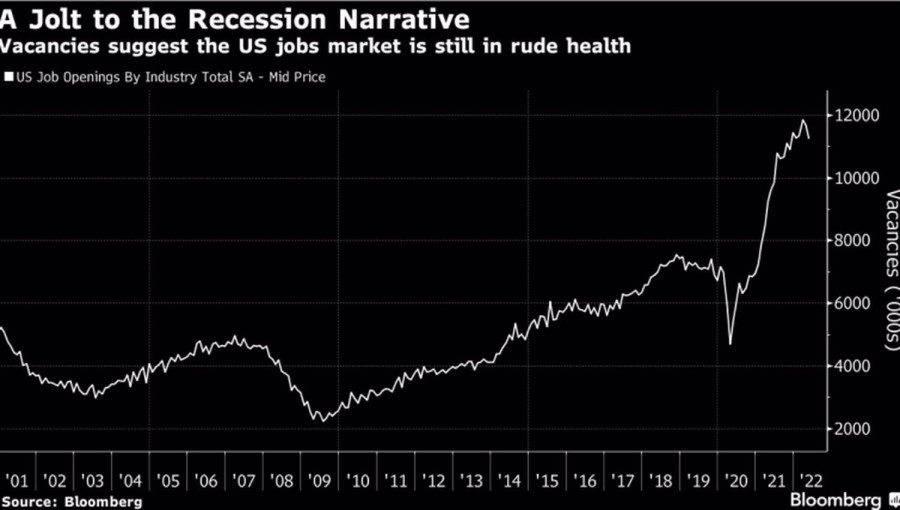
| Posted: 07 Jul 2022 08:55 AM PDT From inflation to recession and back. The markets are stormy, and very much so. Investors rush from one extreme to another, which is reflected in the dynamics of various assets. The only safe bet seems to be the US dollar. If US consumer prices do not slow down, the Fed will continue to tighten monetary policy aggressively. If the global economy faces a recession, the US dollar will win as a safe-haven currency. Is parity in EURUSD inevitable? Judging by the minutes of the June FOMC meeting, the central bank is so scared of keeping inflation at an elevated level that it is ready to sacrifice the economy to return PCE to the target. Jerome Powell and his team are determined to bring the rate not only to the neutral level, but also to raise it even higher. As a result, borrowing costs were raised by 75 bps in June and are likely to rise by the same amount in July. If the Fed does not show determination, it is unlikely that it will be possible to break the upward trend in inflation expectations. At the same time, aggressive monetary restrictions also have a downside—recession. Weak statistics in the US reinforce fears about its imminent approach, contributing to a decrease in the yield of treasury bonds, which, it would seem, should weaken the US dollar. In fact, the US data has been pleasing to the eye lately. The number of vacancies decreased slightly, but it turned out to be better than the forecast of Bloomberg experts. It is hard to imagine that with such a strong labor market, the economy is in for a recession. Dynamics of the number of vacancies in the USA
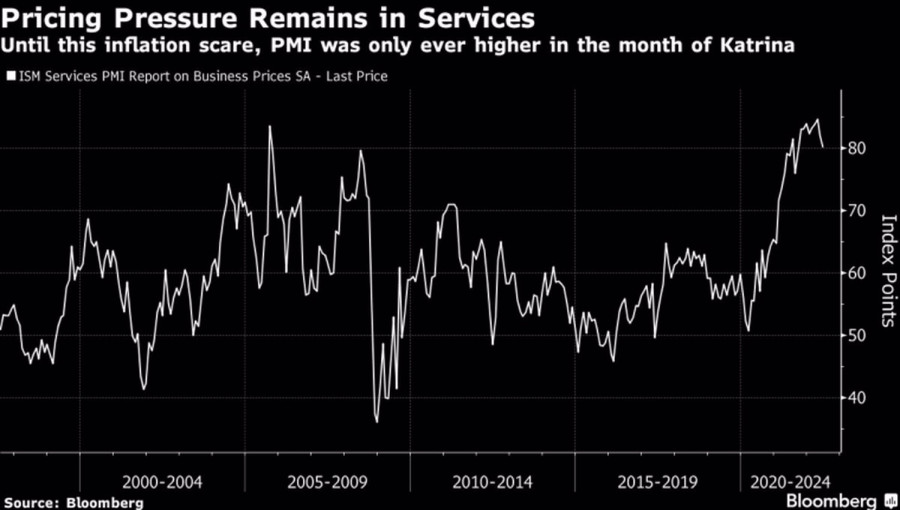
The final value of the purchasing managers' index in the service sector also came out better than expected. An important point: respondents to the ISM survey predict a slowdown in producer prices, which gives hope that the Fed will still be able to achieve a soft landing for US GDP. The recovery of the sector after the pandemic is going well: is it worth worrying about the recession? Dynamics of prices expected by purchasing managers
Europe is in a much worse state. The next round of the energy crisis is bringing a recession in the eurozone economy, and the political crisis in Britain adds fuel to the fire of sales of most currencies of the euro area. Against this background, the WHO statement that Europe is currently the epicenter of the pandemic looks like something insignificant. According to the organization, the infection rate has increased by 30% in the past two weeks. However, Omicron is considered less dangerous than previous strains, and humanity has learned how to deal with COVID-19. So is it worth remembering?
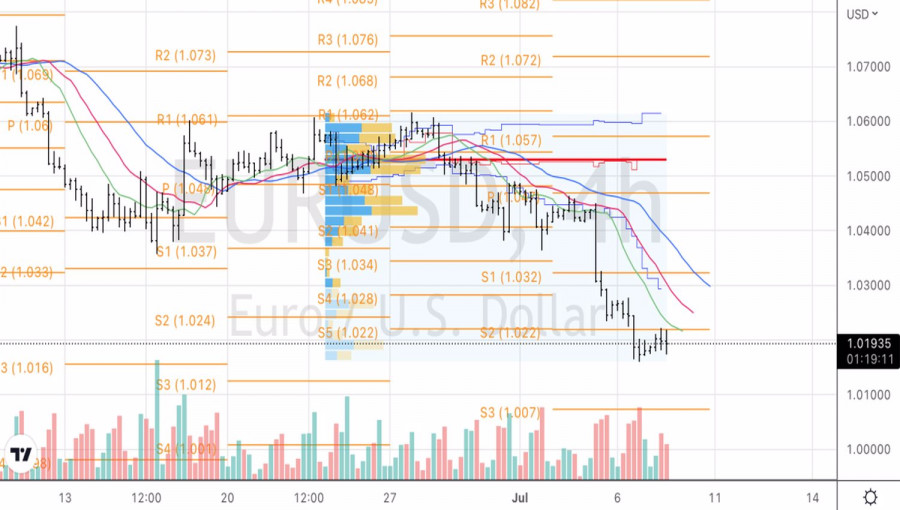
The positions of the euro look vulnerable, including because of the ECB, which does not yet have a clear plan for how to beat inflation and at the same time prevent fragmentation of the eurozone. Technically, on the EURUSD 4-hour chart, the inability of the bulls to return above the cluster of pivot points near 1.022 indicates their weakness. This circumstance allows us to recommend selling the main currency pair on a break of support at 1.016. The material has been provided by InstaForex Company - www.instaforex.com |
| EUR/USD: European Gas Crisis, Fed Minutes, and Priority of Short Positions Posted: 07 Jul 2022 08:52 AM PDT The bears of the euro-dollar pair took a break and suspended the downward tour. A corrective pullback was brewing yesterday, but the price was already falling by inertia, overcoming all support levels unattainable over the past 20 years. Now—consolidation and a small correction. After all, the next price breakthrough should lead to a level of parity, that is, to a powerful, psychologically important price barrier. There is a high risk of catching a "price bottom" in this price area since the growth of the US currency is more of an emotional nature. The excitement around the greenback is primarily due to the flight from risks amid the strengthening of anti-risk sentiment in the markets. As a rule, such price declines or rises are very fleeting, while further prospects look rather vague. The pair can hover in the range of 1.0150–1.0300 for several weeks, or form a price bottom, pushing off from it for an "upward hike" to the area of the 7th figure.
Note that the EUR/USD sellers were besieging the 1.0340 support level (a five-year price low) for almost two months before deciding on a downward break. How long it will take market participants to overcome the 1.0000 mark is an open question. Even the assault on the parity level is even more questionable, given the first signs of a slowdown in inflationary growth in the United States (we are talking about the core price index for personal consumption spending, which has been slowing for the third month in a row). Therefore, traders, for the most part, do not risk holding short positions at such long-term price lows: as soon as the downward impulse began gradually fading, sellers took profits, after which the price froze at the border of 1 and 2 figures. However, longs now look even riskier. The euro is under the yoke of numerous problems that are growing every day like a snowball. In the center of attention, first of all, the aggravated energy crisis. The gas price on European exchanges has already exceeded $1,900 per thousand cubic meters, the highest figure in the last four months. The cost of "blue fuel" has been actively growing since the beginning of the week—on Monday afternoon, for example, gas cost $1,700, and by evening it rose to $1,800 per thousand cubic meters. Gas and energy prices are rising amid a reduction in supplies from the Russian Federation. Energy prices in the Eurozone rose by almost 42% in June. German electricity contracts for delivery next year hit their highest trading prices in history: the price jumped on Monday by 13% to 325 euros per MWh. A similar situation has developed in France. The largest industrial energy consumers in Europe have warned the authorities that with the advent of cold weather, some plants could stop due to an acute fuel shortage, and emergency measures introduced to limit its use, according to the Financial Times. Against such prospects, experts from large financial conglomerates continue to voice pessimistic estimates, predicting a recession in the eurozone economy as early as the 4th quarter of this year. In such circumstances, the ECB must act cautiously: on one side of the scale—the fight against inflation, on the other—the risk of recession. The central bank is forced to walk between the raindrops, excluding the most radical scenarios, despite the hawkish expectations of many traders. While the Fed continues to show its determination, the minutes of the June meeting of the Fed, published yesterday, suggested that the regulator intends to further aggressively tighten monetary policy. However, the June meeting was held even before the release of the report on the growth of the core PCE, so currently, the corresponding degree of "hawkishness" can be reduced. But not in the context of the July meeting. Judging by the rhetoric of the Fed representatives (primarily those who have the right to vote in the Committee), we can assume that the 75-point rate increase at the July meeting is practically a settled issue. "Fed Minutes" only added confidence in this. According to the text of the document, the probability of a rate hike by 75 basis points at the next meeting in July "is assessed as high." Moreover, the protocol also contains another phrase that can be interpreted unambiguously in favor of the dollar: "over time, it is possible to conduct an even tougher policy." Thus, the EUR/USD pair is now in a clamped state. On the one hand, sellers are in no hurry to storm the parity level, for fear of catching a "price bottom". On the other hand, the prevailing fundamental picture is not conducive to a trend reversal. Therefore, in the current conditions, it is advisable to open short positions on corrective pullbacks, with downward targets of 1.0200, 1.0150. It is too early to talk about lower price values. The material has been provided by InstaForex Company - www.instaforex.com |
| Trading plan for Ripple on July 07, 2022 Posted: 07 Jul 2022 08:48 AM PDT
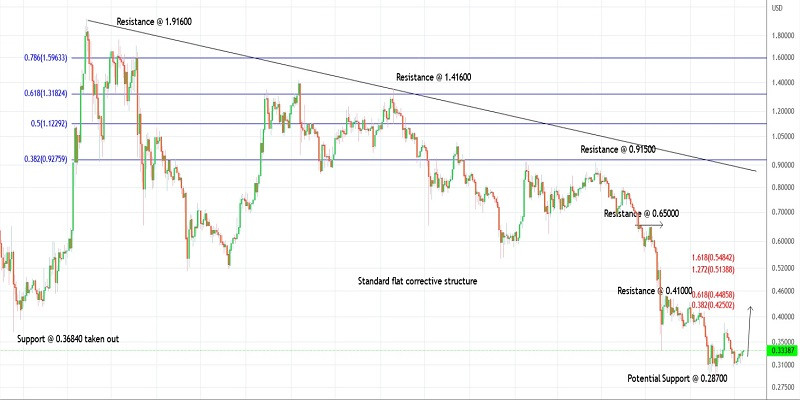
Technical outlook:Ripple climbed above the $0.33500 highs intraday on Thursday before easing off. The crypto is preparing to rally towards $0.44800 and $0.54800 in the near term, as projected on the daily chart. Please also note that initial resistance is at $0.41000. A break higher will confirm that bulls are back in control and a bottom is in place at around $0.28700. Ripple has been in a downtrend since April 2021 after hitting all-time highs at around $1.91600, major resistance on the daily chart. The overall drop has unfolded in three waves (Standard flat 3-3-5 pattern) at a larger degree. As discussed earlier, bulls should be poised to produce a three-wave corrective rally at least towards $0.91500, which is the Fibonacci 0.382 retracement of the entire drop. Ripple might also rally up to $1.41600 in the next several weeks to terminate the corrective rally and turn lower thereafter. Looking at the short-term scenario, the crypto has carved an upswing between $0.28700 and $0.38700. It has also retraced from the upper border at $0.31000 last week. Ideally, prices shuld stay above that mark and continue pushing higher. Going forward:Ripple seems to be supported at around the $0.28700 mark and bulls will be inclined to hold prices higher for the short to medium term. A push above interim resistance at around $0.38700 will accelerate a climb higher towards $0.44800 and beyond, taking out initial resistance at $0.41000. The bottom line is that bulls will remain in control from here if $0.28700 remains intact. Trading plan:Potential rally towards $0.44800 and $0.54800 against $0.28700 Good luck! The material has been provided by InstaForex Company - www.instaforex.com |
| Trading Signal for EUR/USD for July 07 - 08, 2022: buy above 1.0130 (3/8 Murray) Posted: 07 Jul 2022 08:44 AM PDT
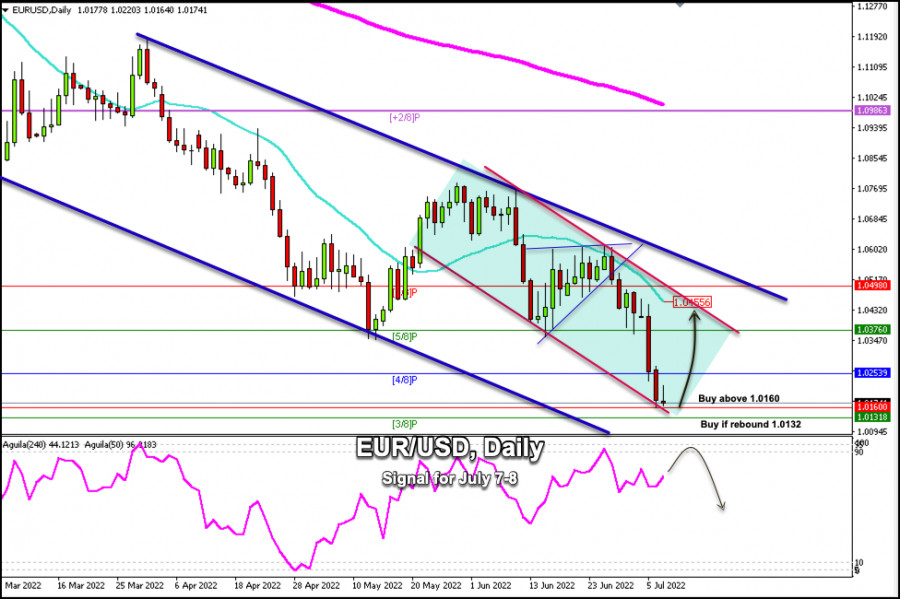
EUR/USD is trading under strong downward pressure fueled by fears that the FED could be more aggressive and could raise the interest rate by 100 basis points. This uncertainty caused investors to take refuge in the US dollar and left behind traditional safe-haven assets such as gold. The speculative interest is likely to stop and the euro could start a technical rebound. The US Federal Reserve released the minutes of the latest FOMC meeting. Policymakers repeated their well-known hawkish message but at least refrained from hinting at a 1.00% hike. US officials, however, left the door open for another 0.75% hike. According to the daily chart, the euro has found strong support in the 1.0160 area that can be seen in the chart. The downtrend channel has been formed since May 20. A strong technical bounce is expected in the coming days if EUR/USD consolidates above 3/8 Murray. EUR/USD is trading below all of its moving averages, with the 21 SMA (1.0455) keeping its slope firmly bearish above the current price (1.0167) and above the 200 EMA at 1.1000. In the medium term, the outlook remains very low, it is likely that the euro could reach the parity of 1 dollar for 1 euro, but a strong technical rebound is expected in the coming days, only if it consolidates above 1.0130 (3/8 Murray). According to the 4-hour chart, the euro is generating an oversold signal. According to the 1-hour chart, there is a strong oversold signal. The euro is expected to consolidate around the 1.0130 area which could suggest the opportunity to buy. According to the daily chart, we can see that the eagle indicator is giving a positive signal. However, it is approaching the overbought zone. This divergence could be a negative sign for the Euro. Before a sharp decline, the currency pair is likely to bounce towards the 21 SMA zone at 1.0456. Should the bullish force prevail, EUR/USD could reach the top of the downtrend channel formed on March 25 at around 1.0580. Our trading plan for the next few hours is to buy if EUR/USD settles above 1.0160 or in case of a technical bounce at around 1.0130, with targets at 4/8 Murray and 5/8 Murray. The material has been provided by InstaForex Company - www.instaforex.com |
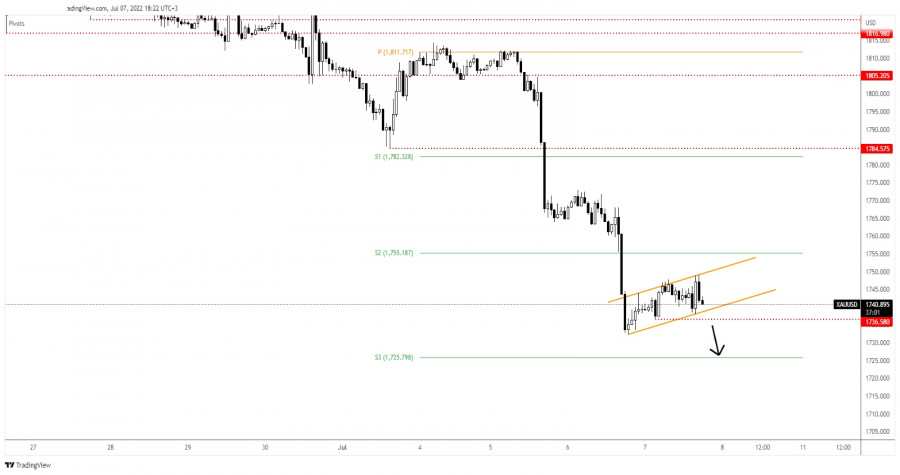
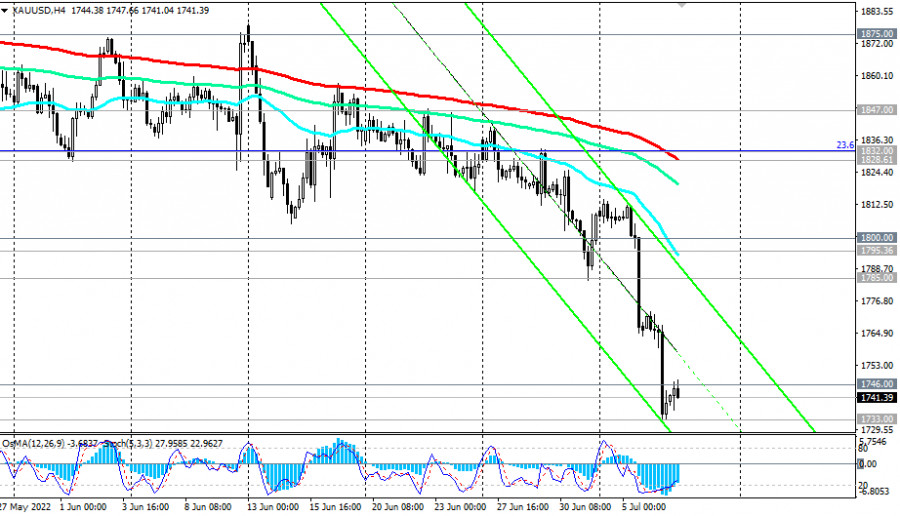
| Gold: fresh bearish continuation pattern Posted: 07 Jul 2022 08:44 AM PDT Gold was trading at 1,841 at the time of writing. The price action developed an up-channel pattern which could represent a downside continuation formation. After its massive drop, the price rebounded and recovered a little. You knew from my previous analyses that the price of gold could register only a temporary rebound. Technically, the bias is bearish, so temporary growth could bring new selling opportunities. XAU/USD is vulnerable to dropping deeper. The US JOLTS Job Openings, ISM Services PMI, and the Final Services PMI came in better than expected. Also, the FOMC Meeting Minutes confirmed a 50bps or 75bps rate hike in the July meeting. Tomorrow, the fundamentals could drive the market. The US NFP, Unemployment Rate, and the Average Hourly Earnings will be released. XAU/USD Flag Formation!
As you can see on the H1 chart, XAU/USD is trapped within an ascending channel pattern. A downside breakout could announce more declines. The price failed to approach and reach the weekly S2 (1,755) which represents an upside obstacle signaling strong selling pressure. The 1,736 former low stands as static support, while the minor uptrend line represents dynamic support. The resistance is seen at the channel's upside line. Gold Outlook!A new lower low, a valid breakdown below the uptrend line and below the 1,736 could validate a potential further drop towards the weekly S3 of 1,725. This scenario could bring new selling opportunities. The material has been provided by InstaForex Company - www.instaforex.com |
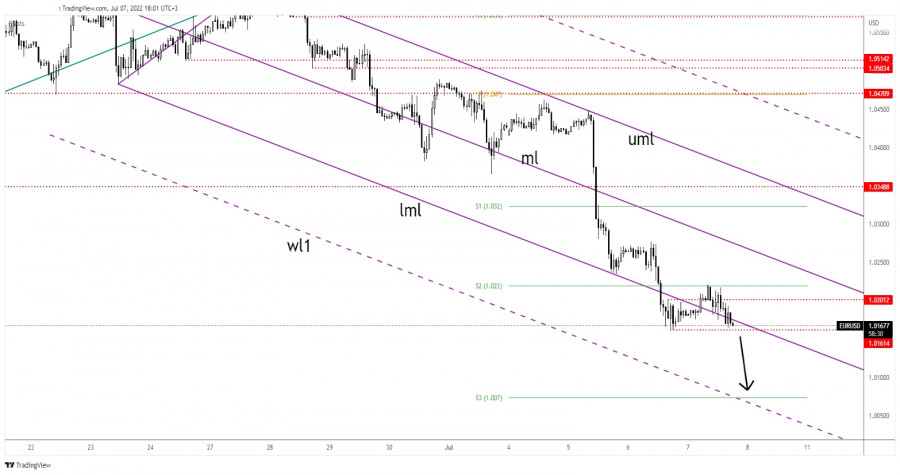
| EUR/USD: further downside ahead Posted: 07 Jul 2022 08:20 AM PDT The EUR/USD pair was trading at 1.0172 at the time of writing. As you already know, the bias is bearish, so more declines are in the cards. Temporary rebounds or range patterns could bring new selling opportunities. The pair tried to rebound as the Dollar Index dropped because the US data came in weaker than expected yesterday. Today, the US Unemployment Claims came in at 235K versus 230K expected, while the Trade Balance came in at -85.5B below -85.0B estimates. On the other hand, German Industrial Production increased only by 0.2% versus the 0.3% growth expected. EUR/USD Distribution!
In the short term, the EUR/USD pair is trapped between 1.0161 and 1.0220 weekly S1. I've told you in my previous analysis that the price could extend its sell-off after ending its minor rebound. As you can see on the H1 chart, EUR/USD failed to make a new higher high or to stay above the lower median line (lml) signaling strong downside pressure. Now, it's almost to reach the 1.0161 critical support. EUR/USD Forecast!Dropping and closing below 1.0161 could activate more declines and could bring new selling opportunities. The next major downside target is at 1.0100. The material has been provided by InstaForex Company - www.instaforex.com |
| US stock market posts modest gains Posted: 07 Jul 2022 07:03 AM PDT
The US stock market gained only 0.23-0.36%. The Dow Jones Industrial Average posted the weakest growth, up by 0.23%. The S&P 500 and the NASDAQ Composite added 0.36% and 0.35% respectively. Investors are focusing on the decisions taken at the US Federal Reserve's June meeting. Market participants are closely following all decisions by central regulators, as a sharp increase in interest rates could have a negative impact on both stock markets and the entire global economy. At its June meeting, the Fed confirmed its intention to tackle rising inflation at a rapid pace. For the first time in almost 30 years, the regulator increased the rate by 75 points at once to 1.5-1.75%. It also signaled its intention to increase it further. At the forthcoming meeting, which will take place this month, it is expected that the rate will be raised by 50 or 75 points. Minutes are not out yet, but markets are already pricing this 50-75 point hike. Investors are guessing what the rate will ultimately be after a series of increases. For example, if it rises by 50 points, it will reach 3%. If it rises by 75 points, it will increase to 3.25% or 3.5%. When the interest rate stops at 3.5% or higher, the possibility of recession in the economy will be close to 50%. Fed policymakers have also expressed concern about the impact an interest rate hike could have on the overall economy. According to the latest data, the ISM Services PMI edged lower to 55.3 in June of 2022 from 55.9 in May, beating market forecast of 54.3. Among the S&P 500's 11 sectors, eight moved up. The utilities and technology sectors were the biggest gainers. The oil and gas sector was down by 1.7% as oil fell to its lowest level in three months. Following the report of an upcoming deal for Amazon to buy a 2% stake in Grubhub from Just Eat Takeaway due to problems at the company, Uber Technologies, Inc. and DoorDash, Inc. were down by 4.5% and 7.4%, respectively. At the same time, Amazon's shares added 0.7%. Tyson Foods, Inc. was down slightly. Its shares fell by 0.1%. The company reported a forthcoming deal to acquire stakes in two poultry companies in Saudi Arabia to expand its business abroad. Kornit Digital, Ltd. saw the biggest drop in value with its shares falling by 25.7%. This was due to the company's worsening outlook for the second quarter of the year. Rivian Automotive, Inc. added 10.4% as the company quadrupled its shipments as a result of higher vehicle production volumes. The material has been provided by InstaForex Company - www.instaforex.com |
| AUDUSD potential bounce imminent Posted: 07 Jul 2022 06:57 AM PDT
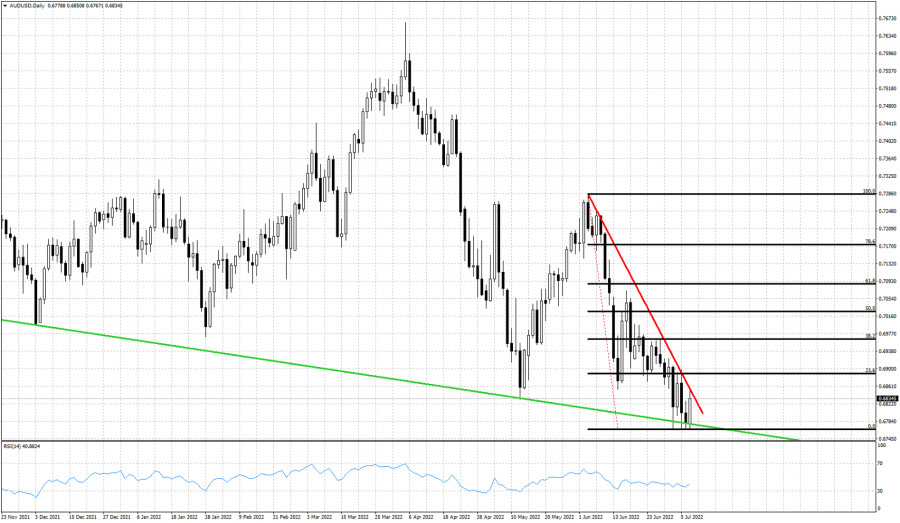
Green line -major support Red line -short-term resistance Black lines- Fibonacci retracements AUDUSD remains clearly in a bearish trend but the RSI is telling us that the downtrend is weakening and if certain conditions are met, AUDUSD could start a bounce towards 0.71 and why not higher. AUDUSD is now challenging short-term resistance as shown by the red downward sloping trend line. Breaking above this trend line at 0.6860 we will get a short-term sign of strength implying that AUDUSD could reach the 61.8% Fibonacci retracement of the last leg down. This short-term target is at 0.71. The bullish RSI divergence in the near term if combined with a break above the red trend line, will give us the bullish signal we expect. The material has been provided by InstaForex Company - www.instaforex.com |
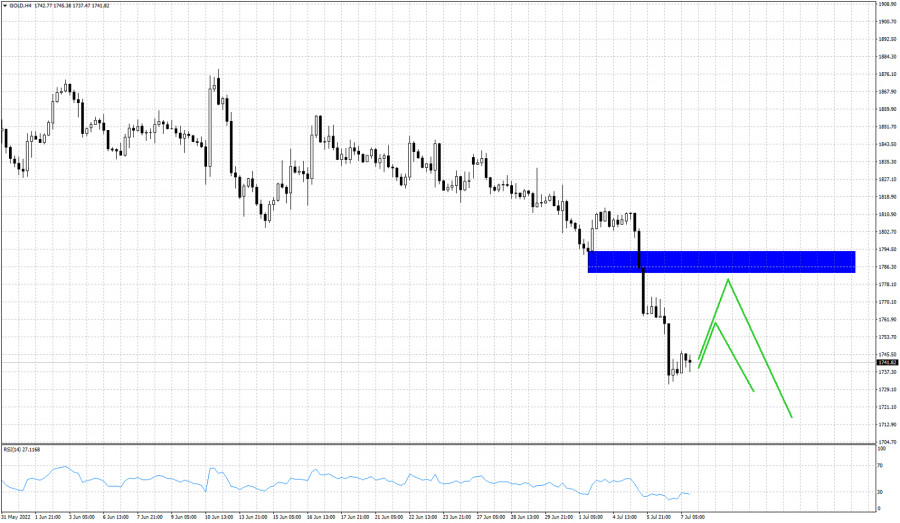
| Gold could bounce towards $1,770 Posted: 07 Jul 2022 06:48 AM PDT
Blue rectangle- resistance Green lines- potential price path over the next few sessions Gold price made a low yesterday close to $1,731 while now it is trading $10 higher. Trend is clearly bearish and with the RSI at oversold levels there are increased chances we see a short-term bounce in Gold price. A move higher by the RSI is expected to be seen over the coming sessions and some profit taking by bears, Our expectation is for Gold price to bounce higher but only as a counter trend move relative to the bigger medium-term bearish trend. Major resistance is found at $1,770-90 area and as long as price is below this level, we remain pessimistic for Gold. The material has been provided by InstaForex Company - www.instaforex.com |
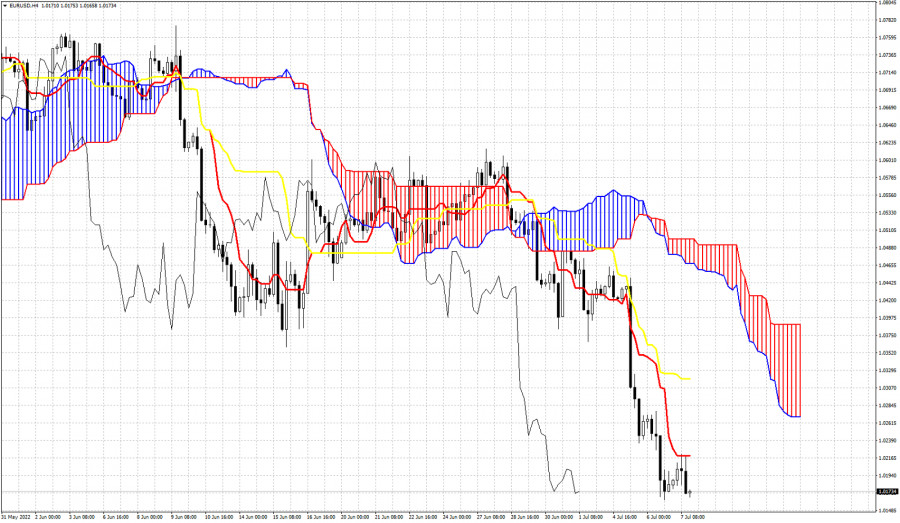
| Ichimoku cloud indicator analysis on EURUSD for July 7th, 2022. Posted: 07 Jul 2022 06:36 AM PDT
EURUSD is trading around 1.0170 just above yesterday's lows. There was an attempt by bulls to push prices higher. EURUSD climbed above 1.02 but got rejected at the tenkan-sen (Red line indicator) resistance. Trend remains clearly bearish. In order to see a stronger bounce higher, price must break above the tenkan-sen at 1.0220. Next meaningful bounce target if resistance is broken, is found at the kijun-sen (yellow line indicator) at 1.0318. Bears remain in full control of the trend as long as price is below the Kumo (cloud). The material has been provided by InstaForex Company - www.instaforex.com |
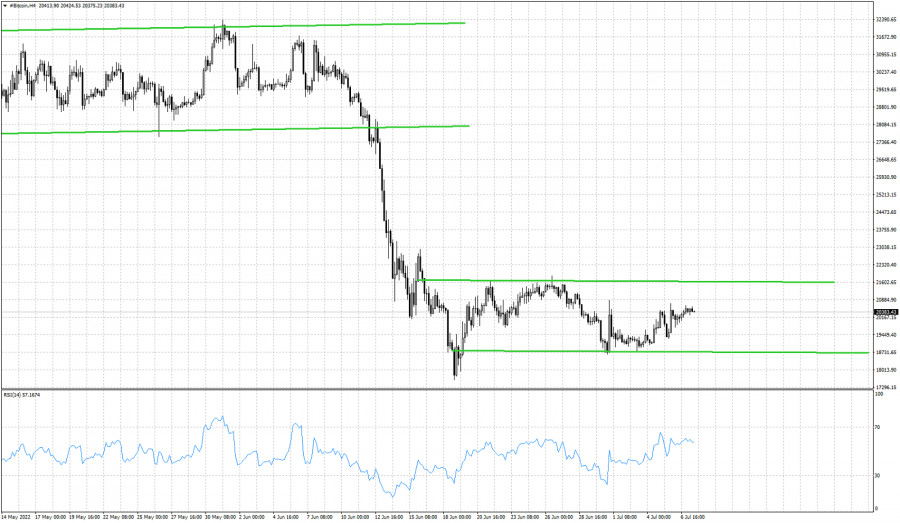
| Bitcoin continues to trade inside the short-term trading range. Posted: 07 Jul 2022 06:33 AM PDT
Green lines- trading range No meaningful price action so far by Bitcoin as price continues to mostly move sideways as we mentioned in our last analysis. Bitcoin is trading around $20,000 in what it seems to be a pause for the downtrend. Medium-term trend remains bearish as price has not stopped forming lower lows and lower highs after the all time high of $69k. Around $21,650 we find the upper boundary of the trading range which is key resistance. In order for bulls to hope for a move towards $27k-$30k we need first to break above $21,650. On the opposite side, support is key at $18,600-$18,700. Failure to hold above this level will lead Bitcoin at least towards $17k if not lower. Until we see a breakout, we remain short-term neutral. The material has been provided by InstaForex Company - www.instaforex.com |
| XAU/USD Technical Analysis and Trading Tips for July 7, 2022 Posted: 07 Jul 2022 05:45 AM PDT
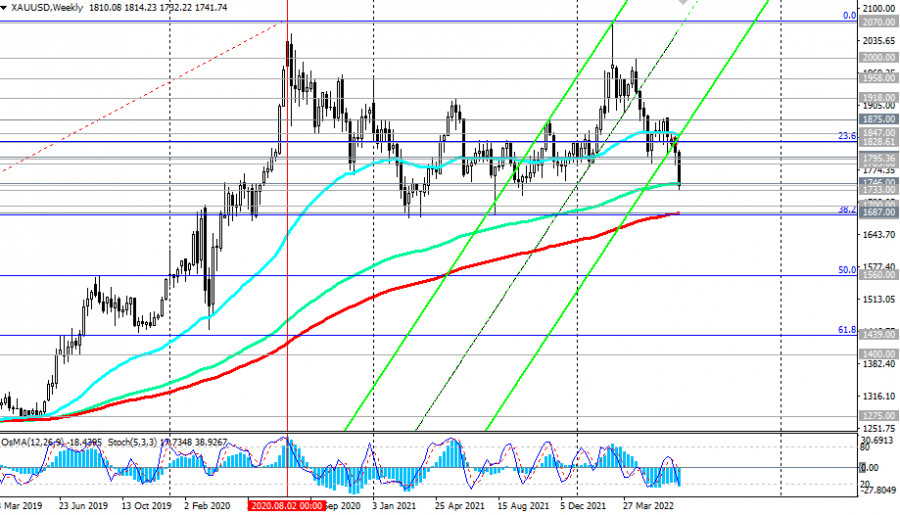
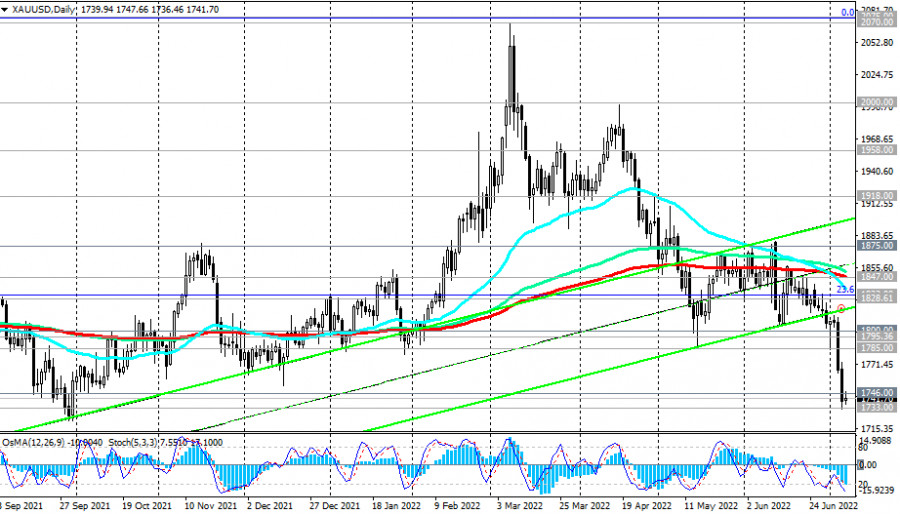
XAU/USD continues to decline for the 4th month in a row. As we suggested in our previous reviews dated 05/02/2022, 05/23/2022, and 06/02/2022, after the breakdown of the 1851.00 support level, the decline of XAU/USD will continue towards the recent balance line passing through the 1800.00 mark.
Then our alternative scenario worked, according to which a breakdown of the support levels of 1800.00, 1785.00 will push XAU/USD to further decline towards the key support levels of 1738.00, 1700.00. These scenarios turned out to be working, and the price is moving, as we assumed, towards the 1700.00 mark. But for this, it is necessary to overcome the strong long-term support level of 1746.00 (144 EMA on the weekly chart). The targets after its breakdown will be the key support levels of 1687.00 (200 EMA on the weekly chart), 1682.00 (38.2% Fibonacci retracement to the growth wave since December 2015, and the level of 1050.00).
In turn, a breakdown of the support level of 1668.00 (50 EMA on the monthly chart) will increase the risks of breaking the long-term bullish trend of XAU/USD. In an alternative scenario, there will be a rebound from the support level of 1746.00, and an upward correction of XAU/USD will begin from the current levels with the prospect of growth to the "balance line" we have identified, passing through the level of 1800.00. The price of gold may receive support from possible restrictions on Russian gold exports to the EU, US, UK, and Japan as part of the next round of sanctions against the Russian economy.
Statements by the Fed management about the growing negative impact on the economy from interest rate hikes, which could lead to a pause in the tightening cycle of the US central bank's monetary policy, could provoke a weakening dollar and an increase in gold quotes. It is known to be a traditional defensive asset, especially during periods of geopolitical and inflationary risks. This is the period we are currently experiencing. Support levels: 1746.00, 1733.00, 1700.00, 1687.00, 1682.00, 1668.00 Resistance levels: 1785.00, 1795.00, 1800.00, 1828.00, 1832.00, 1847.00, 1875.00 Trading Tips Sell Stop 1731.00. Stop-Loss 1751.00. Take-Profit 1700.00, 1687.00, 1682.00, 1668.00 Buy Stop 1751.00. Stop-Loss 1731.00. Take-Profit 1785.00, 1795.00, 1800.00, 1828.00, 1832.00, 1847.00 The material has been provided by InstaForex Company - www.instaforex.com |
| EUR/USD on July 7. Fed minutes provide traders with no new information Posted: 07 Jul 2022 05:40 AM PDT
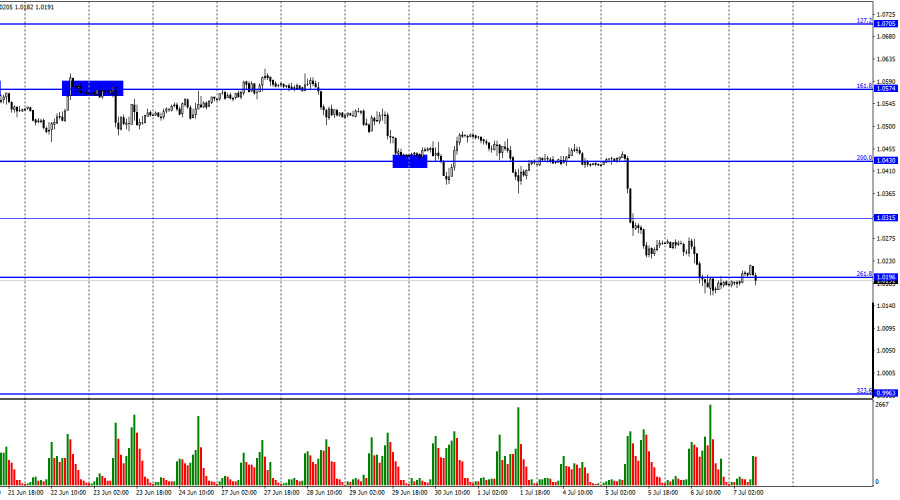
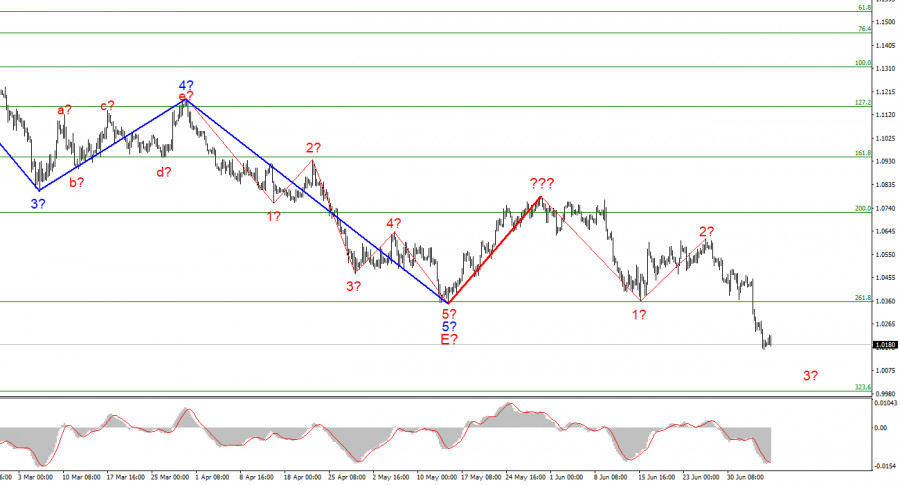
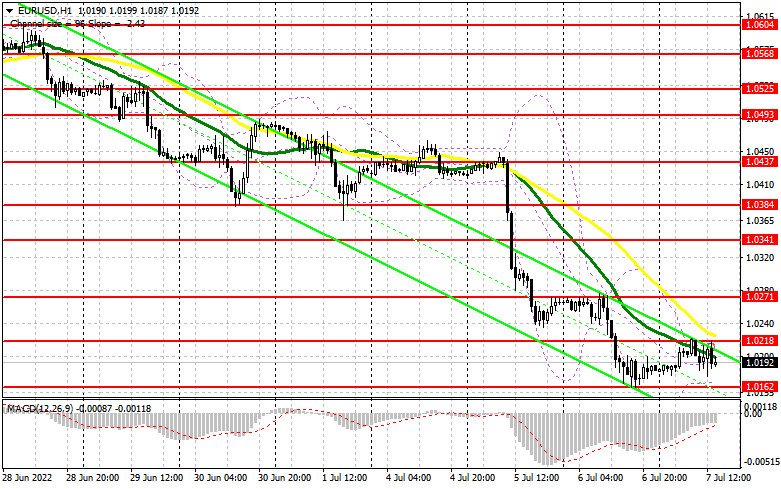
EUR/USD is trading around the 261.8% retracement level of 1.0196 on Thursday. It only made a drop to this level yesterday. As you can see, there will definitely be no reversal in favour of the EU currency and no rally. The bear traders have a strong grip on the market and are probably getting ready for a new sell-off. Therefore, in the coming days the price may continue to fall towards the correction level of 323.6% at 0.9963. It is difficult to even find any growth drivers for the European currency. Tomorrow there will be an important Nonfarm Payrolls report in the USA, which will get a reaction from traders. If the report is strong, the USD is more likely to continue its rally. Last night the Fed published the minutes from its June meeting. These reports are usually of little interest. All relevant information is announced by Jerome Powell immediately after the meeting. The Fed president makes public appearances quite often. Traders therefore know well what to expect. Thus, I was not looking forward to anything interesting from the minutes. The document stated that price stability remains the Fed's primary concern, with the central bank willing to sacrifice both economic growth and unemployment in order to bring inflation down to normal levels. The Fed clearly shows its willingness to continue to raise interest rates at the appropriate pace in order to reduce inflation. Traders believe that the rate will be raised by 0.75% this month. I would still recommend waiting for the next inflation report which is due out in a week. If it shows an increase in price growth again, the rate will definitely be raised. Of the entire committee, only one member did not support a 0.75% rate hike at the last meeting. If the Fed hikes the rate in July by 0.75%, the dollar will continue its rally.
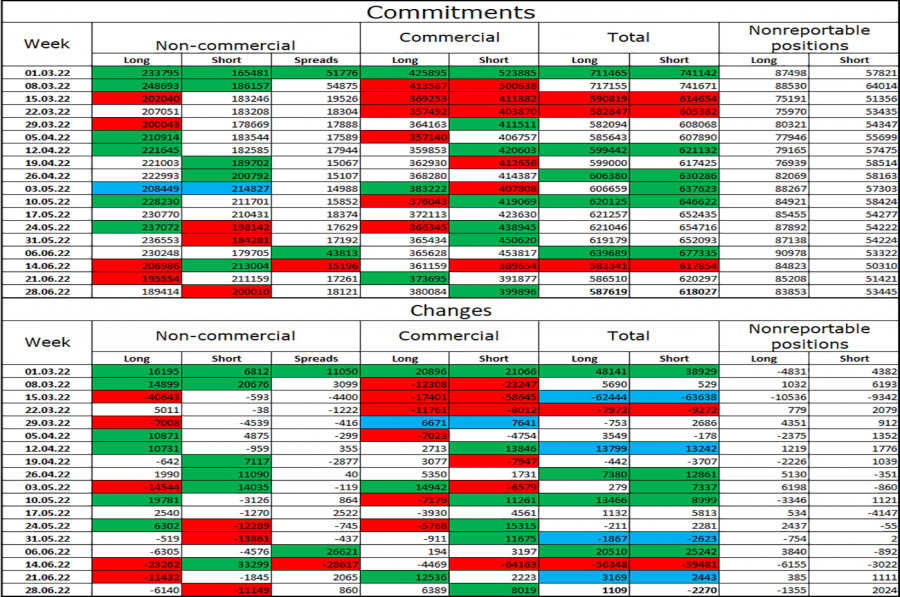
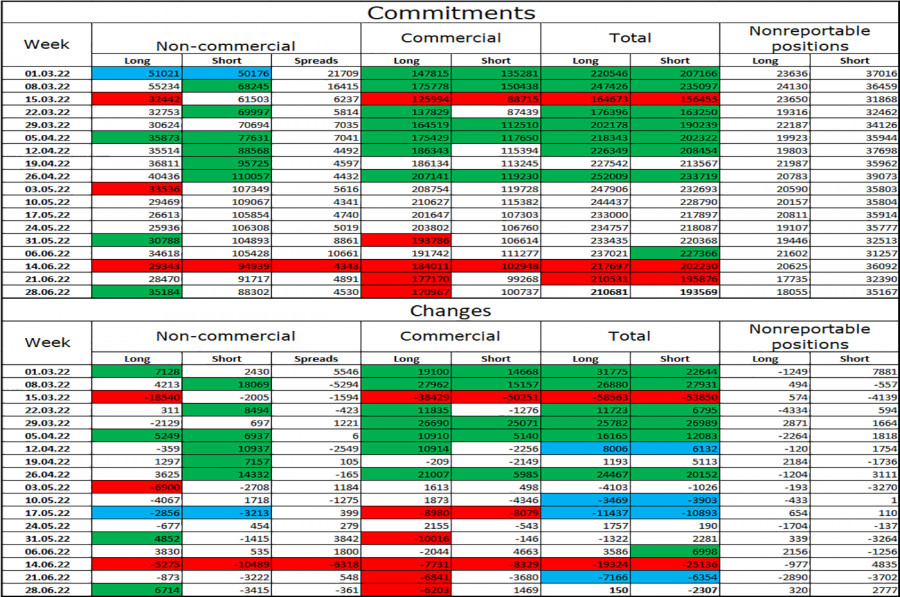
On the 4-hour chart, the pair performed a drop to the 127.2% retracement level of 1.0173. The pair's rebound from this level will benefit the euro and lead to some growth in the direction of the lower line of the descending corridor, which continues to characterize traders' current "bearish" sentiment. I do not anticipate a rapid increase in the value of the EU's currency until it is fixed above the corridor. A close below 1.0173 would increase the possibility of further declines. There are no emerging divergences in any indicator today. Commitments of Traders (COT) report:
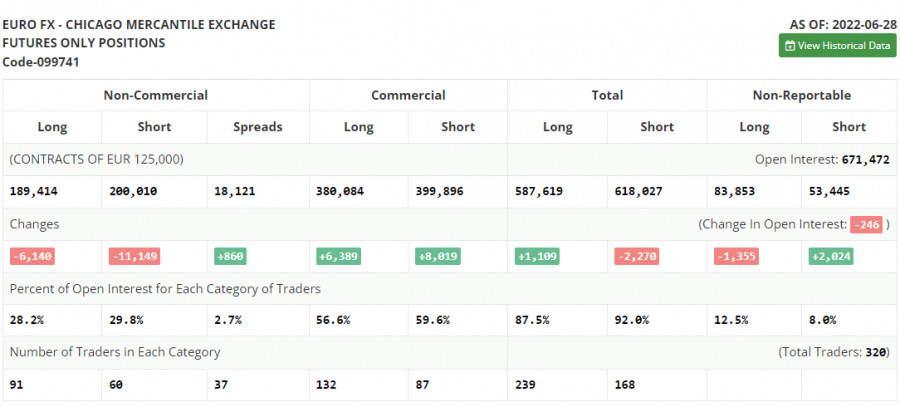
Speculators closed 6,140 long contracts and 11,149 short contracts during the previous reporting week. This indicates that the "bearish" sentiment of the major market participants has weakened slightly but remains "bearish." The total number of long contracts held by speculators is 189,000, and the number of short contracts is 200,000. The disparity between these numbers is negligible, but it does not favor the bulls. Most "Non-commercial" traders have maintained a "bullish" outlook on the euro in recent months, which has not helped the euro currency. Recent COT reports indicate that new sales of the EU currency may follow, as speculators' sentiment has shifted from "bullish" to "bearish" over the past few weeks. The Fed and the ECB have not provided positive updates regarding the euro. News calendar for the United States and Europe: EU - ECB monetary policy meeting minutes (11-30 UTC). US - Non-farm payrolls from ADP (12-15 UTC). US - Initial jobless claims (12-30 UTC). On July 7, the EU and US economic calendars contain some interesting notes. I believe that traders may pay attention to the ADP report. The other events they are likely to ignore. The influence of the information background may be weak today. EUR/USD outlook and tips for traders: I recommended open short positions when the pair consolidates below 1.0315 on the hourly chart with a target of 1.0196. This level has been adjusted. New sales are suggested at 1.0196 with a target of 1.0080. I recommend opening long positions on the Euro currency when it gets above the corridor on the 4-hour chart with a target of 1.1041. The material has been provided by InstaForex Company - www.instaforex.com |
| EUR/USD analysis on July 7. The market is preparing for the nonfarm payroll report on Friday. Posted: 07 Jul 2022 05:34 AM PDT
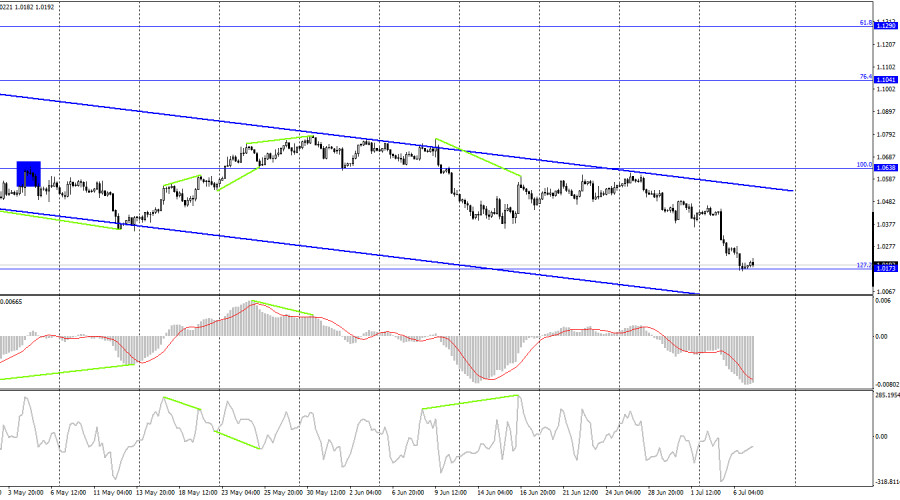
After this week's decline of nearly 300 basis points, the wave marking on the 4-hour chart for the euro/dollar instrument has become more complicated. Thus, the Fibonacci level of 261.8%, which was also the low of waves E and b, was successfully breached. Now that it is evident that these waves are not E and b, market sentiment has assumed the position of utmost importance. A few days ago, we had an excellent, promising wave structure consisting of a classic five-wave descent. Instead of constructing at least three correction waves, the market preferred to resume selling the instrument, indicating that wave analysis is currently of secondary importance. On occasion, the market completely disregards a particular type of analysis. There are instances in which distinct types of analysis produce contradictory results, one of which is incorrect. The most important thing is to recognize and act on the new market realities. Now that we have one red-lined correction wave, the instrument can construct a new five-wave descending series. I recommend paying attention to the lowest wave order now, as the wave markup appears illegible on a larger scale. New day, new surprises. Thursday saw the euro/dollar pair decline by only two basis points. Consequently, we can say that the European currency has avoided losses today. The construction of the descending wave continues, and practically no internal waves are visible within this wave. The instrument has sufficient decline potential to fall another 200 basis points. Today and tomorrow, the news backdrop for the US dollar will be quite significant, so we can anticipate a fascinating end to the week. In a few minutes, the ADP report will be released in the United States, which many consider comparable to Nonfarm Payrolls. The ADP report illustrates the extent to which the number of private-sector employees has changed. However, ADP and nonfarm reports rarely coincide, and there has been a recent trend: if the first report is positive, the second report must be negative. However, the market frequently pays no attention to the ADP report, preferring to wait for the payroll report, which is always released the following day. Thus, the labor market data released today is "acceptable." In addition to this report, no other significant events will occur today. Consequently, I conclude that much will be decided regarding the euro currency tomorrow. However, what can be done if the tool refuses to build even the required correction structure and instead chooses to break the entire wave markup? I believe that the decline in demand for the euro will continue, as the market has demonstrated that it has no intention of purchasing euros under the current conditions. The new descending five-wave structure must be constructed in its entirety and without any modifications, complications, or clarifications. 95 figures can represent the objectives of this entire structure. It is hard to believe, but if the impulse structure is fully developed, the euro could fall another 700 points. General observations. Based on the analysis, I conclude that construction of the downward trend segment has resumed. Consequently, it is now possible to sell the instrument with targets near the estimated 0.9988 level, which corresponds to 323.6 percent Fibonacci, for each "down" MACD signal, anticipating the formation of wave 3. A successful attempt to surpass the level of 261,8 percent indicates the market's readiness for stronger instrument sales and the elimination of the scenario involving the construction of ascending structures. The material has been provided by InstaForex Company - www.instaforex.com |
| Technical analysis recommendations on EUR/USD and GBP/USD for July 7, 2022 Posted: 07 Jul 2022 05:30 AM PDT EUR/USD
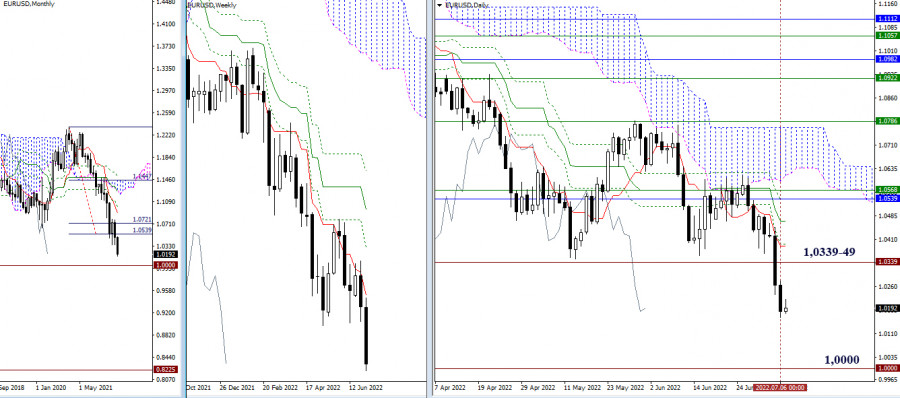
Higher timeframes Bears managed to continue the decline yesterday. As a result, the potential for strengthening bearish sentiment remains. The targets for the decline as noted earlier in the current situation, can be noted at 1.0000 (psychological level) and 0.8225 (local low of 2000). The passed supports (1.0339–49) with the development of an upward correction may provide resistance, then the resistance levels of the daily Ichimoku cross will come into play.
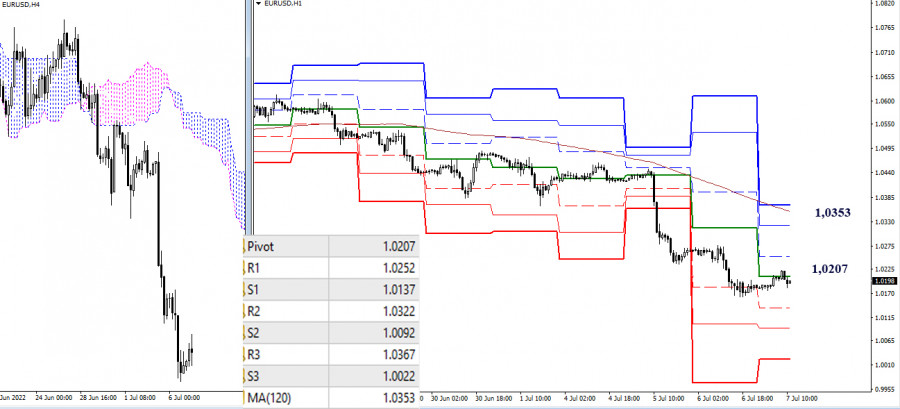
H4 – H1 The advantage on the lower timeframes now belongs to the bears. Among further bearish reference points within the day are the supports of the classic pivot points (1.0137 – 1.0092 – 1.0022). As of this writing, the pair is in the correction zone, testing the central pivot point of the day (1.0207). The breakdown of the level and the continuation of the correction will allow us to consider the resistance of the weekly long-term trend (1.0353) as a guide. This level (1.0353) is responsible for the current balance of power in the lower timeframes. Overcoming it and turning around will change the balance of power in favor of the bulls. *** GBP/USD
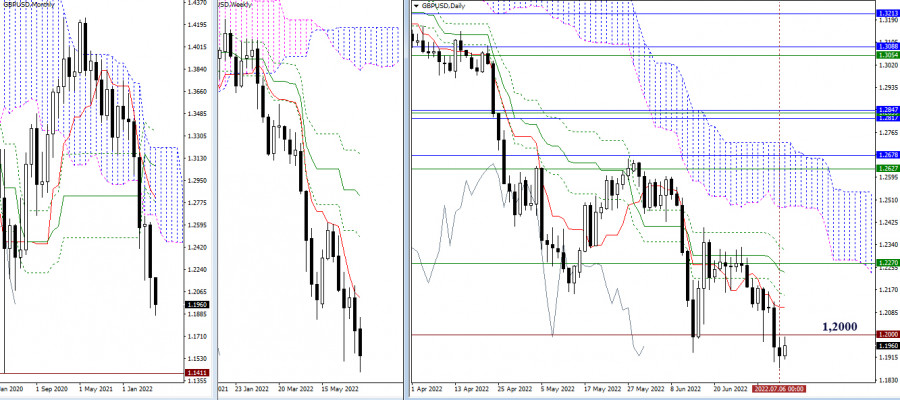
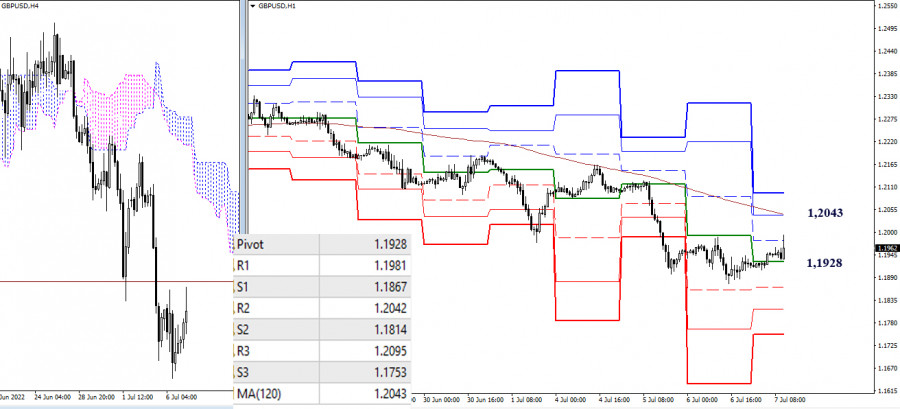
Higher timeframes Bears managed to continue the decline yesterday, but nothing significant took place. A stall and return above 1.2000 could prevent bears from going further down. In this case, a new upward correction will develop with targets at the resistance of the daily Ichimoku cross (1.2104 – 1.2151 – 1.2237 – 1.2322) and the weekly short-term trend, located at 1.2270. If bears actively continue the downward trend, their main target will be the local low of 2020 (1.1411).
H4 – H1 Bears currently dominate the lower timeframes. Their targets for continuing the decline within the day are the support of the classic pivot points, which are today located at 1.1867 – 1.1814 – 1.1753. An upward correction is currently underway. Bulls have already seized the central pivot point of the day (1.1928), so the main reference point for the correction now is the long-term weekly trend (1.2043), which is responsible for the balance of power. Breakout, consolidation above, and reversal of the moving average will give bulls the advantage on the higher timeframes. *** In the technical analysis of the situation, the following are used: higher timeframes – Ichimoku Kinko Hyo (9.26.52) + Fibo Kijun levels H1 - Pivot Points (classic) + Moving Average 120 (weekly long-term trend) The material has been provided by InstaForex Company - www.instaforex.com |
| US premarket trading analysis for July 7: traders continue to buy dip Posted: 07 Jul 2022 05:29 AM PDT US stock index futures rose slightly on Thursday as traders continued to buy shares in the hope of upbeat data on the labor market and a further market recovery. Dow Jones Industrial Average futures rose by 98 points, or 0.32%. Futures for the S&P 500 and Nasdaq 100 added 0.23% and 0.32% respectively. Yesterday, the S&P 500 posted its first three-day winning streak since late May. The index is currently about 20% below its all-time high. Meanwhile, the Dow Jones gained over 69 points, or 0.2%. The Nasdaq Composite advanced by about 0.4%.
The minutes from the June meeting of the US Federal Reserve released yesterday showed that officials are determined to further tighten monetary policy. Markets have already priced in further interest rate hikes, so changes will occur only following some news, for example, about a shift in the Fed's stance. The regulator's intention to keep raising interest rates to fight high inflation while sacrificing economic growth rates is further evidence of the paths politicians are willing to take to achieve their goals. However, many investors find it risky to buy stocks as fears of a recession continue to weigh on Wall Street. Moreover, an extremely volatile reporting season is ahead, but statistics will hardly be upbeat. Most likely, only in the autumn it will be possible to seriously reflect on when a real market reversal will take place, what the Fed will do, and what will happen in international politics, due to which the consumer price index rises according to officials of the US central bank. Today's macroeconomic calendar includes statistics on US weekly jobless claims. Tomorrow, the Department of Labor will report data on job openings. Premarket trading GameStop turned out to be the top performer. Its stocks rose by 7.8% in premarket trading after the video game retailer announced a 4-for-1 stock split. Split-adjusted trading will begin on July 22. Seagen shares gained 4.5% in premarket trading after the Wall Street Journal reported that Merck was in early talks to acquire the biotech company for more than $200 per share. Shares of private space tourism company Virgin Galactic rose by 3.7% in premarket trading after it signed a contract with a subsidiary of Boeing to build two new 'mothership' aircraft which will be used as launch platforms for its future spaceplanes and launching of satellites. Securities of Chinese electric car makers advanced after the news that the government would consider extending a tax break for electric vehicles. Shares of Li Auto added 1% in premarket trading, Nio and Xpeng increased by 1.5% and 3.3% respectively.
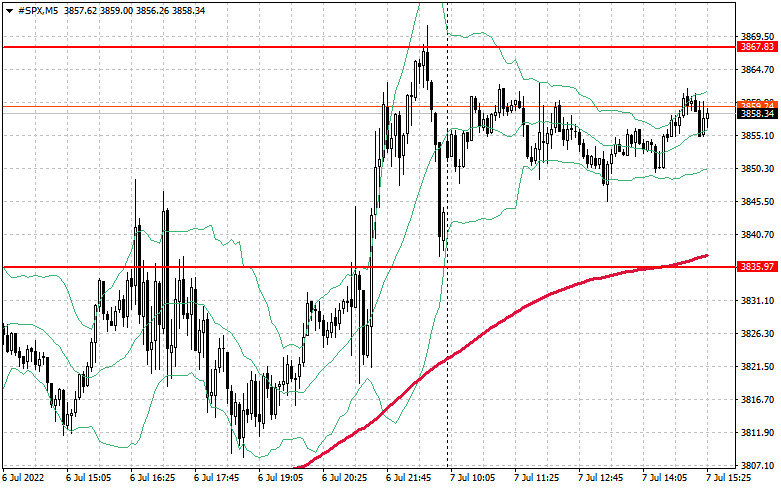
S&P 500 technical analysis Yesterday, bulls managed to take control of the $3,835 mark, which is pretty good for developing a further bullish correction. However, only a breakout of $3,867 will allow the trading instrument to gain strong upside momentum and reach the area of $3,905, where major sellers will return to the market again. At least, some traders will lock in profits on long positions. The level of $3,942 can be seen as a more distant target. In case of pessimism, statements on high inflation and the need to fight it, as well as risk avoidance, the index will easily break below the nearest support of $3,835 and head for a more stable level of $3,788. If bulls' trading activity is subdued, a breakout of this area will lead to a new sell-off at $3,744 and $3,704. The material has been provided by InstaForex Company - www.instaforex.com |
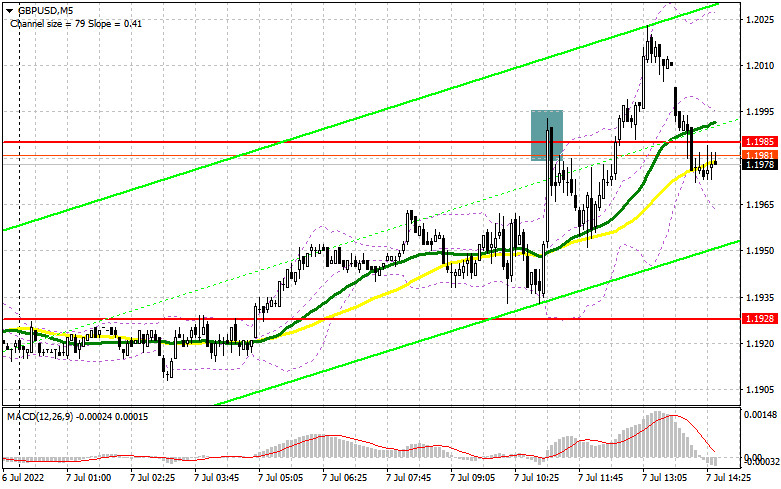
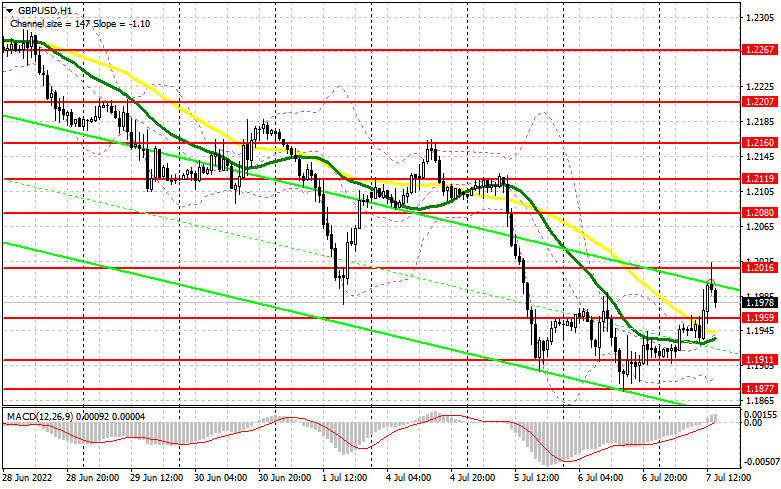
| GBP/USD: plan for US trade on July 7. Demand for GBP increases amid Boris Johnson's resignation Posted: 07 Jul 2022 05:13 AM PDT Earlier, I asked you to pay attention to the level of 1.1985 to decide when to enter the market. Let us take a look at the 5-minute chart to figure out the market situation. News about Boris Johnson's resignation boosted demand for the pound sterling, though only for a short period of time. As a result, the pair increased to 1.1985 and formed a false breakout, thus causing a sell signal. The pound sterling dropped by 30 pips. After that, demand for the currency resumed rising, allowing it to break 1.1985. The pair failed to show an opposite test of this level. That is why there were no signals to enter the market. For the second part of the day, the technical picture became different.
Conditions for opening long positions on GBP/USD: Strong data from the US is likely to exert pressure on the pound sterling, thus causing a decline in the second part of the day. The US is going to disclose reports on the ADP non-farm employment change and initial unemployment claims. If the pair drops, only a false breakout of the support level of 1.1959 will give a long signal with the target at 1.2016. The bearish movement will stop only if bulls gain control over 1.2016. A breakout and a downward test of this level will give a long signal with the target at 1.2080. A breakout of this level may lead to another long signal with the target at 1.2119, where it is recommended to lock in profits. If the pound/dollar pair continues falling and bulls fail to protect 1.1959, it will be better to avoid long positions. It will be better not to open buy orders until the price hits the support level of 1.1911. It will be possible to go long after a false breakout of this level. Traders may initiate buy orders from 1.1877 or lower – from 1.1816, expecting a rise of 30-35 pips. Conditions for opening short positions on GBP/USD: Bears are shocked by the recent news. However, the resignation of Boris Johnson will hardly support the pound sterling for a long time. Now, bears should protect a new resistance level of 1.2016, the test of which took place in the first part of the day. However, only strong data from the US may push the British pound lower.In the best-case scenario, traders should open shot positions after a false breakout of 1.2016, which may spur a decline to the low of 1.1959. Slightly below this level, there are bullish moving averages. That is why a breakout and an upward test of 1.1959 is very important. This will provide traders with a sell signal with the target at the low of 1.1911. The pair may slide to the support level of 1.1877. The next target is located at 1.1816, where it is recommended to lock in profits. If the pair advances during the US trade and sellers fail to protect 1.2016, bearish sentiment could become weaker. Traders may go short from the high of 1.2119 or higher – from 1.2160, expecting a decline of 30-35 pips.
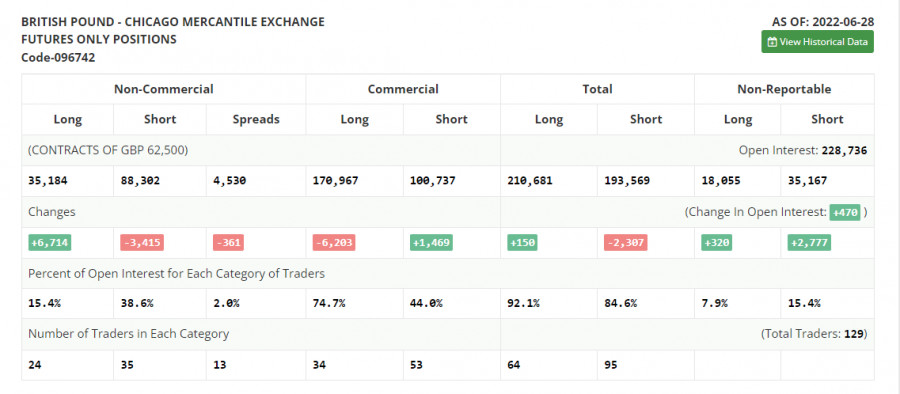
COT report According to the COT report from June 28, the number of short positions declined, whereas the number of long positions jumped. This is pointing to an attempt to reach a new yearly low after the BoE's decision to increase the key interest rate and remain stuck to an aggressive monetary policy. A jump in inflation recorded in May is forcing the regulator to take aggressive measures. The cost of living crisis in the UK, which continues developing, is affecting the local economy especially during the period of the key interest rate hike. This fact is reducing the attractiveness of the British pound, which is actively declining to the low of 2020. The Fed's policy and the pace of the key interest rate hike are actively supporting the greenback. The COT report unveiled that the number of long non-commercial positions increased by 6,714 to 35,184, while the number of short non-commercial positions decreased by 3,415 to 88,302. However, this did not significantly affect the overall picture of the bear market, but led to a slight decrease in the negative value of the non-commercial net position from -63,247 to -53,118. The weekly closing price decreased to 1.2201 against 1.2295.
Signals of indicators: Moving Averages Trading is performed above the 30- and 50-day moving averages, which points to an attempt to form an upward correction. Note: The period and prices of moving averages are considered by the author on the one-hour chart that differs from the general definition of the classic daily moving averages on the daily chart. Bollinger Bands In case of a rise, the support level will be located at the lower limit of the indicator of 1.1900. Description of indicators
|
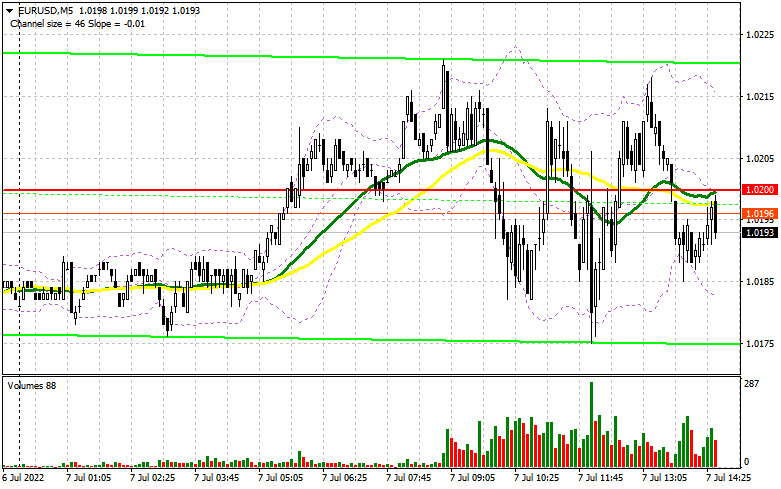
| Posted: 07 Jul 2022 05:12 AM PDT In the morning article, I highlighted the level of 1.0200 and recommended taking decisions with this level in focus. Now let's look at the 5-minute chart and try to figure out what actually happened. The speeches of ECB officials did not affect the trajectory of the euro. Traders are still refraining from buying it even at swing lows. It was not possible to determine good entry points from 1.0200. However, this level was broken. In the afternoon, the technical outlook changed slightly.
What is needed to open long positions on EUR/USD In the American session, the US will release a batch of reports on the labor market. They are likely to spur up market volatility. It is recommended to pay attention to the ADP report, which reflects the change in total US nonfarm private employment. Apart from that, traders will definitely take notice of initial jobless claims data. Notably, the US will hardly lose momentum even if macro stats are weak. It is now growing steadily as a safe-haven asset amid a rise in US Treasury yields. If the euro falls further after the release of the reports, it may reach the nearest support level of 1.0162. Only after a false breakout at this level, we can expect a buy signal, counting on a small upward correction to 1.0218. The moving averages are passing in the bearish territory at this level. Given that the divergence of the MACD has been already factored in by traders, it will be quite difficult for bulls to push the euro above this level. Only after a breakout and a downward test of 1.0218, there might be a buy signal. If so, it will ease most of the bears' stop-loss orders. As a result, the pair may return to the resistance level of 1.0271. The distant target will be the 1.0341 level. However, now, such a rise looks quite unlikely as there are no drivers. If EUR/USD declines and bulls show no activity at 1.0162, which is more likely, bearish pressure will only increase. In this case, I advise you not to stay wat from the market. It is better to open long positions only after a false breakout of the support level of 1.0119. It is recommended to open long positions on EUR/USD immediately at a bounce from the level of 1.0072 or even a low of 1.0033, keeping in mind an upward intraday correction of 30-35 pips. What is needed to open short positions on EUR/USD Bears remain in control, not allowing the pair to grow above 1.0281 in the first half of the day. If the euro rises during the US session after weak data on the US trade surplus and speeches by FOMC members Bullard and Waller, only a false breakout of 1.0218, like the one that occurred in the first half of the day, will give an excellent sell signal. If this scenario comes true, the pair may decline to the nearest support level of 1.0162, which is now the yearly low. A breakout and slide below this level, as well as an upward test, will generate an additional sell signal. It will also lead to a sharp drop in the buyers' stop-loss orders. It could reach a new yearly low of 1.0119. Bulls and bears are likely to fight fiercely for this level. After this level, bears will target 1.0033. If the price slips to it, it may signal the potential parity with the US dollar. It is a very gloomy prospect. This is why I would advise traders to lock in profits. A more distant target will be the 0.9994 level. If EUR/ USD climbs during the American session and bears show no energy at 1.0218, it will hardly affect the bearish momentum. In this case, it is better to cancel short positions until the 1.0271 level. A false breakout of this level will only strengthen the bearish trend. You can sell EUR/USD immediately at a bounce from a high of 1.0341 or even a high of 1.0384, keeping in mind a downward intraday correction of 30-35 pips.
COT The COT report (Commitment of Traders) for June 28 again logged a drop in both long and short positions but it did lead to an increase in the negative delta. The number of short positions was lower than long ones. Last week, ECB President Christine Lagarde and Fed Chairman Jerome Powell made speeches. They stressed the need to tighten monetary policy to combat the highest inflation on record. This month, the ECB intends to start raising interest rates which should limit the upward potential of the US dollar against the euro. Eurozone inflation data released last week showed the regulator that they should urgently hike the key rate. However, given the headwinds in the global economy, demand for safe-haven assets is buoyant. Analysts are betting on the parity in the EUR/USD pair. The COT report revealed that the number of long non-commercial positions decreased by 6,140, to the level of 189,414, while the number of short non-commercial positions tumbled by 11,149 to the level of 200,010. The US dollar approaches new highs amid the low exchange rate of the euro, the need for further aggressive tightening by major central banks, and the recession in many developed countries. At the end of the week, the total non-commercial net position remained negative and amounted to -10,596 against -15,605. The weekly closing price dropped to 1.0584 against 1.0598.
Signals of technical indicators Moving averages EUR/USD is trading below 30- and 50-period moving averages. It means that the euro is trading with a bearish bias. Remark. The author is analyzing the period and prices of moving averages on the 1-hour chart. So, it differs from the common definition of classic daily moving averages on the daily chart. Bollinger Bands There are no entry points now due to extremely low volatility. Definitions of technical indicators
|
| Trading plan for Ethereum on July 07, 2022 Posted: 07 Jul 2022 05:10 AM PDT
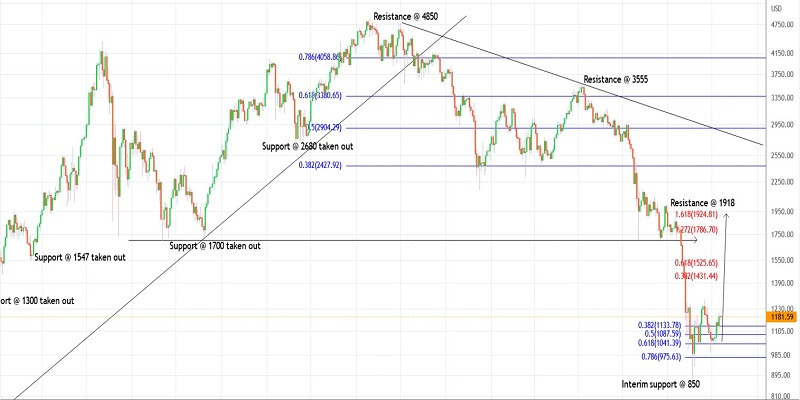
Technical outlook:Ethereum rallied through the $1,200 mark on Wednesday before finding resistance and puling over. The crypto is seen to be trading lower close to $1,180 at this point in writing and is expected to attempt to test the $1,250-80 zone in the near term. Intraday corrective drops remain possible but prices should be well capped ahead of $998 and broadly above $880. Ethereum has carved a larger-degree downswing between $4,850 and $880 levels as seen on the daily chart. The drop began in November 2021 and unfolded as a potential zigzag (5-3-5) terminating at around $880. Ideally, bulls should be back in control soon and produce a rally towards $2,400 at least and up to $3,400 in the medium term. Ethereum has been working on a three-wave rally from the $880 lows. Bulls have managed to carve a lower-degree upswing between $880 and $1,280 levels, which was retraced to $997 last week. If the above structure holds well, bulls will be poised to push towards the $1,525 and $1,925 targets in the short term. Also, note that initial price resistance is also seen at about $1,920. Going forward:Ethereum is expected to remain in control of bulls in the near to medium term. The bottom line for the above scenario to unfold is that prices should stay above the $880 interim support. Looking into the bigger picture, the crypto might drop below $880 after completing its corrective rally towards $2,400 and $3,400. Trading plan:Potential rally towards $2,400 against $880 Good luck! The material has been provided by InstaForex Company - www.instaforex.com |
| Posted: 07 Jul 2022 05:09 AM PDT
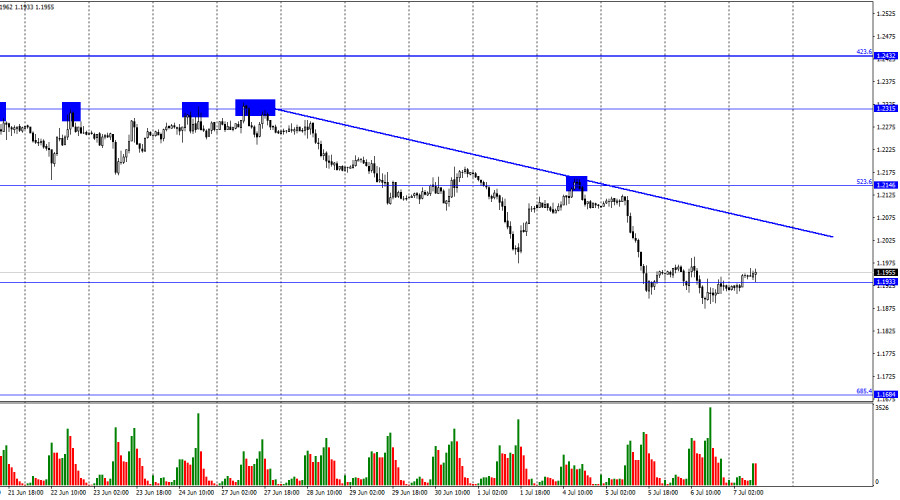
Hi, dear traders! According to the H1 chart, GBP/USD fell to 1.1933. The descending trend line indicates that trader sentiment remains bearish. The pair is likely to slide down towards the Fibo level of 685.4% (1.1684) unless GBP/USD closes above any of the two trend lines. In the UK, Boris Johnson once again became a target of controversy over the past few days. The British Prime Minister, known for ignoring established rules of conduct, survived a vote of no confidence several weeks ago, but attracted scathing criticism following the appointment of Chris Pincher as deputy chief whip of the Conservative Party. Pincher was accused of making inappropriate advances by two Conservative MPs in 2019 - the Cabinet Office even investigated his conduct. Johnson appointed him despite being aware of allegations against Pincher. The disgraced deputy chief whip was forced to resign last week, and the prime minister was accused by the public and other MPs of covering up his conduct. Johnson refused to step down as PM, resulting in Chancellor Rishi Sunak and Health Secretary Sajid Javid handing in their resignations. 50 more MPs quit the government early on Thursday in protest of Boris Johnson's policies.
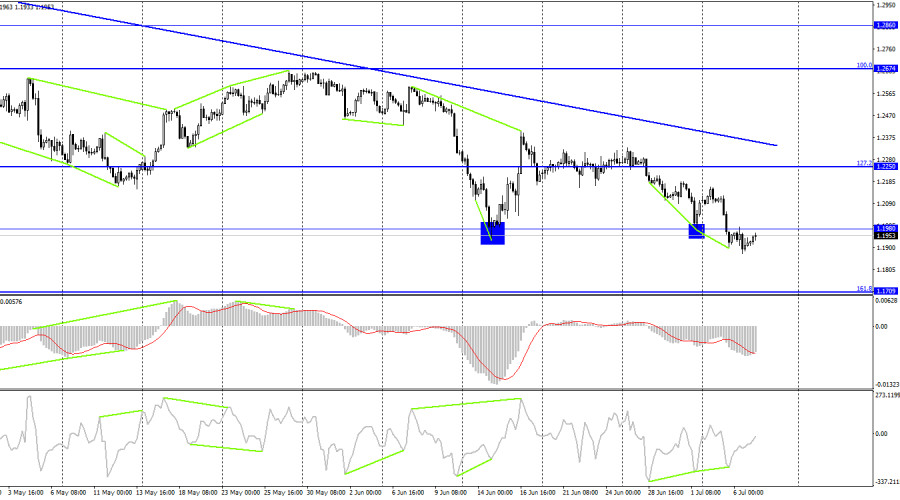
According to the H4 chart, the pair reversed downwards and settled below 1.1980. It could continue to fall towards the next Fibo level of 161.8% (1.1709). GBP/USD has formed a bullish CCI divergence which could have pushed the pair up towards the Fibo level of 127.2% (1.2250). However, bullish traders have ignored this signal. Overall, the sentiment of traders remains bearish. Commitments of Traders (COT) report:
Non-commercial traders became slightly more bearish over the last week. 6,714 Long positions were opened. Traders closed 3,415 Short positions. Market players remain bearish on GBP/USD, and Long positions continue to greatly outnumber Short ones. Major players continue to decrease their exposure to GBP, and their sentiment has remained unchanged recently. GBP/USD could continue to fall in the next several weeks and months, despite the gap between Long and Short positions potentially indicating a trend reversal. At this point, the news and data releases are more important for market players. US and UK economic calendar:US - ADP non-farm payroll data (12-15 UTC).US - Initial jobless claims (12-30 UTC). There are no events on the economic calendar in the UK, and the US data releases are unlikely to influence traders significantly. Outlook for GBP/USD: Earlier, traders were advised to open short positions if GBP/USD bounced off the Fibo level of 523.6% (1.2146) with 1.1933 being the target. The pair has already hit that target. New short positions can be opened if the pair closes below 1.1933 targeting 1.1709. Traders are recommended to open long positions if GBP/USD settles above the trend line on the H4 chart, with 1.2674 being the target. The material has been provided by InstaForex Company - www.instaforex.com |
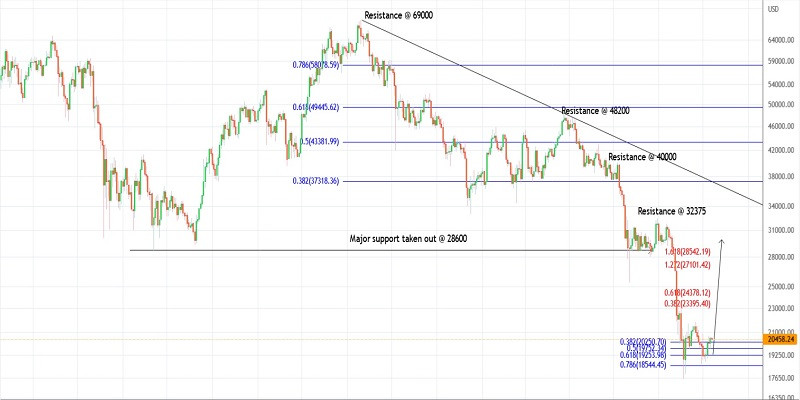
| Trading plan for Bitcoin on July 07, 2022 Posted: 07 Jul 2022 04:31 AM PDT
Technical outlook:Bitcoin rose to $20,500 intraday on Thursday before stalling its climb as it reached the upper boundary of its consolidation. The crypto is trading close to $20,450 at this point in writing and it could slip further towards $19,400 in the near term. The short- and medium-term structures will remain constructive for bulls until prices stay above $18,700. Bitcoin has carved a meaningful downswing between $69,000 and $17,500 since November 2021. The drop has unfolded into a three-wave zigzag (5-3-5), and hence is considered corrective. Ideally, a three-wave structure is completely retraced. Therefore, we expect bulls to be back in control soon and produce a rally towards the $33,000-37,000 area at least. Potential short-term targets are defined at $24,400 and $28,500. Bitcoin has carved a potential intermediate bottom at around $17,500 or it is close to carving one more. Either way, bulls will be poised to enter the market soon and push the price through $28,500, closer to the initial resistance seen towards $32,375 as marked on the daily chart. Also, note that the medium target potential remains towards $48,200, the Fibonacci 0.618 retracement of the downswing. Going forward:Bitcoin's bigger picture could be much lower below $17,500, by the time a three-wave corrective wave completes at a larger degree. In the near term, the crypto is expected to settle above $17,500 and complete its corrective rally towards $28,500 and up to $48,200. Once complete, bears will be back in control to drag prices lower below $17,500. Trading plan:Potential rally through $28,500 against $17,500 Good luck! The material has been provided by InstaForex Company - www.instaforex.com |
| US market resists negative sentiment from Fed Posted: 07 Jul 2022 04:06 AM PDT
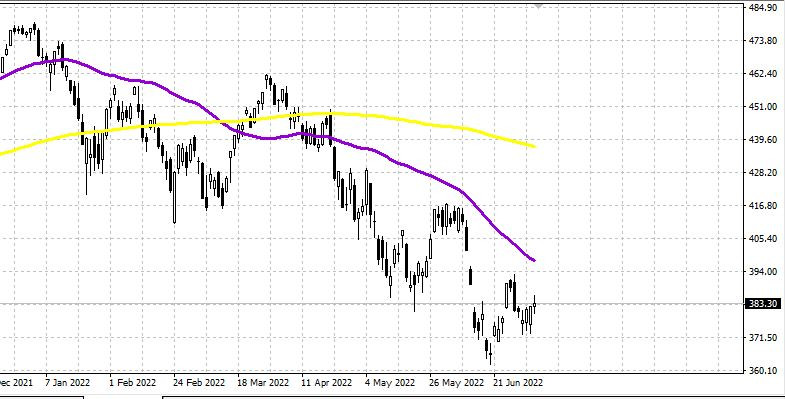
S&P500 US market resists negative sentiment from Fed On Wednesday, the US stock market was bullish. The Dow added 0.2%, the NASDAQ gained 0.4%, and the S&P500 was up by 0.4%. The S&P500 index is trading at 3,845 and is expected to be in the 3,780–3,800 range. The Fed minutes were published yesterday. The market expects a Fed rate hike of +0.75% as early as 27 July. This is, of course, a negative trend. As for the labour market, there was a significant drop in job openings. Their number fell by 427,000 to 11.3 million. This is the second big decline since March. The market is waiting for the June labour market report. It will be published tomorrow. Jobs are expected to rise by +200+250K.As for the commodity market, oil prices are no longer rising. Brent is trading at $101 per barrel. Kazakhstan plans to scale up oil production that bypasses Russia. Gas prices in Europe are surging again. According to the London ICE stock exchange, gas prices reached $1,840 per thousand cubic meters. The reason for this is a sharp decline in Gazprom's supplies. The IMF downgraded its global GDP growth forecast for the current year to 3.6%. There is a possibility of a downturn in the world economy in 2023. The dollar has reached a high of the year and is trading at a 20-year peak. The US dollar index is trading at 106.90.Meanwhile, EUR/USD is at 20-year lows and is trading at 1.0195. The US market is flat. One can try to open long positions. However, the world economy is moving slowly towards a major crisis.Notably, the companies that produce major military equipment for conventional warfare, such as missile defence systems, MLRS, artillery systems, air defence and anti-tank defence systems, have excellent prospects in the coming months. In the US, these are all owned by private companies. Many are publicly traded, and their profits will increase significantly in the next six months to a year. The material has been provided by InstaForex Company - www.instaforex.com |
| Daily Video Analysis: GBPUSD, H4 Bearish Continuation Strategy Posted: 07 Jul 2022 04:06 AM PDT Today we take a look at GBPUSD. Combining advanced technical analysis methods such as Fibonacci confluence, correlation, market structure, oscillators and demand/supply zones, we identify high probability trading setups. The material has been provided by InstaForex Company - www.instaforex.com |


| You are subscribed to email updates from Forex analysis review. To stop receiving these emails, you may unsubscribe now. | Email delivery powered by Google |
| Google, 1600 Amphitheatre Parkway, Mountain View, CA 94043, United States | |


Comments