Forex analysis review
Forex analysis review |
- How to trade GBP/USD on July 19? Simple tips for beginners.
- How to trade EUR/USD on July 19? Simple tips for beginners.
- AUD/USD. Aussie's comeback: aussie takes advantage of US dollar weakness
- July 18, 2022 : EUR/USD daily technical review and trading opportunities.
- July 18, 2022 : EUR/USD Intraday technical analysis and trading plan.
- July 18, 2022 : GBP/USD Intraday technical analysis and significant key-levels.
- The dollar entered the feedback loop
- EUR/USD. 100-point Fed rate hike: Dollar bulls make a false start
- GBPUSD bulls went on a counterattack
- GBP/USD Technical Analysis and Trading Tips for July 18, 2022
- GBP/USD: How long will the upward correction last?
- Trading Signal for USD/JPY for July 18 - 19, 2022: sell below 138.25 (21 SMA)
- Morgan Stanley, Goldman see more stock market losses
- Trading plan for US dollar index on July 18, 2022
- Trading Signal for GBP/USD for July 18 - 19, 2022: buy above 1.1962 (1/8 Murray - 21 SMA)
- Bitcoin starts to reap the benefits of macroeconomic crisis: can we expect protracted growth?
- Ichimoku cloud indicator analysis on Gold for July 18th, 2022.
- Ichimoku cloud indicator analysis on EURUSD for July 18th, 2022.
- Bitcoin Ichimoku cloud analysis.
- META stock price could soon reverse to the upside.
- AUDUSD breaking out.
- Long-term investors in Bitcoin keep their cool
- Forecast for EUR/USD on July 18. The euro currency is growing ahead of the ECB meeting
- Technical analysis recommendations on EUR/USD and GBP/USD for July 18, 2022
- Daily Video Analysis: AUDUSD, H4 Bearish Reversal Opportunity
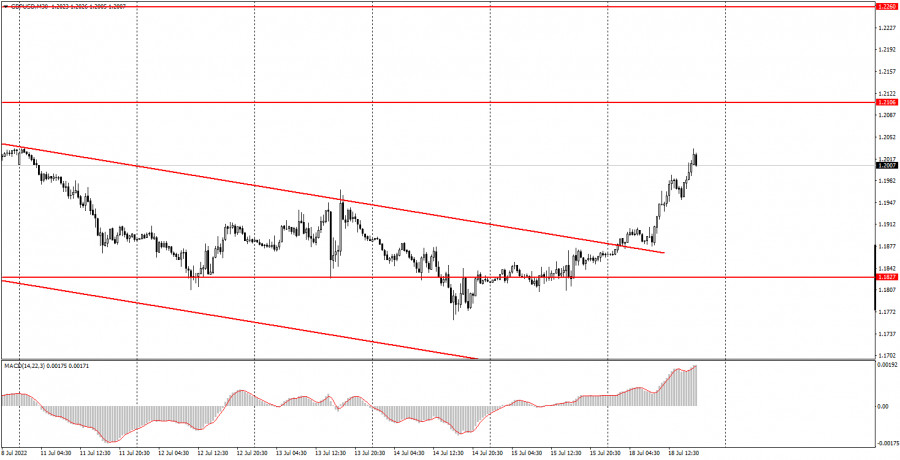
| How to trade GBP/USD on July 19? Simple tips for beginners. Posted: 18 Jul 2022 02:47 PM PDT Analysis of Monday's deals:30M chart of the GBP/USD pair
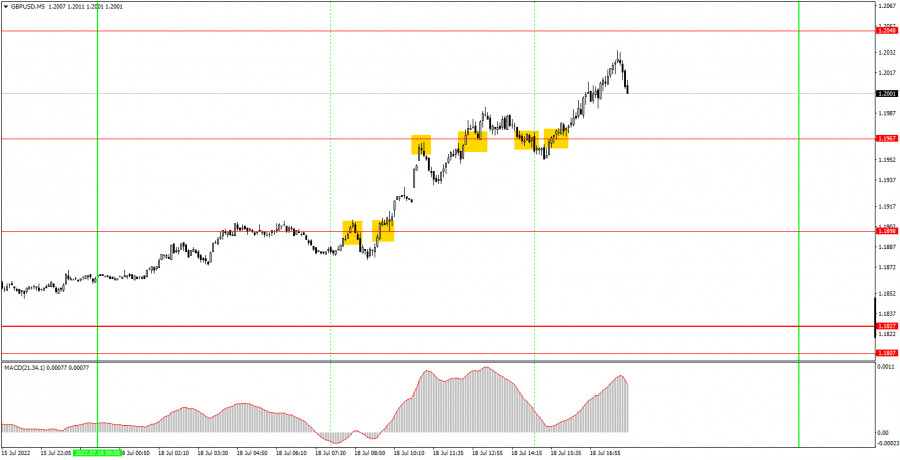
The GBP/USD pair also rose rather unexpectedly on Monday. The price confidently overcame the upper limit of the descending channel, so there were no questions at this moment. Recall that we warned about a possible "flat exit" of quotes from the channel. In this case, the buy signal would be weak. But in our case, the price quite confidently left the descending channel, so it was possible to open long positions even on this signal. In general, nothing happened on Monday that could provoke the growth of the British pound by 150 points. There was not a single interesting report or other event in either the UK or the US. In our EUR/USD review, we suggested that the euro's rise could be related to the upcoming European Central Bank meeting, but this meeting has nothing to do with the British pound or the dollar. And there are no meetings of the Bank of England or the Federal Reserve scheduled for this week. Thus, it looks like we are dealing with the usual technical correction after a long decline. If so, then it may be short-lived, like almost all corrections within the current downward trend, which has been going on for more than a year and a half. 5M chart of the GBP/USD pair
The movements and signals on the 5-minute timeframe were quite good on Monday, although not perfect. The first sell signal in the form of a rebound from the level of 1.1898 turned out to be false. The price could not go down even 20 points, so Stop Loss could not be set to breakeven. This was followed by a buy signal near the same level, which has already brought profit to novice traders, as the pair rose to the target level of 1.1967 (error 2 points) and rebounded from it, forming a new sell signal. Unfortunately, it also turned out to be false, but this time the pound managed to go down 20 points, so the Stop Loss had to be set to breakeven. The next buy signal near the 1.1967 level also turned out to be false, but this time the pair again failed to go in the right direction for at least 20 points, so this deal also received a small loss. Two more signals were formed near the level of 1.1967, the last of which could bring profit to novice traders, but these signals should no longer be worked out, since by the time they were formed near the level of 1.1967, two false signals had already been formed. As a result, due to false signals, the total profit of the day did not exceed 5-10 points. How to trade on Tuesday:The pair left the descending channel very quickly and cheerfully on the 30-minute TF, so an upward movement may be observed for some time. We do not believe that it will be long-term, as it seems that the market just started taking profits on short positions, which led to a rollback to the upside. On the 5-minute TF on Tuesday it is recommended to trade at the levels 1.1807-1.1827, 1.1898, 1.1967, 1.2048, 1.2106, 1.2170. When the price passes after opening a deal in the right direction for 20 points, Stop Loss should be set to breakeven. The release of reports on unemployment and wages is scheduled for Tuesday in the UK. This is not the most important data at this time, so we do not expect a serious reaction to it. In the evening there will be a speech by Bank of England Chairman Andrew Bailey, who is also extremely rarely eloquent. There will be no important events or publications in the US on Tuesday at all. Basic rules of the trading system:1) The signal strength is calculated by the time it took to form the signal (bounce or overcome the level). The less time it took, the stronger the signal. 2) If two or more deals were opened near a certain level based on false signals (which did not trigger Take Profit or the nearest target level), then all subsequent signals from this level should be ignored. 3) In a flat, any pair can form a lot of false signals or not form them at all. But in any case, at the first signs of a flat, it is better to stop trading. 4) Trade deals are opened in the time period between the beginning of the European session and until the middle of the US one, when all deals must be closed manually. 5) On the 30-minute TF, using signals from the MACD indicator, you can trade only if there is good volatility and a trend, which is confirmed by a trend line or a trend channel. 6) If two levels are located too close to each other (from 5 to 15 points), then they should be considered as an area of support or resistance. On the chart:Support and Resistance Levels are the Levels that serve as targets when buying or selling the pair. You can place Take Profit near these levels. Red lines are the channels or trend lines that display the current trend and show in which direction it is better to trade now. The MACD indicator (14,22,3) consists of a histogram and a signal line. When they cross, this is a signal to enter the market. It is recommended to use this indicator in combination with trend lines (channels and trend lines). Important speeches and reports (always contained in the news calendar) can greatly influence the movement of a currency pair. Therefore, during their exit, it is recommended to trade as carefully as possible or exit the market in order to avoid a sharp price reversal against the previous movement. Beginners on Forex should remember that not every single trade has to be profitable. The development of a clear strategy and money management are the key to success in trading over a long period of time. The material has been provided by InstaForex Company - www.instaforex.com |
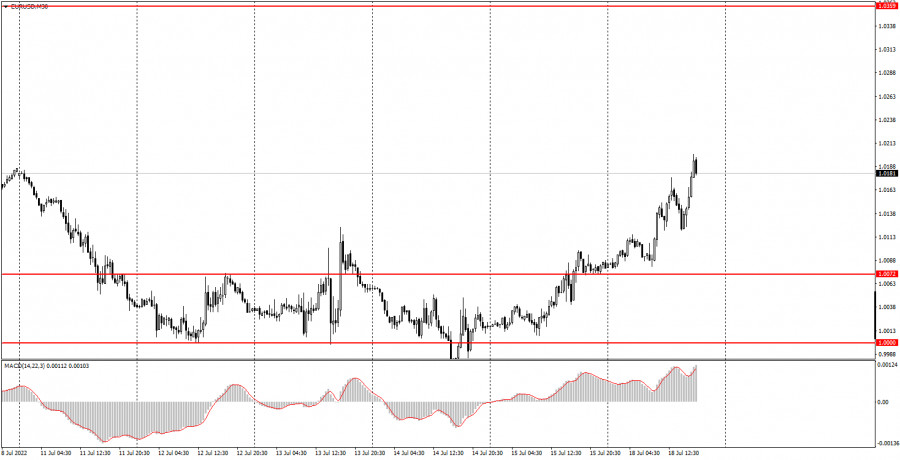
| How to trade EUR/USD on July 19? Simple tips for beginners. Posted: 18 Jul 2022 02:47 PM PDT Analysis of Monday's deals:30M chart of the EUR/USD pair
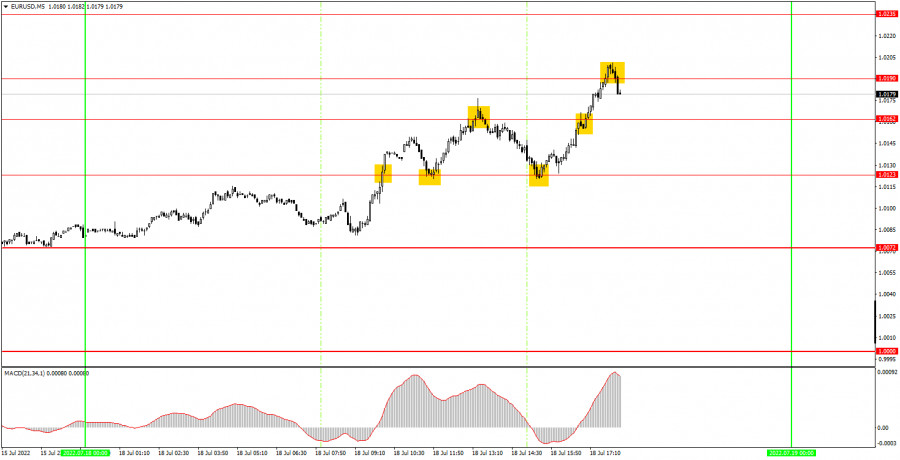
The EUR/USD currency pair showed such a movement on Monday that we were even somewhat surprised. Taking into account the fact that there were no macroeconomic and fundamental backgrounds that day, the euro somehow managed to grow by about 100 points. Of course, we would not open champagne on this occasion to celebrate the start of a new upward trend. Still, two days of growth is too little to talk about the end of a 2-year downward trend. However, the bulls have made a good bid to finally end the hegemony of the US dollar. Unfortunately, we still do not believe that the euro is capable of showing strong and sustained growth at this time. The Federal Reserve remains much more aggressive in its monetary approach than the European Central Bank, and the geopolitical conflict in Ukraine has a greater impact on the EU economy than on the US economy. Thus, we believe that Monday's growth could be due to the fact that the ECB meeting will take place this week, at which the rate will be raised with a 99% probability by 0.25%. It is possible that by the end of the week we will see a new fall in the euro. 5M chart of the EUR/USD pair
Trading signals on the 5-minute timeframe were quite good on Monday. Unfortunately, the upward movement could not be caught from the very beginning. The first buy signal was formed only when the price settled above the level of 1.0123. Then it managed to return to this level and only after that it resumed growth, having reached the level of 1.0162. One should close long positions near this level and open short ones. The price went down back to the level of 1.0123 on a sell signal, and bounced off it for the second time in a day, forming a new buy signal. Thus, short positions should have been closed here and new long positions should have been opened. Subsequently, the price began to grow, overcame the level of 1.0162 and reached the next target level of 1.0190, where it was necessary to take profit on longs. The last sell signal near 1.0190 should not have been worked out, as it was formed too late. In principle, not a single false signal was formed during the day, and the profit was about 80 points, which is just fine for a day like Monday. How to trade on Tuesday:The downward trend continues on the 30-minute time frame, but since there is no trend line or channel at the moment, this moment is far from obvious. We believe that the euro could fall at any moment. Nevertheless, the pair's growth is also possible now, so the buy signals should not be ignored. On the 5-minute TF on Tuesday it is recommended to trade at the levels of 1.0000, 1.0072, 1.0123, 1.0162-1.0190, 1.0235, 1.0277, 1.0354. When passing 15 points in the right direction, you should set Stop Loss to breakeven. The European Union will publish a report on inflation for June. And this is the only and in any case the most important event of the week. The reaction to it can be quite strong, but it is impossible to predict it. You need to be alert and ready for any development of events. Basic rules of the trading system:1) The signal strength is calculated by the time it took to form the signal (bounce or overcome the level). The less time it took, the stronger the signal. 2) If two or more deals were opened near a certain level based on false signals (which did not trigger Take Profit or the nearest target level), then all subsequent signals from this level should be ignored. 3) In a flat, any pair can form a lot of false signals or not form them at all. But in any case, at the first signs of a flat, it is better to stop trading. 4) Trade deals are opened in the time period between the beginning of the European session and until the middle of the US one, when all deals must be closed manually. 5) On the 30-minute TF, using signals from the MACD indicator, you can trade only if there is good volatility and a trend, which is confirmed by a trend line or a trend channel. 6) If two levels are located too close to each other (from 5 to 15 points), then they should be considered as an area of support or resistance. On the chart:Support and Resistance Levels are the Levels that serve as targets when buying or selling the pair. You can place Take Profit near these levels. Red lines are the channels or trend lines that display the current trend and show in which direction it is better to trade now. The MACD indicator (14,22,3) consists of a histogram and a signal line. When they cross, this is a signal to enter the market. It is recommended to use this indicator in combination with trend lines (channels and trend lines). Important speeches and reports (always contained in the news calendar) can greatly influence the movement of a currency pair. Therefore, during their exit, it is recommended to trade as carefully as possible or exit the market in order to avoid a sharp price reversal against the previous movement. Beginners on Forex should remember that not every single trade has to be profitable. The development of a clear strategy and money management are the key to success in trading over a long period of time. The material has been provided by InstaForex Company - www.instaforex.com |
| AUD/USD. Aussie's comeback: aussie takes advantage of US dollar weakness Posted: 18 Jul 2022 02:47 PM PDT The Australian dollar, paired with the US currency, is actively regaining lost positions: the aussie is taking advantage of the weakening of the general greenback. The AUD/USD pair has been declining for a month and a half - from early June to mid-July. And although the downward dynamics was accompanied by upward rollbacks, the downward trend clearly dominated. If last month the bears easily overcame the support level of 0.7000, which served as a reliable price outpost for many months. As a result, the aussie made a new two-year low, dropping to 0.6685. The last time the pair was at such bottoms was in July 2020, when strict quarantine restrictions were introduced in Australia.
To date, coronavirus remains a headache for Australians: the number of infected is growing again due to another mutation of the Omicron strain. But the market is already reacting differently to the coronavirus factor. Despite the COVID outbreak, the Australian authorities are in no hurry to increase quarantine restrictions or close megacities, as they did two years ago. The main focus is on vaccination in the context of receiving a booster dose of the anti-COVID vaccine. Therefore, market participants are effectively ignoring medical reports - at least Australian ones. AUD/USD traders are more worried about the spread of the coronavirus in China, as the PRC has a zero tolerance policy: due to a few identified cases, Beijing may quarantine, for example, a large metropolis (such as Shanghai), thereby destroying numerous supply chains. By the way, data on the growth of the Chinese economy published on Friday put additional pressure on the aussie: the Shanghai lockdown and other quarantine restrictions did not go unnoticed for China. In the second quarter, China's GDP fell by 2.6% compared to the period of January-March this year. If in the third quarter the decline in the country's economy continues (which is very likely), then China will be in recession. As you know, China is one of Australia's main trading partners, so these results disappointed AUD/USD traders. Last week, bears were able to test the 66th figure for the first time in two years.But they failed to settle in this price area, primarily because of the general weakening of the US currency. If at the end of last week the US dollar index was at the level of the 108th figure, then at the moment it has fallen to 106.80. Ahead of next week's July Federal Reserve meeting, dollar bulls raised their hawkish expectations too sharply, under the influence of the latest inflationary release (a record rise in the US consumer price index), as well as after the announcement of the results of the July meeting of the Bank of Canada (which unexpectedly increased the interest rate by 100 points at once). Rumors began to circulate on the market that the US central bank would go the same way, and at the next meeting. Here it is necessary to recall that quite recently Fed Chairman Jerome Powell said that at the July meeting the central bank would decide whether to raise the rate by 50 points or by 75. Moreover, after the release of the report on the growth of the core PCE (which again showed signs of slowdown), the scale began to gradually tilt in favor of a 50-point increase. Therefore, such a sharp swing in market sentiment allowed the dollar bulls to organize a small but victorious rally. However, traders jumped to conclusions. Over the next few days, several representatives of the Fed (Waller, Bullard, Bostic, Daley) voiced their position - of which only Mary Daly supported the idea of a 100-point rate hike. Everyone else was skeptical about the implementation of this scenario. Another reversal in this issue had a negative impact on the greenback: dollar bulls were forced to retreat. Actually, thanks to a kind of false start, the Australian dollar was able to win back part of the lost ground. Additional support for the aussie can be provided by the minutes of the last meeting of the Reserve Bank of Australia, which will be published tomorrow, July 19. Let me remind you that at the July meeting the central bank raised the interest rate by 50 basis points. Despite such a hawkish decision, the Australian dollar reacted stolidly to this fact - primarily due to the fact that the central bank implemented a base, widely expected scenario, which was already priced into. In addition, the rhetoric of the central bank's accompanying statement, as well as RBA Governor Philip Lowe's comments, disappointed with their neutral tone. The probability of a 50-point advance in August has declined. Experts suggested that the rate of tightening of the monetary policy of the RBA in the second half of the year will slow down. The minutes of the July meeting can either confirm these assumptions or refute them. In terms of technique, the pair is traded between the middle and lower lines of the Bollinger Bands indicator, as well as between the Tenkan-sen and Kijun-sen lines. This suggests that the situation is uncertain, although at the moment the likelihood of a resumption of the downward trend still prevails. Longs for the pair should be considered after bulls overcome the resistance level of 0.6880 (Kijun-sen line at D1). In this case, the price will be above the Tenkan-sen and Kijun-sen lines of the Ichimoku indicator, as well as between the middle and upper lines of the Bollinger Bands indicator (but below the Kumo cloud). Such a technical pattern will allow bulls to count on further price growth - to the upper line of the Bollinger Bands on D1, that is, to the main resistance level of 0.7000. The material has been provided by InstaForex Company - www.instaforex.com |
| July 18, 2022 : EUR/USD daily technical review and trading opportunities. Posted: 18 Jul 2022 01:03 PM PDT
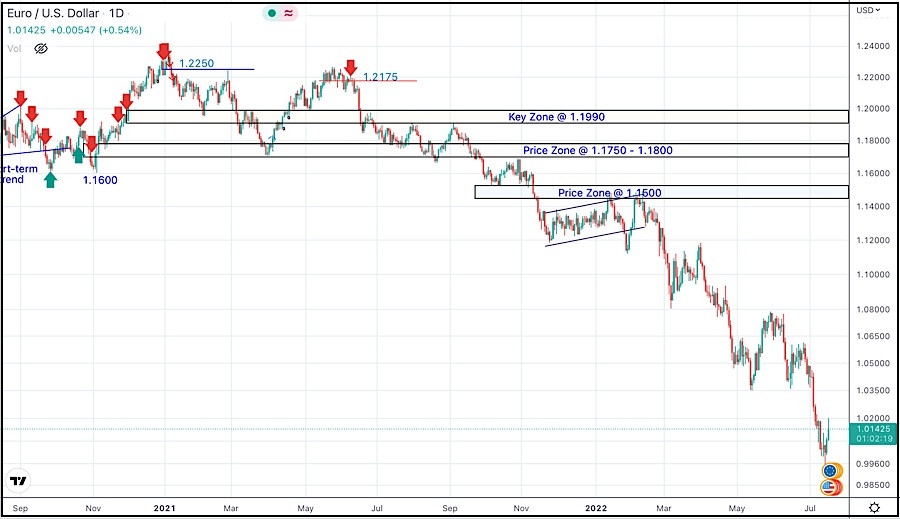
In late September, Re-closure below the price level of 1.1700 has initiated downside-movement towards 1.1500 where some recovery was witnessed. Shortly after, Price levels around 1.1700 managed to hold prices for a short period of time before another price decline took place towards 1.1200. Then the EURUSD has temporarily moved-up within the depicted movement channel until downside breakout occurred recently. Since then, the price zone around 1.1500 has applied significant SELLING pressure when a valid SELL Entry was offered upon the previous ascending movement towards it. Shortly after, the EURUSD looked oversold while approaching the price levels of 1.0800 few weeks ago. That's where the recent upside movement was previously initiated. However, the recent movement towards 1.1200 was considered for another SELL Trade which already reached its targets. Any ascending movement towards 1.0800 should be watched for selling pressure and a possible SELL entry. The material has been provided by InstaForex Company - www.instaforex.com |
| July 18, 2022 : EUR/USD Intraday technical analysis and trading plan. Posted: 18 Jul 2022 01:02 PM PDT
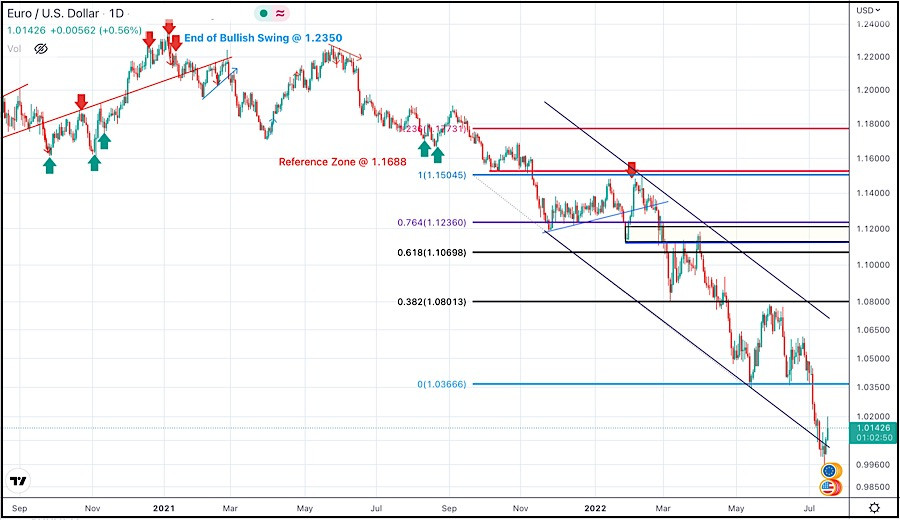
The EURUSD looked oversold while approaching the price levels of 1.0800. That's when a temporary upside movement was approaching the price levels around 1.1200. This recent movement towards 1.1200 was suggested for another SELL opportunity which already reached its targets beyond the price level of 1.0400. The previous ascending movement above 1.0600 enabled further advancement towards 1.0800 where evident bearish rejection arised again. The EURUSD pair had been trapped between 1.0350 (the newly recorded Low) and 1.0750 which corresponds to the nearest existing SUPPLY level until bearish breakout below 1.0350 was recently achieved. Currently, the EURUSD pair was approaching new price levels around 1.0000 that haven't been visited since 2002. That's where price action should be watched cautiously for significant bullish recovery especially around such an important psychological support. The material has been provided by InstaForex Company - www.instaforex.com |
| July 18, 2022 : GBP/USD Intraday technical analysis and significant key-levels. Posted: 18 Jul 2022 01:01 PM PDT
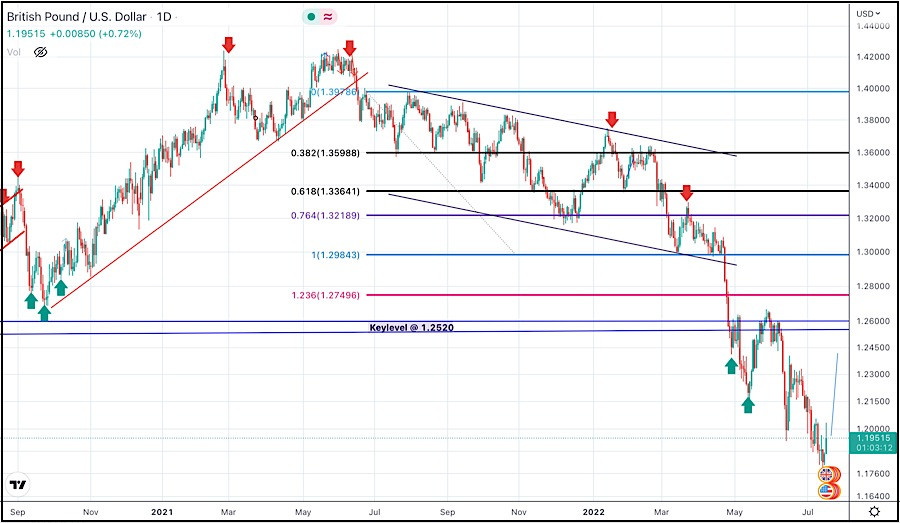
Recently, the GBP/USD pair remained under bearish pressure to challenge the new low around 1.2150 again which was temporarily bypassed few days go. Immediate bullish rejection was expressed around 1.1950 bringing the pair back above 1.2150 again towards higher price levels. Bullish persistence above 1.2300 (when achieved) will probably enable further bullish continuation towards 1.2550 and probably 1.2650 where further decisions can be taken. On the other hand, more bearish visits were expected to challenge the price level of 1.1950 when sufficient bearish momentum was expressed. Significant bullish recovery has been witnessed during the recent bearish dip that took place earlier two weeks ago. Currently the pair looks oversold while approaching these price levels. This favours the bullish scenario at least towards 1.2520 unless bearish persistence below 1.1900 is achieved towards 1.1650. The material has been provided by InstaForex Company - www.instaforex.com |
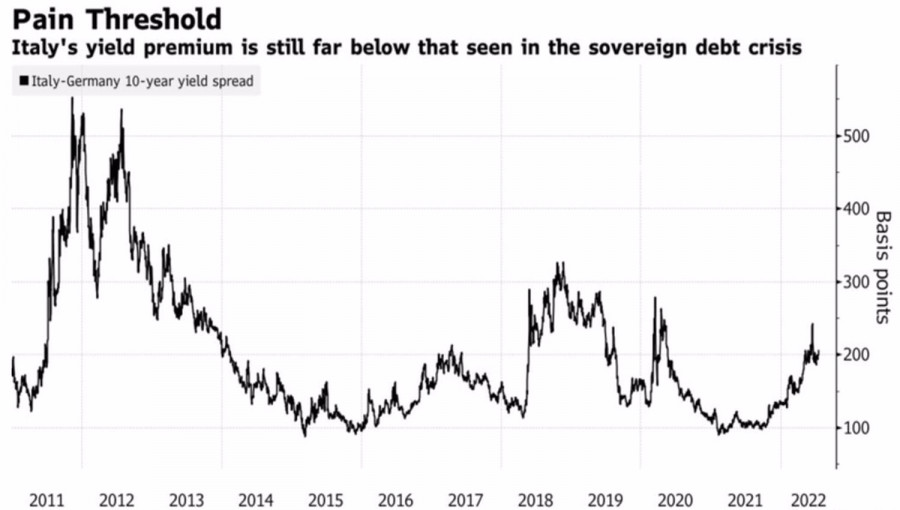
| The dollar entered the feedback loop Posted: 18 Jul 2022 09:31 AM PDT Who will stop the dollar? Even though the EURUSD bulls managed to catch on to parity and went on the counterattack, there is no talk of a full-fledged correction of the main currency pair. Investors are reinsuring themselves in case Nord Stream resumes operation, Italy avoids a political crisis, and the ECB unexpectedly raises the deposit rate by 50 bps instead of 25 bps. The euro should go up, as so much bad news has already affected its quotes. Alas, the coincidence of all three events all at the same time seems unlikely. The Five Star Movement, which has so far only provoked a storm in a teacup in Italy, clearly does not want snap elections. The party's rating began to fall after joining the coalition. Mario Draghi may be able to save the country from another political crisis. This will result in a reduction in the yield spread of Italian and German bonds and untie the hands of the ECB. Curiously, almost half of the 792 investors surveyed by Pulse believe that the European Central Bank will begin to actively intervene in the life of the debt market if the key spread exceeds 450 bps. Bloomberg experts previously called a figure of 250 bps. Dynamics of yield differential of Italian and German bonds
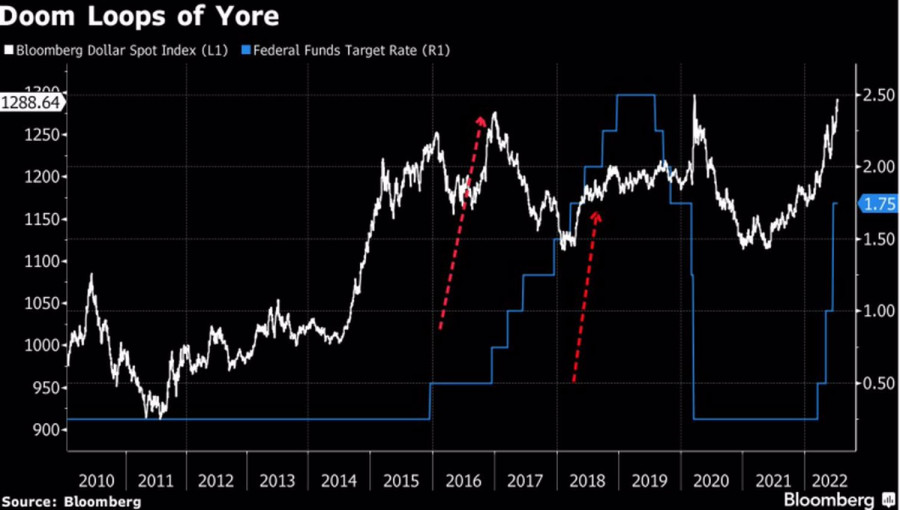
The idea of raising the deposit rate by 50 bps at the meeting of the European Central Bank on July 21 does not look unrealistic either. Record high inflation, the fall of EURUSD to the 20-year bottom, which makes energy products even more expensive and contributes to the crisis, as well as the desire of other regulators to keep up with the Fed play into the hands of the ECB's hawks. It is more difficult to resume the work of the Nord Stream because if Russia wants to avenge the sanctions, it is the right time. Thus, the euro has arguments for a counterattack, but it is unlikely that this will somehow change the existing trend in EURUSD. The US dollar draws a feedback loop when its strengthening negatively affects the global economy by hitting debt-laden developing countries, high commodity prices, and worsening global trade conditions. All this increases the risks of a global recession and contributes to the growth of demand for safe-haven assets. That is, the US dollar. A vicious circle that the Fed had previously destroyed. The Federal Reserve, looking at the negative impact of its tightening monetary policy, often began to slow down with an increase in rates. As a result, a pattern emerged according to which the US dollar strengthens on the eve of the start of the process of monetary restriction and at its beginning and then begins to weaken. Dynamics of the US dollar and Fed rates
This template is currently not functional. If Jerome Powell and his colleagues are willing to sacrifice their labor market and economy to beat inflation, what do they care about the rest of the world? Technically, the Three Indians pattern has worked out on the EURUSD daily chart. However, the downward trend is strong, so rebounds from resistances at 1.018, 1.022, and 1.03 should be used for selling. The material has been provided by InstaForex Company - www.instaforex.com |
| EUR/USD. 100-point Fed rate hike: Dollar bulls make a false start Posted: 18 Jul 2022 08:59 AM PDT The US dollar, at the start of the trading week, is losing its positions throughout the market, including in pairs with the euro. EUR/USD bears abandoned the idea of conquering the 99th figure (at least for the moment), after which the buyers seized the initiative for the pair. We are not talking about a trend reversal: we are dealing with a corrective pullback due to the weakening of the US currency.
The dollar may have become a victim of inflated market expectations. Rumors that the Fed could raise interest rates by 100 points at once quickly turned into certain confidence, especially after the Bank of Canada raised the rate by this amount. A hawkish, but hasty market conclusions, on the one hand, significantly strengthened the greenback (for example, the EUR/USD pair fell to 0.9953) but, on the other hand, played a cruel joke on the dollar. It turned out that the issue of a 100-point rate hike is at least debatable. Moreover, some representatives of the Fed have already criticized this idea. In particular, Christopher Waller (who has the right to vote) said that market participants "are waiting too soon for a 100 basis point rate hike." In his opinion, the regulator should not "recklessly react to published inflation data." At the same time, he signaled that he was ready to support a 75-point rate hike in July. James Bullard voiced a similar position, who also has the right to vote in the Committee this year. In general, he admitted the possibility of such a step but, at the same time, doubted its expediency. According to him, there is not much difference—whether to raise the rate by 100 points in July "and less at three other meetings this year" or to increase the rate by 75 points this month "and maybe a little more" at the remaining meetings in 2022. In turn, Federal Reserve Bank of Atlanta President Raphael Bostic said that too sharp an increase "could hit the positive aspects of the economy." By and large, the idea of a 100-point increase was supported in the public plane only by the head of the San Francisco Fed, Mary Daly. The rest of the Fed representatives were either skeptical about this proposal or have not yet expressed their position. In addition, another fundamental factor played against the dollar. Last Friday, inflation expectations calculated by the University of Michigan were published. The release showed that the component of long-term inflation expectations decreased to 2.8% (from the previous value of 3.1%). After this publication, the probability of a rate increase by 100 basis points at the July meeting decreased again. To date, the possibility of this scenario is estimated at 25%, whereas after the publication of the report on the growth of the consumer price index, as well as after the announcement of the results of the meeting of the Canadian regulator, traders laid an 85% probability. Given such a mood swing, it is not surprising that the greenback was under pressure—its situational weakening looks quite logical and reasonable.
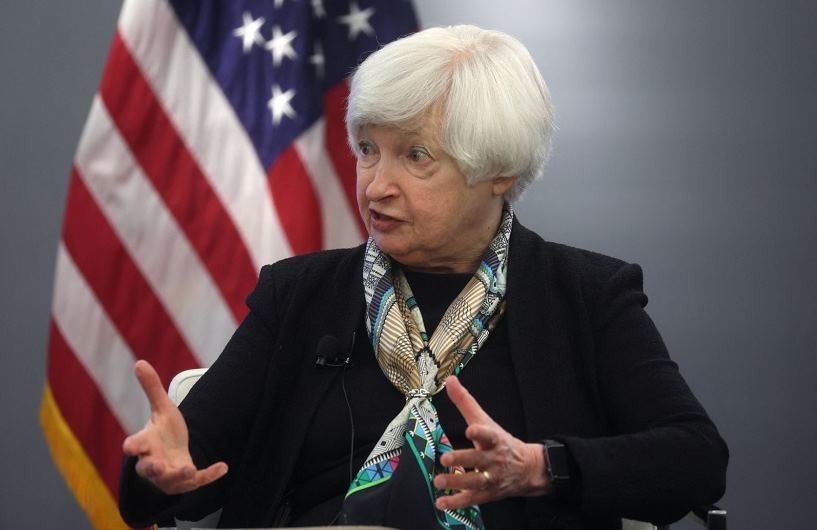
Treasury Secretary Janet Yellen also contributed. In today's interview with Reuters, she stated that Washington's relations with Beijing "are not completely negative." Although her comments were quite vague (Yellen indicated that China is listening to US concerns "in some areas"), traders reacted quite sharply: at the start of the trading week, markets are positive about risk, while demand for the dollar has significantly decreased. By and large, a correction in the EUR/USD pair has been brewing for a long time. The pair's traders had little choice: either the sellers push through the parity level and consolidate in the area of the 99th figure, or the buyers seize the initiative and organize a counteroffensive, the ceiling of which is the 1.0300 mark. In the current conditions, traders could not afford to drift into the 1.0000 area—either a further advance downward, or a retreat of 150–200 points up. If the Fed members had unanimously supported the idea of a 100-point rate hike at the July meeting, the bears would have had a chance to conquer the 99th figure. But the Fed representatives moderated the ardor of the dollar bulls, thus supporting the corrective pullback of EUR/USD. At the moment, it is best to take a wait-and-see position—you need to wait for the end of the upward impulse. From a technical point of view, EUR/USD buyers have a range of up to 1.0300—at this price point, the middle line of the BB indicator coincides with the Kijun-sen line on the daily chart. However, the pair may well complete the correction ahead of schedule, even before reaching the target. Longs look risky and unreliable, the downward trend is still in force, so when the corrective momentum fades, sales will be relevant again. The targets are 1.0150 (in case of price growth to the area of the 2nd figure), 1.0100 and 1.0050. The material has been provided by InstaForex Company - www.instaforex.com |
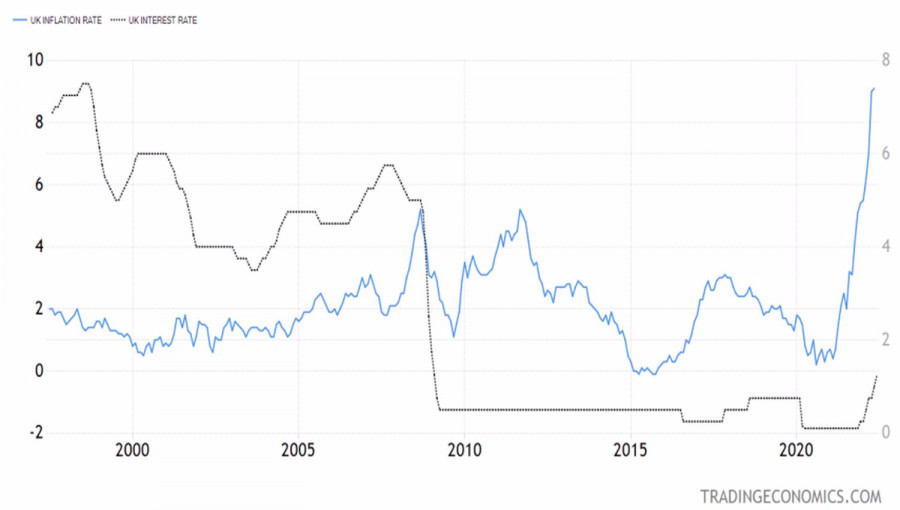
| GBPUSD bulls went on a counterattack Posted: 18 Jul 2022 08:50 AM PDT Despite the retreat of the US dollar against major world currencies at the end of the week by July 15 and Reuters experts' forecasts of its 8% weakening in 12 months, the dollar does not look like a colossus with feet of clay. The same experts expect it to strengthen over the next three months, and the US economy looks better than, for example, the European one. For the GBPUSD, the situation is aggravated by political uncertainty—there is no clear leader among the candidates for the post of prime minister after Boris Johnson left it. The next debate, which will eliminate two candidates out of five, and a busy economic calendar, attracts well-deserved attention to the sterling. Releases of data on the labor market, inflation, retail sales, and business activity will show the state of the UK economy and whether it can withstand a 50 bps repo rate increase in August. Markets estimate the probability of such an outcome at 79%, so the Bank of England may have to retreat from its plan for a slow increase in borrowing costs, which it adhered to at five previous meetings. In this regard, the key event of the week of July 22 is the statistics on consumer prices. According to Bloomberg experts, they will accelerate from 9.1% to 9.3%. At the same time, core inflation, unlike the US, does not yet think of slowing down. This forces BoE to act decisively, especially since four out of five candidates for the leadership of the Conservative Party propose tax cuts, which will support economic growth, but at the same time further disperse the CPI. Dynamics of British inflation and Bank of England rates
Traders working with the GBPUSD should keep in mind such events as the political crisis in Italy and the complete shutdown of Russian gas transit to Europe, which will increase the risks of a recession not only in the eurozone but throughout the world, and will contribute to an increase in demand for safe-haven assets, primarily on the US dollar. Even though, according to the Bank of America model, the dollar is significantly overvalued, and history shows that it usually strengthened in the lead-up to the Fed's monetary restriction cycle and then began to weaken during the increase in the federal funds rate, this time it is different. The determination of the Fed and the unprecedented interest in safe-haven assets have made the dollar king in Forex.
The GBPUSD pullback may be due to a decrease in the probability of a Fed rate hike at the July meeting by 100 bps from almost 90% to 30%, the growth of American stock indices, and hopes for aggressive actions by the Bank of England. All these factors are temporary. Structural changes are taking place in the British economy against the background of the energy crisis, which cannot but affect the sterling. Technically, there is a steady downward trend on the GBPUSD daily chart. Rebound from resistances at 1.197, 1.201 and 1.208 should be used to form short positions. The material has been provided by InstaForex Company - www.instaforex.com |
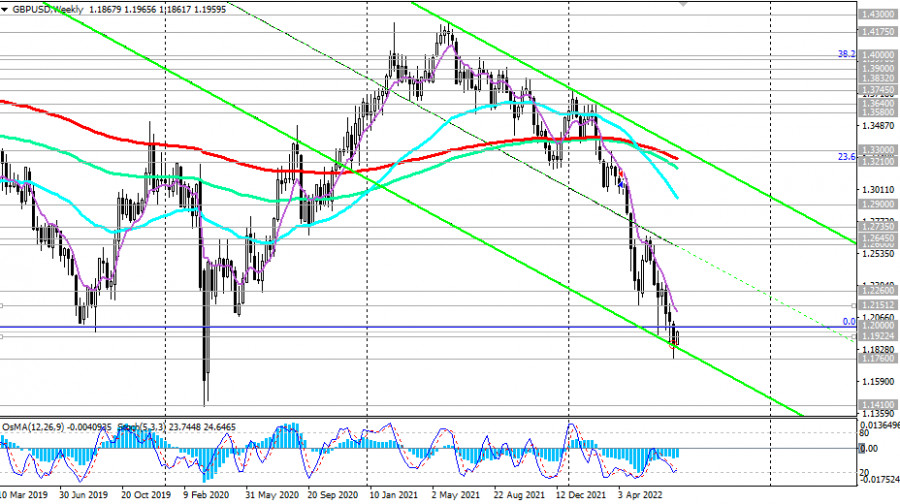
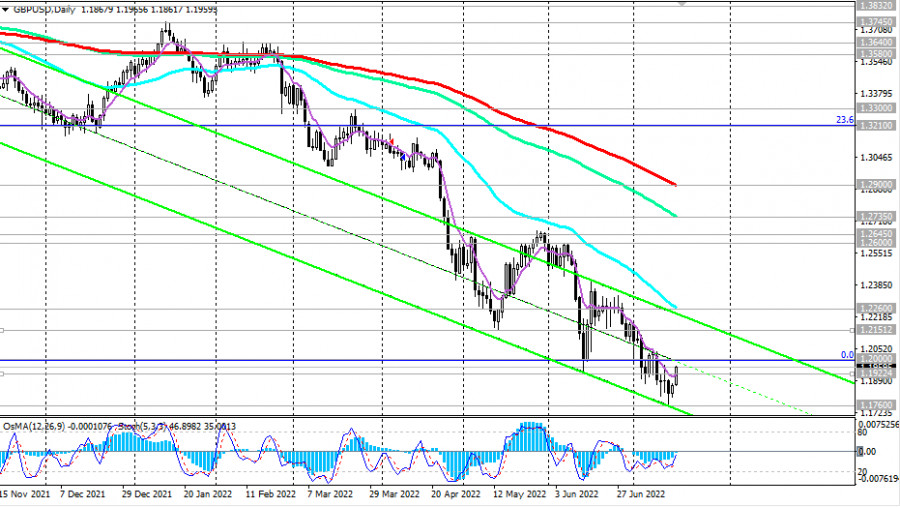
| GBP/USD Technical Analysis and Trading Tips for July 18, 2022 Posted: 18 Jul 2022 08:39 AM PDT
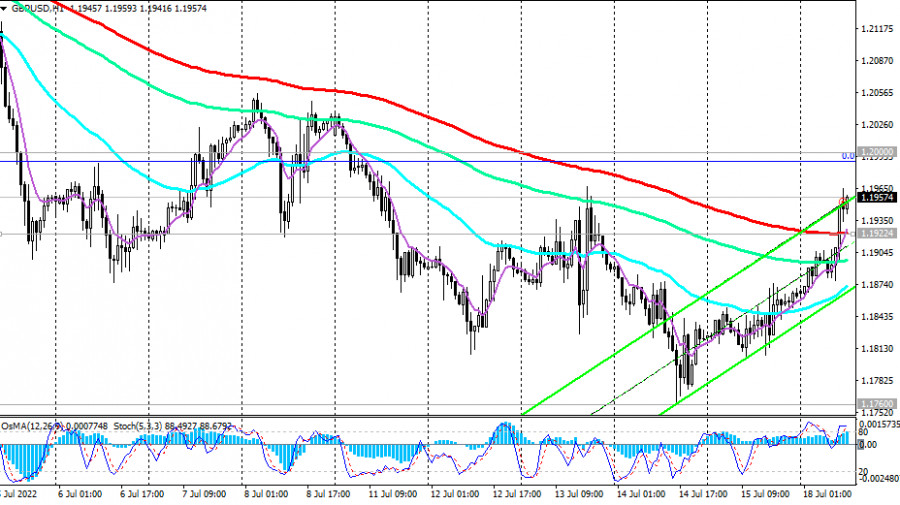
The GBP/USD is growing today, having received an impulse from the dollar, developing a downward correction. As of this writing, GBP/USD is trading near the level of 1.1957, having broken through the important short-term resistance level of 1.1922 (200 EMA on the 1-hour chart) at the beginning of today's European session, thus placing an order for a possible continuation of growth.
If this upward correction continues, GBP/USD will move towards the resistance level of 1.2151 (200 EMA on the 4-hour chart) and break through 1.2200, through which the upper limit of the descending channel passes on the daily chart. The limit of the upward correction is around the resistance level of 1.2260 (50 EMA on the daily chart). The dynamics of GBP/USD is still dominated by bearish momentum, which forced the pair to update its more than 2-year low last week (since April 2020).
And since trends do not break so quickly, it is logical to assume the resumption of the downward dynamics of GBP/USD. And the trigger may be the publication (tomorrow or Wednesday) of important macro statistics for the UK if it turns out to be negative or weak. In an alternative scenario, the growth of GBP/USD will continue above the resistance level of 1.2260. This scenario is unlikely, but it still has the right to be, especially if very weak macro data comes from the US, although there are not so many of them this week.
In the main scenario, we expect a resumption of the decline either near the local resistance level of 1.2000 or near the levels of 1.2075, 1.2100, 1.2150. Therefore, it would be logical to place pending orders (Sell Limit) for sale here. A confirmation signal will be a breakdown of the support level of 1.1922. Support levels: 1.1922, 1.1900, 1.1800, 1.1760 Resistance levels: 1.2000, 1.2151, 1.2260, 1.2400, 1.2600, 1.2645, 1.2700, 1.2735, 1.2900, 1.3000, 1.3100, 1.3210, 1.3300 Trading Tips Sell Stop 1.1930. Stop-Loss 1.2015. Take-Profit 1.1900, 1.1800, 1.1760, 1.1700 Buy Stop 1.2015. Stop-Loss 1.1930. Take-Profit 1.2100, 1.2151, 1.2260, 1.2400, 1.2600, 1.2645, 1.2700, 1.2735, 1.2900, 1.3000, 1.3100, 1.3210, 1.3300 The material has been provided by InstaForex Company - www.instaforex.com |
| GBP/USD: How long will the upward correction last? Posted: 18 Jul 2022 08:19 AM PDT
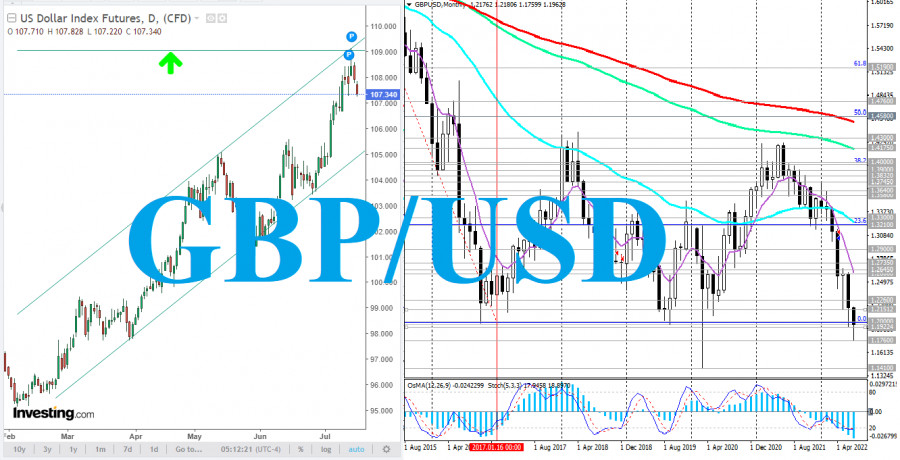
The pound remains under pressure against the US dollar, despite the tough rhetoric of the Bank of England officials regarding the prospects for monetary policy and positive macro statistics received last week: the UK manufacturing output increased by +1.4% in May (against the forecast of +0.1% growth). In annual terms, the indicator rose by +2.3%, exceeding expectations of +0.3% after rising by +1.3% in April. The total volume of industrial production increased in annual terms by +1.4% (against the expected decrease by -0.5% and the previous value of +1.6%). The recovery of the British economy in May was also evidenced by the monthly release of the Office for National Statistics (ONS), which states that the UK GDP in May amounted to +0.5% against the expectation of zero growth and after a decrease of -0.3% in April. At the same time, the indicator (estimate of GDP growth rates) published by the National Institute of Economic and Social Research (NIESR) and estimating the growth rate of the British economy over the past three months also came out with a value of +0.2%, which turned out to be better than the forecast of +0.1%. Note that this report comes out before the release of official GDP data, and its positive value hints at an equally positive official report, and it, in turn, is a bullish factor for the GBP. Meanwhile, former British Chancellor of the Exchequer and Conservative Party leader candidate Rishi Sunak said last Thursday that "the number one economic priority (for the UK government) is to fight inflation." "We are working together with the Bank of England to curb inflation and I am confident that we can create a stronger economy for all people in the UK," UK Treasury Secretary Nadhim Zahawi said in unison with Rishi Sunak last week. As a result of the June meeting, the Bank of England announced its decision to raise interest rates for the fifth time in a row to curb inflation. With 6 out of 9 votes, the Monetary Policy Committee voted to raise the rate by 25 bps to 1.25%; other members of the MPC pushed for a 50 bps rate hike. Interest rates in the UK are now at their highest level since January 2009. In an accompanying statement, the Bank of England said it was ready to continue acting decisively to address the dangers of high inflation above 11%. Market participants generally reacted positively to this decision of the Bank of England. The pound first sharply weakened but then also sharply strengthened. As a result of this trading day (June 16), the GBP/USD pair rose by 68 points, while intraday volatility amounted to 365 points. Meanwhile, the external macroeconomic background is not encouraging: energy prices continue to rise, the end of the military conflict in Ukraine is not yet in sight, and sanctions pressure on Russia is growing, creating new risks for the British economy. The Bank of England forecasts a contraction in UK GDP by 0.25% by 2023, updated from its previous estimate of 1.25% growth. And in 2024, the bank lowered its forecast for GDP growth from 1% to 0.25%. While markets are forecasting the interest rate to rise to 2.5% by mid-2023, economists believe that the Monetary Policy Committee will be able to raise rates only once more this year, which will probably happen in August. It is not a positive factor for the pound, while the tightening cycle is accelerating in other major world central banks. However, time will tell, as they say. The next meeting of the Bank of England, dedicated to the issues of monetary policy, will be held on August 4. The bank's management may again raise the interest rate in order to curb inflation, which has reached 40-year highs. The next release on the current inflation in the country will be published on Wednesday (at 06:00 GMT). UK inflation may set a new anti-record at 9.2% in June (after annual growth of 9.1%, 9.0%, 7.0%, 6.2%, and 5.5% in the previous months since the beginning of this year). As for tomorrow's publication (at 06:00 GMT), it is expected that the UK ONS report on the labor market will indicate a low unemployment rate of 3.8% and an increase in average wages, including bonuses, over the last calculated 3 months (March-May), by +6.8% (after growth by +6.8%, +7.0%, +5.4%, +4.8%, +4.3%, +4 .2% in previous periods); without premiums by +4.3% (after growth by +4.2%, +4.2%, +4.1%, +3.8%, +3.7%, +3.8% in the previous periods). If the data is confirmed or turns out to be better than the forecast, the pound is likely to strengthen. Worse than expected/previous data will have a negative impact on the pound, as it will reinforce the negative outlook regarding the possibility of an interest rate hike by the Bank of England in August. GBP/USD is growing today, having received an impulse from the dollar, developing a downward correction.
The dollar index (DXY) is down today after breaking above 109.00 last week. Given the strong bullish momentum, as well as the long-term upward trend in DXY, a breakdown of this local resistance level will be a signal to increase long positions in DXY futures with the prospect of growth towards multi-year highs of 121.29 and 129.05, reached, respectively, in June 2001 and November 1985. Market participants continue to evaluate the inflation indicators published last Wednesday, which pointed to the continuing rise in inflation in the US. As follows from the data of the US Bureau of Labor Statistics, published last Wednesday, in June, inflation in the US accelerated from 1.0% to 1.3%, and in annual terms, jumped to the highest level in the last 40 years, amounting to 9.1%. (YoY) vs. 8.6% in May and market expectations of 8.8%. Such a sharp increase in inflation, despite the actions of the Fed, strengthened the expectations of market participants regarding a more rapid tightening of the monetary policy of the US central bank, and this is so far the main driver of USD growth. The material has been provided by InstaForex Company - www.instaforex.com |
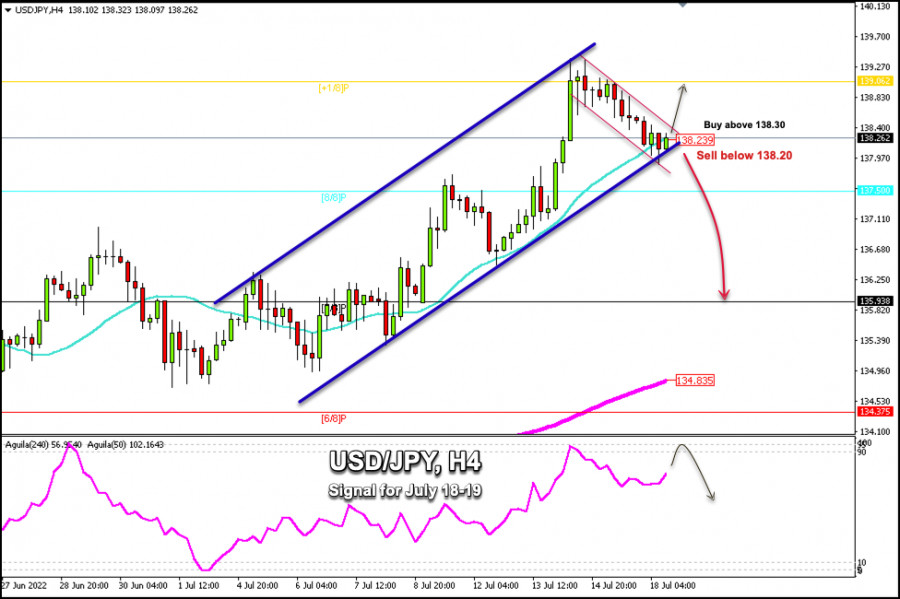
| Trading Signal for USD/JPY for July 18 - 19, 2022: sell below 138.25 (21 SMA) Posted: 18 Jul 2022 07:11 AM PDT
Early in the American session, USD/JPY is moving lower for the second day in a row. Last week, it reached 139.38, a price level that was seen 24 years ago. The steady intraday decline has extended through the European session and the pair has strengthened reaching a low of 138.00, a level that coincides with the 21 SMA. A number of influential FOMC members denied that there will be a 100-basis point rate hike at the next policy meeting on July 26-27. This information favored the recovery of the Japanese yen. This week, the currency pair is likely to continue the technical correction and could reach the support of 7/8 Murray at 135.93. On the other hand, as long as USD/JPY trades within the bullish uptrend channel and above 138.25 (21 SMA), it is likely to reach the psychological level of 140.00 in the next few weeks. According to the 4-hour chart, we can see that the yen has been trading within the uptrend channel since the beginning of July. Apparently, a sharp break below this channel could mean a change in trend in the short term. 138.00 is the key. If the yen trades below this level, there could be a bearish acceleration towards 8/8 Murray at 137.70 and up to 7/8 Murray at 135.93. On July 13, the eagle indicator reached the extremely overbought zone. In the coming days, USD/JPY is likely to continue with the technical correction. The bottom line is to wait for a daily close below 138.20 to buy. If so, the price could hit the 200 EMA at around 134.83. The material has been provided by InstaForex Company - www.instaforex.com |
| Morgan Stanley, Goldman see more stock market losses Posted: 18 Jul 2022 06:55 AM PDT
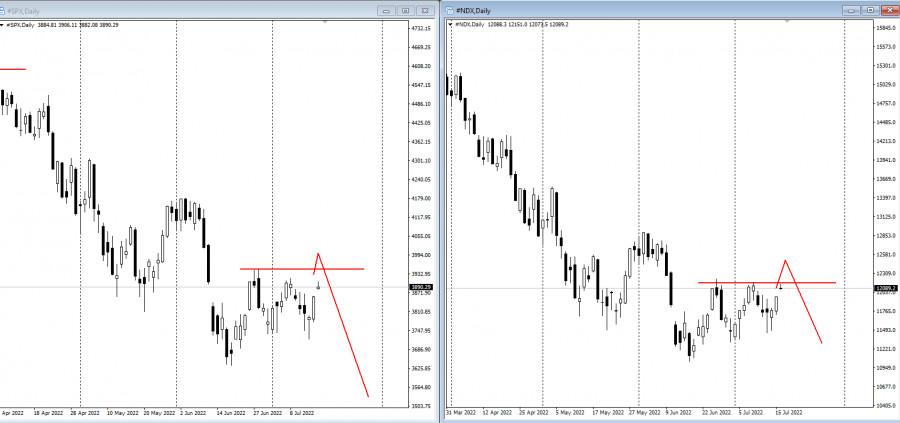
The Nasdaq 100 rose by 1.2%. S&P 500 futures contracts added 1% on Monday, extending a bullish correction in stock markets as part of a strong short-term trend. Treasury bond yields climbed back to 3%.
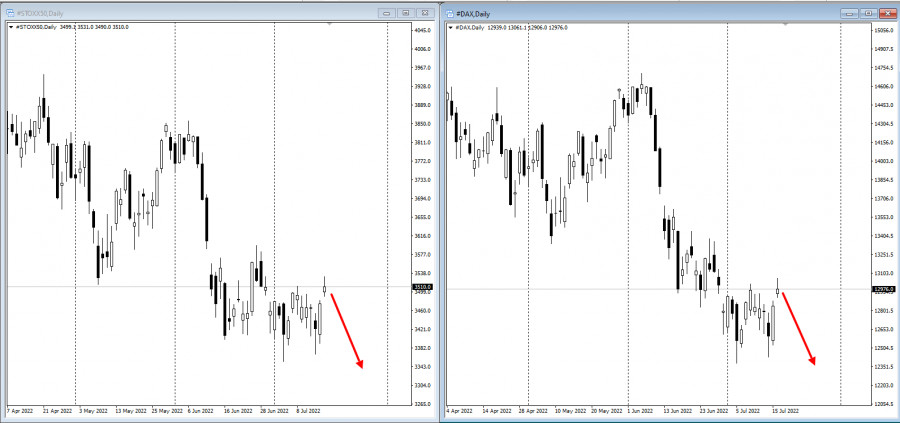
The S&P 500 index was more than 5% above its June closing low following a strong rally on Friday amid renewed hopes that inflation and Fed rate hikes may be close to peaking. Investors have grown increasingly concerned about the outlook. Gains in stock markets may prove to be short-lived as inflation pressures remain high, and a recession seems increasingly likely, according to strategists at Morgan Stanley and Goldman Sachs Group Inc European stock market hit their monthly highs today. Apparently, they will continue to fall.
Oil prices soared after US President Joe Biden wrapped up a visit to the Middle East without a firm commitment from key producer Saudi Arabia to boost crude supplies. Officials and traders expect the Nord Stream pipeline to reopen after routine maintenance. Moscow has already cut supplies amid the invasion of Ukraine. "The possibility that Russia stops, or severely reduces, their gas exports to Europe should keep markets on edge in the near-term," Mizuho International Plc strategists Peter McCallum and Evelyne Gomez-Liechti wrote in a note to clients. Key events to watch this week:
|
| Trading plan for US dollar index on July 18, 2022 Posted: 18 Jul 2022 06:28 AM PDT
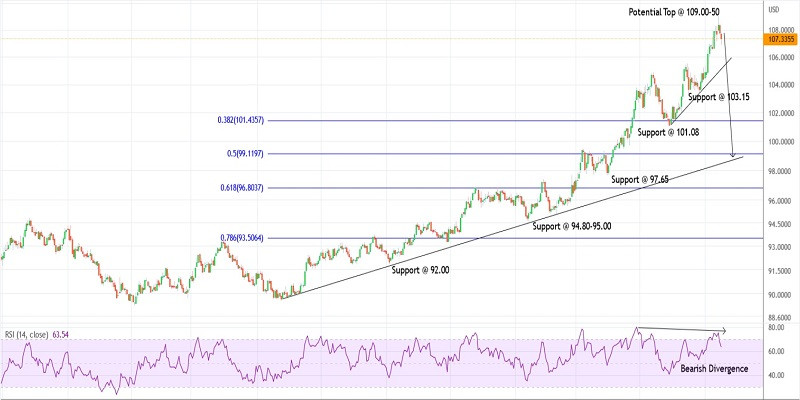
Technical outlook:The US dollar index rose through the 109.00 swing high last week before finding resistance and pulling back. The index has given in to bears dropping over 200 points, having registered a low at 106.89 on Monday. The index is seen to be trading close to 107.25 at this point in writing and is projected to target at least the 103.00 initial support on the daily chart. The US dollar index has remained in control of bulls since January 2021 after registering lows at around 89.20. The index has produced a religious uptrend carving higher highs and higher lows through 109.00 recently. The entire rally might be complete and a meaningful correction could be underway soon towards 103.00 and 101.00 levels if not lower. The US dollar index has further carved a lower-degree downswing between 109.00 and 106.89 in the past three trading sessions. Intraday pullback rallies can be expected but they should be well capped below the 109.00 interim resistance. Bears are looking poised to remain in control and target below 101.00, which is the Fibonacci 0.382 retracement of the entire rally. Going forward:The US dollar index has printed a multi-year high at 109.00, which has been accompanied by a bearish divergence on the daily RSI as seen here. The same is being reflected on the weekly chart too (not seen here). Furthermore, the daily chart is completing a potential Evening Star candlestick pattern and a close around 107.00-10 will confirm it. Considering all the above facts, a high probability remains for a drop towards at least 101.00 in the near term. Trading plan:Potential drop towards 101.00 against 109.00 Good luck! The material has been provided by InstaForex Company - www.instaforex.com |
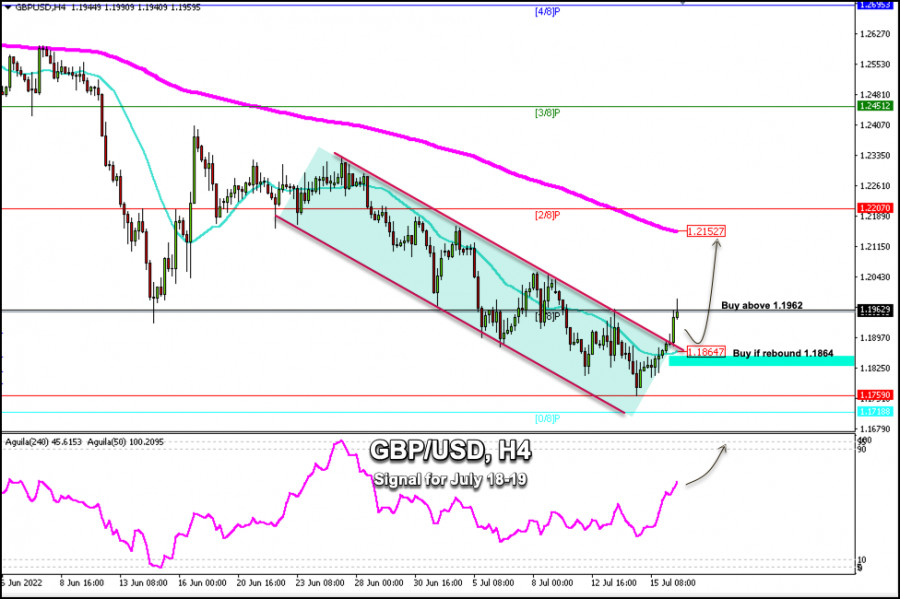
| Trading Signal for GBP/USD for July 18 - 19, 2022: buy above 1.1962 (1/8 Murray - 21 SMA) Posted: 18 Jul 2022 06:25 AM PDT
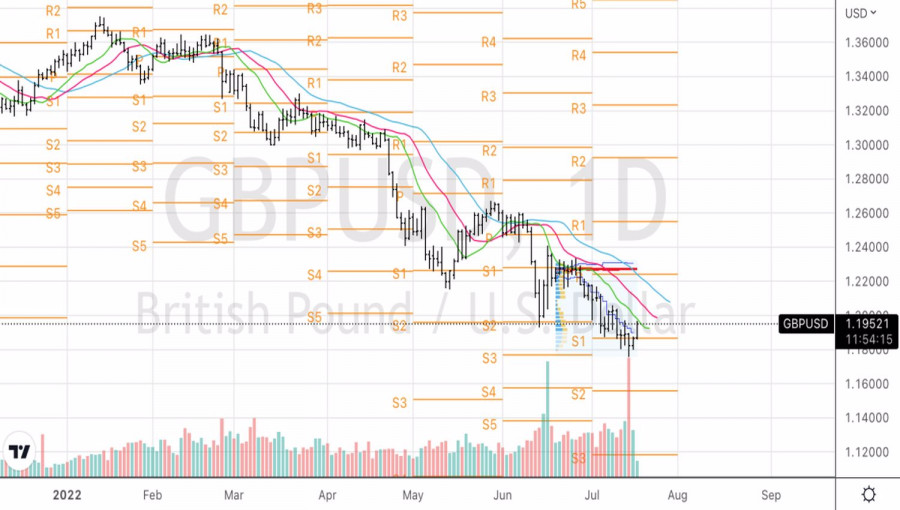
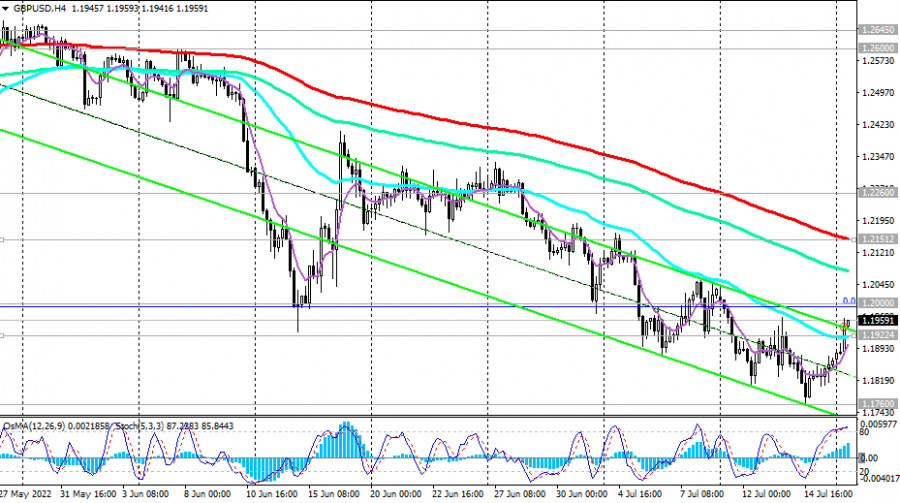
GBP/USD is extending its technical bounce from 1.1758, the lowest level since March 2020. The pair is now trading at 1.1960 with a positive bias. The intraday move higher extended during the early part of the European session which helped the pair to reach a high above 1.1980. The dollar index (USDX), after reaching a high of 109.11, is going through a technical correction, which has contributed to the rise of GBP/USD. Risk appetite led to profit taking around the US dollar. If the correction continues this week, the GBP/USD pair could reach the 200 EMA at 1.2152. According to the 4-hour chart, we can see that the British pound sharply broke the downtrend channel formed on June 23. This is a positive sign but we should expect a confirmation pullback towards the 21 SMA around 1.1864. A technical bounce around the 21 SMA (1.1861) and around the downtrend channel that was broken could revive the bullish move so that the price could reach 2/8 Murray at around 1.2207. The eagle indicator is showing a positive signal, which could favor the recovery of the British pound in the coming days. However, the pair is approaching an overbought zone. Below the 200 EMA, it is likely to resume its downtrend. Our trading plan for the next few hours is to wait for a technical bounce at 1.1865 (21 SMA) to buy, with targets at 1.1962 and 1.20. On the other hand, should it trade above 1/8 Murray (1.1962), it will be a signal to continue buying with targets at 1.20 and 1.2152 (200 EMA). The material has been provided by InstaForex Company - www.instaforex.com |
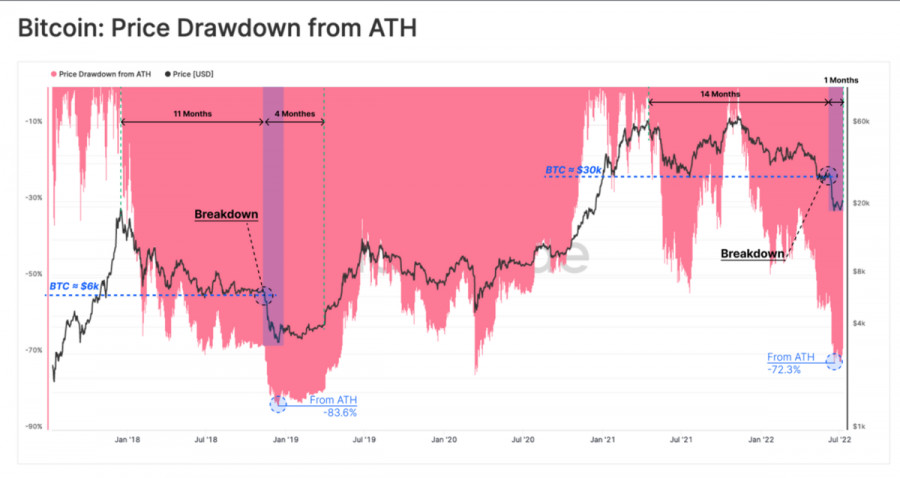
| Bitcoin starts to reap the benefits of macroeconomic crisis: can we expect protracted growth? Posted: 18 Jul 2022 06:13 AM PDT Bitcoin is more confidently implementing bullish impulses every week. For the first time in the bearish trend, the cryptocurrency began to receive significant dividends from the macroeconomic crisis. Rising inflation in the US and the EU combined provoked the need to inject cash into the markets to stabilize the situation with EUR/USD. The energy crisis is gradually fading due to political decisions, allowing investors to hope for a slowdown in interest rate hikes in the future.
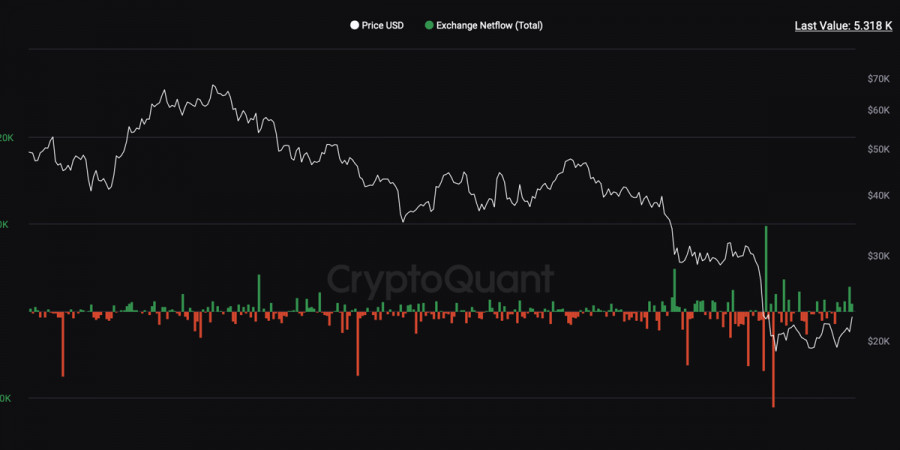
Trading volumes on cryptocurrency exchanges are gradually returning to stable levels, and large investors are starting to join the accumulation trend. At the same time, the daily volumes of coins withdrawn from crypto exchanges reach 2%–3% of the total supply in circulation. Glassnode experts note a gradual decline in BTC coin sales. The market has almost completely cleared itself of speculative investors and large amounts of borrowed funds. It is evident in the current upward trend of Bitcoin, formed without sharp bursts of volatility and multi-million dollar liquidations.
In parallel, the BTC market is in the stage of a healing sale of coins. According to Glassnode, the main categories of investors who sell Bitcoin are long-term investors who bought a digital asset at high values and the remnants of speculative investors. The ultimate goal of this process is the gradual flow of BTC coins into the hands of long-term owners who are not subject to impulsive decisions. Also, all these factors point to the gradual formation of a local bottom, which is relatively painless for the market due to a decrease in short-term investors and a large number of transactions with large leverage.
In addition, we see that Bitcoin has begun to justify its title as a store of value in times of crisis. The situation with EUR has shown that the Fed and the US dollar are not omnipotent, and, in the current conditions, it is impossible to abandon the printing press. In addition, it became known that the US is gradually forming a legislative framework for the transfer of frozen Russian funds to Ukraine. From a reputational point of view, large investors will have big doubts about the possibility of storing capital in the United States, which can also negatively hit the dollar. All these facts open the door for Bitcoin as a relatively independent and secure medium. Despite the open window of opportunity, it is important to understand that it can close at any moment. Bitcoin really experienced the biggest drop and managed to stabilize, and the inflow of investments began to grow. However, the situation with EUR proves that the Fed's quantitative easing policy is working, and BTC and the stock market will be the first to lose liquidity when it resumes.
In addition, there are many rumors on the market about a possible increase in the key rate by 100%, despite the passage of the peak of inflation. It is associated with the negative indicators of the reporting week, showing that the price is growing for absolutely everything. Energy costs rose by 41.6%, the highest since 1980. Gasoline rose in price by 59.9%, and fuel oil by 98.5%. Food prices rose by 10.4%, while real estate prices rose by 5.6%. The Core Consumer Price Index, which excludes food and energy, rose 5.9%, above the 5% forecast.
All these factors negatively affect Bitcoin in the medium term since, most likely, it is in July that the Fed will tighten monetary policy as much as possible. The stock and crypto market will be the first victims of further outflow of liquidity. At the same time, Bitcoin still has the problem of miners. The hashrate of the cryptocurrency has fallen by almost 40% from the maximum, indicating the shutdown of some of the miners' equipment. In addition to reducing the cost of BTC mining, an important role was played here by the rise in energy prices, which puts miners' balances at risk of sell-off.
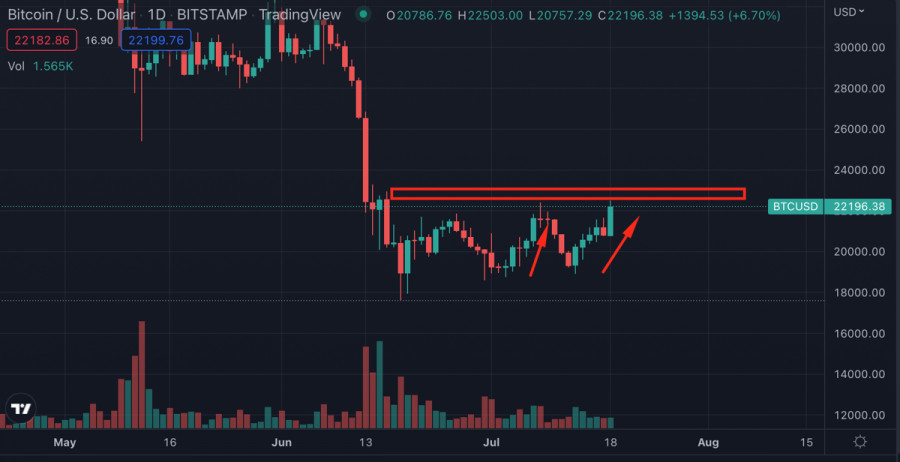
Given the fundamental factors, we should not expect a protracted upward movement of Bitcoin. Most likely, we will have an unsuccessful retest or a false breakout of the $22.3k level, after which the coin will return to consolidation within the $19k–$22.3k range. Despite the influx of liquidity, it will not be possible to realize a strong upward movement, and in the current conditions this will help maintain the current level of volatility and continue the consolidation period for further growth under more favorable conditions. The material has been provided by InstaForex Company - www.instaforex.com |
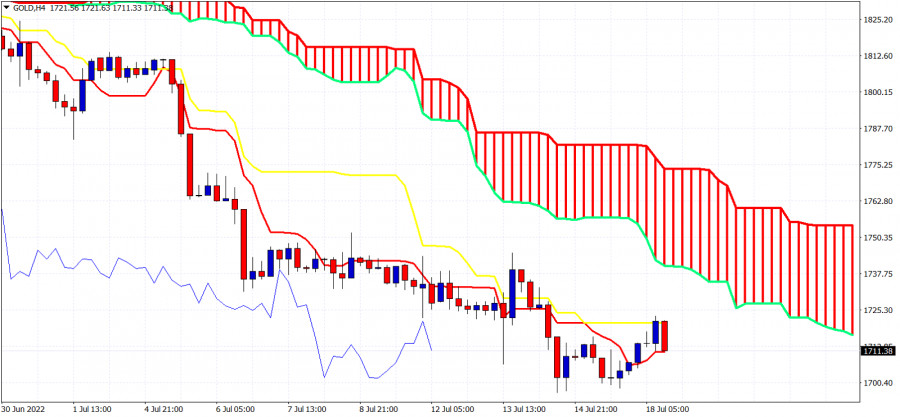
| Ichimoku cloud indicator analysis on Gold for July 18th, 2022. Posted: 18 Jul 2022 06:07 AM PDT
Gold price is trading above $1,710. According to the Ichimoku cloud indicator trend on a 4 hour candlestick basis remains bearish. Price is showing some signs of a reversal but we are at the early stages. Trend in the short-term remains bearish as price remains below the 4 hour Kumo. Price has moved above the tenkan-sen (red line indicator) and is challenging the kijun-sen (yellow line indicator). The resistance by the kijun-sen is at $1,721. A break above this resistance will lead price towards the kumo at $1,740. Only a break above $1,762 will change short-term trend to bullish and give hopes to bulls for a bigger bounce. As we mentioned in previous posts, a bounce towards $1,750-70 is justifies, but I believe it will only be a counter trend bounce in the bigger down trend. The material has been provided by InstaForex Company - www.instaforex.com |
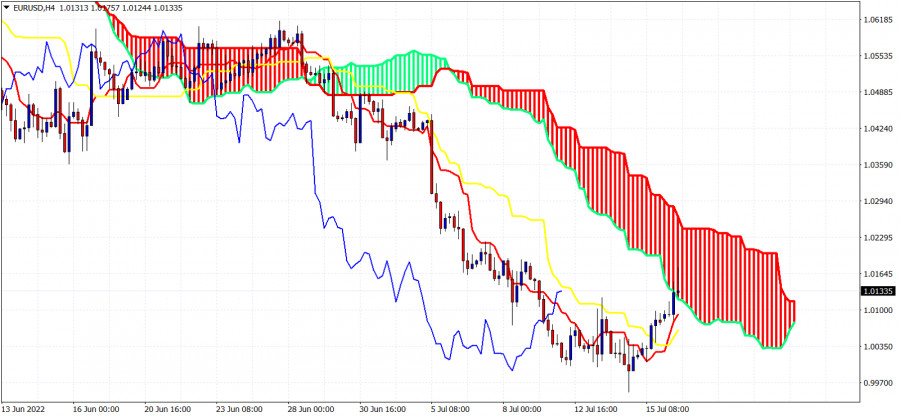
| Ichimoku cloud indicator analysis on EURUSD for July 18th, 2022. Posted: 18 Jul 2022 05:59 AM PDT
In our last analysis on EURUSD we noted that price was breaking out of the short-term bearish channel and there is potential for a move at least towards 1.02. EURUSD is trading now inside the 4 hour Kumo (cloud). This means that the short-term trend has changed from bearish to neutral. The tenkan-sen (Red line indicator) and the kijun-sen (yellow line indicator) are positively sloped and below current market price. Price has potential of moving higher towards the upper cloud boundary at 1.02-1.0244. Support is found at 1.0091 and 1.0050. As long as price is above these two support levels, bulls have hopes for a move towards 1.02 and higher. The material has been provided by InstaForex Company - www.instaforex.com |
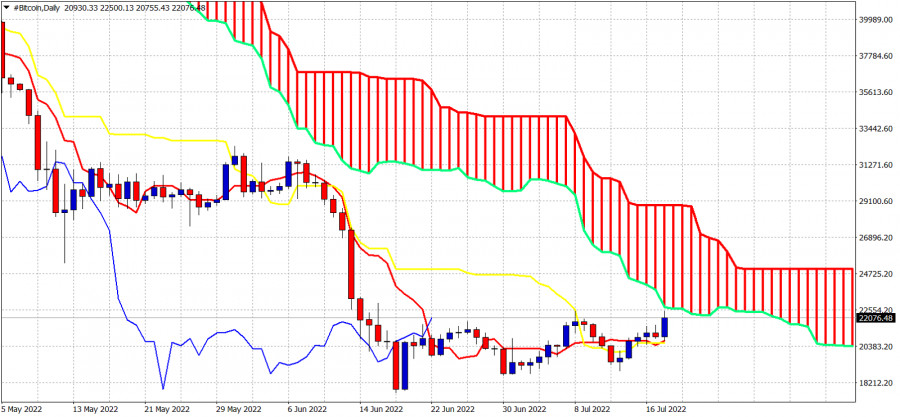
| Bitcoin Ichimoku cloud analysis. Posted: 18 Jul 2022 05:53 AM PDT
Bitcoin is trading above $22,000. Bitcoin is trading above the high levels of the recent few weeks. However using the Ichimoku cloud indicator we see that price is testing key cloud resistance. Price is above the tenkan-sen (red line indicator) and the kijun-sen (yellow line indicator). This is a good sign, supportive of short-term trend. This support is at $20,700. A break below this level would be a bearish sign. Bitcoin is currently challenging the lower cloud boundary in the Daily chart. On a daily basis trend remains bearish as long as price is below the Kumo. A rejection at the cloud resistance would be a bearish sign and could bring price back towards the short-term support of $20,700. The material has been provided by InstaForex Company - www.instaforex.com |
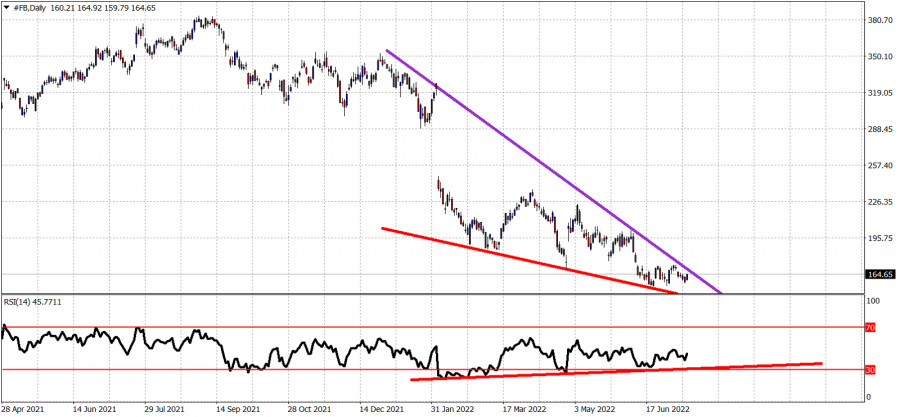
| META stock price could soon reverse to the upside. Posted: 18 Jul 2022 05:48 AM PDT
Red lines - bullish RSI divergence Purple line- resistance trend line META Platforms Inc stock price remains in a bearish trend as price continues trading inside the downward sloping wedge pattern. The RSI is providing bullish divergence signals the last few weeks. Price remains below the purple trend line resistance. This resistance is now at $169. If we see a break above this level, we will get a bullish signal. Our first bullish target would be close to $200-$220. Support is found at $157. A break above $169 should not be followed by a break of $157. This would cancel the bullish scenario. The material has been provided by InstaForex Company - www.instaforex.com |
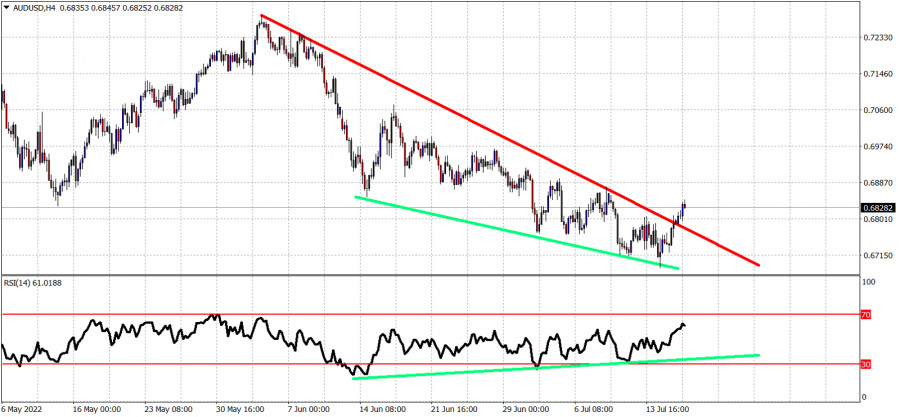
| Posted: 18 Jul 2022 05:42 AM PDT
Red line - resistance Green lines- Bullish RSI divergence AUDUSD is trading at 0.6822 having broken above the downward sloping wedge pattern. Short-term trend is changing to bullish as price is breaking higher. The combination of the bullish RSI divergence and the break above the red downward sloping resistance trend is a bullish signal. Price has potential now to reach 0.70. Support is at 0.6783 and next at 0.67. The material has been provided by InstaForex Company - www.instaforex.com |
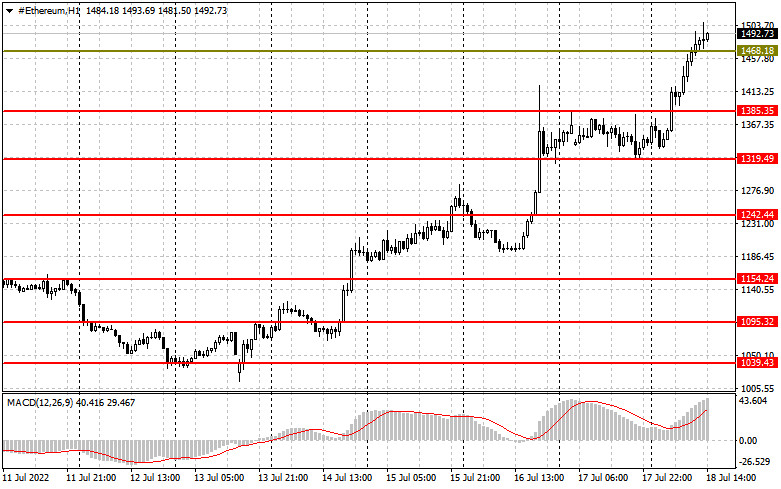
| Long-term investors in Bitcoin keep their cool Posted: 18 Jul 2022 05:39 AM PDT The bitcoin exchange rate is gradually approaching this month's highs. Moreover, ether has completely broken through a rather significant resistance level, bringing several positives to the markets, particularly after such a prolonged bearish rally and a relatively high likelihood of further development. However, we shall discuss the technical picture below. According to the most recent data, long-term bitcoin investors have maintained their holdings despite the recent precipitous decline. Even when speculators fled the market after the first cryptocurrency fell below $ 20,000, long-term investors remained calm. Recent findings from various analytical firms indicate that short-term speculators conducted most of recent BTC sales. Consistent purchases and backing from significant investors indicate confidence that Bitcoin will survive the bear market, which the Federal Reserve System mostly causes.
The fact that long-term investors have experienced the present downward correction is a positive indicator of sentiment, ensuring a balance between supply and demand under speculators' sale conditions. Investors presently hold approximately 77 percent of all bitcoins. Although this number differs significantly from the 80 percent observed in early January, it is greater than the peak of 60 percent observed at the pinnacle of bullish growth at the end of 2017. The results indicate that during the last three and a half years, a major portion of capital moved from speculators and traders to investors. Long-term investors are individuals who hold a cryptocurrency for at least six months. Speculators have a propensity to purchase assets for brief durations and employ tactics to profit from short-term price swings. Recent liquidity issues have revealed flawed risk management practices in the crypto ecosystem. This led to the demise of Terra, the bankruptcy of Three Arrows Capital, which boasted billions of dollars in assets earlier this year, and the emergence of several issues for well-known crypto companies such as Voyager Digital and Celsius Network. Concerns over solvency led to the buildup of realized losses, exposing vulnerabilities in other sectors of the cryptocurrency ecosystem. However, the purpose of bearish cycles is to identify the weak and strengthen the strong. It is still extremely early to speak of the beginning of bitcoin's unparalleled rise, but investors have already received hope for a real bottoming out, which makes the world's first cryptocurrency quite attractive at its current price.
Regarding Bitcoin's technical prospects, the balance of power has shifted slightly. The nearest support of $21,875, which speculators will defend, plays a key role. Only a collapse and consolidation below this range will cause the trading instrument to return to its previous lows: $21,140 and $20,500, followed by $19,880 and $19,320. In the event of a further upward reversal, bears will be seen near the $22,850 next resistance level. Only consolidation above this range will return the trading instrument to between $24,280 and $25,750, making investors feel more at ease. A further-reaching objective will be the $26,780 region. Ether is again in the spotlight, as its price has risen to rather high levels, making it highly desirable. Now, purchasers must consider how to break above $1,540. Only after growth surpasses this threshold can we anticipate changes to the $1,644 maximum. After reaching $1,740, it will be possible to discuss the possibility of a medium-term bull market. A consolidation above $1,830 will return the trading instrument to a state of intense competition. In the event of ETH pressure, bulls will attempt to defend $1,470. At the lower end of this range, it is prudent to anticipate purchases between $1,385 and $1,320. The material has been provided by InstaForex Company - www.instaforex.com |
| Forecast for EUR/USD on July 18. The euro currency is growing ahead of the ECB meeting Posted: 18 Jul 2022 05:39 AM PDT
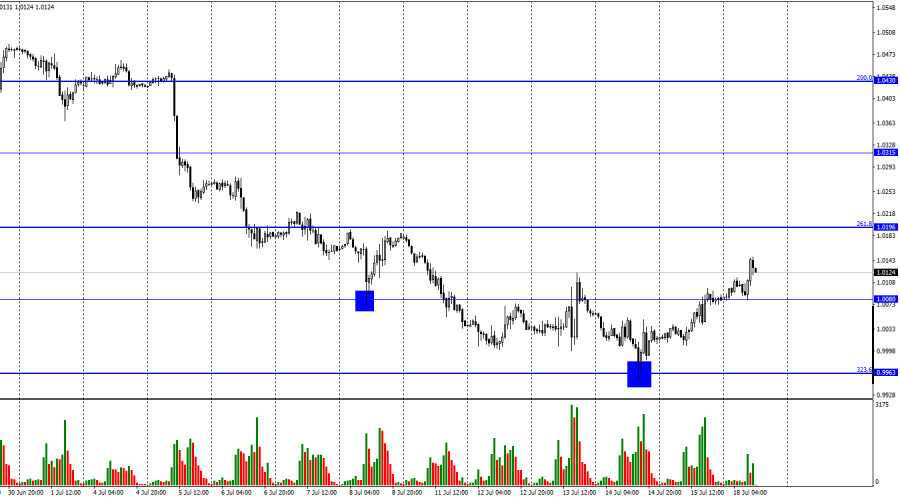
The EUR/USD pair extended its upward trend on Friday after rebounding from the corrective level of 323.6% (0.9963). Today's close was above 1.0080, allowing us to anticipate additional growth in the direction of the next Fibonacci level of 261.8% (1.0196). In recent years, the European currency has not frequently rewarded us with growth. Therefore, it is somewhat odd to watch an upward movement rather than a downward one. I can infer that bullish traders' excitement is related to the ECB meeting scheduled for Thursday of this week. The European regulator will increase the interest rate by 0.25 percent, the first time in a very long time. Christine Lagarde and other ECB board members disclosed this information a few weeks ago. Therefore, traders can purchase the euro based on the expectation of a future rate increase. How long will the euro be able to demonstrate growth if we are just talking about a single boost of 0.25 percent? Next week, the Federal Reserve will have a meeting at which it will decide to raise interest rates by 0.75 percentage points. In addition, this is not the first time that a US regulator has hiked the rate to 1.75 percent. Thus, the disparity between the ECB and the Fed's monetary policies persists and will continue to be significant. Therefore, I do not anticipate a rapid appreciation of the euro. The ECB rate hike should also be considered, but the growth of the US dollar may restart with fresh energy next week. In addition to the ECB meeting, there will also be a report on inflation in the European Union released at the beginning of the week. Traders are already anticipating a fresh hike in the consumer price index. If forecasts are realized, the ECB will have justification to raise interest rates at its September meeting and possibly at all subsequent meetings in 2022. The European regulator is apprehensive about tightening the PEPP for fear of triggering a recession, but, if nothing is done, inflation might approach 10 percent.
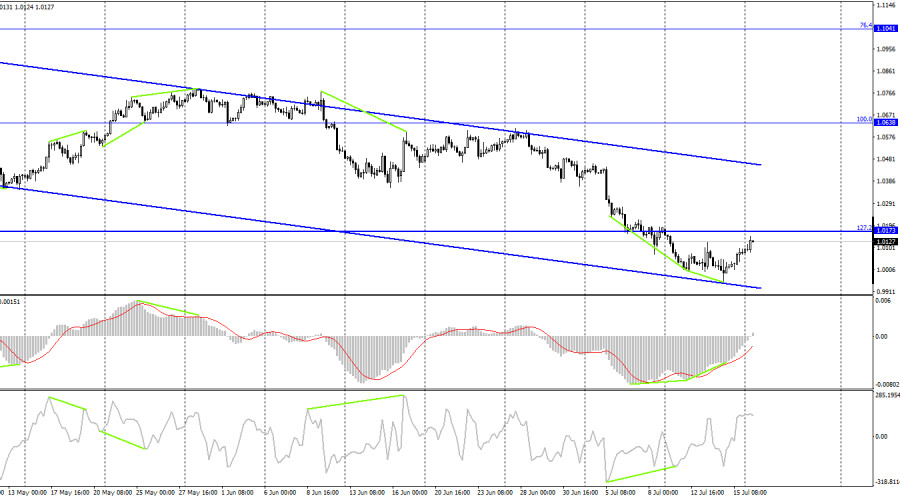
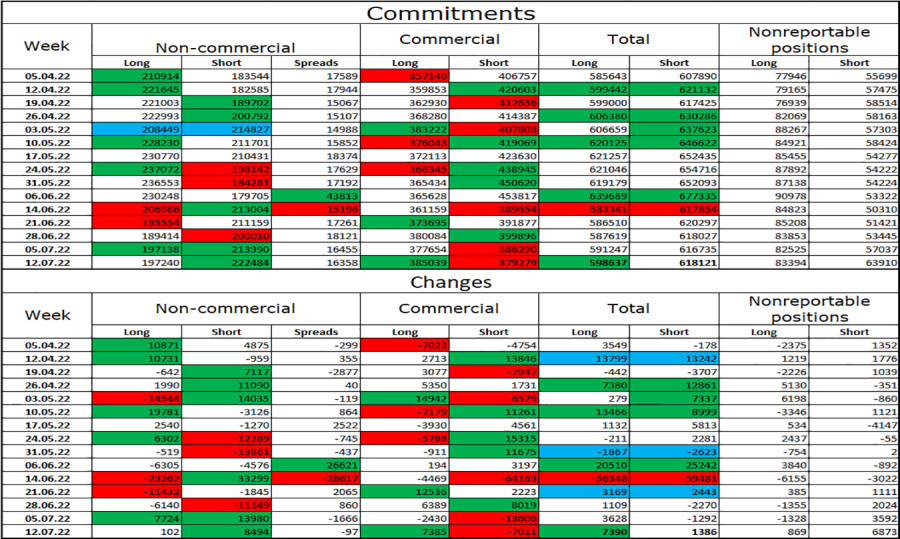
On the 4-hour chart, the pair reversed in favor of the EU currency after a new "bullish" divergence appeared at the MACD indicator. The pair has risen to the corrective level of 127.2% (1.0173), where the growth may halt. The return of quotes from this level will benefit the US dollar and the resumption of the decline in the direction of the corrective level of 161.8% (0.9581). A consolidation over 1.0173 will boost the likelihood of sustained expansion in the direction of the corridor's upper line. Report on Commitments of Traders (COT):
Last reporting week, 102 long contracts and 8,494 short contracts were opened by speculators. This indicates that the "bearish" sentiment of the main players has once again intensified. The total number of long contracts held by speculators is currently 197 thousand, and the number of short contracts is 222 thousand. The disparity between these numbers is not excessively large but does not benefit the bulls. Most "Non-commercial" traders have maintained a "bullish" outlook on the euro in recent months, which has not helped the euro currency. Recent COT figures indicate that new sales of the EU currency may follow, as speculators' sentiment has shifted from "bullish" to "bearish" during the past several weeks. This is the precise evolution of events that we are currently watching. News schedule for the United States and Europe: The economic event calendars of the European Union and the United States on July 18 include no noteworthy entries. Thus, the information background will not affect traders' sentiment today. EUR/USD prediction and trader recommendations: I suggested selling the pair when it reached a closing price of 1.0196, with objectives at 1.0080 and 0.9963. These two levels have been attained. When bouncing back from 1.0173 with the same objectives, sales increase. On a 4-hour chart, I advise buying the euro when the price is above the corridor with a goal of 1.1041. The material has been provided by InstaForex Company - www.instaforex.com |
| Technical analysis recommendations on EUR/USD and GBP/USD for July 18, 2022 Posted: 18 Jul 2022 05:30 AM PDT EUR/USD
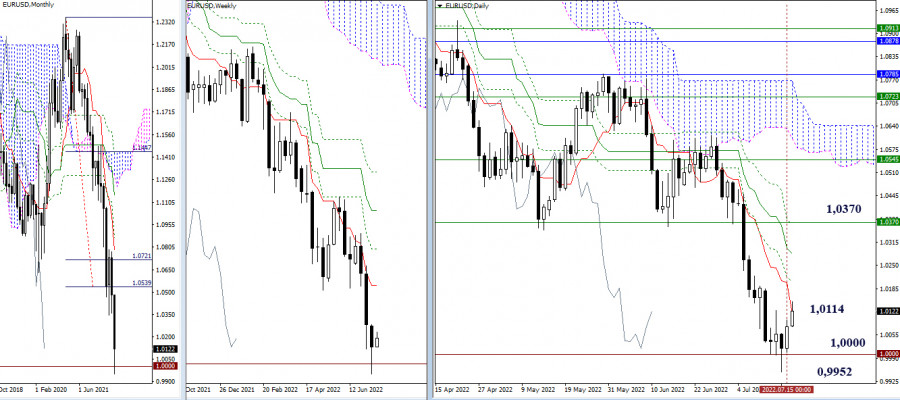
Higher timeframes Today, the pair continued the development of an upward corrective movement. As of this writing, the daily short-term trend (1.0114) is being tested, which today went down to meet the bulls. If this level goes into the category of support, then the main task of the bulls will be the elimination of the daily death cross, its final levels are now located at 1.0284 (Kijun) and 1.0362 (Fibo Kijun), and gaining support for the weekly short-term trend (1.0370). If the daily correction ends in the area of its first target (1.0114), then new prospects for the bears will appear when the psychological level of 1.0000 is broken and the downward trend is restored (0.9952 local low).
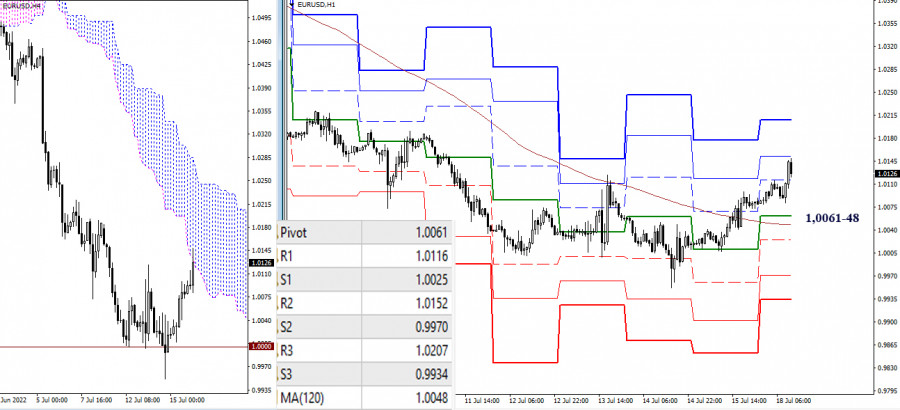
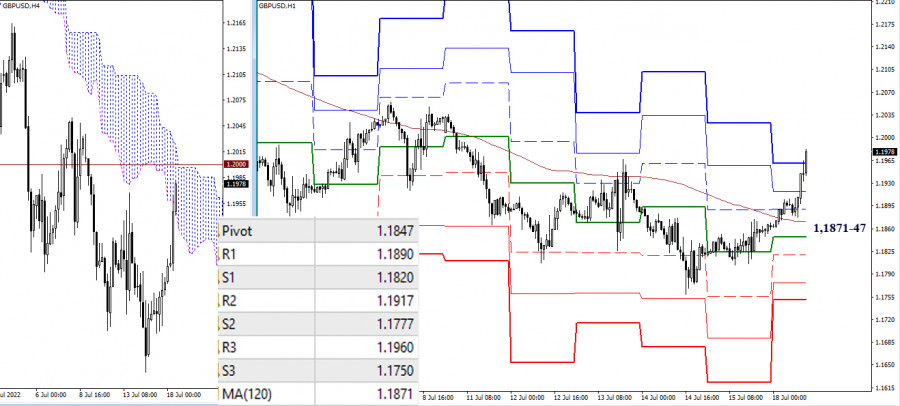
H4 – H1 The bulls continued to rise and now entered the resistance zone R2 (1.0152). Further, the resistance of the classic pivot points, R3 (1.0207), serves as a reference point for the rise within the day. Today's key levels are the supports, combining their efforts around 1.0061–48 (central pivot point of the day + weekly long-term trend). Consolidation below will change the current balance of power of the lower timeframes and may serve as the beginning of the formation of a rebound from the daily short-term trend (1.0114). In this case, the support of classic pivot points will serve as reference points for the decline (1.0025 – 0.9970 – 0.9934). *** GBP/USD
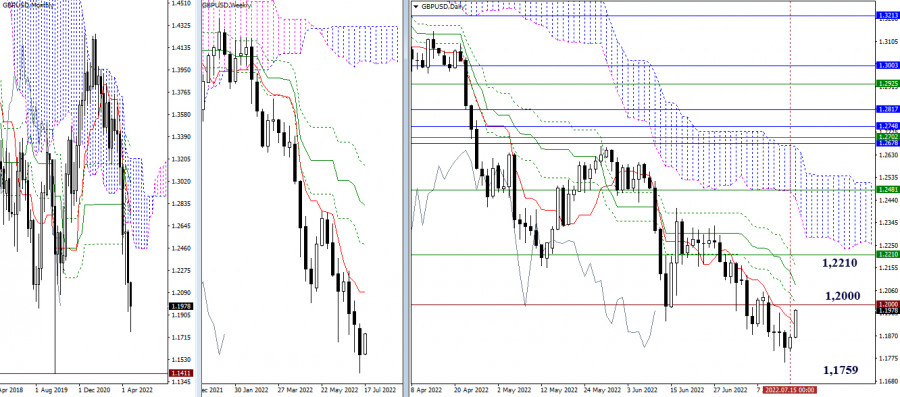
Higher timeframes On the daily timeframe, we are currently seeing the development of a corrective rise. As noted earlier, bulls now need to get hold of the daily short-term trend and the 1.2000 psychological level. The next important stage in the bullish direction will be the elimination of the daily death cross (1.2082 – 1.2158) and the transition to the weekly short-term trend (1.2210). For bears, the recovery and continuation of the downward trend are still of primary importance, the low of which is now at 1.1759.
H4 – H1 The advantage is currently on the side of the bulls. Today, the intraday benchmarks have been passed, so now the target is the boundary of the higher timeframes, namely the level of 1.2000. The breakdown of 1.2000 on the lower timeframes will coincide with the breakdown of the Ichimoku cloud on H4, so the target for the breakout of the H4 cloud will be added to the upward reference points when it is formed. The cancellation of the bullish advantage today may be the return of the pair under the key levels, which are currently at 1.1847 (central pivot point of the day) and 1.1871 (weekly long-term trend), and a secure consolidation below. *** In the technical analysis of the situation, the following are used: higher timeframes – Ichimoku Kinko Hyo (9.26.52) + Fibo Kijun levels H1 - Pivot Points (classic) + Moving Average 120 (weekly long-term trend) The material has been provided by InstaForex Company - www.instaforex.com |
| Daily Video Analysis: AUDUSD, H4 Bearish Reversal Opportunity Posted: 18 Jul 2022 05:27 AM PDT Today we take a look at AUDUSD. Combining advanced technical analysis methods such as Fibonacci confluence, correlation, market structure, oscillators and demand/supply zones, we identify high probability trading setups. The material has been provided by InstaForex Company - www.instaforex.com |


| You are subscribed to email updates from Forex analysis review. To stop receiving these emails, you may unsubscribe now. | Email delivery powered by Google |
| Google, 1600 Amphitheatre Parkway, Mountain View, CA 94043, United States | |


Comments