Forex analysis review
Forex analysis review |
- Gold rallies on higher US inflation and after BOC rate hike
- EUR/GBP: British economy showed growth despite pessimistic forecasts
- EUR/USD: fresh range post US CPI and BOC
- USD/CAD Technical Analysis and Trading Tips for July 13, 2022
- Trading Signal for GBP/USD for July 12 - 13, 2022: buy in case of rebound off 1.1850 (weekly support)
- Dollar and American bonds: which is more profitable?
- XAUUSD dynamics indicate the growth of deflationary forces
- GBP/USD analysis on July 13. In the British economy, not everything is as bad as it seems
- EUR/USD analysis on July 13. We are focusing on the US inflation report
- Asian markets advance slightly on Wednesday
- Bitcoin and Ether have one last chance left
- Forecast for EUR/USD on July 13. European statistics do not support the euro currency
- Forecast for GBP/USD on July 13. UK GDP grew stronger than expected
- American premarket on July 13: Twitter sues Elon Musk, and traders are waiting for data on inflation in the United States
- Technical analysis recommendations on EUR/USD and GBP/USD for July 13, 2022
- AUD/USD Update for July 13, 2022 - Potetnial for the bigger rally
- Trading plan for Gold on July 13, 2022
- BTC update for July 13,.2022 - Breakout of the downside channel
- The IMF's negative outlook on the US economy will only strengthen dollar purchases
- Analysis of Gold for July 13,.2022 - Potential for breakout of the downside channel
- Copper is down 30% from its March record
- Silver under sellers' pressure
- GBP/USD trading plan for North American session on July 13, 2022. Analysis of morning trades. GBP fails to break above 1.1925
- Technical and fundamental factors suggest Bitcoin may collapse again: will local bottom be updated?
- EUR/USD: trading plan for American session on July 13 (overview of morning trades). EUR drops lower ahead of CPI data
| Gold rallies on higher US inflation and after BOC rate hike Posted: 13 Jul 2022 08:19 AM PDT Gold edged higher and it was trading at 1,743 at the time of writing far above 1,707 today's low. The yellow metal rallied as the Dollar Index dropped after reaching the 108.56 static resistance level. As you already know from my analyses, we have a negative correlation between XAU/USD and DXY. Today, the fundamentals took the lead. The RBNZ increased the Official Cash Rate from 2.00% to 2.50% as expected. As you already know, Gold is used as a hedge against inflation. The US CPI rose by 1.3% more versus 1.1% expected, while the Core CPI registered a 0.7% growth compared to 0.5% estimates. Also, the BOC increased the Overnight Rate more than expected, from 1.50% to 2.50% above 2.25% expected. The BOC decision and higher US inflation pushed the yellow metal higher. XAU/USD Upside Reversal?
As you can see on the H1 chart, XAU/USD found support on the channel's downside line. It has registered only a false breakdown below the downside line and through the weekly S1 (1,710) signaling that the sell-off could be over. Now, it has managed to jump above the 1,732 static resistance and above the downtrend line. Stabilizing above these levels and validating its breakout from the down channel pattern could signal further growth. XAU/USD Outlook!The current breakout above the downtrend line signals strong buyers and a potential larger rebound. Coming back to test and retest the broken channel's resistance could bring long opportunities. The 1,747 and 1,752 are seen as upside targets. After its strong rally, we cannot exclude a temporary retreat. A larger upwards movement could be activated by a new higher high. Jumping, closing, and stabilizing above 1,752 could activate further growth and could bring new buying opportunities as well. The material has been provided by InstaForex Company - www.instaforex.com |
| EUR/GBP: British economy showed growth despite pessimistic forecasts Posted: 13 Jul 2022 08:12 AM PDT The EUR/GBP cross-pair tested a two-month low today, falling to the base of the 84th figure. And although buyers then regained intraday losses, the downward trend is still in force. The euro failed to reverse the pair: the price has been actively and consistently declining throughout the week. We cant say that the pound is in better shape now, but compared to the euro, it is in an advantageous position.
Today's downward momentum is due to the release of data on the growth of the UK economy. All components of the report unexpectedly came out in the "green zone," contrary to the pessimistic forecasts of most experts. Recall that previous releases on the country's GDP growth reflected negative trends, putting significant pressure on the pound. Market participants were quite justifiably worried that the Bank of England would slow down the pace of monetary policy tightening or even put this process on pause if the situation continued to worsen. Therefore, today's report partially leveled such experiences. After the April recession, the UK economy has moved to growth. The gross domestic product grew by 0.5% in May after a 0.2% decline in April. At the same time, most analysts predicted a decrease in this indicator in the negative area, to the level of -0.2%. In quarterly terms, growth was also recorded to 0.4%, while experts expected to see this component at zero in May. On an annualized basis, the volume of GDP increased by 3.5% (forecast – 2.7%). The results exceeded the expectations of most experts, but, on the other hand, such dynamics is largely due to temporary factors. The structure of the release suggests that two factors primarily contributed to the growth of the British economy: increased demand for travel agency services due to the holiday season and increased demand for medical services. And if everything is clear with the holiday season, then the excitement around the medical sphere can be associated with the coronavirus. An increase in infections was observed in the UK since April, while more than 250,000 new cases were recorded in May. And yet, despite some contradictory nuances of today's release, the report itself supported the British pound. The renewed growth of the UK economy will allow the Bank of England to focus on combating high inflation. Whereas earlier, there were often suggestions that the regulator would pause the process of tightening monetary policy, fearing a further decline in the country's economy. Moreover, one of the Committee members, Jon Cunliffe, openly called for a break: back in spring, he voted against raising the interest rate. Today the situation has changed. Representatives of the English regulator voice mainly hawkish rhetoric, focusing their attention on the problems of high inflation. Bank of England Chief Economist Huw Pill, in particular, said at the end of last week that he was ready to support "a faster pace of policy tightening, if necessary." Another representative of the British Central Bank, Catherine Mann, also made a hawkish statement. Mann said the uncertainty regarding the inflationary process "strengthens the arguments in favor of an early increase in interest rates."
Recall that at the last meeting, three members of the Bank of England, Michael Saunders, Catherine Mann, and Jonathan Haskel, voted "in favor" of raising the rate by 50 basis points. But they remained in the minority, as the other six of their Committee colleagues insisted on a 25-point increase. It is likely that after today's release, the balance of power will change in favor of the representatives of the hawk wing. Meanwhile, the European Central Bank still doubts the advisability of a 50-point rate hike at the September meeting. At the July meeting, the central bank will increase the rate by 25 points—this is already a question, one might say, resolved—while further prospects are the subject of discussion. The worsening energy crisis is forcing ECB members to consider recession risks when discussing the pace of monetary tightening. In this regard, the Bank of England is more flexible than the European Central Bank. Given the prevailing fundamental background for the EUR/GBP, it is not surprising that the cross has dipped by more than 250 points over the past week. And today, the downward trend is still in force, so corrective upward pullbacks can be used to open short positions. From a technical point of view, the EUR/GBP pair tested the support level of 0.8420 today, which is the lower line of the Bollinger Bands indicator on the daily chart. It is advisable to enter sales only after fixing below this target. In this case, the price will be under all the Bollinger Bands lines, as well as under all the lines of the Ichimoku indicator (including the Kumo clouds), which will form a bearish Parade of Lines signal. The main target of the downward movement will be the level of 0.8300, which is the bottom line of the Bollinger Bands on the monthly chart. The material has been provided by InstaForex Company - www.instaforex.com |
| EUR/USD: fresh range post US CPI and BOC Posted: 13 Jul 2022 07:54 AM PDT The EUR/USD pair rallied in the last hour after reaching strong downside obsatcles. The Dollar Index dropped after registering only a false breakout with great separation above the 108.56 former high. DXY's sell-off forces the greenback to depreciate versus the other currencies. You knew from my previous analyses that the currency pair could register sharp movements today and that the fundamentals could move the price. The EUR/USD pair increased as much as 1.0099 today before the US inflation publication where it has found resistance. The Euro received a helping hand from the Euro-zone Industrial Production rose by 0.8% beating the 0.2% growth expected. As you already know, the US CPI rose by 1.3% in June versus 1.1.% growth expected and after a 1.0% growth in May, while the Core CPI surged by 0.7% versus 0.5% estimated. The currency pair crashed right after the inflation data publication and it reached 0.9997 registering a new lower low. Still, the rate failed to stay after the BOC decided to increase the Overnight Rate by 1.00% versus a 75bps forecast. EUR/USD Rebounded!
EUR/USD found support again above the 1.0000 psychological level and now it tries to rebound and recover. The bias remains bearish as long as it stays under the lower median line (lml) and below the 1.0071 static resistance. Escaping from the current range could bring new trading opportunities. Technically, the weekly S1 (1.0020) stands as a strong downside obstacle. EUR/USD Outlook!A new lower low, a valid breakdown below 1.0000 could activate more declines and could bring new selling opportunities with a potential downside target at the warning line (wl1). A new higher high, a valid breakout above 1.0071 could activate a larger rebound and could help the buyers to go long with a potential upside target at 1.0161. The material has been provided by InstaForex Company - www.instaforex.com |
| USD/CAD Technical Analysis and Trading Tips for July 13, 2022 Posted: 13 Jul 2022 07:14 AM PDT
Today at 12:30, 14:00, and 15:00 (GMT), a significant increase in volatility in USD, CAD quotes, and, accordingly, in the USD/CAD pair is expected.
USD/CAD maintains positive dynamics, remaining in the bull market zone, above key support levels 1.2550 (200 EMA on the monthly chart), 1.2740 (200 EMA on the daily chart), 1.2855 (200 EMA on the weekly chart, EMA50 on the daily chart).
A breakdown of the local resistance level 1.3070 will confirm the bullish market sentiment and send the pair towards the resistance level 1.3450 (23.6% Fibonacci retracement level of the downward correction in the USD/CAD growth wave from 0.9700 to 1.4600) with the prospect of further growth.
In an alternative scenario, USD/CAD will break through the support level 1.2980 (200 EMA on the 1-hour chart) and fall to the support level 1.2855. The breakdown of this level will be the first signal that USD/CAD will return to the zone of a long-term bear market.
The breakdown of support levels 1.2550 (200 EMA on the monthly chart), 1.2520 (local support level) will increase the risks of a further decline in USD/CAD and a resumption of the global downward trend. Support levels: 1.29 80 , 1.29 60 , 1.28 93 , 1.28 55 , 1.2740, 1.27 00 , 1.2550, 1.2520 Resistance levels: 1.3070, 1.3100 Trading Tips Sell Stop 1.2970. Stop-Loss 1.3050. Take-Profit 1.2900, 1.2893, 1.2855, 1.2740, 1.2700, 1.2550, 1.2520 Buy Stop 1.3050. Stop-Loss 1.2970. Take-Profit 1.3100, 1.3200, 1.3300 The material has been provided by InstaForex Company - www.instaforex.com |
| Posted: 13 Jul 2022 06:44 AM PDT
GBP/USD is bouncing and extending its recovery from the two-year low reached on July 12 at 1.1806. Now the pound could face a strong resistance zone. If it fails to overcome it, the pound is likely to resume the downtrend. Early in the American session, the British pound is trading at around the 21 SMA at 1.1927. The pound has strong resistance above this area as the downtrend channel formed from June 27 and 1/8 Murray converge. GBP/USD made a good rebound after reaching the 1.1806 area. The pair is now showing signs of a further technical bounce. However, the trading instrument is facing a strong resistance zone. After breaking above 1.1926, the pound could face the top of the downtrend channel and 1/8 Murray at around 1.1962. A daily close and consolidation above 1.1962 for the pound could start a bullish sequence and the currency pair could reach the 200 EMA at around 1.2209. This zone is a strong resistance. Once it is reached, a technical correction could occur. The eagle indicator is giving a positive signal. Thus, the odds are that the pound sterling may continue the upward movement in the coming days. The market sentiment report shows that there are 76.09% of traders who are buying a pound and 23.91% who are selling. This is a sign that a technical bounce could be seen in the coming days, but any attempt to rally higher will be an opportunity to sell. Our trading plan for the next few hours is to buy the pound should it consolidate above 1.1926. On the other hand, given that some fundamental news will occur in the next few hours, it is better to wait for a rebound at around 1.1950 in order to buy the pound with targets at 1.1962 and 1.2207. The material has been provided by InstaForex Company - www.instaforex.com |
| Dollar and American bonds: which is more profitable? Posted: 13 Jul 2022 06:31 AM PDT As of this writing, most of the major dollar currency pairs are trading in a narrow range, remaining under pressure from the US dollar. The dollar continues to dominate the market, receiving support from the Fed, which is pursuing the most stringent monetary policy (at the moment) in comparison with other major world central banks. The dollar is also in strong demand as a defensive asset in the face of geopolitical and economic uncertainty, as well as against the backdrop of a growing divergence of curves reflecting the yield of major US and most other (other economically developed countries) government bonds. If yield grows, then the dollar will continue to strengthen. The increase in the yield of US bonds is promoted, in turn, by the Fed's monetary policy, which tends to tighten further. In this situation, American strategic investors prefer the rising dollar to US government bonds, which currently yield 2.961% per annum (10-year bonds). But foreign investors choosing between US government bonds and government bonds of national economies choose American ones as more profitable (see comparative screen).
The purchase of US government bonds (and other assets of the US stock market) is made in dollars, and the purchase of a dollar for the national currencies of other countries contributes to the natural strengthening of the dollar against them. The yield of bonds, as is known, increases with the growth of the volume of their sales. In other words, the more actively government bonds are sold, the more profitable they become for new investors. At the same time, investments in government bonds have two main dangers that reduce income—rising inflation and the central bank interest rate. And this is the situation in the US right now: the Fed's interest rate is rising, but inflation is not in a hurry to decline, remaining at the levels of 40 years ago (in March, the base annual inflation in the US, excluding food and energy prices, was 6.5%).
As early as last week, Fed Board member Christopher Waller announced the need for another interest rate hike of 75 percentage points this month and 50 percentage points in September, after which the pace of interest rate hikes could be reduced to 25 percentage points. In his opinion, inflation is a tax on economic activity, and the higher it is, the more it suppresses it. The Federal Reserve sees the interest rate in the US at 3.5% by the end of the year (now it is 1.75%). The interest rate will increase by the end of the year at least 2 times, and the higher it is, the more expensive the dollar will be and the more profitable long-term investments will be. St. Louis Federal Reserve President James Bullard also backed a more aggressive Fed monetary tightening last week, noting the desirability of a key interest rate level of 3.5% this year. If you look at the chart of the dollar index (DXY), you can see that since March 2011, it has been in a stable long-term upward trend, and on Tuesday, it updated another multi-year local high at 108.42. Its breakdown will be a signal to increase long positions in DXY futures with the prospect of growth towards multi-year highs of 121.29 and 129.05, reached, respectively, in June 2001 and November 1985.
On the daily, weekly, and monthly DXY charts (in the MT4 trading terminal it is reflected as CFD #USDX), technical indicators OsMA and Stochastic are on the side of buyers. On the monthly CFD #USDX chart, Stochastic has been in the "overbought" zone since August last year, not wanting to get out of there, indicating a strong "bullish" momentum. Thus, from a technical point of view, everything also speaks so far in favor of long positions on the dollar and its index. The material has been provided by InstaForex Company - www.instaforex.com |
| XAUUSD dynamics indicate the growth of deflationary forces Posted: 13 Jul 2022 06:01 AM PDT The market has long been dominated by the opinion that the acceleration of inflation is a strong argument for buying gold, which can protect your money better than deposits or bonds. However, ahead of US consumer price data for June, XAUUSD quotes fell to a 9-month low. At the same time, Bloomberg experts expect CPI to accelerate to 8.8%. Paradox? It is quite possible that the majority is mistaken, and the precious metal can predict the dynamics of inflation and not vice versa. ARK Invest argues that the Fed is making a big mistake by tightening monetary policy as deflationary forces begin to show. The first of them is the US dollar trading in the area of 20-year peaks. Falling Treasury bond yields and oil prices indicate that a recession is approaching—a weakening demand. It is also a deflationary force. Finally, the 12% drop in gold over the past three months is another argument that consumer prices will start to slow down soon. The Fed is simply obliged to realize its mistake and pause in the process of monetary restriction. Historically, the Fed's tightening monetary policy creates an unfavorable background for the precious metal. In such conditions, as a rule, the US currency strengthens. Since gold is traded in US dollars, the growth of the USD index is a clear negative for XAUUSD. Dynamics of gold and US dollar
Since the beginning of the year, the US dollar has strengthened by 12%, and half of its growth occurred last month. Unsurprisingly, the entire commodities sector is suffering. And precious metals are no exception. At the same time, according to Commerzbank, the growth of gold prices is not only hindered by the US dollar, but also by the continuing steady outflow from gold-oriented ETFs. Specialized exchange-traded funds have suffered losses for four consecutive weeks. Moreover, according to the results of the five-day period by July 8, an outflow of 29 tons was recorded, the largest in almost two months. According to the World Gold Council, investors withdrew $1.7 billion from the ETF in June after $3.1 billion in May. Withdrawals, coupled with falling prices, led to a reduction in stocks of specialized exchange-traded funds by 7%, to $221.7 billion at the end of the second quarter. It has moved away from the $240 billion March peak but is still 5.9% higher than at the beginning of the year.
Based on Quant Insight's model, which takes into account factors such as economic growth, inflation, financial conditions, real returns, credit spreads and risk appetite, the fair value of gold is $1791 per ounce. At the same time, the company notes that the indicators continue to deteriorate, which signals the short-term weakness of XAUUSD. Technically, on the daily chart, after working out the Broadening wedge pattern, which allowed us to form shorts at attractive levels, gold is moving steadily towards the target by 200% according to the AB=CD harmonic trading model. It corresponds to $1700 per ounce. The recommendation is to sell. The material has been provided by InstaForex Company - www.instaforex.com |
| GBP/USD analysis on July 13. In the British economy, not everything is as bad as it seems Posted: 13 Jul 2022 05:53 AM PDT
The wave marking on the Pound/Dollar instrument required clarifications, which were made. The upward wave that was constructed between May 13 and May 27 does not currently fit into the overall wave picture, but it can still be considered corrective as a segment of the downward trend. Thus, we can now definitively state that the construction of the upward correction section of the trend has been canceled, and the downward section of the trend will assume a longer and more complex shape. I'm not a big fan of continually complicating the wave marking when we're dealing with a strongly elongating trend zone. I believe it would be considerably more efficient to identify rare corrective waves, after which new impulse structures could be constructed. Currently, there are waves 1 and 2, so we can assume the instrument is in the process of constructing wave 3. If this is the case, the decline may continue with targets near the 161.8% Fibonacci level. The market has demonstrated that it is now more important for it to adhere to the trend than to mark waves. Away from politics, focus solely on the economy. During the month of July, the Pound/Dollar exchange rate increased by 30 basis points. Today, the amplitude of the instrument's movements was low, and the Briton is making hesitant attempts to generate a 3-wave internal corrective wave. I do not yet believe that wave 3 is complete, as the final segment of the downward trend will assume a non-pulse form, further confounding the wave structure. Even a failed attempt to surpass the 161.8 percent Fibonacci level should not result in the completion of wave 3 construction. However, market conditions are not always as desirable as we would like. This morning, reports on industrial production and GDP were released in the United Kingdom, and we can say without any false modesty that they were extremely positive. In particular, the GDP increased by 0.5% in May, while industrial production increased by 0.9%. Lesser expectations were held by the market. Despite these data, demand for the British did not increase, leading me to conclude that the market is awaiting an inflation report for the United States. This report is at the forefront of the entire trading week, and a great deal depends on it. What are the British prospects for the near future? From my perspective, neither remains very modest, as the news background for this currency remains very weak. In spite of this, the wave pattern suggests that the downward segment of the trend could end in the near future. In recent weeks, the decline of the European currency has been much more pronounced, and its downward trend section can be described as impulsive. And the trend area for the British does not yet closely resemble the impulse area. If the demand for US currency increases today following the release of the inflation report, this will put a significant amount in its place. Wave 3 will prove to be more convincing, and with it, the entire section of the trend moving downward. General conclusions The increased complexity of the wave pattern of the pound/dollar pair now suggests a further decline. For each "down" MACD signal, I recommend selling the instrument with targets near the estimated mark of 1.1708, which corresponds to 161.8 percent Fibonacci. An unsuccessful attempt to surpass 1.708 may result in a departure of quotes from the reached lows, but it is unlikely to produce a corrective wave 4, as the final descending segment of the trend will assume a non-standard shape in this case.
At the higher wave scale, the image resembles the Euro/Dollar instrument very closely. The same ascending wave that does not conform to the current wave pattern, followed by the same three descending waves. Thus, one thing is unmistakable: the downward segment of the trend continues to develop and can reach almost any length. The material has been provided by InstaForex Company - www.instaforex.com |
| EUR/USD analysis on July 13. We are focusing on the US inflation report Posted: 13 Jul 2022 05:53 AM PDT
The wave marking on the 4-hour chart for the euro/dollar instrument became more complicated following last week's decline of nearly 300 basis points. Thus, the Fibonacci level of 261.8%, which was also the low of waves E and b, was successfully breached. It is now evident that these waves are not E and b, but market sentiment is of greater significance. A week ago, we had an excellent, promising wave structure consisting of a standard five-wave descent. Instead of constructing at least three upward correction waves, the market preferred to resume selling the instrument, indicating that wave analysis is currently of secondary importance. Now that we have one red-lined correction wave, the instrument can construct a new five-wave descending series. I recommend paying close attention to the lowest wave order now, as wave marking appears to be very challenging on a larger scale. If the current wave identification is accurate, then the decline in quotes will resume after the completion of wave 4 construction. Or wave 3 will assume a form that is even more extensive. Near the price parity of the euro and the dollar, the market froze up. On Wednesday, the euro/dollar pair increased by 20 basis points. Yesterday and today, however, the movement's amplitude is minimal. This leads me to the conclusion that the market is waiting, and it is abundantly clear for what. In one hour, the United States will release a report on inflation, upon which a great deal depends. Even though the instrument has already fallen below the 1.0000 level, the construction of the downward trend section is not yet complete. Permit me to remind you that the current wave marking requires the creation of at least one additional descending wave. And if today's inflation report impresses the market, we can anticipate another euro currency decline. I am more likely to believe that the construction of wave 4 will commence today. It is difficult to determine what the inflation rate should be for the dollar's demand to decrease slightly. Not always does the market react appropriately to reports and news. Therefore, I recommend not speculating on what will occur in a few hours but rather waiting for the report. In addition to being significant in the present, American inflation will also be significant in the future. Inflation will ultimately determine the Fed's decision at the end of the month when the next meeting is scheduled to occur. If inflation continues to rise, as the majority of analysts currently anticipate, the regulator will be able to raise the rate by 75 basis points at once. In the event of a further increase in inflation, this option will become practically the only viable alternative. The new monetary policy tightening will allow the market to continue to increase demand for the US dollar. General conclusions Based on the analysis, I conclude that construction of the downward trend section has resumed and is ongoing. If this is the case, then it is now possible to sell the instrument with targets near the estimated 0.9988 level, which corresponds to 323.6 percent Fibonacci, for each "down" MACD signal, based on the formation of waves 3 or 5. A successful attempt to break through the 323.6 percent level will signal to maintain open sales positions with targets near 0.9395, which corresponds to a Fibonacci extension of 423.6 percent.
At the larger wave scale, the wave marking of the descending trend segment becomes noticeably more complex and extends in length. It can assume almost any length, so I believe it is best to isolate and focus on three- and five-wave standard wave structures at this time. The material has been provided by InstaForex Company - www.instaforex.com |
| Asian markets advance slightly on Wednesday Posted: 13 Jul 2022 05:41 AM PDT
Asian stock indexes increased slightly on Wednesday. The S&P/ASX 200 edged up by 0.05%, while the Shenzhen Composite rose by 0.95%. The Shanghai Composite and the Nikkei 225 gained 0.36% and 0.41% respectively. The Hang Seng Index advanced by 0.71%, while the KOSPI increased by 0.73%. Indexes in the Asia-Pacific region entered a slight correction following an earlier slump triggered by fears of a new wave of COVID-19 in the region. China has re-imposed quarantine measures, while South Korea reports an increase in coronavirus infections. New lockdowns could weigh down on Asia-Pacific economic growth. Traders also noted policy decisions by the main central banks, which are striving to bring soaring inflation under control. The Bank of Korea has increased the interest rate by 50 basis points to 2.25% from 1.75%, matching market expectations. Economists see the South Korean regulator hike the rate further in the near future. South Korean stocks increased slightly, with LG Electronics, Inc. and Samsung Electronics, Co. gaining 0.7% and 0.5% respectively. On the S&P/ASX 200, the best performing stock was Megaport, Ltd, which jumped by 6.5%. St. Barbara, Ltd. rose by 4.7%, while Pointsbet Holdings, Ltd. increased by 5%. Investors also awaited the release of US CPI data. Inflation in the US was projected to increase to 8.8% in June, up from 8.6% in May. Rising inflation would boost expectations of further monetary tightening by the Fed. However, it can also indicate that inflation has peaked amid falling crude oil prices. Market players are wary of higher interest rates weighing down on the global economy. According to the latest statistic data, China's exports increased by 13.2% year-on-year over the past 6 months. Imports rose by 4.8%. On the Hang Seng Index, Haidilao International Holding, Ltd. increased by 6%, while JD.com, Inc. and Sands China, Ltd. rose by 4.6% and 3.8% respectively. Shares of Tianqi Lithium, Corp. dived by 10% in their market debut. On the Nikkei 225, the best-performing stock was Toho, Co., which climbed by 6.1%. The movie theater company's net revenue surged by 72% in the first quarter thanks to a rise in theater visitors. Tokyo Electric Power Co Holdings Inc. increased by 5.6%, Recruit Holdings Co., Ltd. gained 2.9%, Honda Motor Co., Ltd. rose by 2.6%, and SoftBank Group, Corp. advanced by 2.4%. The material has been provided by InstaForex Company - www.instaforex.com |
| Bitcoin and Ether have one last chance left Posted: 13 Jul 2022 05:35 AM PDT Bitcoin and ether have one final opportunity to continue the bullish correction and establish a new lower channel boundary. Before delving into the technical picture, however, I'd like to discuss the forthcoming statements of politicians on the cryptocurrency market; after all, they dictate the rules to lawmakers. John Cunliffe, Deputy Governor for Financial Stability at the Bank of England, stated that "legislatures should continue to work on regulating crypto technologies before they permeate many sectors of the economy."
Speaking at the residence of the British High Commissioner in Singapore, Cunliffe discussed the recent crypto winter, a period characterized by a precipitous decline in cryptocurrency prices. According to him, finance entails inherent risks, and while technology can alter the management and distribution of these risks, it cannot eliminate them. "Financial assets devoid of intrinsic value are worth precisely what the next buyer is willing to pay. Consequently, they are inherently highly volatile and volatile, as well as highly sentiment-sensitive and prone to collapse, "Cunliffe said. Recently, bitcoin's market capitalization has dropped below $ 1 trillion, compared to its November peak of $ 3 trillion. Now, the indicator has returned close to the 1 trillion mark. Cunliffe believes that cryptocurrencies will pose a "systemic risk" under the current conditions. In addition, he remarked that the distinctions between the world of cryptocurrencies and the conventional financial system are gradually eroding. "The question for regulators is not what will happen to the value of crypto assets, but rather what must be done to ensure that promising innovations do not introduce systemic risks." Cunliffe believes that the cryptography regulatory framework should be expanded as thoroughly as possible. The manager stated, "If a stablecoin is used as a settlement asset in transactions, it should be as secure as other forms of money." Stablecoins are a type of cryptocurrency designed to track a real asset, typically a national currency such as the euro or the dollar. Numerous stablecoins are pegged 1:1 to a fiat currency. Some are backed by tangible assets, such as bonds or currency. However, the recent collapse of terraUSD, a so-called "algorithmic" stablecoin pegged to the US dollar, jolted the cryptocurrency markets and compelled many politicians to discuss cryptocurrencies. Andrew Bailey, the governor of the Bank of England, recently made similar remarks. He mentioned cryptocurrencies, stating that they may have "external" value due to people's desire to purchase tokens and coins. According to Bailey, however, cryptocurrencies lack "intrinsic" value. Bailey has been an ardent opponent of cryptography in the past, but while speaking to British legislators, he made a number of more positive statements while reiterating his view that unsecured crypto-assets pose a "very high risk."
Regarding the technical prospects of bitcoin, it is evident that if buyers do not begin acting more aggressively immediately, it will be impossible to avoid updating the next annual minimum and a major sale of the world's first cryptocurrency. I recommend delaying the establishment of long positions until the trading instrument has stabilized. A breach of the closest support level of $ 19,230 and consolidation below this range would send the trading instrument back to the lows of $ 18,600 and $ 18,120 and then to $ 17,560. In the event of an upward correction, bears will manifest in the vicinity of the closest area of resistance, which is $ 19,880. Only consolidation above this range will return the trading instrument to the $ 20,500 to $ 21,150 range, allowing investors to relax somewhat. A further-off objective will be the $ 21,900 region. They are attempting to "pick up" ether from the minimum around $ 1,040 – this is the last point below which another major sale will commence with the intention of updating annual lows. Now, purchasers must consider how to return $ 1,095. Only after growth surpasses this threshold can we anticipate an update to the maximum of $ 1,155. Even if bulls break through $ 1,220, it is unlikely to be possible to speak of a bull market developing. Only by fixing higher will the trading instrument be able to return to $ 1,270, at which point a fierce battle will resume. In the event that ETH remains under pressure and falls below $ 1,040, it is prudent to anticipate larger lows near $ 985 and $ 935. The material has been provided by InstaForex Company - www.instaforex.com |
| Forecast for EUR/USD on July 13. European statistics do not support the euro currency Posted: 13 Jul 2022 05:35 AM PDT
The EUR/USD pair continues to decline after consolidating below the level of 1.0080 in the direction of the corrective level of 323.6% (0.9963). The first two days of the new week demonstrated that bear traders continue to aggressively sell the European currency, which has led to a decline to the significant level of 1.0000. Now that more than a day has passed since yesterday's testing, and the euro currency has not even been able to rise to the nearest level of 1.0080, traders will attempt to gain a foothold below this level. During the first two days of the week, there was no informational context. There was not a single event that would influence the sentiment of traders. But why are these events necessary if traders already know what to do? Today, for instance, an important inflation report for the United States will be published. In normal circumstances, I would wager on it, as it determines the pair's dynamics in the coming days or weeks. The Fed's monetary policy is currently dependent on US inflation, while the dollar exchange rate is dependent on the Fed's PEPP. However, under the current circumstances, this report has lost nearly all of its value. Traders will react to virtually any inflation value released today, but even if the European currency appreciates in response to this report, will anyone conclude that its decline has ended? Consequently, I believe the European currency will continue to fall. If not today, tomorrow will do. If not tomorrow, then the following week. The Federal Reserve has nearly finalized the decision that will be made at the end of the month. The ECB may also increase the interest rate at the end of the month, but it will be the first increase in a long time, and the increase will be only 0.25%. It is unlikely that such information will be sufficient to prevent the euro from falling into the abyss.
On the 4-hour chart, the pair has positioned itself below the corrective level of 127.2% (1.0173). Consequently, the decline in prices can continue in the direction of the subsequent corrective level of 161.8 percent, or 0.9581. The downward trend corridor continues to characterize "bearish" sentiment among traders. Both indicators exhibited "bullish" divergences, which had no effect on traders' sentiment as of this moment. Report on Commitments of Traders (COT):
Last reporting week, 7,724 long contracts and 13,980 short contracts were opened by speculators. This indicates that the "bearish" sentiment of the major players has again intensified and continues to be "bearish." The total number of long contracts held by speculators is now 197 thousand, and the number of short contracts is 214 thousand. The disparity between these numbers is slight, but it does not favor the bulls. The majority of "Non-commercial" traders have maintained a "bullish" outlook on the euro in recent months, which has not helped the euro currency. Recent COT reports indicate that new sales of the EU currency may follow, as speculators' sentiment has shifted from "bullish" to "bearish" over the past few weeks. This is the exact development of events that we are currently witnessing. News calendar for the United States and Europe: EU - industrial production volume (09:00 UTC). US - consumer price index (CPI) (12:30 UTC). US - Fed's "Beige Book" (18:00 UTC). The economic calendars of the European Union and the United States contain several intriguing entries for the 12th of July. I suggest paying particular attention to the US inflation report. Today, the impact of the information context on the sentiment of traders is likely to be average. EUR/USD forecast and trader recommendations: I suggested selling the pair when it reached a closing price of 1.0196, with targets of 1.0080 and 0.9963; the first target has been reached, and the second can be reached today. On a 4-hour chart, I advise buying the euro when the price is above the corridor with a target of 1.1041. The material has been provided by InstaForex Company - www.instaforex.com |
| Forecast for GBP/USD on July 13. UK GDP grew stronger than expected Posted: 13 Jul 2022 05:35 AM PDT
According to the hourly scale, the GBP/USD pair returned to the level of 1.1933 and came close to touching the falling trend line. A rebound from this level or this line would operate in favor of the U.S. dollar and would resume the decline in the direction of the corrective level of 685.4% (1.1684). Fixing the pair's exchange rate above the trend line will allow us to anticipate further gains in the British pound toward the next corrective level of 523.6 percent, or 1.2146. This morning, the United Kingdom delivered the week's first economic reports. In May, GDP rose by 0.5% compared to estimates of 0.1-0.0%, while over the previous three months, GDP grew by 0.4% compared to predictions of 0.1-0.0%. Consequently, the British figures could have satisfied the bulls, but the bulls themselves did not take advantage of the opportunity to begin purchasing the British currency. Moreover, industrial production rose more rapidly than planned. 1.4 percent over the expected -0.3 percent decline. The report on U.S. inflation is more significant, but if such positive data from the United Kingdom cannot support the pound, what can? Yesterday's performance by Andrew Bailey was similarly unimpressive. I anticipate that Britain's fall will continue based on the existing situation. The only opportunity for the pair is a sharp consolidation above the trend line, although such a signal does not indicate that the decline has ended. For the British to anticipate robust growth, a downward trend line on the 4-hour chart must also be surmounted. There are too many "buts" currently preventing the pound from rising. In the evening, the American economic evaluation "Beige Book" will be published, which can likewise not be relied upon too heavily. This is merely an overview of evaluations of all Federal Reserve banks that are part of the Fed system.
After establishing a "bullish" divergence at the MACD indicator, the pair staged a reversal in favor of the British pound on the 4-hour chart. However, the currency has not been able to increase even to the nearest level of 1.1980. Thus, the quote decline may resume toward the corrective level of 161.8% (1.1709). Bearish sentiment continues to be represented by the dropping trend line. Report on the Commitments of Traders:
The sentiment of "non-commercial" traders has gotten more "bearish" during the past week. The number of long contracts held by speculators rose by 4,434, while the number of short futures rose by 7,524. Thus, the general sentiment of the major participants has stayed the same - "bearish" - and the number of short contracts continues to outnumber the number of long contracts vastly. Major players continue to shed the pound for the most part, and their disposition has not changed significantly in recent times. Consequently, I believe that the British pound's depreciation could continue over the coming weeks. A significant disparity between the number of long and short contracts may signal a trend reversal, but the context of the information is currently of far greater importance to key players. And the score remains against the British pound. To date, it is not logical to deny that speculators sell more than they purchase. News calendar for the USA and the UK: UK - industrial production volume (06:00 UTC). UK – GDP (06:00 UTC). US - consumer price index (CPI) (12:30 UTC). US - The Fed's "Beige Book" (18:00 UTC). The United Kingdom has already released its scheduled statistics on Wednesday. Following is the US inflation report and Beige Book. I believe that the informational context will have a moderate effect today. Forecast and suggestions for the GBP/USD exchange rate: When the British pound rebounds from the trend line on the hourly chart with a price goal of 1.1709, I recommend purchasing further shares. With a target of 1.2146, I advise purchasing the British pound when the hourly price closes above the trend line. The material has been provided by InstaForex Company - www.instaforex.com |
| Posted: 13 Jul 2022 05:19 AM PDT Futures on US stock indices rose slightly on Wednesday as investors focused on the key report on US inflation, which is expected to show a new high. On Tuesday, futures on US stock indices closed in the red for a second consecutive trading day. Futures associated with the Dow Jones Industrial Average increased by 61 points, or 0.2%. S&P 500 futures rose 0.2%and Nasdaq 100 futures rose 0.3%.
Investors are primarily concerned about inflation. Today, a June consumer price index report will be released. The overall indicator, which includes food and energy, is anticipated to increase to 8.8% from 8.6% in May. The consumer price index may increase by 1.1% in June compared to May. This increase will be the largest since 1981. Under the current circumstances, it is also unnecessary to assert that June will mark the peak, after which a decline will commence. Despite the Federal Reserve's aggressive interest rate hikes, it is evident that price pressure continues to increase. A strong labor market forces employers to increase salaries to attract and retain qualified workers, which further accelerates inflation – not to mention the energy market, COVID, problems with supply disruptions, and smaller factors such as producers shifting costs to consumers. According to market expectations, the US central bank may raise interest rates by 75 basis points at a meeting later this month. The Federal Reserve increased interest rates by three-quarters of a percentage point to a range of 1.5-1.75% last month, the most aggressive increase since 1994. The economy is gradually showing weakness due to the Fed's aggressive efforts to reduce inflation. The most recent report on retail sales in the United States demonstrates this. Today, the International Monetary Fund released its forecasts, in which it revised the growth of the US economy downward for this year and next, as well as increased its unemployment rate projections. The fund's economists cautioned that a widespread increase in inflation poses systemic risks for both the domestic and international economies. This year, the US gross domestic product will increase by only 2.3%. This is less than the 2.9% predicted by the fund one month ago. As for the unemployment rate, it is anticipated to increase to 3.7% from the previous estimate of 3.2%. This number is anticipated to surpass 5 percent in 2024 and remain at that level in 2025. Regarding the reporting season, the major banks will soon release their results: JPMorgan and Morgan Stanley are scheduled to release theirs on Thursday before the opening bell. Premarket Delta Air Lines shares dropped 2.9% in premarket trading following the release of mixed quarterly results. The airline earned $ 1.44 per share during the second quarter, which is less than the $ 1.73 per share anticipated by the market. Due to increased demand for travel, revenues surpassed projections. After filing a lawsuit against Tesla CEO Elon Musk to compel him to comply with the company's $44 billion acquisition terms, the Twitter stock climbed 2% in premarket trading. Musk announced his withdrawal from the agreement earlier this week, alleging that Twitter violated the terms of their contract. Novavax's premarket value increased by 2.4% after it was announced that the COVID-19 vaccine developed by the company could receive FDA approval today.
As for the S&P 500's technical picture, The index remains under pressure. Only the return of the $ 3,835 level, which could not be surpassed in the morning, will allow us to break through to $ 3,872, which will open up the possibility of an active upward movement of the trading instrument to the region between $ 3,905 and $ 3,940, where large sellers will return to the market. There will be at least some who wish to lock in profits on long positions. A more distant objective will be $ 3,975. In the event of pessimism and a significant increase in inflation, the trading instrument will decline sharply. This will result in a fresh rejection of risks and recalculating the closest support at $ 3,801. This area's decline will reduce the index to between $ 3,773 and $ 3,744. Just below this level is a level of greater stability, $ 3,704, where buyers will resume their aggressive behavior. The material has been provided by InstaForex Company - www.instaforex.com |
| Technical analysis recommendations on EUR/USD and GBP/USD for July 13, 2022 Posted: 13 Jul 2022 05:12 AM PDT EUR/USD
Higher timeframes During testing, the level of 1.0000 appeared on the daily timeframe, the result of the interaction is being formed. Bulls are still interested in slowing down with a transition to consolidation or rebound. Having realized this, they will be able to count on the further development and strengthening of their moods. The resistances of the higher timeframes are now still located quite far from the price chart and are of little relevance so far. The nearest resistance is the daily short-term trend at 1.0243. The breakdown of the met support at 1.0000 will open opportunities for bears to move to the next benchmark—the local low of 2000 (0.8225).
H4 – H1 On the lower timeframes, the pair is in the upward correction zone, now trying to overcome the attraction and resistance of the central pivot point of the day (1.0037). With the development of the correction, the resistance of the weekly long-term trend (1.0118) will be of primary importance since this level is responsible for the current balance of power in the lower timeframes. In case of exit from the correction zone and continuation of the decline, the support of the classic pivot points (0.9999 – 0.9963 – 0.9925) will serve as reference points within the day. *** GBP/USD
Higher timeframes The pair continued to decline yesterday, but the final nature of the daily candle has the prerequisites for slowing down and the emergence of a correction. It is important for bulls in the current situation to rise and gain a foothold above the 1.2000 mark. Having seized the daily short-term trend (1.1992), the bulls will be able to count on the continuation of the rise to new benchmarks, while their most important task, in this case, will be the elimination of the daily death cross (its final levels today are 1.2203 – 1.2295) and gaining support for the weekly short-term trend, which is now at 1.2237. The continuation of bearish activity in the current environment is still focused on the support area of 1.1411 (the local low of 2020).
H4 – H1 The slowdown led to the development of a correction in the lower timeframes. Bulls have taken over the central pivot point of the day and are now using it as support (1.1869). Further, the conquest and reversal of the weekly long-term trend (1.1941) is important. The classic pivot points R2 (1.1977) and R3 (1.2038) can serve as additional upward reference points today. The return of bearish sentiment within the day will bring back the relevance of the support of the classic pivot points (1.1822 – 1.1761 – 1.1714). *** In the technical analysis of the situation, the following are used: higher timeframes – Ichimoku Kinko Hyo (9.26.52) + Fibo Kijun levels H1 - Pivot Points (classic) + Moving Average 120 (weekly long-term trend) The material has been provided by InstaForex Company - www.instaforex.com |
| AUD/USD Update for July 13, 2022 - Potetnial for the bigger rally Posted: 13 Jul 2022 04:25 AM PDT Technical analysis:
AUD./USD has been trading upside today and I see potential for the further rally. The trend for the day is bullish. Trading recommendation: Due to the higher highs and higher lows on hourly and potential for tests of upper references, I see upside scenario. Watch for buying opportunities on the intraday dips with the upside objectives at 0.6860 and 0.6890. MACD is showing momentum expansion to the upside, which is good confirmation for the further rally. Key support is set at the price of 0.6715 The material has been provided by InstaForex Company - www.instaforex.com |
| Trading plan for Gold on July 13, 2022 Posted: 13 Jul 2022 04:24 AM PDT
Technical outlook:Gold prices dropped through $1,722 after drifting in a tight range on Tuesday, before finding some bids coming. The yellow metal has crawled back above $1,730 at this point in writing and could be targeting $1,850 in the near term. Please note that the potential remains for yet another drop towards the $1,705-10 area before resuming its suggested counter-trend rally. Gold has remained in control of bears since March 08, 2022, after printing the $2,070 highs (not seen on the 4H chart here). The price has been carving a series of lower lows and lower highs following a downtrend resistance trendline projected. Bears seem to have carved a meaningful bottom at around $1,722 or are eyeing one more at around the $1,705-10 zone soon. Either way, a high probability remains for a turn higher towards $1,750, followed by the $1,813-15 resistance zone as marked on the chart here. After carving a meaningful larger-degree downswing between $2,070 and $1,722, the metal might be now preparing to unfold a similar degree corrective rally back towards $1,900 in the next several weeks. Going forward:Gold prices have dropped in the past few days but the recent lows have been accompanied by a strong bullish divergence on the 4H Rsi as shown here. Bulls will remain poised to take immediate resistance out at around $1,750 to register themselves and also confirm that a meaningful low is in place at around $1,722. Trading plan:Preparing for a potential rally towards $1,750 and $1,813 against $1,700 Good luck! The material has been provided by InstaForex Company - www.instaforex.com |
| BTC update for July 13,.2022 - Breakout of the downside channel Posted: 13 Jul 2022 04:18 AM PDT Technical analysis:
BTC/USD has been trading upside today and there is the trend for the day. I see potential for the further rally. Trading recommendation: Watch for potential buying opportunities on the intraday dips due to the breakout of the downside channel. Upside objectives are set at the price of $20.600, $21.190 and $21.900. MACD is showing decreasing in the downside momentum and potential for the rally. Key support is set at the price of $19.240 The material has been provided by InstaForex Company - www.instaforex.com |
| The IMF's negative outlook on the US economy will only strengthen dollar purchases Posted: 13 Jul 2022 04:16 AM PDT There is no denying that the world economy's geopolitical environment is currently operating in a dire state. As a result, inflationary pressure is increasing, which is one of the effects of the current events. The US economy's growth for this year and the following year was scaled back, and expectations for the jobless rate were increased, according to the International Monetary Fund's most current forecasts. The fund's economists warned that a significant increase in inflation poses systemic dangers to the nation's economy and the global economy. Only 2.3% growth in the US's gross domestic product is expected this year. This is lower than the 2.9% forecast by the fund a month ago. In terms of unemployment, it is anticipated to increase to 3.7% from the earlier prediction of 3.2%. This percentage is predicted to rise beyond 5% in 2024 and stay there in 2025. The report does not give the reasons for the revised downward US economic growth prediction from last month. The modification occurred in response to subpar statistics on consumer expenditure adjusted for inflation from the Ministry of Commerce, which decreased in May. The Federal Reserve System's aggressive monetary policy, which has resulted in the highest inflation in forty years, is exerting significant pressure on the economy's growth rate. The committee increased interest rates by 75 basis points last month, which was the largest increase since 1994. According to most Fed officials, another increase of at least 50 points is anticipated in July. The projection could be revised in light of today's inflation statistics, and we shouldn't rule out another abrupt increase of 0.75 percent. According to the IMF executive director, an operational slowdown in price increases without raising the risk of a recession should be the top aim of US policy. He claims that preventing a recession in the United States is getting harder and harder because supply-side constraints, the ongoing COVID-19 pandemic, and special military operations in Ukraine make it harder to maintain the prior growth rates. High-interest rates are related to preventing further inflation growth, which in any case will result in considerable costs for the nation and detrimental effects on the global economy. A downgrade will not impact the US dollar's projection because it is now being utilized as a safe-haven asset, compelling investors to sell off risky investments. The likelihood that the euro and the British pound will fall increases with how aggressive the Fed's interest rate policy is. The global economy will undoubtedly experience a recession, making things much more difficult for the key trading partners, the UK and the Eurozone. On the other side, the cheapness of the pound and euro encourages exports and international trade. There is no indication of any purchase if we are talking about the technical prospects of the euro. The only way to deal with the looming bearish scenario is a return to 1.0050. Only after consolidation at this level occurs will the areas of 1.0110 and 1.0180 offer hope for a rebound. Even so, this will prevent the bulls from seizing market control. Maximum: we'll stay in the side channel once more. Buyers must demonstrate activity near 1.0000 if the euro continues to fall; otherwise, the pressure on the trading instrument will only grow. You can end your dreams of the pair's recovery, which would have opened a clear path to 0.9950 once you missed 1.0000. A breach of this support level would undoubtedly put more pressure on the trading instrument, creating a window for the test of 0.9915. Now that the British pound is under pressure again, it is difficult to predict who will win in the end. Talking about a significant upward correction is no longer warranted given the current situation, as the bulls did not respond to positive economic data. We can expect a breakthrough to the 1.1980 range, where purchasers will encounter more challenges only once GBPUSD is fixed above 1.1920. We can discuss the 1.2030 update if the pound has a more significant upward rise. The pound will go directly to 1.1820 if the bears break below 1.1870. Beyond this area, another negative trend will already reach a minimum of 1.1750. The material has been provided by InstaForex Company - www.instaforex.com |
| Analysis of Gold for July 13,.2022 - Potential for breakout of the downside channel Posted: 13 Jul 2022 04:12 AM PDT Technical analysis:
Gold has been trading downside in the past few days but I found there there is slowdown in the downside tempo and potential for the rally. Trading recommendation: Due to the potential exhaustion of the downside momentum and very tight downside channel, watch for the buying opportunities in case of the breakout of the channel. Watch for buying opportunities on the intraday dips with the upside objectives at the price of $1.750 and $1.784. Stochastic is showing oversold condition and fresh bull cross, which is sign for the further rise. Key support is set at the price of $1.720 The material has been provided by InstaForex Company - www.instaforex.com |
| Copper is down 30% from its March record Posted: 13 Jul 2022 04:12 AM PDT
Copper lost one of its most powerful backers after Goldman Sachs cut its short-term price forecasts in anticipation of a sharp decline in consumer spending and industrial activity amid deepening energy crises in the Euro area. Analysts at Goldman Sachs were among the most bullish supporters on commodities, and said copper could become one of the tightest markets ever seen. But with investors selling the metal en masse and prices currently 40% below the bank's expectations, it recently warned that the downturn could continue.
Growing dollar demand has put significant pressure on copper, along with the global energy crisis. Even the Bank of America shifted its forecast to $6,700 a tonne in the next three months, compared to the previous $8,650. From a technical point of view, copper has reached the support level located around $7,000.
Summing this all up, copper has fallen nearly 30% from its March record. Although analysts favored the metal due to limited supplies and its use in fast-growing green technologies, prices have fallen as cuts in energy supplies undermine the economy, especially in Europe.
As mentioned earlier, the Bank of America cut its forecasts last week, warning that in a worst-case scenario where Europe faces widespread gas shortages, prices could fall as low as $4,500 a tonne. On the London Metal Exchange on Tuesday, copper fell 3% to $7,354 a ton, its lowest close since November 2020. Other base metals decreased as well.
Marcus Garvey, head of commodities strategy at Macquarie Group said the copper market may run into a surplus in the next two years if demand declines and production continues to expand. He added that if there are no new supply shocks, the performance of the metal will depend on global growth.
"The downward spiral in copper price that has gathered momentum in recent sessions reflects increasingly pessimistic growth expectations," Goldman Sachs said. "This latest leg lower has been tied to increasing headwinds to European growth path, in particular from the impact of surging regional natural gas prices on activity," they added. Goldman Sachs also warned that lower prices may encourage manufacturers to curtail supplies, but those would be needed only during a global recession. Nevertheless, the bank said copper is on track to hit $15,000 in 2025, citing clear structural gains as mine supply peaks. It is expected to cost $7,600 in six months and $9,000 in 12 months, compared to previous forecasts of $10,500 and $12,000. The material has been provided by InstaForex Company - www.instaforex.com |
| Silver under sellers' pressure Posted: 13 Jul 2022 04:07 AM PDT
There is little sign that the selling pressure in silver will let up anytime soon as the precious metal continues to decline. Silver continues to see significant selling pressure as prices remain below $19 an ounce, trading at a new 2.5-year low.
Silver is an important precious metal. However, 60% of demand comes from industrial uses.Market analysts point out that the factors putting pressure on silver are driven by the Federal Reserve's monetary policy stance. The US central bank continues to pursue aggressive rate hikes to bring down inflation. The Federal Reserve is leading global central banks in rate hikes, which is helping to support the US dollar. At the same time, the central bank's focus on inflation over growth is increasing concerns that it will push the economy into a recession.Currently, markets expect the Federal Reserve to raise the Fed Fund rate by another 75 basis points later this month.Growing recession fears can be seen in the bond market as breakeven levels, which measure the difference between nominal and real yields, continue to decline. On Tuesday, five-year forward breakeven rates fell to 2%, the lowest level since March 2021.According to silver-backed exchange-traded funds, analysts at Heraeus noted that silver investors have turned into outright sellers. The European company also noted that there had been a $1 billion outflow of silver from global ETFs since May.Commodity analysts at Commerzbank note that speculative positioning in the silver market also indicates that investors have given up on the precious metal.Although the silver market faces many challenges in the near term, there is still some optimism that markets can turn around. Commerzbank said that the market has taken into account a lot of bad news and the recent selling could be seen as a capitulation move.Commodity analysts at Blue Line Futures are also optimistic about silver's potential turnaround. The analysts said that they will be watching Wednesday's inflation data closely.There are growing expectations that the June Consumer Price Index will show consumer prices rising 9%. Analysts have said that higher inflation could cause investors to question the Federal Reserve's ability to bring down inflation.Blue Line Futures is looking for silver prices to hold support at the same level. The material has been provided by InstaForex Company - www.instaforex.com |
| Posted: 13 Jul 2022 04:03 AM PDT In my morning review, I pointed out the level of 1.1925 and recommended it as a point for entering the market. Let's have a look at the 5-minute chart and find out how the situation has changed there. An upbeat report on GDP in the UK pushed the pound higher towards the level of 1.1925. However, the pound bulls failed to settle above this range. As a result, the pair made a false breakout and generated a sell signal which sent the sterling down by more than 40 pips. From the technical viewpoint, the chart hasn't changed much in the afternoon. So, our strategy also stays the same.
For long positions on GBP/USD: During the North American session, markets will anticipate an important report on inflation in the US for June. This data will directly influence the future policy of the US Federal Reserve. If the CPI data exceeds expectations and the pound comes under pressure again, we may see the pair returning to yearly lows. It is not clear yet how large market players will behave in this situation. If GBP/USD declines in the afternoon, bulls may assert their strength near the support level of 1.1865. The moving averages that support the bullish trend are passing just above this level. A false breakout of this range will serve as a great signal for opening long positions with the first target found at 1.1925. So far, the pair has failed to break above this mark. Therefore, a retest of this level and its breakout will create a much stronger upside movement. A top-to-bottom test of the 1.1925 level will generate a buy signal for a more rapid jump towards 1.1979. A similar breakout of this level will be possible only if the US inflation data shows that consumer prices have slowed down. This, in turn, will ease the pressure on the Fed. Moreover, this will pave the way towards the area of 1.2034 where I recommend taking profit. A more distant target is seen at the level of 1.2083. A test of this level will indicate the formation of a new upward cycle. In case of a drop and low bullish activity at the level of 1.186, the pound/dollar pair will depreciate further. If so, I would advise you to open long positions only after the price reaches 1.1809, the last point that will dash buyers' hopes for an upside correction. It is better to buy at this level only after a false breakout. It is possible to go long on GBP/USD right after a rebound from 1.1742, or even lower from 1.1647, keeping in mind a possible correction of 30-35 pips within the day. For short positions on GBP/USD: Bears have already fought for the level of 1.1925, and a retest of this level may push them back. Yet, the situation is unlikely to change dramatically before the inflation report is out. Now bears have to watch the resistance level of 1.1925. To regain control of the market, the sellers need to break below 1.1865 as soon as they can. This will be a hard task to fulfill given the possible correction developed by the bulls. If GBP/USD rises in the afternoon after the publication of the CPI data in the US, the formation of a false breakout at 1.1925 will create the first entry point for short positions. This will go in line with the downtrend and the possible return of the price to 1.1865. Consolidation below 1.1865 and a retest of this range will trigger stop-loss orders placed by the bulls. This will also create an additional entry point to sell the pound with the downward target at 1.1809. I recommend locking in some profit at this level. A more distant target will be found at the level of 1.1742. A test of this area will indicate the resumption of the downtrend. In the upside scenario and low bearish activity at 1.1925, bulls will take control of the market. If so, I do not recommend buying the pair. Only a false breakout of the next resistance at 1.1979 will create a good point for opening short positions after a possible downside pullback. If nothing happens there as well, the price may rush to the upside amid the canceled stop-loss orders placed by speculative sellers. In this case, I would advise you to open short positions only when the price hits the level of 1.2034. At this point, you can sell GBP/USD right after a rebound, keeping in mind a possible correction of 30-35 pips within the day.
COT report The COT (Commitment of Traders) report for July 5 showed a rise in both short and long positions. However, short positions prevailed which led to an increase in the negative delta. Another attempt to buy the pair near yearly lows failed after it became clear that the Bank of England will keep raising the rate to tackle inflation. This policy will further slow down the UK economy and will push it closer to a recession. The cost of living crisis is getting more acute every day, and the recent resignation of UK Prime Minister Boris Johnson is likely to make things worse. There is currently no reason to buy the pound apart from the fact that it has recently retested yearly lows. The Fed's policy and the pace of monetary tightening in the US provide significant support to the US dollar. Besides, the economic situation in the US is slightly better than in the UK, which is confirmed by the fresh employment data for June. According to the COT report, long positions of the non-commercial group of traders increased by 4,434 to 39,618, while short positions surged by 7,524 to 95,826. As a result, the negative non-commercial net position increased to -56,208 from -53.118. The weekly closing price declined to 1.1965 versus 1.2201.
Indicator signals: Moving Averages Trading near the 30 and 50-day moving averages indicates market uncertainty and a slowdown in the bearish trend. Please note that the time period and levels of the moving averages are analyzed only for the H1 chart, which differs from the general definition of the classic daily moving averages on the D1 chart. Bollinger Bands In case of an uptrend, the upper band of the indicator at 1.1925 will serve as resistance. Description of indicators: • A moving average of a 50-day period determines the current trend by smoothing volatility and noise; marked in yellow on the chart;• A moving average of a 30-day period determines the current trend by smoothing volatility and noise; marked in green on the chart;• MACD Indicator (Moving Average Convergence/Divergence) Fast EMA with a 12-day period; Slow EMA with a 26-day period. SMA with a 9-day period;• Bollinger Bands: 20-day period;• Non-commercial traders are speculators such as individual traders, hedge funds, and large institutions who use the futures market for speculative purposes and meet certain requirements;• Long non-commercial positions represent the total number of long positions opened by non-commercial traders;• Short non-commercial positions represent the total number of short positions opened by non-commercial traders;• The total non-commercial net position is the difference between short and long positions of non-commercial traders. The material has been provided by InstaForex Company - www.instaforex.com |
| Technical and fundamental factors suggest Bitcoin may collapse again: will local bottom be updated? Posted: 13 Jul 2022 03:59 AM PDT Bitcoin reached a local high of $22.3k and fully realized the advantage formed after volatile weeks of capitulation. However, subsequently, the coin made a false breakdown of the $22k level and began to decline. The main reason for the unsuccessful upward movement was low purchasing volumes. This disadvantage, in turn, is provoked by the difficult market situation and fundamental factors. To resume the upward movement, the cryptocurrency must continue to remain in consolidation and accumulate volumes.
In the current situation, such a scenario is excluded due to the negative fundamental background. Fundamentally, Bitcoin is not ready for growth, as there are a huge number of constraining factors. The decline in the Bitcoin price over the last two days is due to negative expectations from the publication of the dynamics of the consumer price index. The expected forecast in the region of 8.8% will cause a corresponding reaction from the US Federal Reserve System. As a result, we will get an even more aggressive monetary policy and the next stage of the liquidity crisis. Bitcoin continues to maintain an increased correlation with stock indices. Therefore, you need to prepare for a price reduction.
Glassnode experts note that technically, the cryptocurrency has entered the capitulation zone, which is typical for the final stage of the bear market. However, as we expected, Bitcoin has enough potential to fall 5%–10% from the local bottom at $17.7k. Glassnode analysis showed that speculative investors remain in the market, and the recent consolidation period has only increased their number. Therefore, it is likely that we are waiting for another wave of sales.
Technically and fundamentally, Bitcoin is ready to sink to the next bottom. However, over the past two weeks, enough positive factors have appeared that can contribute to the greater stability of the cryptocurrency. The mining industry has stabilized after a record sell-off in June. Large companies have increased their income by stabilizing the Bitcoin exchange rate. Santiment also recorded a surge of optimism in relation to the first cryptocurrency in social networks, which indicates the favorable impact of the stabilization of the rate during the flat movement.
It is important to note that over the past week, there has been a significant decrease in the influx of investment in Bitcoin-based short products. Investments in such funds amounted to only $8 million, 80% less than in the last week of June. The second half of this week will have a key impact on the movement of Bitcoin in July. Reporting on inflation in the US and European countries, as well as the speech of the Fed members, should give investors a picture of what is happening in the next two weeks. The market is mostly negative due to the statements of the White House about the further growth of inflation and the Fed's policy.
In technical terms, the $18k–$19k zone will become the main battlefield after the announcement of the CPI. There is a large density of buy orders in this area, but the price has not yet fallen to this level. The current situation looks uncertain, but with a touch of anxiety. We see a price decline with increasing potential without significant resistance. At the same time, trading volumes remain low, indicating a lack of purchasing activity. From the perspective of several days, this indicates a breakdown of the $19k level.
As of this writing, Bitcoin holds the main psychological level at $19.7k. However, the bears are gradually pushing through the line of defense due to the falling activity of buyers. Over the past two days, we have not seen an impulse buyback, which allowed the downward momentum to accumulate strength.
Today will likely end with a breakdown of $19k and the start of trading the final part of the $18.5k–$19k support area. Subsequently, the price will continue to decline below the $18.5k level. Much will depend on the reaction of buyers. According to various polls, key players are ready to go down to $10k, which may contribute to the final decline in the $15k–$17k range. The material has been provided by InstaForex Company - www.instaforex.com |
| Posted: 13 Jul 2022 03:53 AM PDT In the morning article, I highlighted the level of 1.0052 and recommended making decisions with this level in focus. Now let's look at the 5-minute chart and try to figure out what actually happened. A small upward rebound of the euro/dollar pair at the beginning of the European session led to a false breakout of 1.0052 and a sell signal. As a result, the pair dropped by about 35 pips. Yet, it failed to reach the nearest support level of 1.0001. The technical outlook has not changed so far as well as the strategy.
What is needed to open long positions on EUR/USD As I have mentioned many times, today's CPI data will impact the Fed's further moves on monetary policy. A sharp jump in inflation above economists' forecasts will force the regulator to raise the interest rate by another 0.75% this month. The central bank will also maintain hawkish rhetoric at the next meeting scheduled for early autumn this year. Naturally, it will be rather bullish for the US dollar. However, it may also trigger a sell-off of the euro. The technical outlook has not changed. Bulls and bears are tussling for the resistance level of 1.0052. Time will show which party will eventually take the upper hand. In case of a sharp drop following the inflation report, buyers will have to defend the nearest support level of 1.0001. Only after a false breakout of this level, an upward correction may take place. An equally important target is the resistance level of 1.0052. At this level, the moving averages are passing in negative territory. A breakout and a downward test of this level will erase most of the sellers' stop-loss orders, giving a buy signal. If so, the price may also climb to 1.0116. However, it is too early to talk about the upward correction. The situation will be more or less clear after the release of CPI data. At the level of 1.0116, the bears will try to build the upper border of the downward channel. It may limit the pair's growth. A more distant target will be the 1.0182 level where I recommend locking in profits. If EUR/USD declines and bulls show no activity at 1.0001 in the afternoon, which is more likely, the euro may face bearish pressure again. In this case, it is better to stay away from the market. I would advise opening long positions after a false breakout of 0.9958. You can buy EUR/USD immediately at a bounce from the 0.9915 level or even a low of 0.9886, keeping in mind an upward intraday correction of 30-35pips. What is needed to open short positions on EUR/USD As long as the pair is trading below 1.0052, bears will remain in control. If EUR/USD rises in the afternoon, a false breakout, similar to one I have mentioned above, along with strong inflation data will generate a sell signal. If so, the pair may decline to the support level of 1.0001, which is the last level on the way to parity with the US dollar. A breakout and a drop below this level, as well as an upward test, will provide an additional sell signal. Buyers will have to close their stop-loss orders, pushing the pair down to 0.9958. If it slides below this level, then it is sure to decrease to 0.9915 where I recommend closing all short positions. A more distant target will be the 0.9886 level. If EUR/USD advances during the American session and bears show no energy at 1.0052, it is better to cancel short positions until a more attractive resistance level of 1.0116. Only a false breakout of 1.0116 will strengthen the bearish trend as it is unknown how traders will react to CPI data. You can sell EUR/USD immediately at a bounce from a high of 1.0182 or 1.0271, keeping in mind a downward intraday correction of 30-35 pips.
COT The COT report (Commitment of Traders) for July 5 logged an increase in long and short positions. However, short positions exceeded long ones by almost two times. It signals the strength of the bearish bias. It led to a bigger increase in the negative delta. Last week, market participants were disappointed by the eurozone retail sales report. After studying the Nonfarm Payrolls report, the Fed is likely to maintain an aggressive monetary policy to cap galloping inflation. The President of the European Central Bank, Christine Lagarde, also spoke about the need to start raising the interest rate to curb inflation. The United States will reveal CPI data on Wednesday. Analysts expect another jump in consumer prices. If this scenario comes true, the US dollar may climb higher against the euro, approaching parity. The COT report revealed that the number of long non-profit positions increased by 7,724 to the level of 197,138, while the number of short non-profit positions climbed by 13,980 to the level of 213,990. The US dollar is approaching new highs amid the low exchange rate of the euro, the need for further aggressive tightening by major central banks, and the recession in many developed countries. At the end of the week, the total non-commercial net position remained negative and amounted to -16,852 against -10,596. The weekly closing price dropped to 1.0316 against 1.0584.
Signals of technical indicators Moving averages EUR/USD is trading near 30- and 50-period moving averages, which signals market uncertainty. Remark. The author is analyzing the period and prices of moving averages on the 1-hour chart. So, it differs from the common definition of classic daily moving averages on the daily chart. Bollinger Bands In case of an increase, the upper border of 1.0060 will act as resistance. Definitions of technical indicators
|
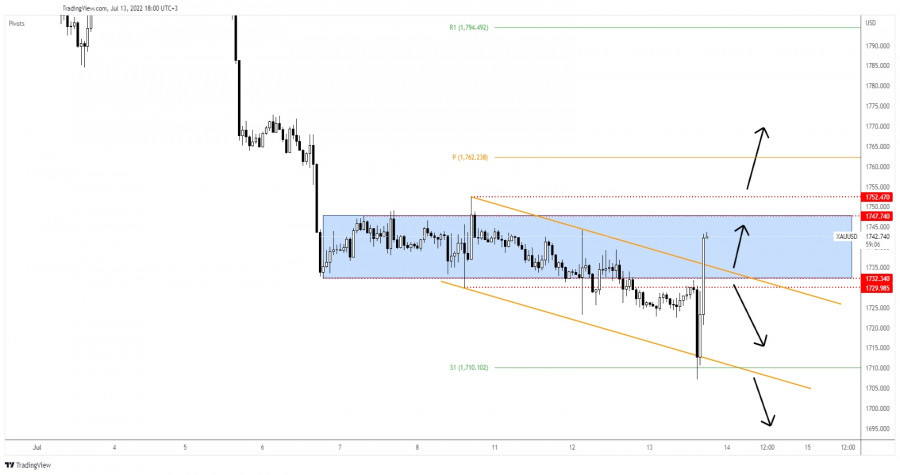
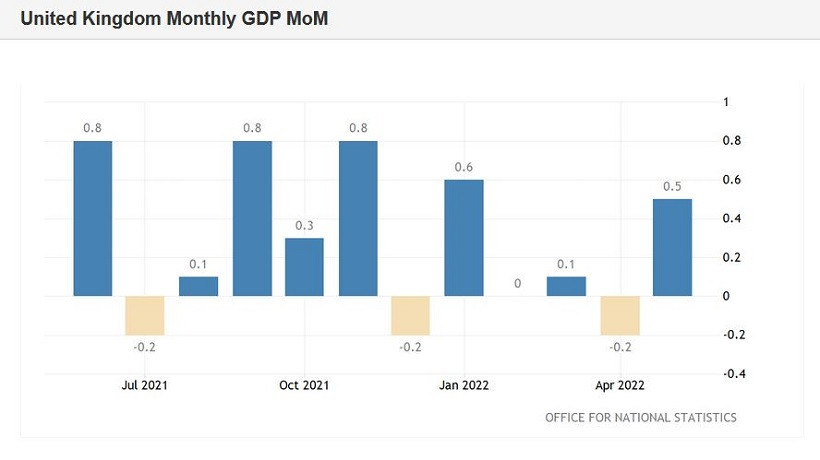
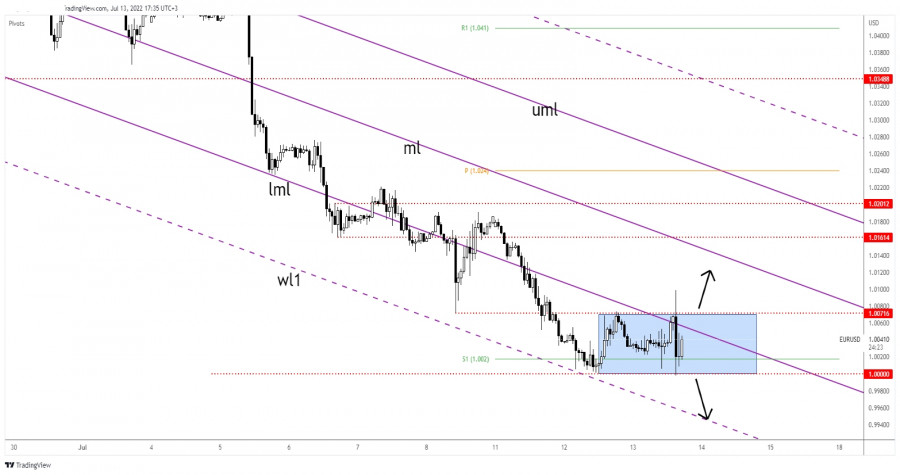
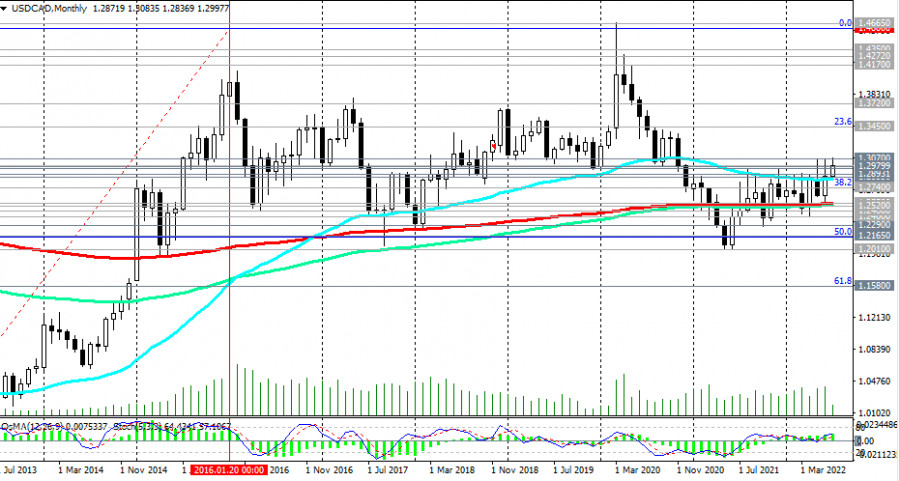
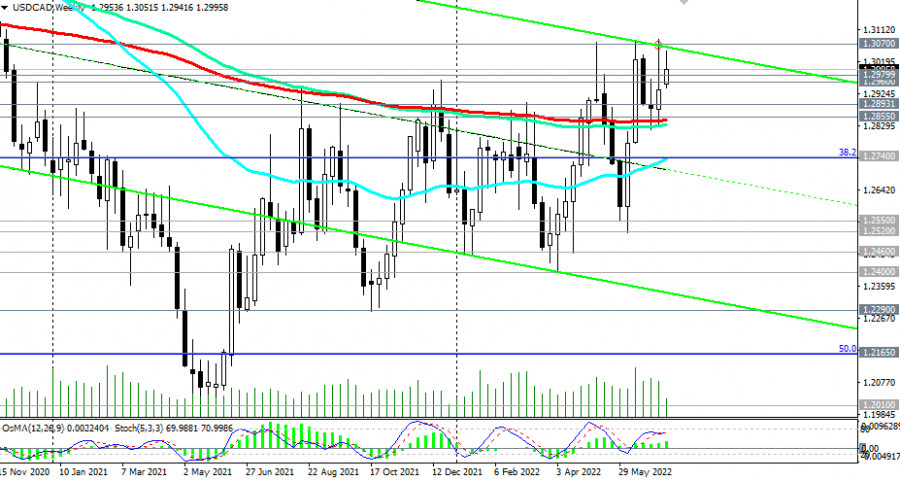
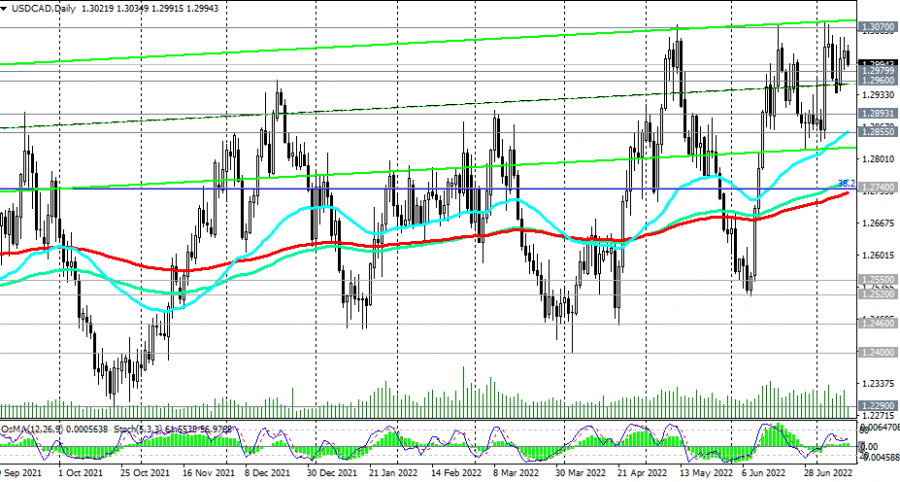
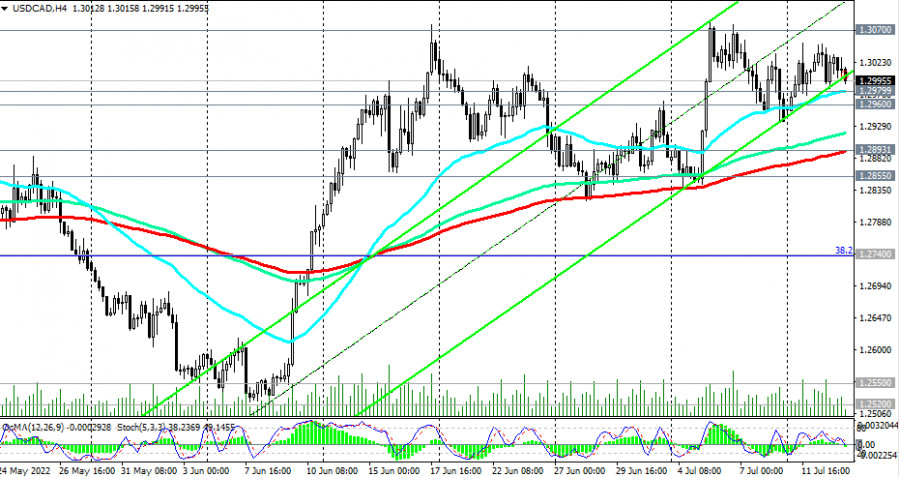
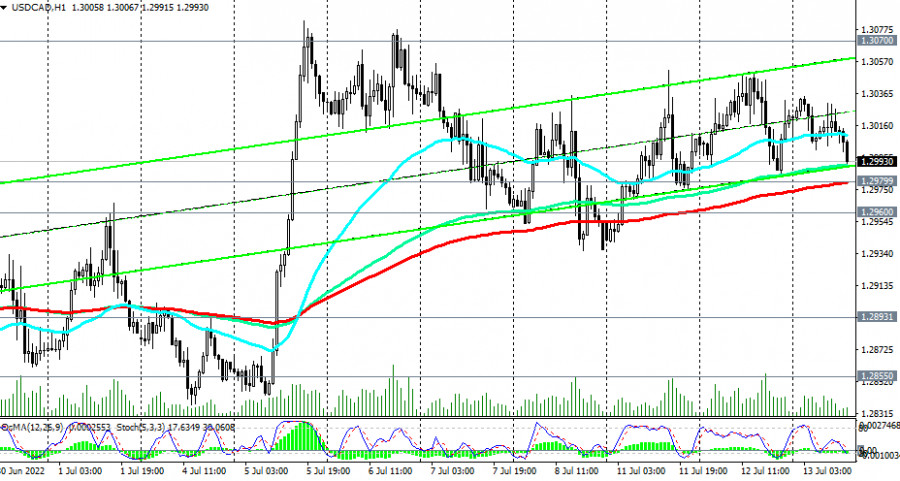
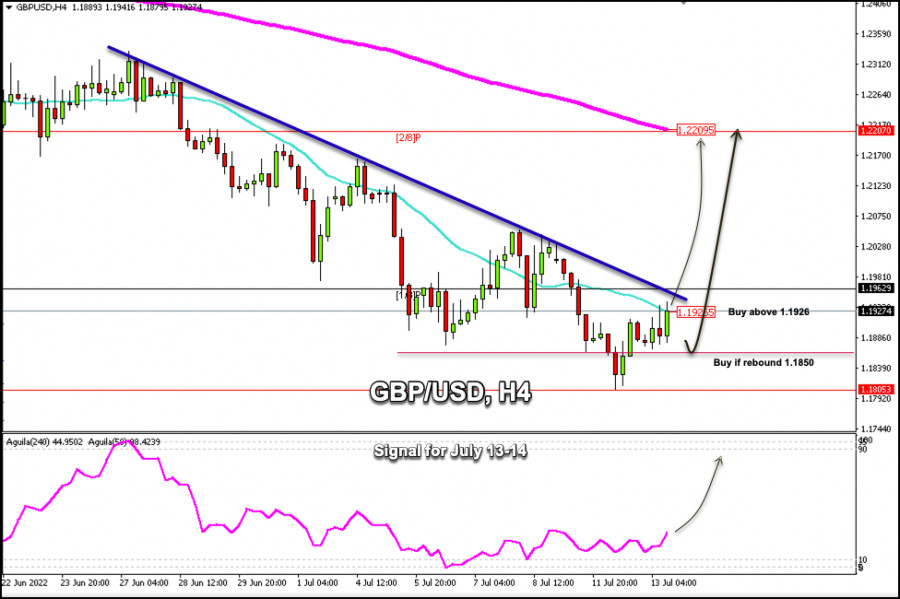
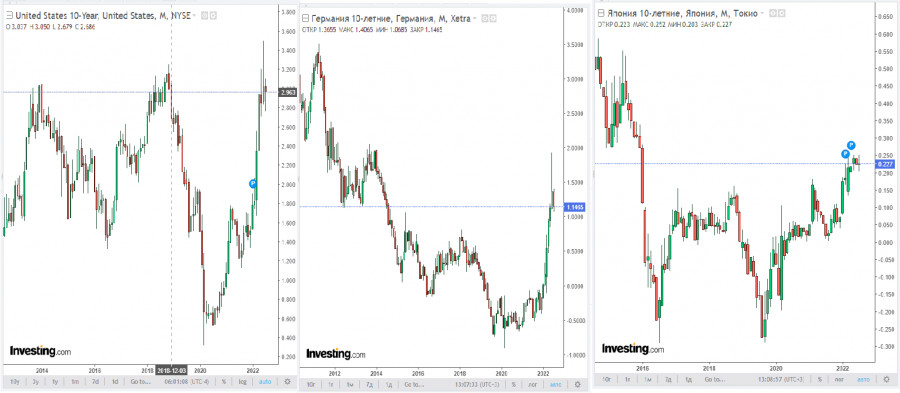
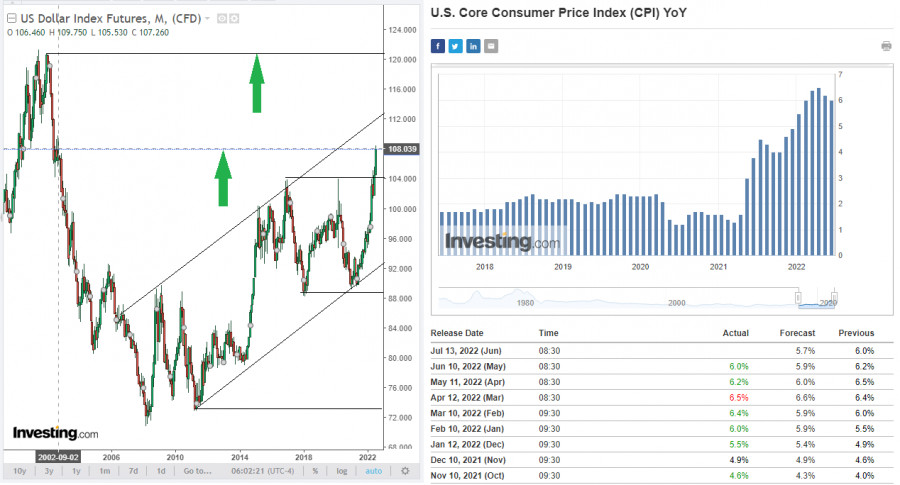
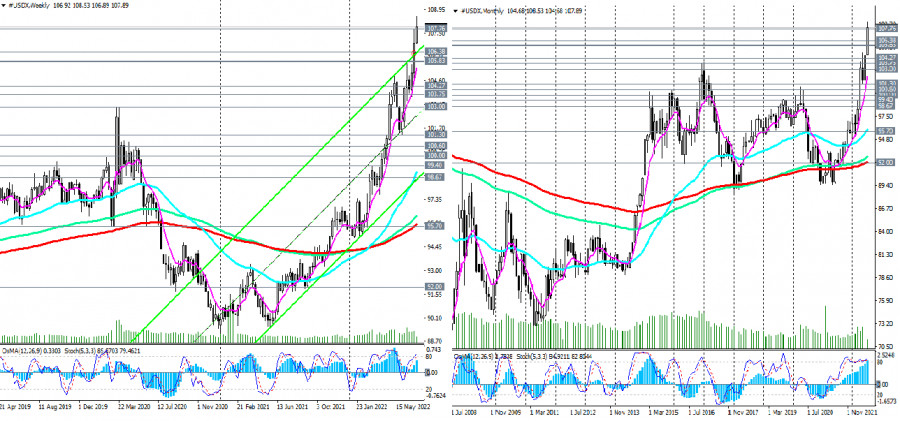
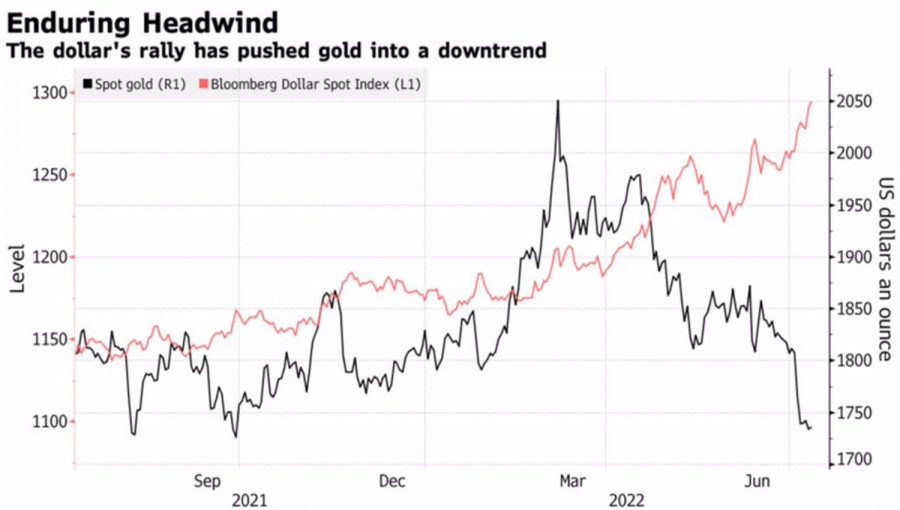
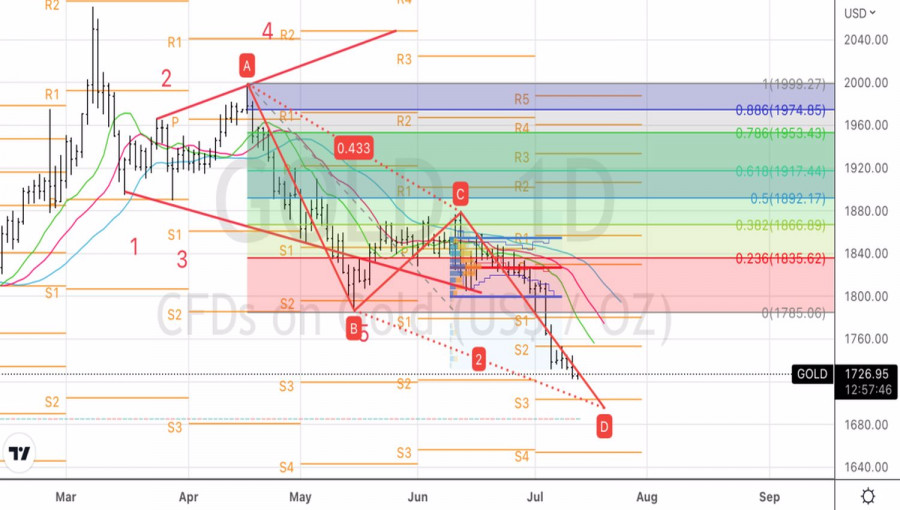
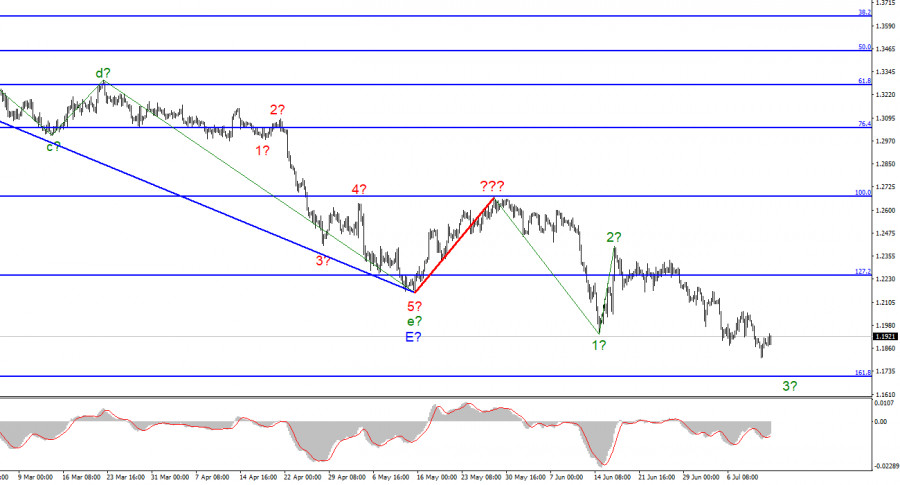
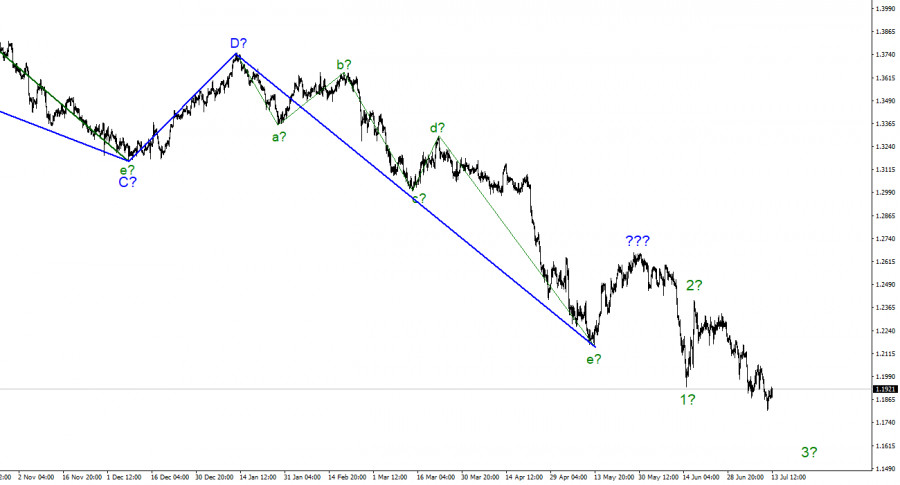
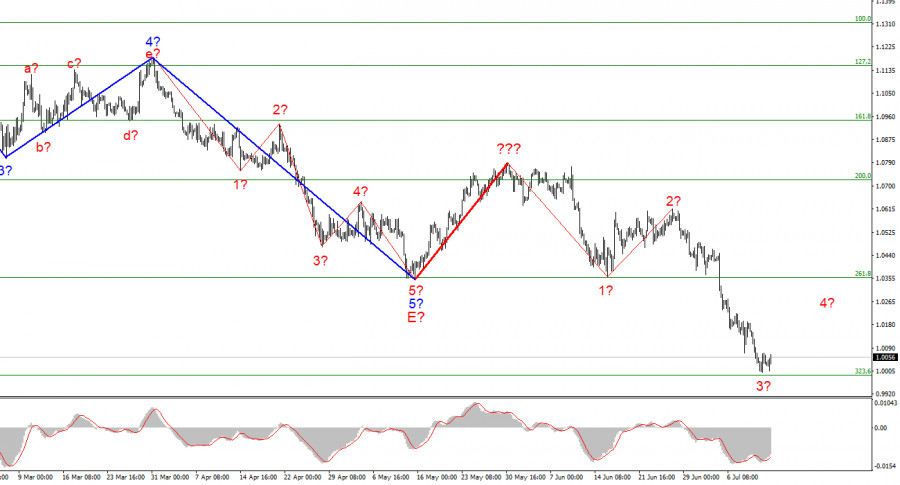
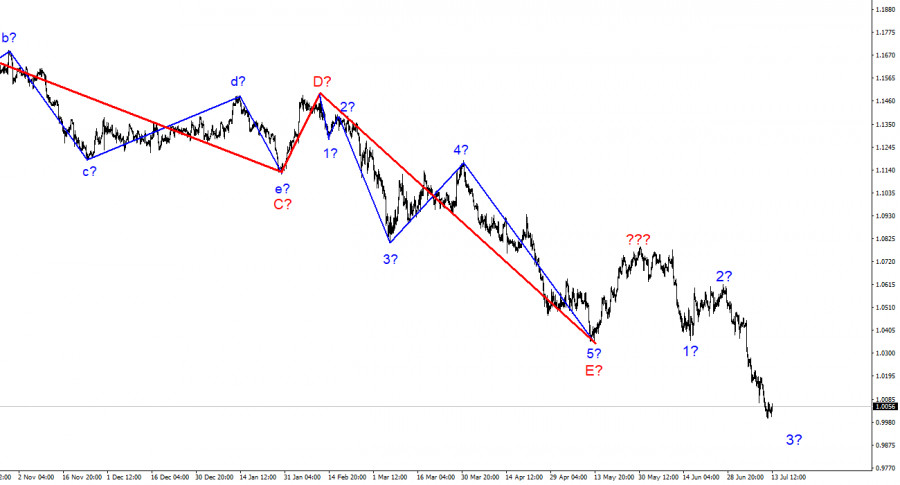

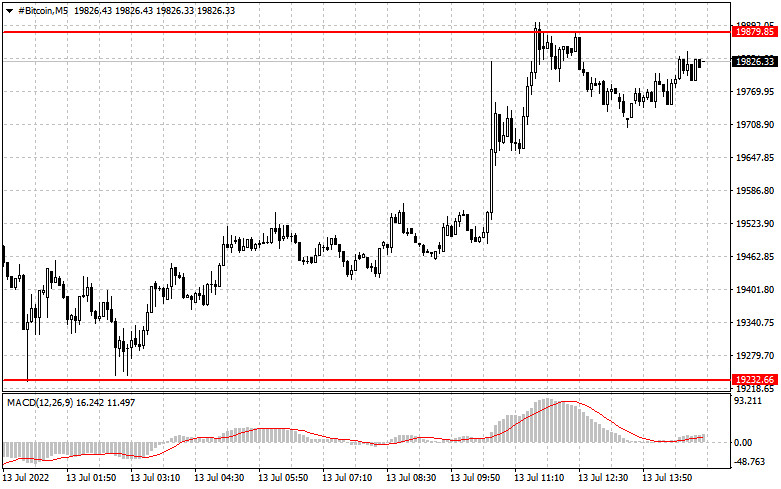
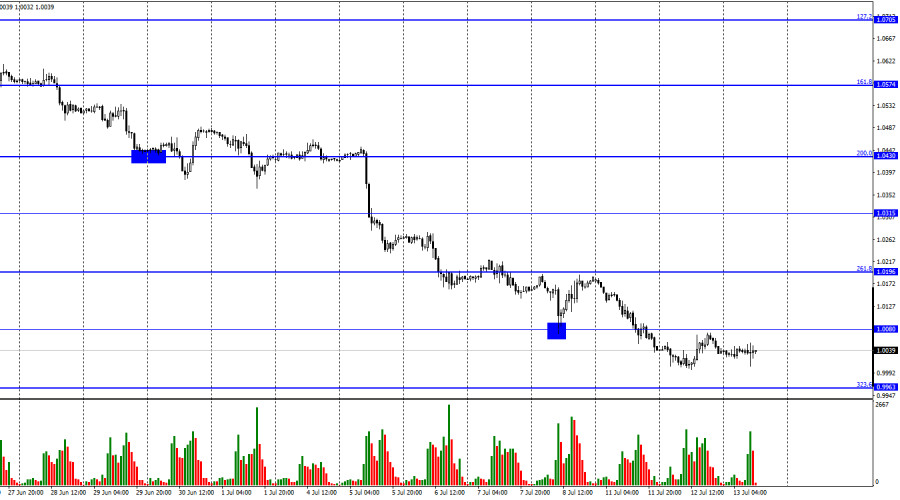
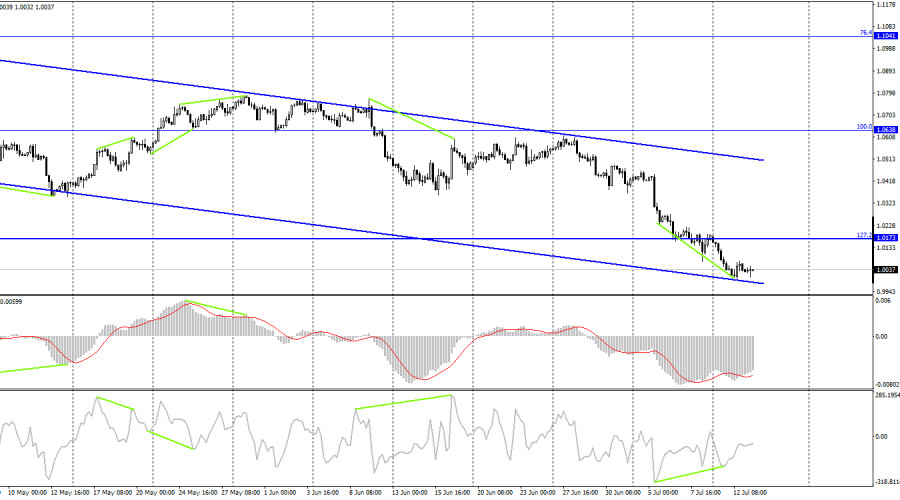
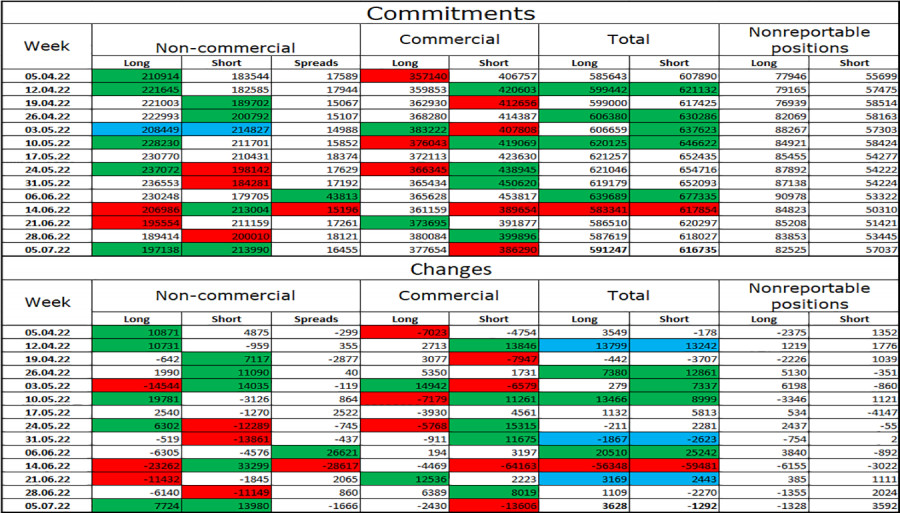
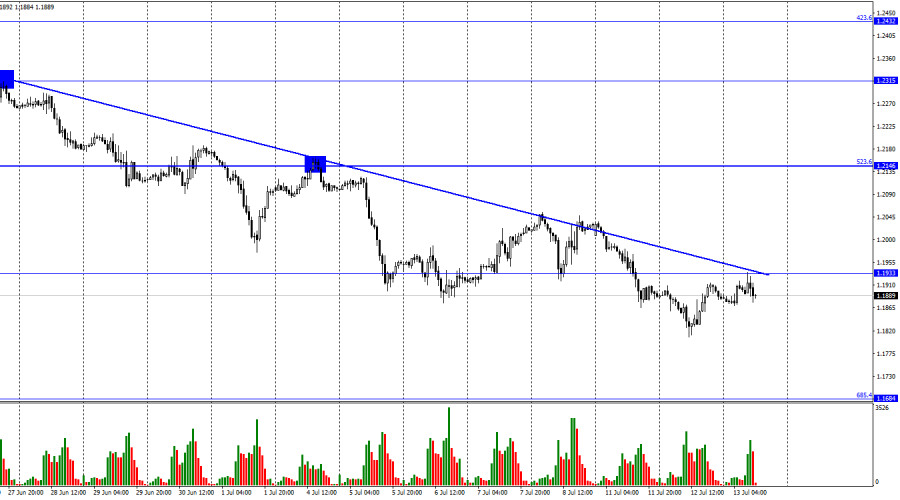
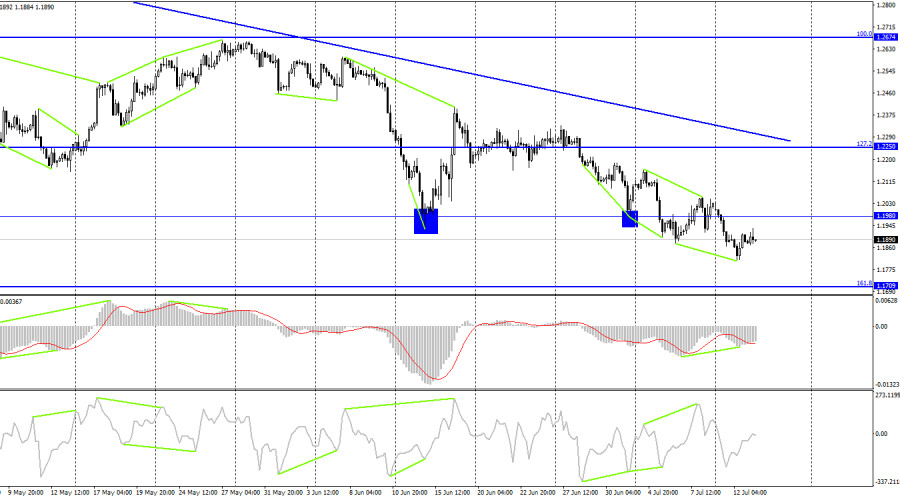
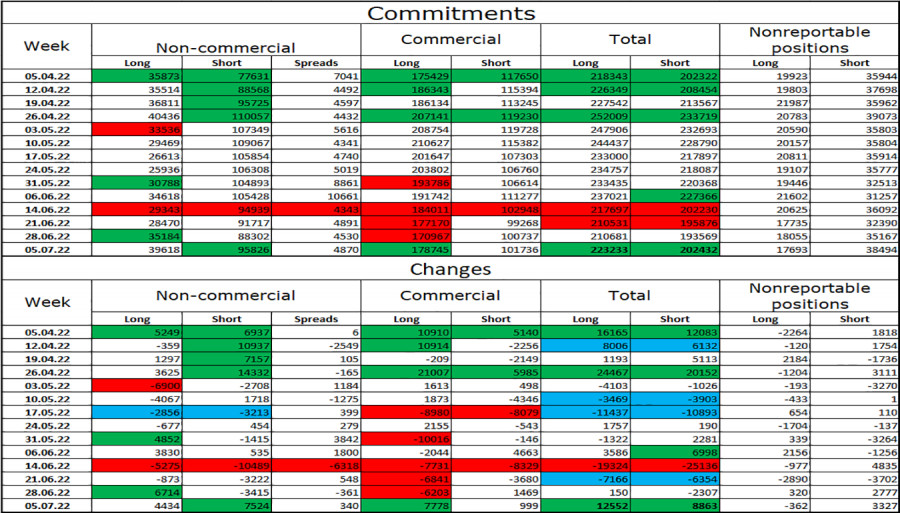
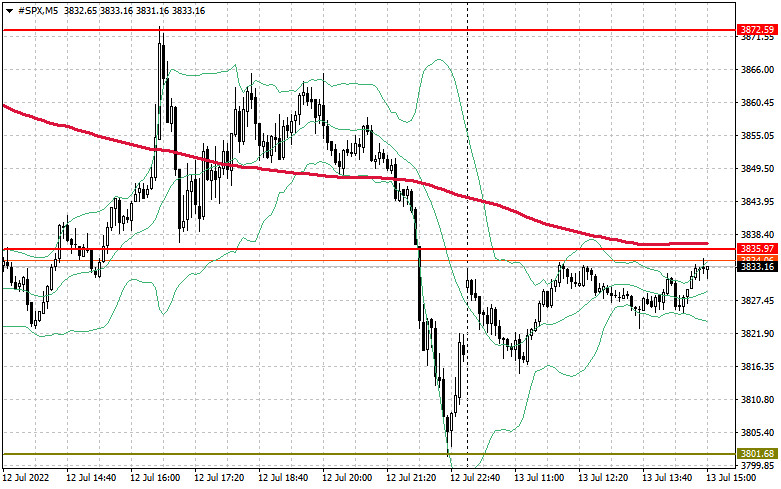
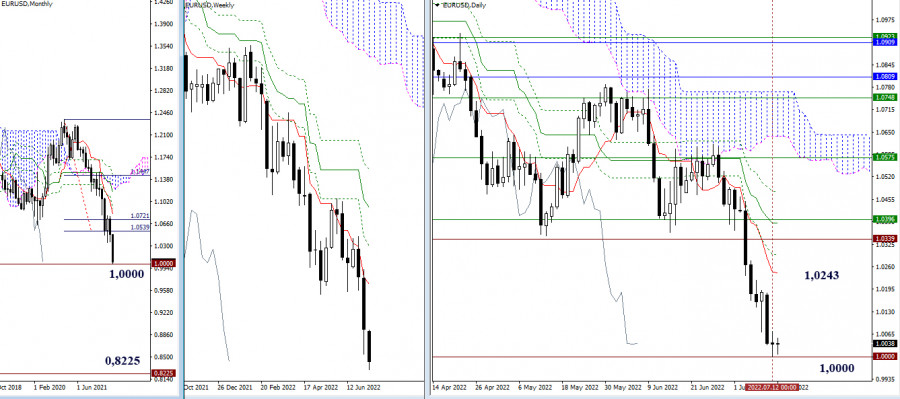
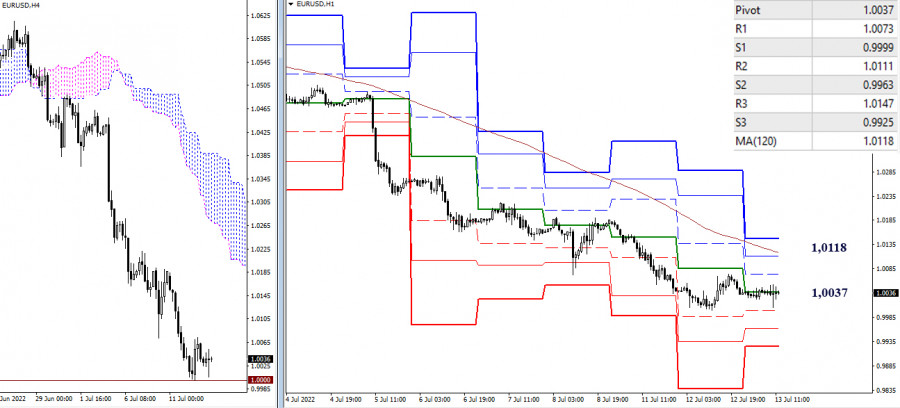
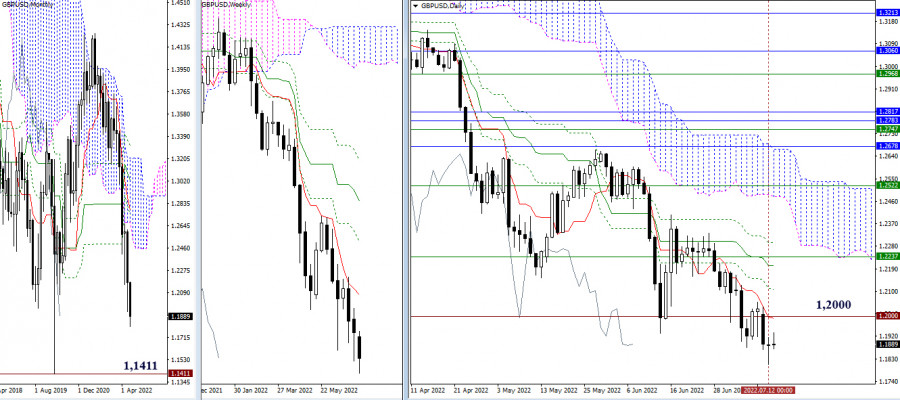
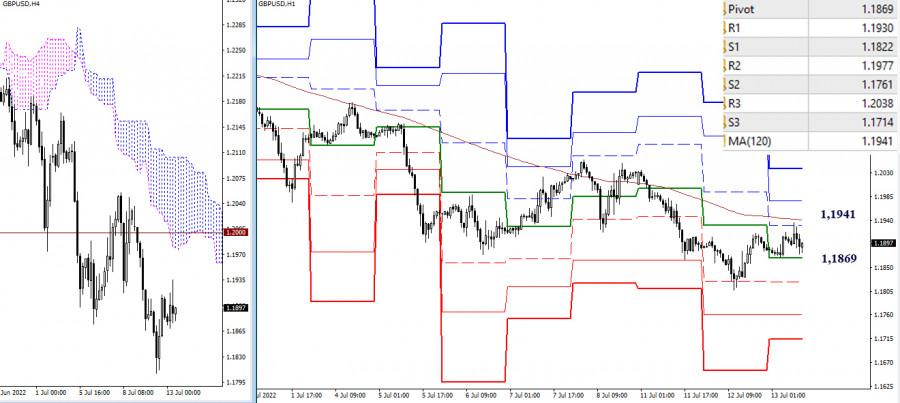
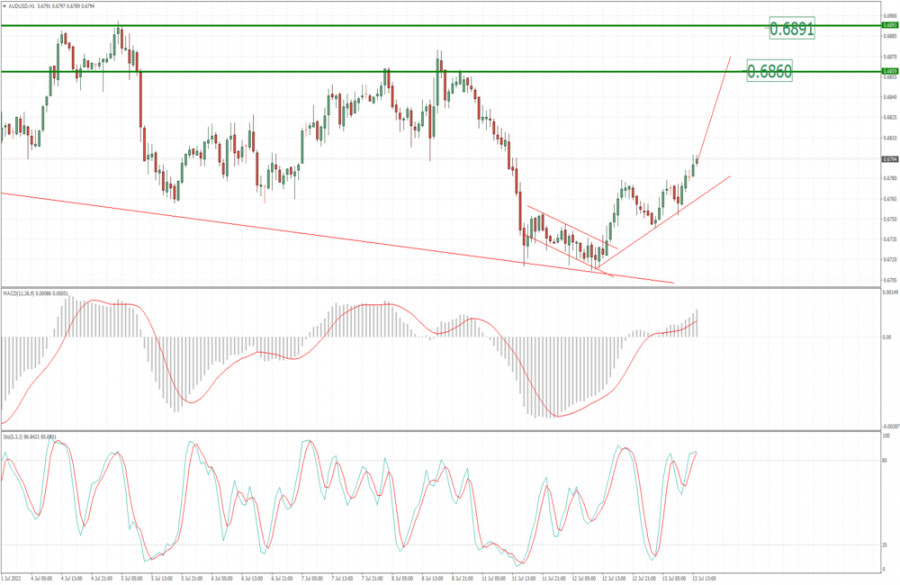
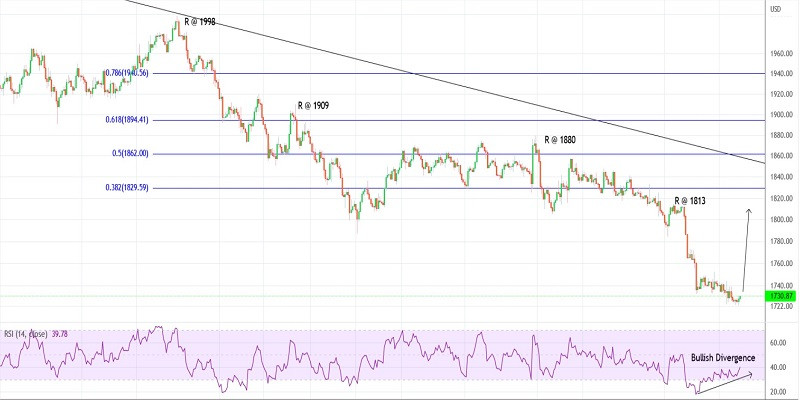
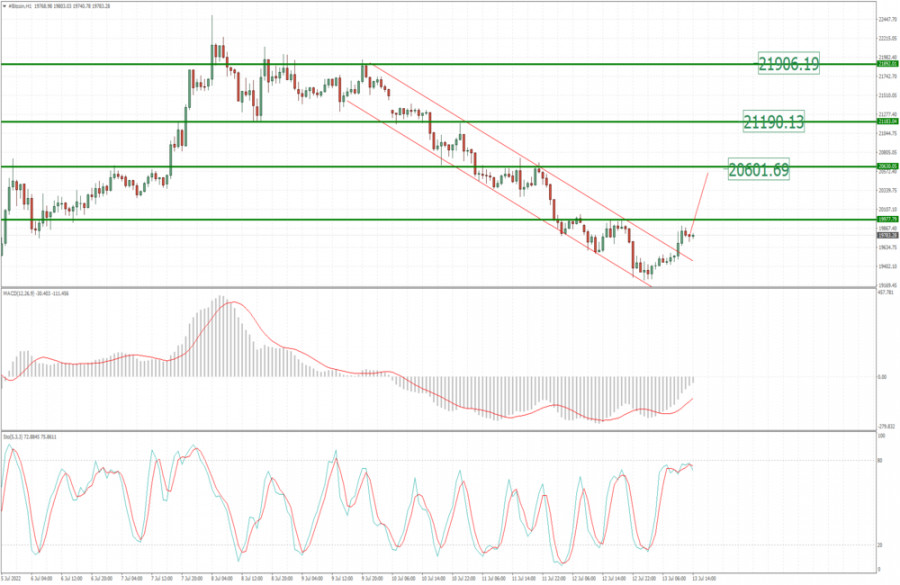
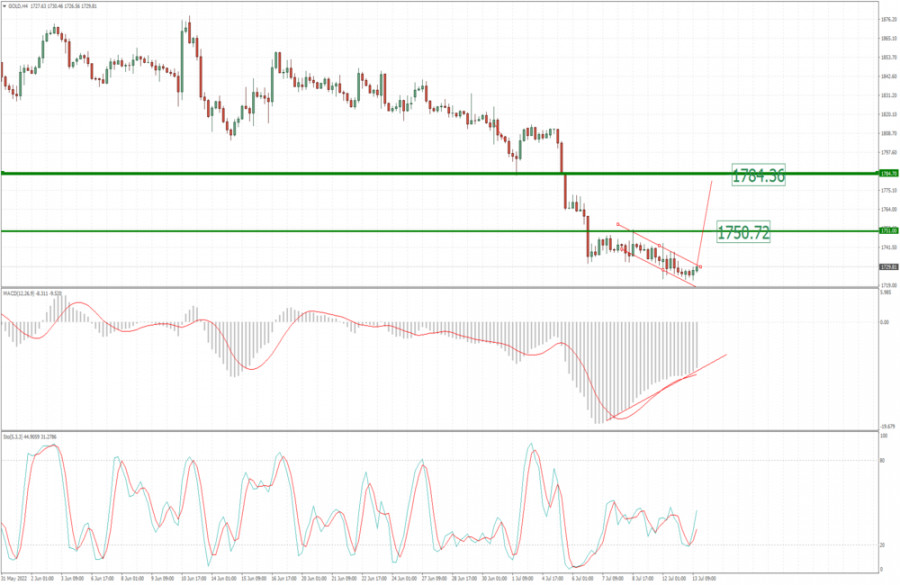

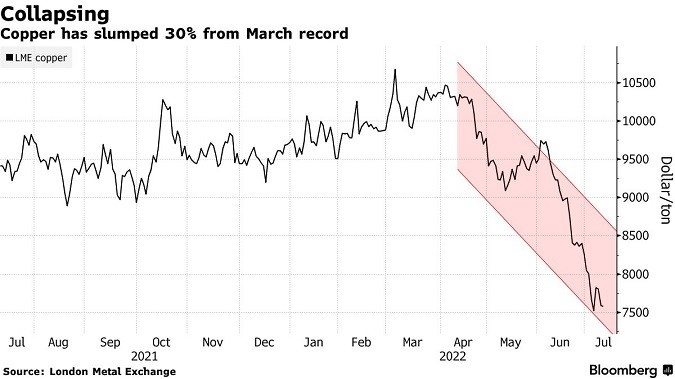
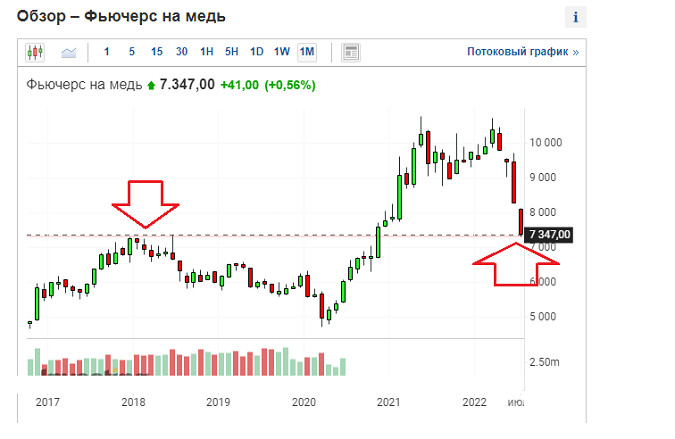


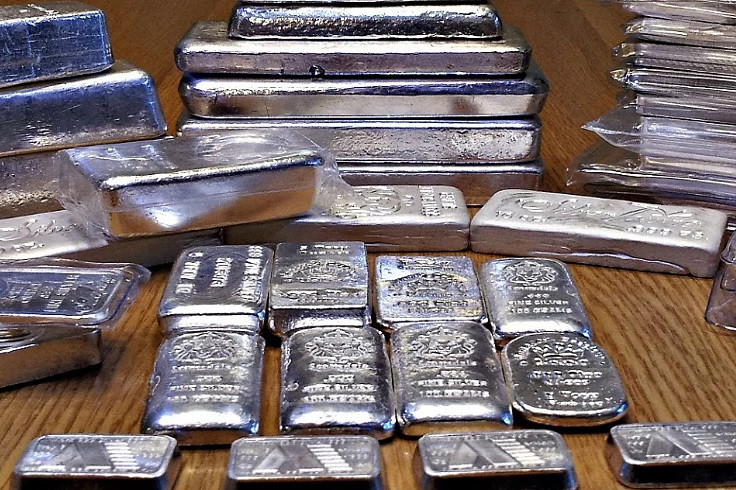
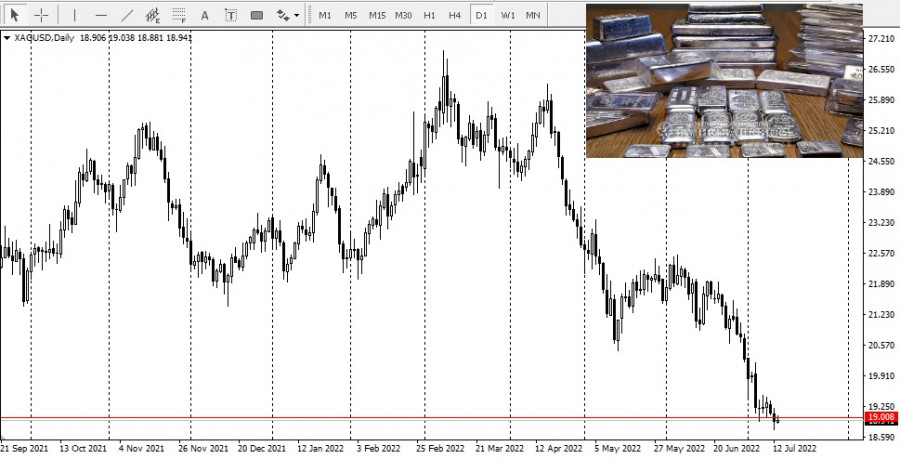 According to analysts, silver is suffering as the US dollar continues its rally, trading at a new 20-year high. At the same time, the precious metal is also following industrial metals lower as recession fears continue to grow. Along with silver, copper prices have dropped below critical support at $3.50 a pound, falling to their lowest level since November 2020.
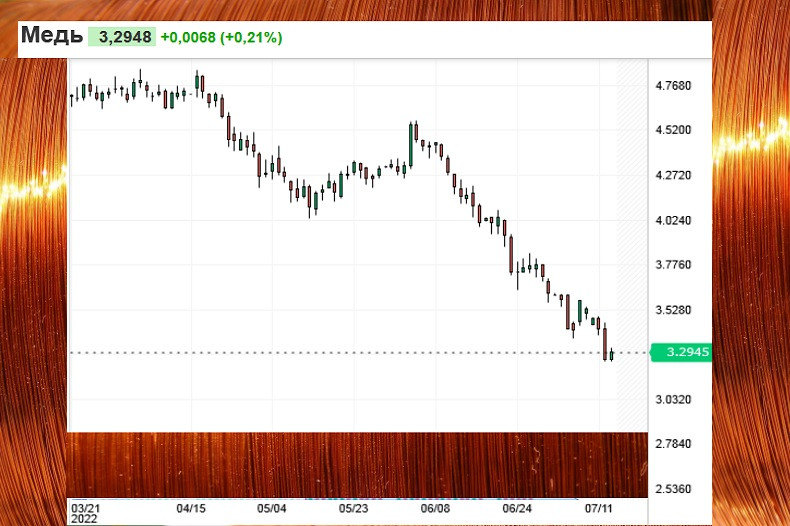
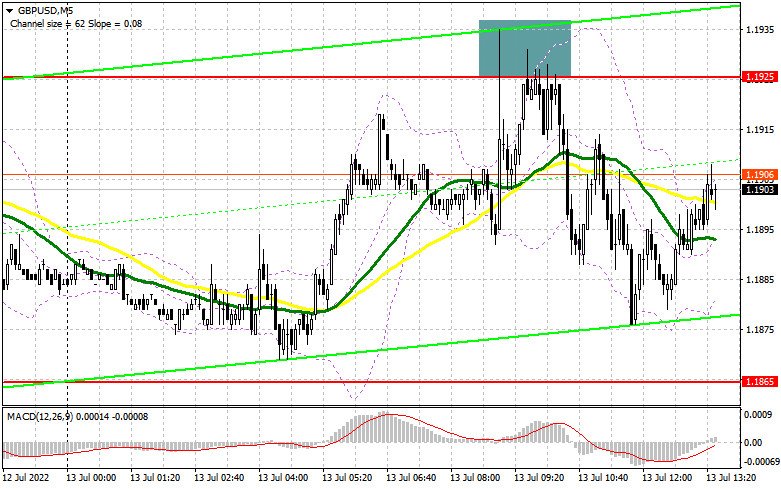
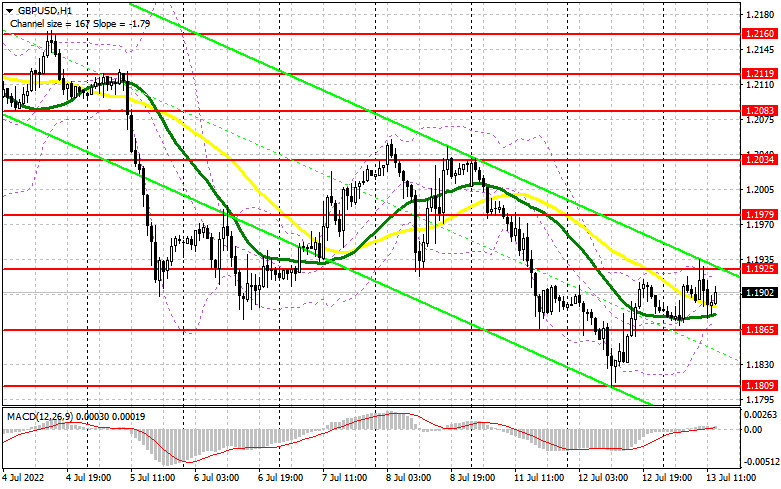
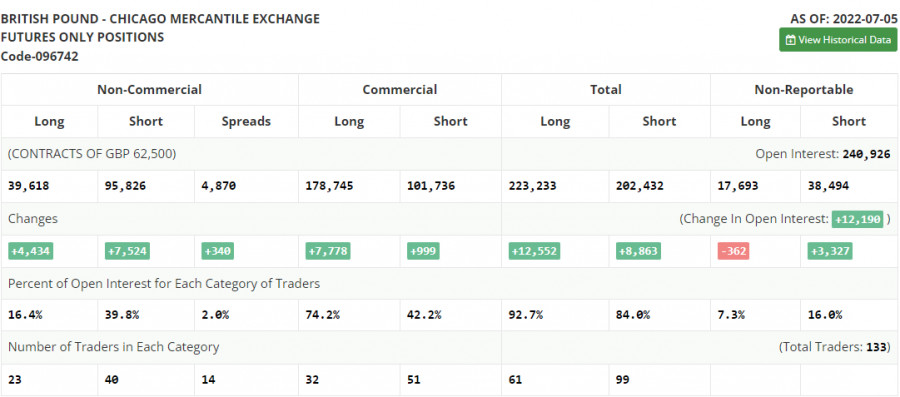
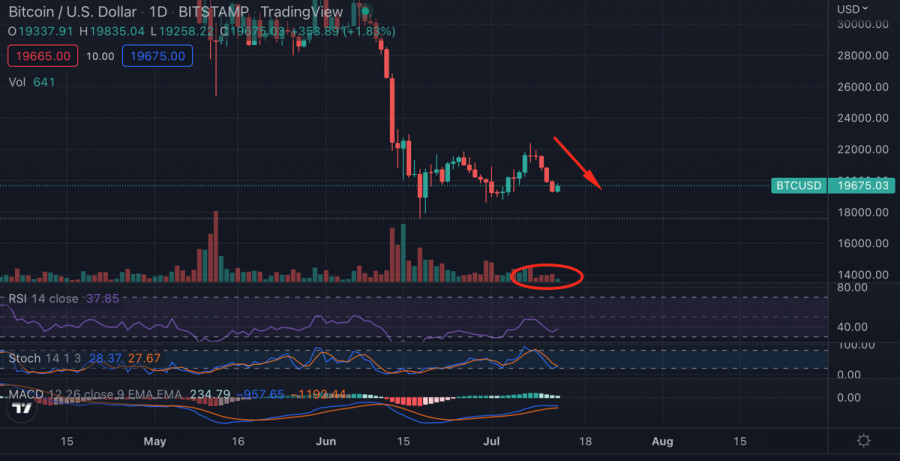
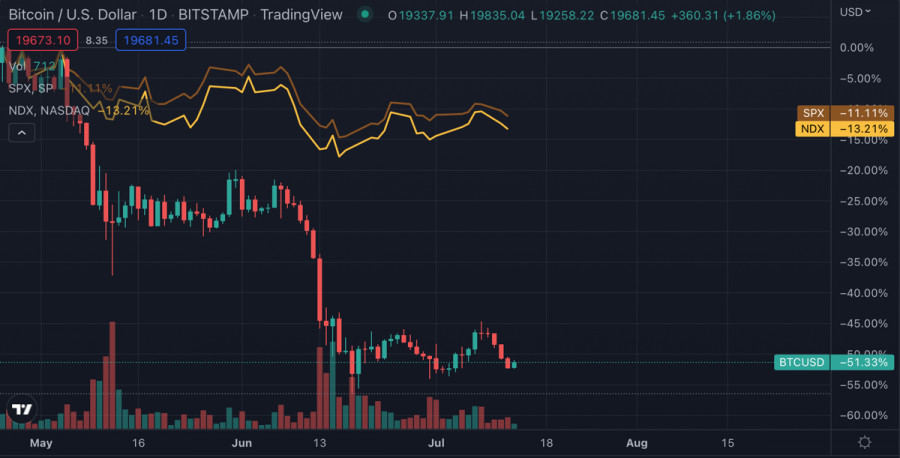
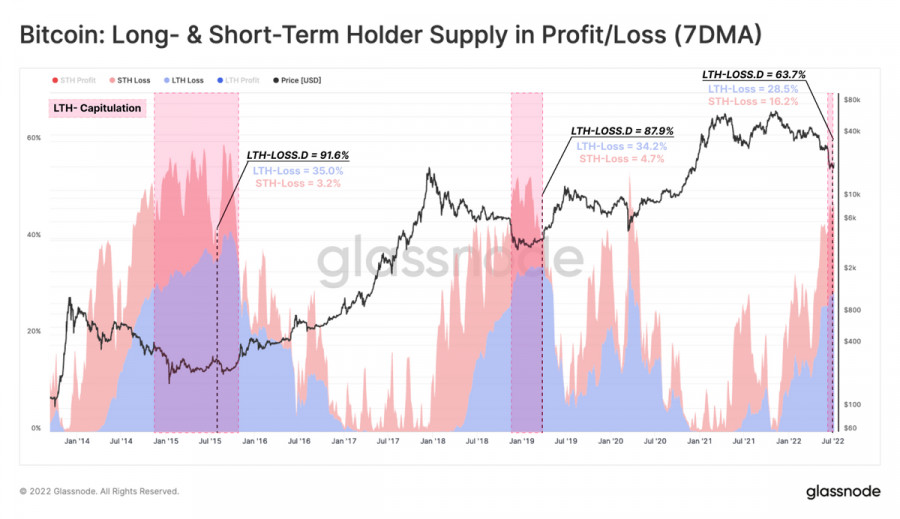
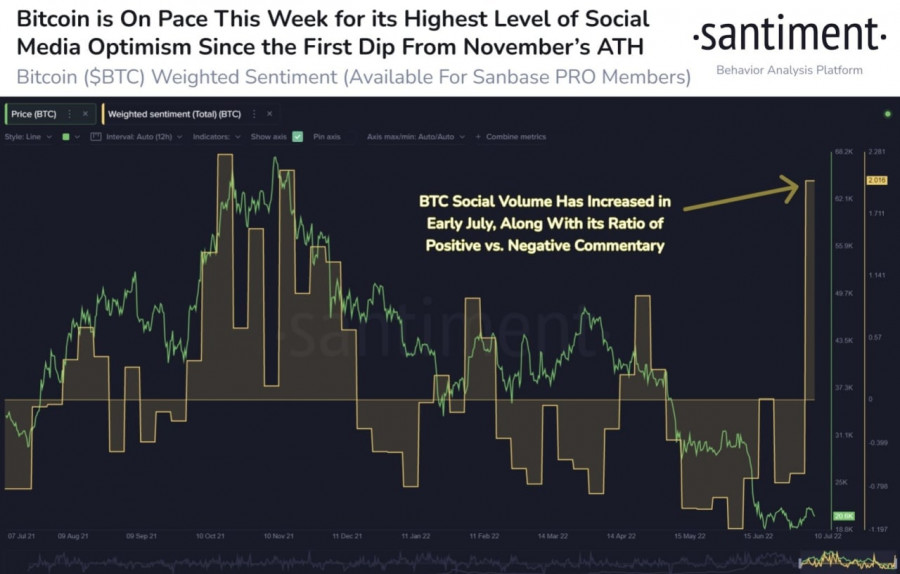
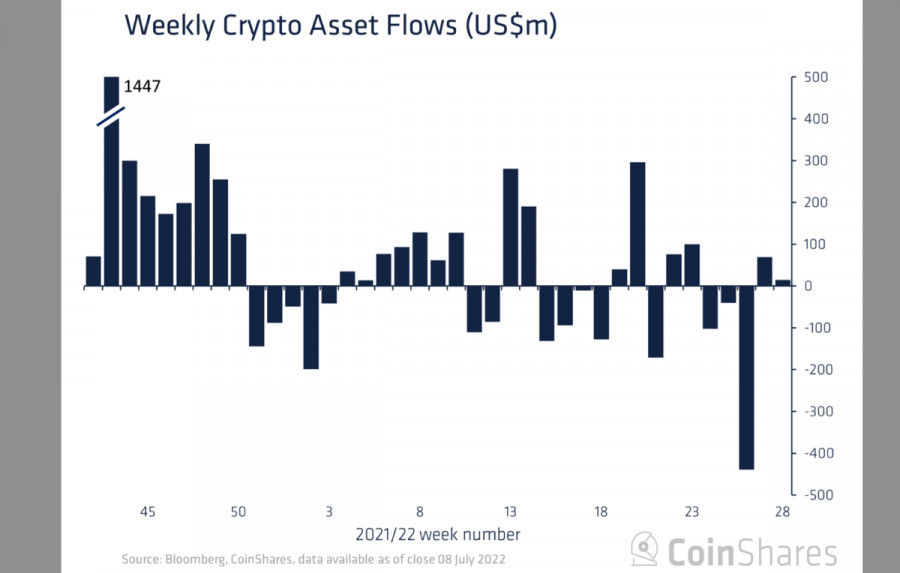
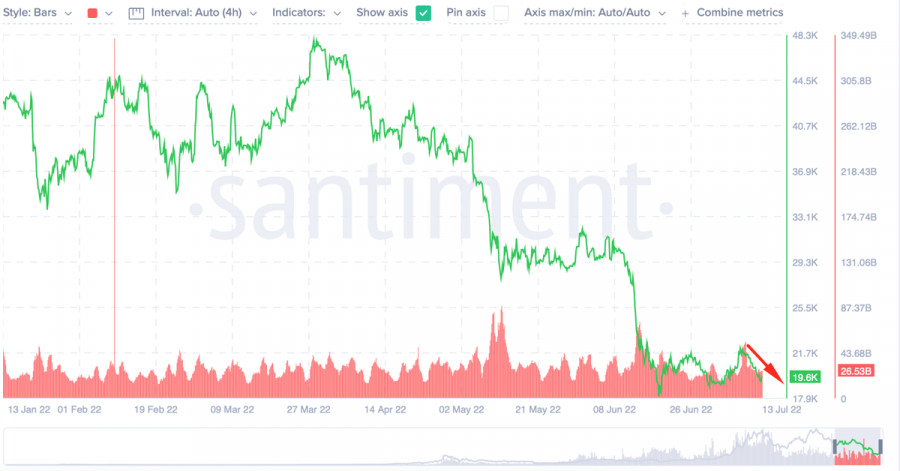
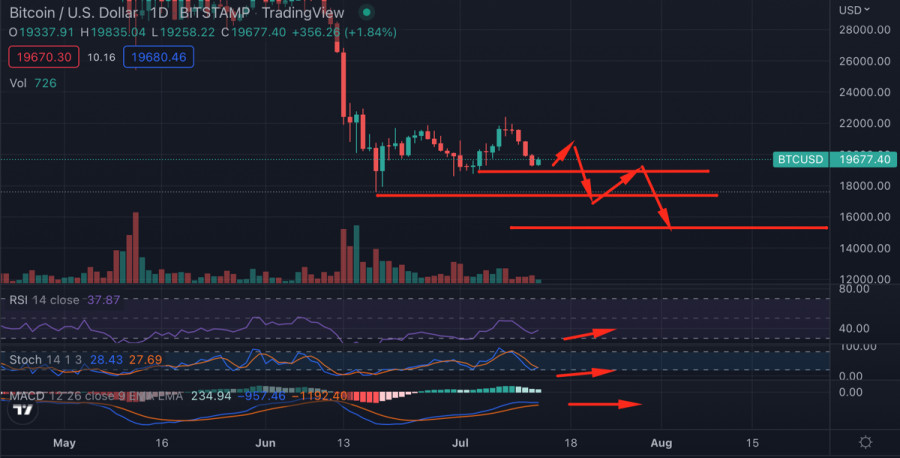
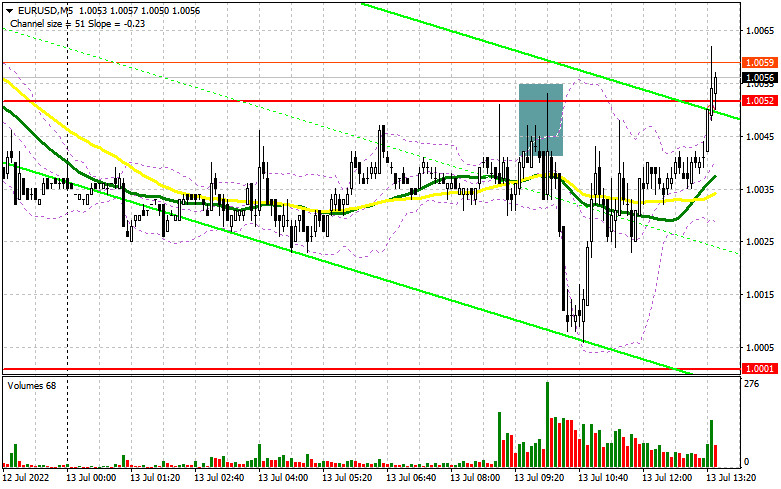
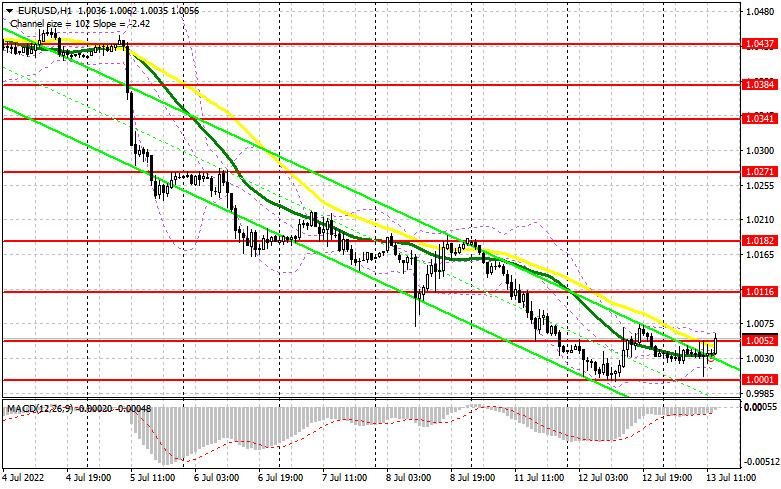
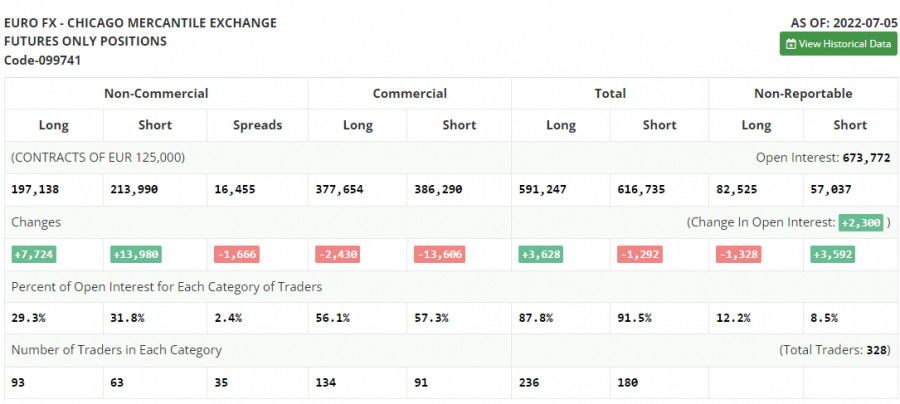
| You are subscribed to email updates from Forex analysis review. To stop receiving these emails, you may unsubscribe now. | Email delivery powered by Google |
| Google, 1600 Amphitheatre Parkway, Mountain View, CA 94043, United States | |


Comments