Forex analysis review
Forex analysis review |
- Technical analysis of GBP/USD for July 19, 2022
- How to trade GBP/USD on July 20? Simple tips for beginners.
- How to trade EUR/USD on July 20? Simple tips for beginners.
- Lagarde's hard work before the bet
- July 19, 2022 : EUR/USD daily technical review and trading opportunities.
- July 19, 2022 : EUR/USD Intraday technical analysis and trading plan.
- July 19, 2022 : GBP/USD Intraday technical analysis and significant key-levels.
- Short-term technical analysis on Ethereum for July 19th, 2022.
- USDJPY challenges lower wedge boundary.
- Gold price remains under pressure despite Dollar weakness.
- Short-term technical analysis on EURUSD for July 19th, 2022.
- Oil has surfaced
- EUR/USD. Insider surprise for the euro
- EUR/USD: ECB and EC's will to fight energy crisis pushed bulls to attack
- Trading Signal for GOLD (XAU/USD) for July 19 - 20, 2022: buy above $1,711 (-1/8 Murray - 21 SMA)
- Technical analysis recommendations on EUR/USD and GBP/USD for July 19, 2022
- AUD/USD Technical Analysis and Trading Tips for July 19, 2022
- GBP/USD analysis on July 19. The pound is growing with difficulty, and statistics from the UK do not help.
- Crypto winter will continue for another 250 days: Grayscale
- BTC update for July 19,.2022 - Watch for the breakout of the symmetrical tirangle
- EUR/USD analysis on July 19
- Analysis of Gold for July 19,.2022 - Watch for the breakout of the symmetrical triangle pattern
- Trading Signal for USD/JPY for July 19 - 20, 2022: key level 137.50 (8/8 Murray - 21 SMA)
- US Premarket for July 19: US companies lower future profit forecasts
- Fall of Three Arrows Capital and Crypto Lender Celsius exposes cracks in global crypto regulation
| Technical analysis of GBP/USD for July 19, 2022 Posted: 19 Jul 2022 02:48 PM PDT
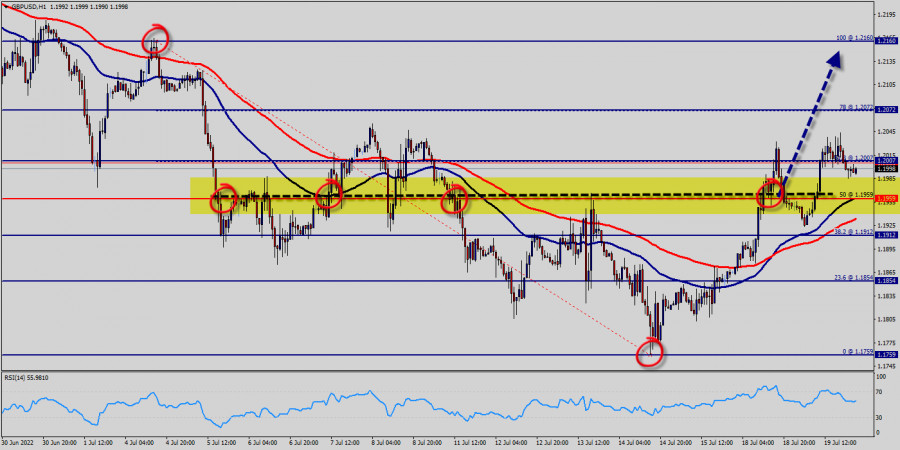
The GBP/USD pair faced strong support at the level of 1.1959 because resistance became support. The strong resistance has been already faced at the level of 1.2007 and the pair is likely to try to approach it in order to test it again. The level of 1.1959 represents a weekly pivot point for that it is acting as minor support this week. Furthermore, the GBP/USD pair is continuing to trade in a bullish trend from the new support level of 1.1959. Currently, the price is in a bullish channel. According to the previous events, we expect the GBP/USD pair to move between 1.1959 and 1.2072. Also, it should be noticed that the double top is set at 1.2160. Additionally, the RSI is still signaling that the trend is upward as it remains strong above the moving average (100). This suggests the pair will probably go up in coming hours. Accordingly, the market is likely to show signs of a bullish trend. In other words, buy orders are recommended above 1.1959 with the first target at the level of 1.2072. If the trend is be able to break the double top at the level of 1.2160, then the market will continue rising towards the weekly resistance 2 at 1.2160. Thus, the market is indicating a bullish opportunity above the above-mentioned support levels, for that the bullish outlook remains the same as long as the 100 EMA is headed to the upside. On the other hand, if the GBP/USD pair fails to break through the resistance level of 1.2007, the market will decline further to 1.1959. The pair is expected to drop lower towards at least 1.1959 with a view to test the weekly pivot point. Also, it should be noted that the weekly pivot point will act as minor support today. The material has been provided by InstaForex Company - www.instaforex.com |
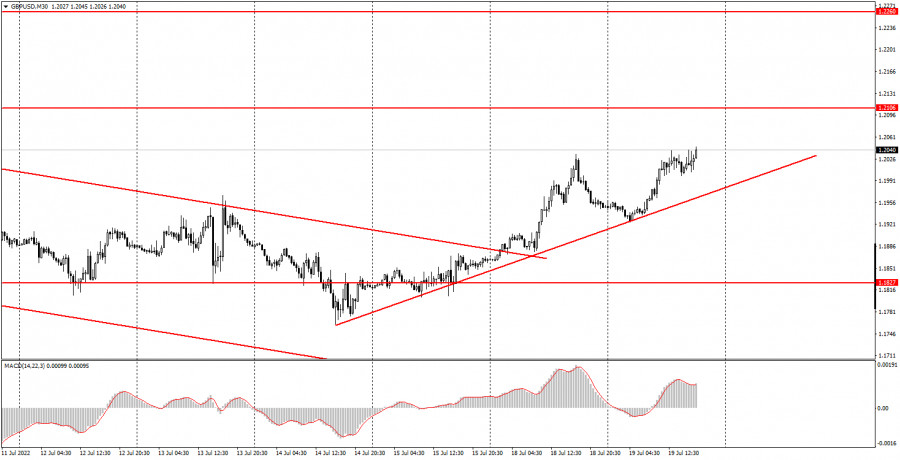
| How to trade GBP/USD on July 20? Simple tips for beginners. Posted: 19 Jul 2022 02:34 PM PDT Analysis of Tuesday's deals:30M chart of the GBP/USD pair
The GBP/USD pair also continued its upward movement on Tuesday, but less strong than the EUR/USD pair. An ascending trend line was also formed along three reference points. However, this trend line is weaker than the one for the euro. In any case, the euro and the pound are trading very similarly, so overcoming one trend line will most likely mean the fall of both pairs. Thus, the British currency is still fully enjoying the given chance for growth, but how long it will continue is an open question. Today's British statistics did not provide any support to the pound, but did not provoke shorts either. The unemployment rate remained unchanged in June, while wages grew weaker than expected. Both reports ended up being extremely tasteless and should have caused the pound to fall rather than rise. However, following the general trend of the weakening of the US currency, the pound/dollar pair still continued its upward movement. The most important inflation report will be released in Britain on Wednesday, after which it will be possible to draw certain conclusions. 5M chart of the GBP/USD pair
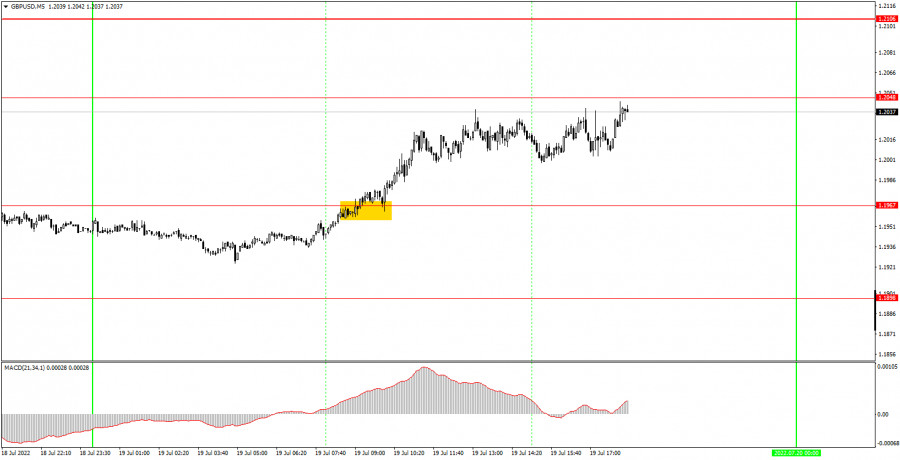
The movement and signals on the 5-minute timeframe on Tuesday were also almost perfect. The pair moved only in one direction all day, and only one trading signal was formed. The pair overcame the level of 1.1967 at the beginning of the European trading session, after which it managed to rise almost to the target level of 1.2048, only three points short of it. However, this shortfall can be considered a "rebound with an error." Therefore, a long position should have been closed on this sell signal. Profit on a long position was about 50 points. Clearly, it was not necessary to work out the sell signal, since it was formed too late in time. Thus, one signal, one trade, profit - a perfect trading day. We can only hope that there are more days like this. How to trade on Wednesday:The pair continues its upward movement on the 30-minute TF, which is already supported by the trend line. Thus, for now, the pound has a good chance of growth, although it is growing slightly weaker than the euro. However, if the inflation report fails again today, this could trigger an increase in the upward movement, as it will mean an increase in the likelihood of a stronger tightening of monetary policy by the Bank of England at the next meeting, which will be held in early August. On the 5-minute TF on Wednesday it is recommended to trade at the levels 1.1807-1.1827, 1.1898, 1.1967, 1.2048, 1.2106, 1.2170. When the price passes after opening a deal in the right direction for 20 points, Stop Loss should be set to breakeven. The UK inflation report will be released on Wednesday, and the calendar of events in the US is completely empty. Thus, early in the morning, traders will receive momentum for the whole day. Of course, this momentum will not be related to the euro/dollar pair, but there were no reasons for the growth of the British currency on Tuesday either, nevertheless, we saw its new strengthening. Basic rules of the trading system:1) The signal strength is calculated by the time it took to form the signal (bounce or overcome the level). The less time it took, the stronger the signal. 2) If two or more deals were opened near a certain level based on false signals (which did not trigger Take Profit or the nearest target level), then all subsequent signals from this level should be ignored. 3) In a flat, any pair can form a lot of false signals or not form them at all. But in any case, at the first signs of a flat, it is better to stop trading. 4) Trade deals are opened in the time period between the beginning of the European session and until the middle of the US one, when all deals must be closed manually. 5) On the 30-minute TF, using signals from the MACD indicator, you can trade only if there is good volatility and a trend, which is confirmed by a trend line or a trend channel. 6) If two levels are located too close to each other (from 5 to 15 points), then they should be considered as an area of support or resistance. On the chart: Support and Resistance Levels are the Levels that serve as targets when buying or selling the pair. You can place Take Profit near these levels. Red lines are the channels or trend lines that display the current trend and show in which direction it is better to trade now. The MACD indicator (14,22,3) consists of a histogram and a signal line. When they cross, this is a signal to enter the market. It is recommended to use this indicator in combination with trend lines (channels and trend lines). Important speeches and reports (always contained in the news calendar) can greatly influence the movement of a currency pair. Therefore, during their exit, it is recommended to trade as carefully as possible or exit the market in order to avoid a sharp price reversal against the previous movement. Beginners on Forex should remember that not every single trade has to be profitable. The development of a clear strategy and money management are the key to success in trading over a long period of time. The material has been provided by InstaForex Company - www.instaforex.com |
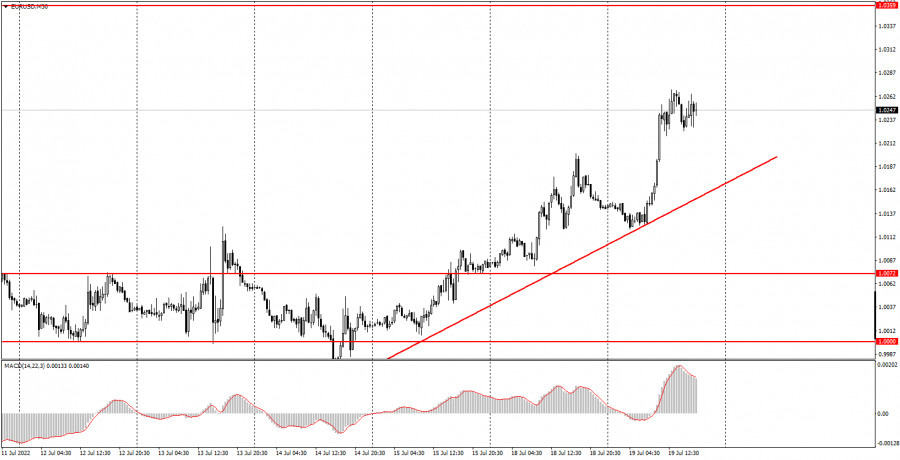
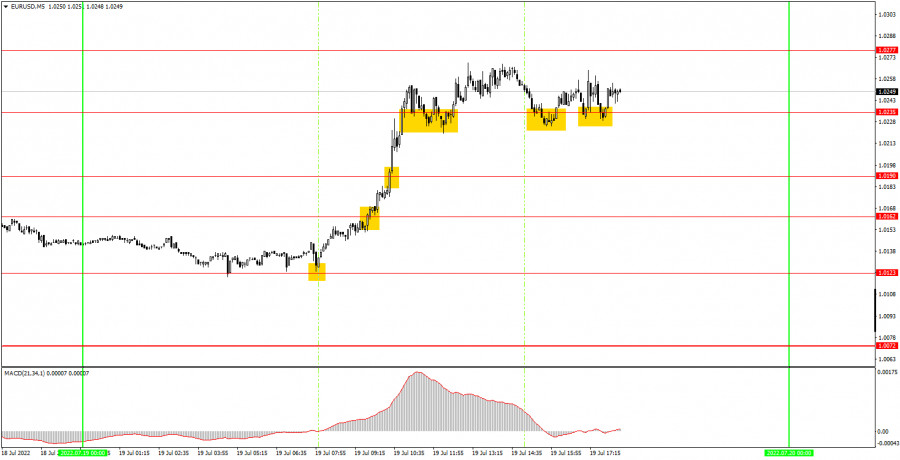
| How to trade EUR/USD on July 20? Simple tips for beginners. Posted: 19 Jul 2022 02:34 PM PDT Analysis of Tuesday's deals:30M chart of the EUR/USD pair
The EUR/USD currency pair continued its upward movement on Tuesday, as if nothing had happened. After the upward move continued for three days, we were able to form an uptrend line that now supports the bulls and is a great visualization of what is happening in the market. Today, traders had a reason to buy the euro, as the EU published a report on inflation, which showed its next acceleration to 8.6% Y/Y. The only problem was that the pair began to grow much earlier than the release of the report. Nevertheless, it is possible that traders started working on this report in advance, since it was not difficult to predict the next acceleration in price growth. Thus, the euro rose, most likely on the expectation that the European Central Bank will now raise its key rate by 0.5%, not 0.25%. From our point of view, this is a very presumptuous statement, but the main thing is what the majority of players in the market think. In any case, the euro fell in price very strongly and for a very long time, therefore it deserved at least a technical upward correction. Now, until the price settles below the trend line, the upward trend will continue. 5M chart of the EUR/USD pair
The trading signals on the 5 minute time frame on Tuesday were very good because the movement during the day was very good. Although a really trendy movement was observed only in the European trading session, it was possible to make good money even on it. The first signal to buy with an error of 1 point was formed near the level of 1.0123. The price rebounded from this level and rushed up, breaking the levels of 1.0162, 1.0190 and 1.0235. The pair failed to settle below the level of 1.0235, although it tried to do so at least three times. There was no other sell signal either. Therefore, novice traders had to open only one trade on Tuesday - to buy. It had to be closed manually in the late afternoon, and the profit on it was about 110 points. One trade, strong trending movement, no false signals - almost a perfect day. How to trade on Wednesday:The downward trend has finally reversed on the 30-minute timeframe as the pair has been rising for more than three days now. Now, while the price is above the trend line, we can expect further movement to the upside. Of course, we still doubt that the euro is able to grow long and strong in the current circumstances. Moreover, the results of the ECB meeting will be announced on Thursday, which can greatly affect the pair's movement. We think it's best to draw conclusions on Friday. On the 5-minute TF on Wednesday it is recommended to trade at the levels of 1.0123, 1.0162-1.0190, 1.0235, 1.0277, 1.0354. When passing 15 points in the right direction, you should set Stop Loss to breakeven. There will be no important reports or events on Wednesday in the European Union and America. Thus, there will be nothing for traders to react to during the day. Nevertheless, the pair continues to show enviable volatility and a good trend. Therefore, good movements can be observed on Wednesday. Basic rules of the trading system:1) The signal strength is calculated by the time it took to form the signal (bounce or overcome the level). The less time it took, the stronger the signal. 2) If two or more deals were opened near a certain level based on false signals (which did not trigger Take Profit or the nearest target level), then all subsequent signals from this level should be ignored. 3) In a flat, any pair can form a lot of false signals or not form them at all. But in any case, at the first signs of a flat, it is better to stop trading. 4) Trade deals are opened in the time period between the beginning of the European session and until the middle of the US one, when all deals must be closed manually. 5) On the 30-minute TF, using signals from the MACD indicator, you can trade only if there is good volatility and a trend, which is confirmed by a trend line or a trend channel. 6) If two levels are located too close to each other (from 5 to 15 points), then they should be considered as an area of support or resistance. On the chart: Support and Resistance Levels are the Levels that serve as targets when buying or selling the pair. You can place Take Profit near these levels. Red lines are the channels or trend lines that display the current trend and show in which direction it is better to trade now. The MACD indicator (14,22,3) consists of a histogram and a signal line. When they cross, this is a signal to enter the market. It is recommended to use this indicator in combination with trend lines (channels and trend lines). Important speeches and reports (always contained in the news calendar) can greatly influence the movement of a currency pair. Therefore, during their exit, it is recommended to trade as carefully as possible or exit the market in order to avoid a sharp price reversal against the previous movement. Beginners on Forex should remember that not every single trade has to be profitable. The development of a clear strategy and money management are the key to success in trading over a long period of time. The material has been provided by InstaForex Company - www.instaforex.com |
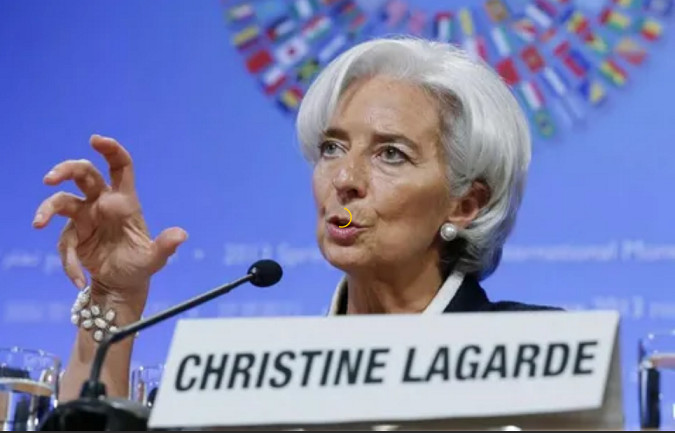
| Lagarde's hard work before the bet Posted: 19 Jul 2022 02:34 PM PDT
European Central Bank President Christine Lagarde is redoubling efforts to reach an agreement on a still-in-progress new bailout mechanism, people familiar with the matter said. Two days before Thursday's decision, policymakers still have to work to reach an agreement on a measure that could stop market speculation on weaker eurozone members. Officials are debating the instrument, along with the question of whether to effectively waive the quarter-point rate hike advance or double it. A larger increase could be part of a compromise in negotiations on an anti-crisis mechanism. Along with lingering legal issues, outstanding issues include conditions that countries that benefit from the ECB's bond purchases will have to comply, the people said. These could include prudent fiscal policy, with some officials pushing to involve the European Commission, the European Stability Mechanism or both, rather than being the sole judge, they said. An ECB spokesman declined to comment, citing a period of calm ahead of this week's policy meeting. Markets are betting 40% on a half-point rate hike this week but cut bets on subsequent results, estimating a 97 basis point tightening by September after an earlier one percentage point increase. The euro rose 1.2% against the dollar to $1.0269, the highest since July 6.
Lack of agreement on a so-called "Protection Mechanism" may leave Lagarde with only a far-fetched result that can be made public for now. This may lead to the prospect of a longer decision-making process to complete the development of a credible measure. The risk of such an outcome is that it could trigger another surge in financial market speculation about the ECB's determination to protect the integrity of the euro, which recently fell to parity with the dollar for the first time in two decades. The lack of an announcement of an anti-crisis tool in June, combined with global turmoil due to elevated US inflation, prompted Lagarde to call an emergency meeting, where she secured a promise from her colleagues that such a tool would be created. Bundesbank President Joachim Nagel has outlined the strict limits he sees as necessary for any agreement. He is concerned that the ECB's single-country bond purchases could violate the central bank's ban on government funding. Any new instrument is likely to face legal challenges that will lead to scrutiny by Germany's constitutional court. Another question is how long the ECB will hold the bonds it buys. Whereas previous programs have specifically allowed the central bank to sell assets if they are no longer needed, politicians have never actively done so so far. Governing Council Francois Villeroy de Gallo said this month that the ECB should be able to part with bonds before they mature. The material has been provided by InstaForex Company - www.instaforex.com |
| July 19, 2022 : EUR/USD daily technical review and trading opportunities. Posted: 19 Jul 2022 10:39 AM PDT
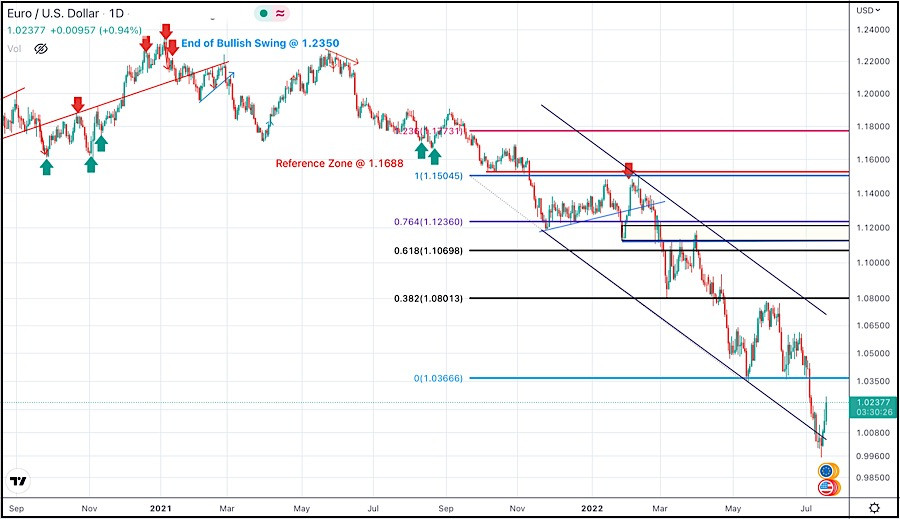
In late September, Re-closure below the price level of 1.1700 has initiated downside-movement towards 1.1500 where some recovery was witnessed. Shortly after, Price levels around 1.1700 managed to hold prices for a short period of time before another price decline took place towards 1.1200. Then the EURUSD has temporarily moved-up within the depicted movement channel until downside breakout occurred recently. Since then, the price zone around 1.1500 has applied significant SELLING pressure when a valid SELL Entry was offered upon the previous ascending movement towards it. Shortly after, the EURUSD found support while approaching the price levels of 1.0800 few weeks ago. That's where the recent upside movement was previously initiated. However, the recent movement towards 1.1200 was considered for another SELL Trade which already reached its targets. Any ascending movement towards 1.0800 should be watched for selling pressure where a new downside movement can be established. The material has been provided by InstaForex Company - www.instaforex.com |
| July 19, 2022 : EUR/USD Intraday technical analysis and trading plan. Posted: 19 Jul 2022 10:36 AM PDT
The recent movement towards 1.1200 was suggested for another SELL opportunity which already reached its targets beyond the price level of 1.0400. The previous ascending movement above 1.0600 enabled further advancement towards 1.0800 where evident bearish rejection arised again. The EURUSD pair had been trapped between 1.0350 (the newly recorded Low) and 1.0750 which corresponds to the nearest existing SUPPLY level until bearish breakout below 1.0350 was recently achieved. Shortly after, the pair was approaching new price levels around 1.0000 that haven't been visited since 2002. That's where price action was watched for significant bullish recovery especially around such an important psychological support. The nearest supply level is located around 1.0350. The material has been provided by InstaForex Company - www.instaforex.com |
| July 19, 2022 : GBP/USD Intraday technical analysis and significant key-levels. Posted: 19 Jul 2022 10:33 AM PDT
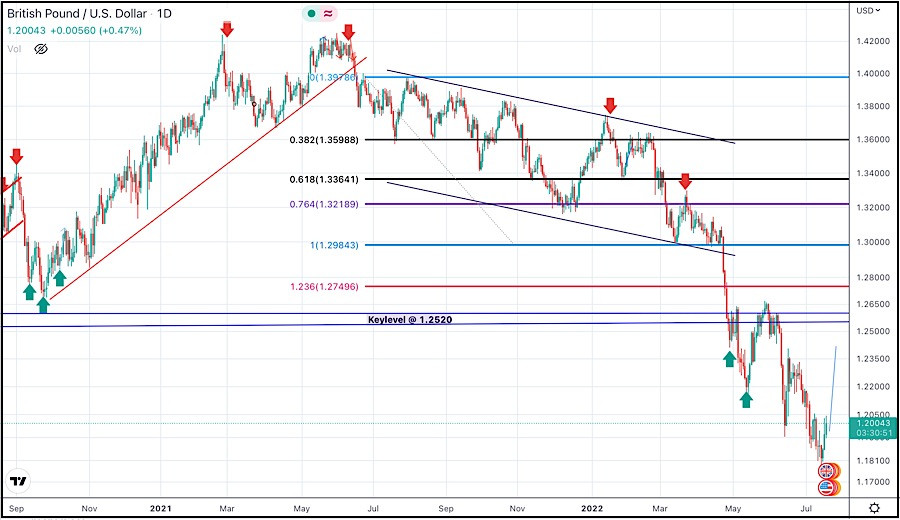
Recently, the GBP/USD pair remained under bearish pressure to challenge the new low around 1.2150 again which was temporarily bypassed few days go. Immediate bullish rejection was expressed around 1.1950 bringing the pair back above 1.2150 again towards higher price levels. Bullish persistence above 1.2300 (when achieved) will probably enable further bullish continuation towards 1.2550 and probably 1.2650 where further decisions can be taken. On the other hand, more bearish visits were expected to challenge the price level of 1.1950 when sufficient bearish momentum was expressed. Significant bullish recovery has been witnessed during the recent bearish dip that took place earlier few weeks ago. Recently the pair looke oversold while approaching these price levels. This favours the bullish scenario at least towards 1.2520 unless bearish persistence below 1.1900 is achieved towards 1.1650. The material has been provided by InstaForex Company - www.instaforex.com |
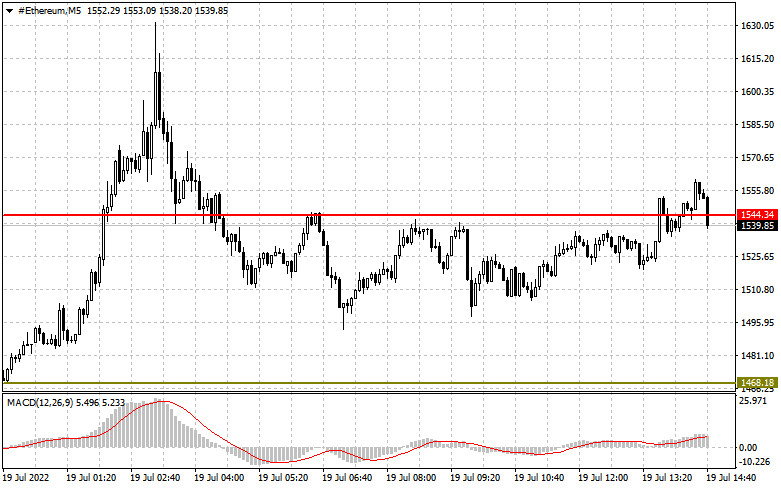
| Short-term technical analysis on Ethereum for July 19th, 2022. Posted: 19 Jul 2022 09:49 AM PDT
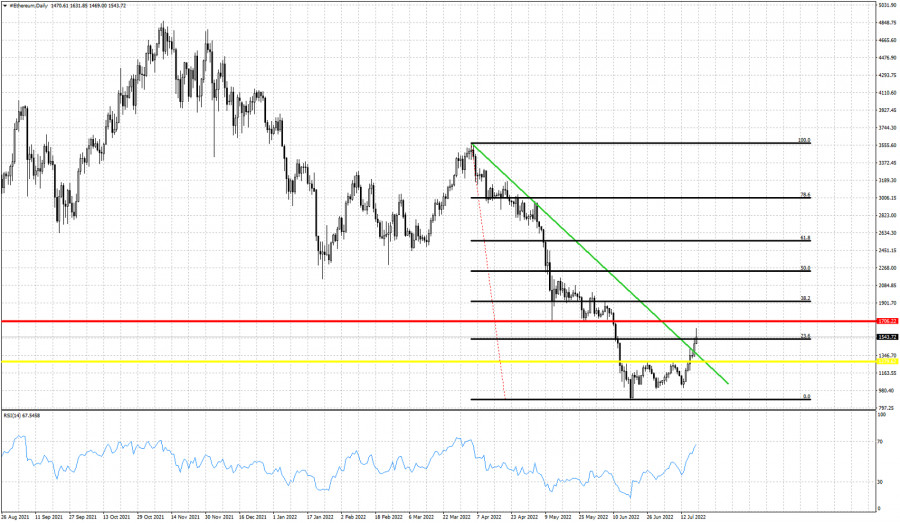
Red line -resistance Yellow line -resistance broken Green line- resistance broken Black lines- Fibonacci retracement Ethereum is showing promising signs as price has broken above short-term resistance at $1,280. We noted in our last analysis that a break above this level would bring price towards the green resistance trend line. Ethereum not only reached $1,400, it has also broken above it. Ethereum is now challenging the red horizontal resistance trend line. Next major target is the 38% Fibonacci retracement at $1,910. I believe it is possible for Ethereum to reach that levels but I would expect bears to be back and Ethereum under pressure again. The material has been provided by InstaForex Company - www.instaforex.com |
| USDJPY challenges lower wedge boundary. Posted: 19 Jul 2022 09:46 AM PDT
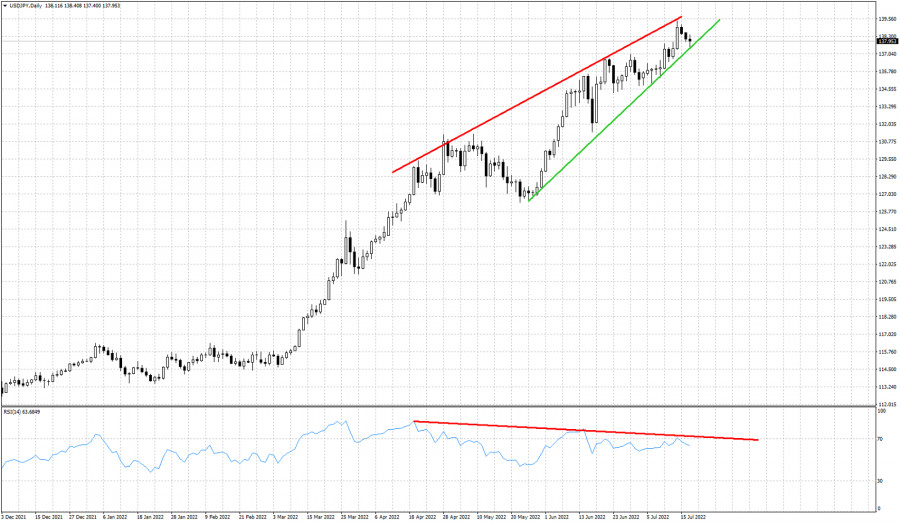
Red lines- bearish RSI divergence Green line- support trend line In recent analysis on USDJPY we noted that although trend remains bullish with price making higher highs and higher lows, there are increased chances of a major reversal. There is no reversal confirmation yet but price is very close to key support today. The RSI has provided us with the warning. The up trend is weakening. The RSI is making lower highs. Price is now challenging the green support trend line at 137.40. A break below this level will be the first sign of a reversal. Until then bulls remain in control and price inside the wedge pattern. As long as price holds above 137.40 we can see new 2022 highs. The material has been provided by InstaForex Company - www.instaforex.com |
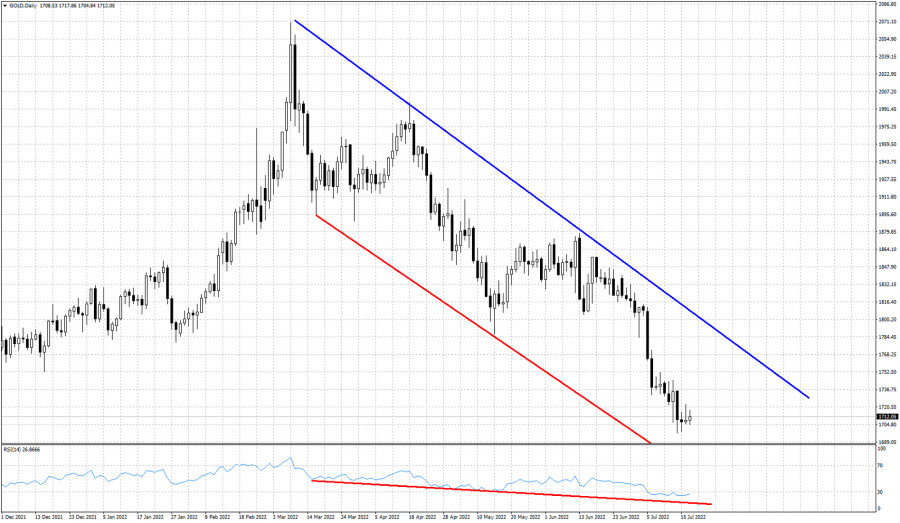
| Gold price remains under pressure despite Dollar weakness. Posted: 19 Jul 2022 09:43 AM PDT
Red lines- downward trend line Blue line- resistance trend line Gold price is trading still above $1,700. Despite Dollar weakness Gold bulls seem unable to push price above the short-term resistance of $1,720-25. Current market conditions justify a bounce in Gold's price towards $1,750-70 area. However there is no sign of such a move starting. Gold's RSI is at oversold levels. Gold remains in a bearish trend making lower lows and lower highs on a medium-term trend. In the short-term price has paused the decline just above $1,700. Price justifies a bounce higher but we consider the coming bounce only as a counter trend move. Gold is expected to move below $1,700 again in the future. The material has been provided by InstaForex Company - www.instaforex.com |
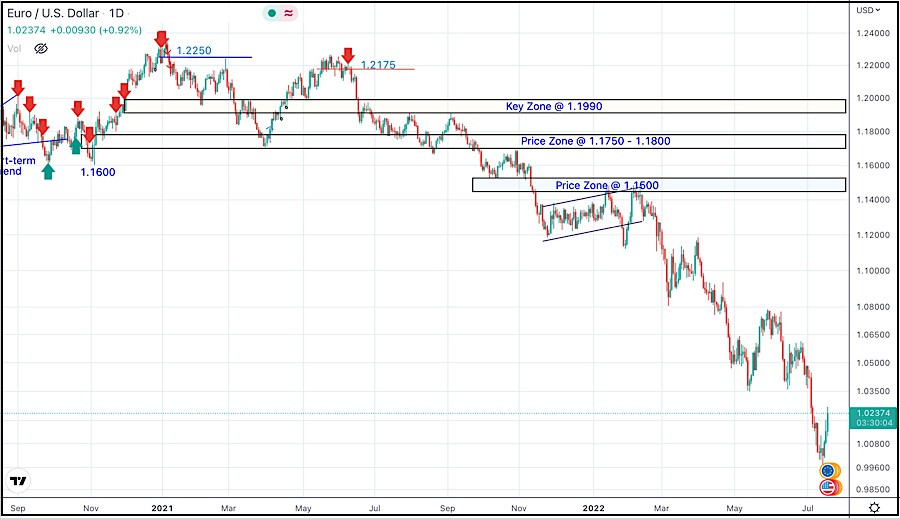
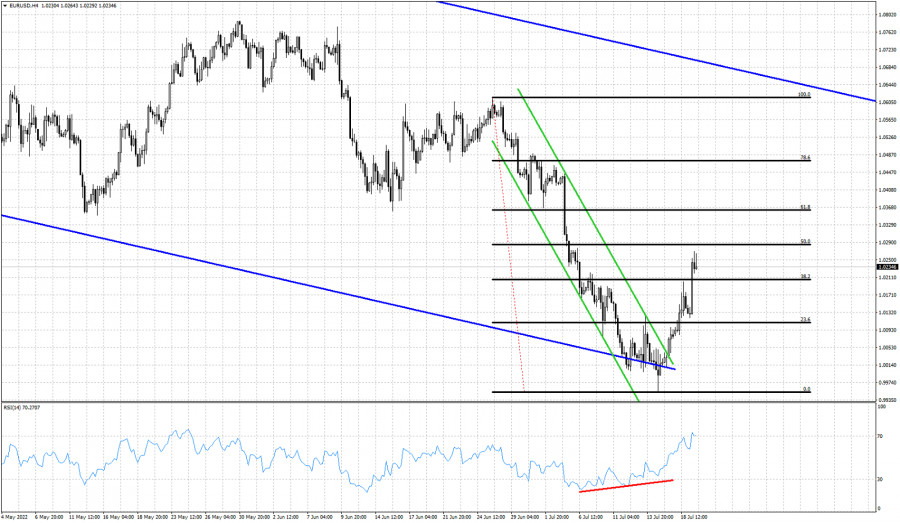
| Short-term technical analysis on EURUSD for July 19th, 2022. Posted: 19 Jul 2022 09:40 AM PDT
Red line -bullish divergence Blue lines- bearish medium-term channel Black lines- Fibonacci retracements Green lines- short-term bearish channel broken Following our expectations for a move above 1.02 EURUSD is moving higher making higher highs and higher lows in the 4 hour chart. Price as we mentioned before, has broken out of the short-term bearish channel. A bounce higher was justified also on a daily basis. The combination of the bullish RSI divergence with the break out above the green bearish channel increased the chances of a move higher. Price has already retraced more than 38% of the recent decline. Next resistance is at 1.0285 and most importantly at 1.0350. Previous support is now resistance. EURUSD can continue higher but we believe that this bounce is only a counter trend move. Bears are expected to be back and EURUSD under pressure again. Price is still inside the medium-term bearish channel. The material has been provided by InstaForex Company - www.instaforex.com |
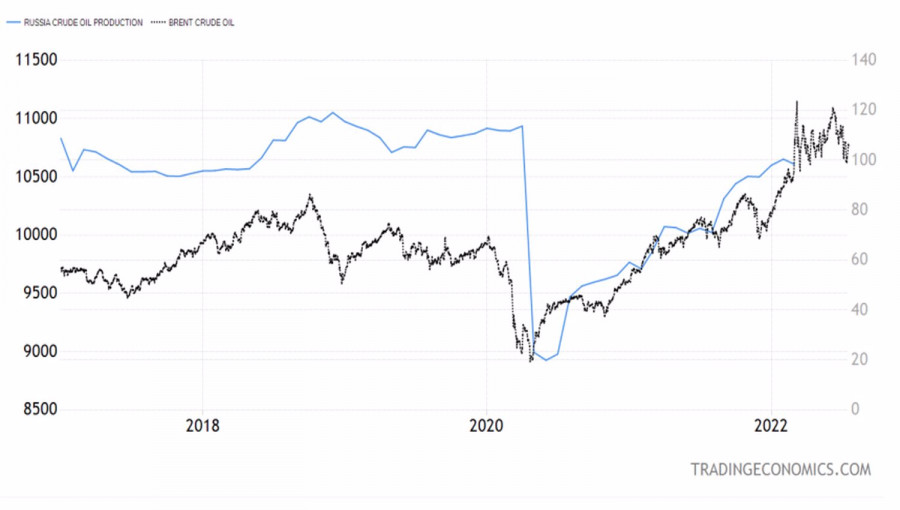
| Posted: 19 Jul 2022 09:33 AM PDT Brent's rise above $135 per barrel at the end of February was due to a combination of two factors: investor confidence in the rapid growth in demand against the background of the global economic recovery after the pandemic and the supply shock associated with concerns about the displacement of Russia from the market. In fact, everything turned out to be not so extreme. According to the IEA, Western sanctions against the Russian Federation have had less effect than originally expected, and the country continues to increase production. At the same time, fears of an imminent global recession are undermining demand. Bulls on the North Sea grade began to take profits, which lowered the quotes to the 5-month bottom. From which oil is trying to rebound. The nature of commodity markets is cyclical. Prices that are too high scare away consumers, which leads to lower prices. Oil is no exception. The global economy cannot sustain Brent at $120–125 per barrel. The North Sea variety simply does not find buyers at such a price. Especially at a time when central banks are raising rates like crazy in order to suppress excessively high inflation. The chances of a recession are growing like mushrooms after the rain, negatively affecting demand. The International Energy Agency (IEA) lowered its forecast for 2022 by 240,000 bpd to 99.2 million bpd. In 2023, the figure will be at 101.3 million bpd, which is also lower than previous estimates. The embargo of the United States, Britain and the EU on Russian oil has not yet brought results. The Russian Federation remains a major player in the oil market, and according to the IEA, it will produce 10.6 million bpd in 2022, which is higher than the previous forecast by 240,000 bpd. The estimate for global production was also increased by 300,000 bpd to 100.1 million bpd. Dynamics of Brent and oil production in Russia
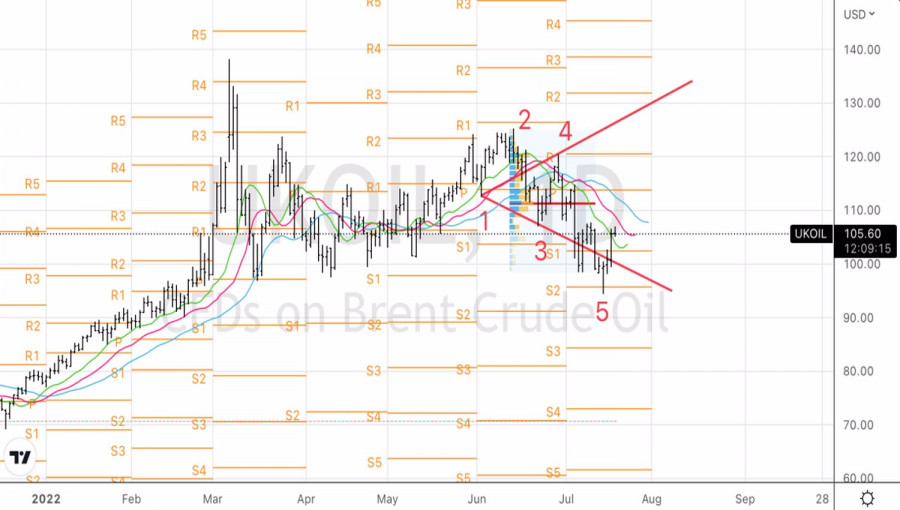
If instead of the expected expansion of the deficit, there is a narrowing of it, then the February peak will remain the peak in the coming months and possibly years. A return to it is unlikely, however, a significant drop in Brent is unlikely to be expected. Unless OPEC+ begins to work wonders and increase production, as Joe Biden wants. Investors' expectations that the US president's visit to Saudi Arabia will be effective have lowered the quotes of the North Sea variety below $100 per barrel. Nevertheless, Riyadh noted that decisions will be made under market logic and within the framework of the Alliance. This allowed the oil to surface.
The growth of futures quotes is facilitated by information about the failure of the Keystone pipeline—which limits the supply of Canadian oil to the US, Iraq's statement that Brent will trade at $100 per barrel and above this year, as well as some weakening of the US dollar against major world currencies. Technically, the combination of the Wolfe Wave and Anti-Turtles reversal patterns on the daily Brent chart signals the exhaustion of the short-term downward movement. A break of resistance at $107 per barrel is a reason for the formation of longs. The material has been provided by InstaForex Company - www.instaforex.com |
| EUR/USD. Insider surprise for the euro Posted: 19 Jul 2022 09:07 AM PDT The US dollar is actively losing its positions throughout the market amid an almost empty economic calendar. The US dollar index fell from 109.09 to the current value of 106.50 in three trading days. Accordingly, the configuration of the main dollar pairs of the "major group" has also changed, including EUR/USD. The pair has retreated from the parity level by more than 200 points up, gradually developing corrective growth. Moreover, the price is growing not only due to the weakening dollar but also to the strengthening of the euro.
The euro is strengthening in many cross-pairs (in particular, EUR/GBP, EUR/JPY) ahead of the July meeting of the ECB. The greenback, by the way, also fell into a depression on the eve of the July meeting of the Fed members, which will take place next week. The reasons are similar, or rather, mirror image: the euro rises in price on rumors of a "hawkish surprise" from the ECB, and the dollar, respectively, depreciates against the backdrop of comments from some Fed officials who did not support the idea of a 100-point rate hike this month. Thanks to a combination of these fundamental factors, EUR/USD buyers have seized the initiative and are now heading towards the 1.0300 resistance level. At this price point, the middle line of the Bollinger Bands indicator crosses with the Kijun-sen line on the D1 timeframe. So let's start with the euro. The baseline scenario, which has long been factored into current prices, calls for a 25 basis point hike in the interest rate. This scenario has been voiced repeatedly—just a few days ago, Governing Council member Olli Rehn confirmed such intentions. Earlier, ECB President Christine Lagarde and many heads of Europe's central banks spoke about this. In other words, a 25-point increase in the rate is, one might say, a settled issue. However, after the publication of the latest report on inflation growth in the eurozone, a correspondence discussion arose among experts: according to some analysts, the regulator will not resort to more aggressive monetary policy tightening, while others believe the central bank will still decide to take this step. Note that the overall consumer price index came out in the "green zone," reflecting a record growth. The June figure jumped to 8.6%, the highest reading on record since 1997. But this release also had a downside: the core index (excluding volatile energy and food prices) unexpectedly slowed its growth year-on-year, reaching 3.7% instead of the planned growth of 3.9%. It is also worth noting that, according to the latest data, German inflation also showed the first signs of a slowdown, reaching 8.2% in June (in May, the CPI peaked at 8.7%). In other words, the above inflation releases left more questions than answers. Traders, for the most part, lost faith that the ECB could decide to take more aggressive steps. Against this background, the euro began to lose its positions, and even more so when paired with the dollar, which again began to gain momentum. However, this week the situation has changed, and in a very drastic way. According to Reuters, the 50-point increase at the July meeting of the ECB cannot be ruled out. According to journalists, the European Central Bank will discuss the issue of raising rates by 25 or 50 points. Moreover, according to Reuters insider information, it is now difficult to predict the outcome of this discussion, although earlier, the advantage was definitely in the direction of a 25-point increase. This side of the story excited market participants: the euro began to be in high demand and not only in tandem with the dollar. But the US dollar unexpectedly fell into the trap of overestimated market expectations. Rumors that the Fed might decide on a 100-point rate hike provided significant support to the dollar. It was on the wave of these rumors that EUR/USD pair renewed another price low, dropping to 0.9953. But, as it turned out a little later, traders jumped to conclusions. The 100-point rate hike was supported only by the head of the San Francisco Fed, Mary Daly. The rest of her colleagues who have spoken over the past few days were skeptical of the idea (but supported the 75-point increase initiative). In addition, a report on inflation expectations calculated by the University of Michigan was published last Friday. The data showed that the component of long-term inflation expectations fell to 2.8% (from the previous value of 3.1%). And although this is a secondary macroeconomic report, we can also recall the core PCE index, which has been slowing down in annual terms for the third month in a row. All this suggests that the issue of a 100-point increase is (at least) debatable. And the fact that the Bank of Canada decided to take this step last week does not mean that the Fed will go the same way. The situation for the pair has developed a stalemate. On the one hand, the dollar is clearly losing its positions, allowing EUR/USD buyers to take new price heights. Plus, the euro suddenly began to strengthen its position on hawkish expectations about possible decisions by the ECB. On the other hand, such price impulses on the eve of key events (in this case, the July meeting of the European Central Bank) are a priori unreliable. Therefore, it is now advisable for the pair to take a wait-and-see position—at least until the price approaches the resistance level of 1.0300 (the middle line of the Bollinger Bands, coinciding with the Kijun-sen line on D1). If the upward impulse starts to fade in this price area, we can consider selling to the levels of 1.0200 and 1.0110 (the Tenkan-sen line on the same timeframe). Longs look too risky anyway. The material has been provided by InstaForex Company - www.instaforex.com |
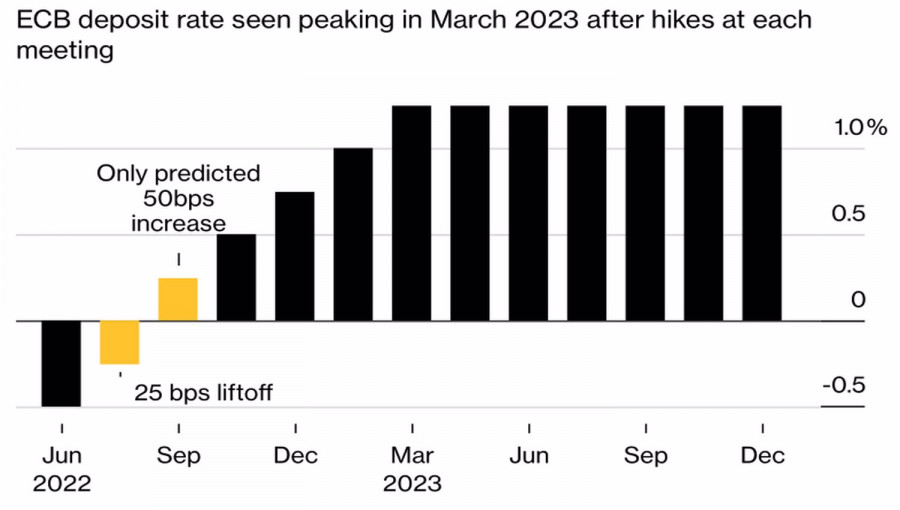
| EUR/USD: ECB and EC's will to fight energy crisis pushed bulls to attack Posted: 19 Jul 2022 08:34 AM PDT Only 4 out of 53 Bloomberg experts expect the ECB to raise the deposit rate by 50 bps in July, but as soon as an insider appears in Bloomberg that this issue is on the table of the Governing Council, the EURUSD pair soared above 1.025. The same goes for a $150 billion deal to buy October futures linked to the federal funds rate. Someone knew more than anyone else and was sure that the chances of an increase in borrowing costs by 100 bps at the upcoming FOMC meeting would drop sharply. They fell from almost 90% to 30%. And this someone earned $14 million per day. I have repeatedly stressed that the main drivers of the EURUSD collapse to parity were the contrasts between a determined Fed and a leisurely ECB, an energy crisis poised to plunge the eurozone into recession, and a political storm in Italy. If, after lowering inflation expectations from the University of Michigan, the Fed abandons the idea of raising the federal funds rate by 100 bps in July, while the European Central Bank, on the contrary, will discuss the possibility of starting from 50 bps, the difference no longer looks serious. The pair's quotes take into account a large amount, so it's time to close the shorts. It is this circumstance, against the likelihood of raising the deposit rate to zero at the next meeting of the Governing Council from 20% to 50%, allowed the "bulls" to disperse their attacks. ECB Rate Forecasts
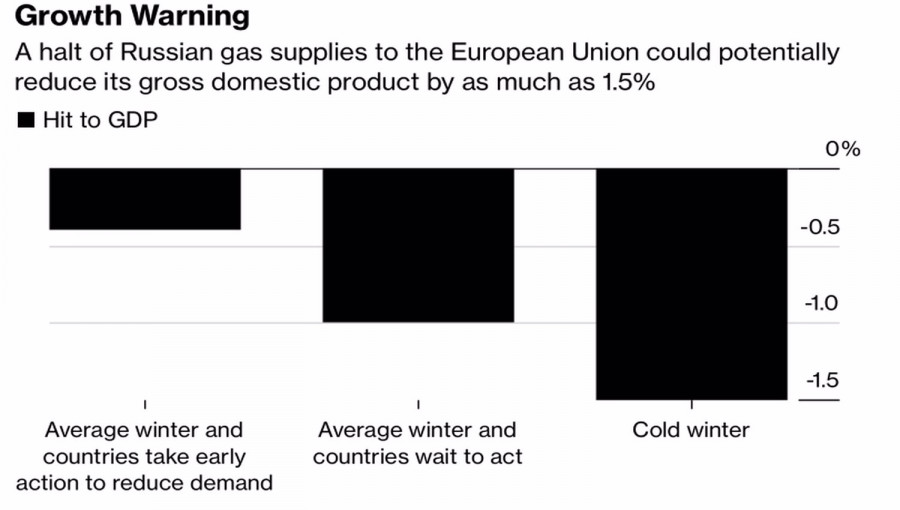
Not everything looks so bad with the energy crisis. Yes, gas prices are going through the roof, but whoever is warned is armed. The European Commission said it was already working on a baseline scenario in which Russia would not resume gas supplies from July 21. According to the forecasts of the European Commission, this will cost the EU economy 1.5 percentage points in severe winter and 0.6–1 percentage points in case of a moderate one. If all the planned actions get implemented, the figure will drop to 0.4 percentage points altogether. It is far from the 9% that some German institutions used to scare the German economy. European Commission forecasts for a recession in the EU
The European Commission expects gas storage facilities to be 65–71% full by the end of October, below the 80% target level, but not by much.
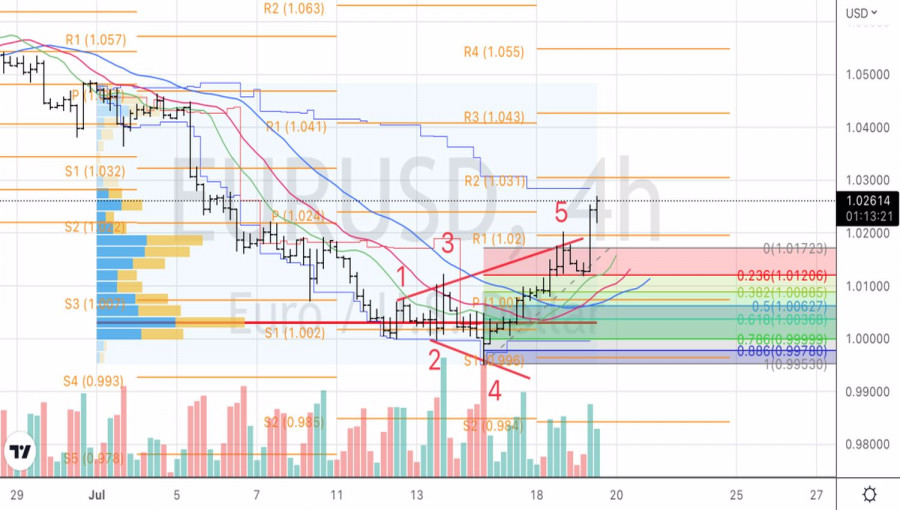
Thus, a more decisive ECB than expected, the effective work of the EU, and a messiah for Italy in the image of Mario Draghi can significantly change the balance of power in EURUSD. Draghi already has the experience of saving the euro; why won't he do the hat trick again, averting a political crisis in the country? All this together sets the fans of the euro in a major way. The correction may turn out to be deeper than expected. Technically, the Broadening Wedge pattern has been implemented on the EURUSD 4-hour chart. Long positions formed on the breakout of 1.012 should be held until the next bar closes below the pivot point at 1.019. Partial profit-taking on longs is possible in the area of 1.03–1.032. If the euro manages to pass it, the risks of continuing the rally to $1.041 will increase. The material has been provided by InstaForex Company - www.instaforex.com |
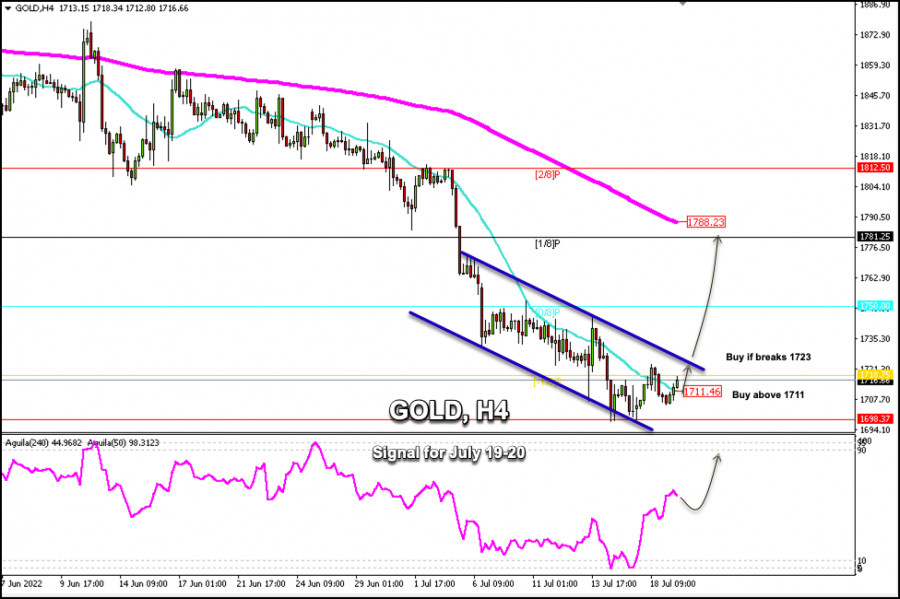
| Trading Signal for GOLD (XAU/USD) for July 19 - 20, 2022: buy above $1,711 (-1/8 Murray - 21 SMA) Posted: 19 Jul 2022 08:00 AM PDT
XAU/USD is trading at daily highs at 1,717, having gained support above 1,705. According to the 4-hour chart, gold is above the 21 SMA but below the downtrend channel formed in early July. Gold price movements are shown with some calm and less volatility every day. XAU/USD continues to hold above the psychological level of 1,700. This is a key level that, if broken firmly, would enable a test of the low 2021 at 1,675. On the upside, the resistance at around 1,723 should be challenged as this level represents the top of the downtrend channel. Above is the next resistance at 1,750 (0/8 Murray). If the bullish force prevails, the price could reach the 200 EMA at around 1,788. From a fundamental point of view, gold finds support due to the technical correction of the Dollar Index, which is currently trading at 106.25, and the risk appetite in the equity market. Treasury bond yields remain stable, with a slight rise, which if accentuated could put downward pressure on the yellow metal. The 10-year yield is 2.98% and the 30-year yield is 3.15%. A decline in these figures could favor gold. According to the 4-hour chart, the outlook will remain positive if gold consolidates above the 21 SMA located at 1711. Above this level, gold could continue the technical bounce and could break the top of the downtrend channel at 1,723. A daily close and a sharp break above 1,725 could mean gold advances and it could quickly reach resistance at 0/8 Murray at 1,750. Conversely, below 1,711 we should avoid buying and can expect a decline to around 1,698 (-1/8 Murray). The material has been provided by InstaForex Company - www.instaforex.com |
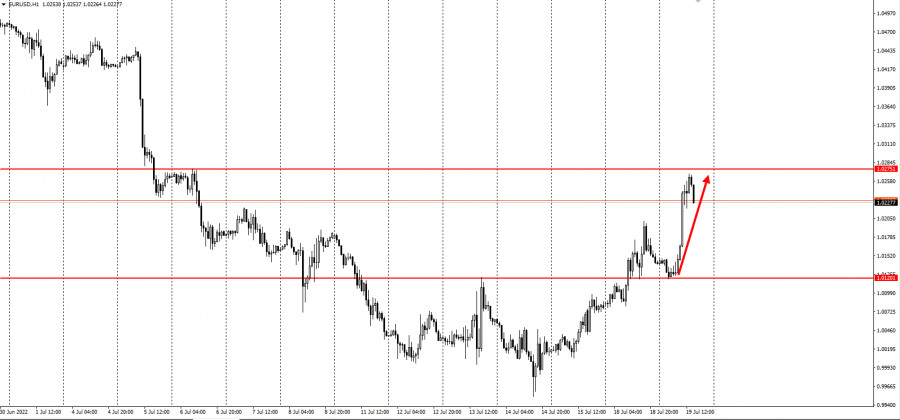
| Technical analysis recommendations on EUR/USD and GBP/USD for July 19, 2022 Posted: 19 Jul 2022 07:55 AM PDT EUR/USD
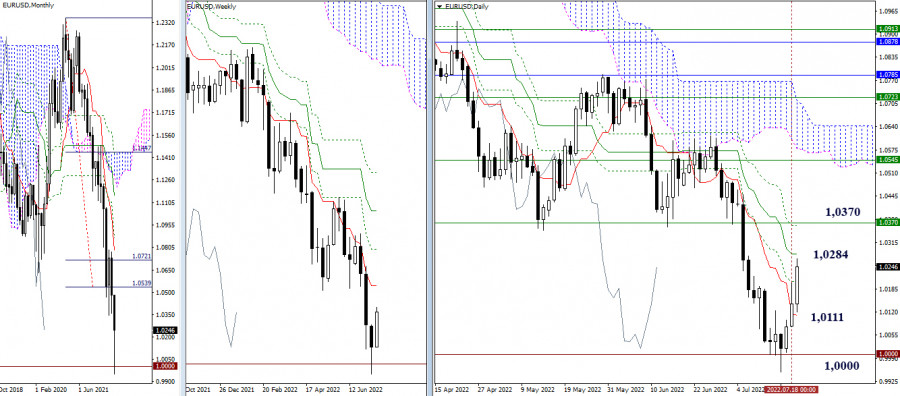
Higher timeframes The upward correction continues. Yesterday, the pair closed above the daily short-term trend, and today it has risen to the zone of influence of the medium-term trend (1.0284). The main challenge for bulls in the near term is to eliminate the daily death cross (1.0362 - closing level) and endorse the bullish edge with the short-term weekly trend currently at 1.0370. If the priorities change and the bears return to the market, then the supports at 1.0111 (daily short-term trend) and 1.0000 (important psychological level) may be important.
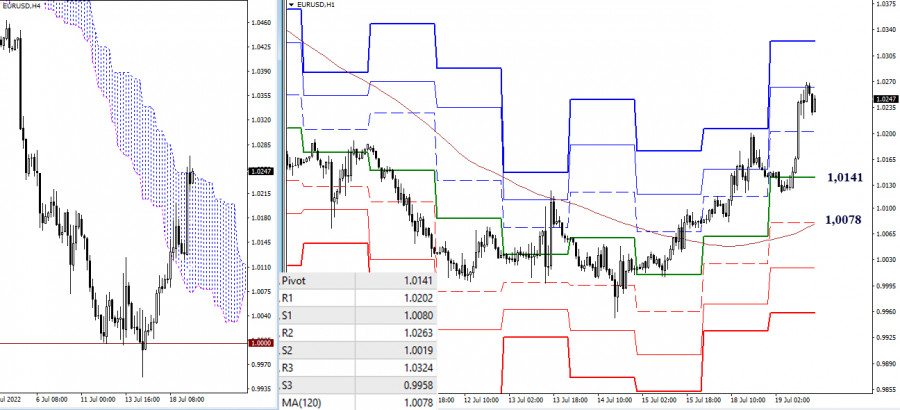
H4 – H1 The bulls' advantage in the lower timeframes allows them to develop a trend movement. The second resistance of the classic pivot points (1.0263) is now being tested, which may rise from the daily medium term (1.0284). In addition, this area strengthens the upper boundary of the Ichimoku cloud on H4. A breakdown and reliable consolidation above will open the way to the third resistance 1.0324, while a target for the breakdown of the H4 cloud will be formed. The levels of 1.0362–70 from the higher timeframes will also serve as benchmarks. The key levels of the lower timeframes now play the role of support in case of a corrective decline. Today, the key levels are 1.0141 (central pivot point of the day) and 1.0078 (weekly long-term trend). *** GBP/USD
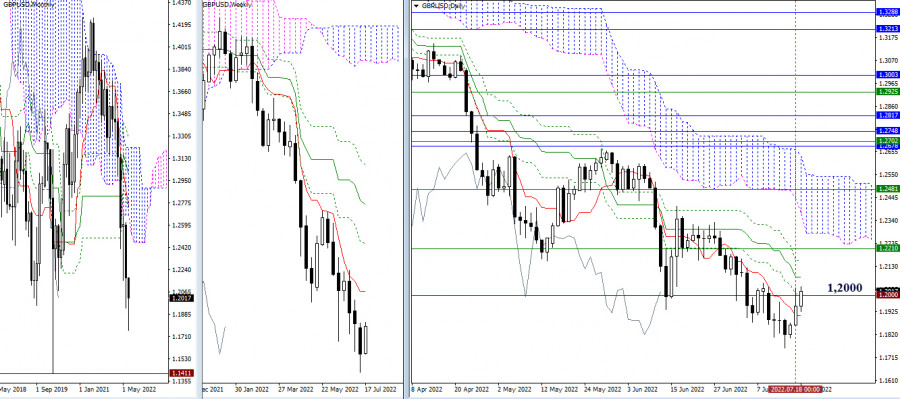
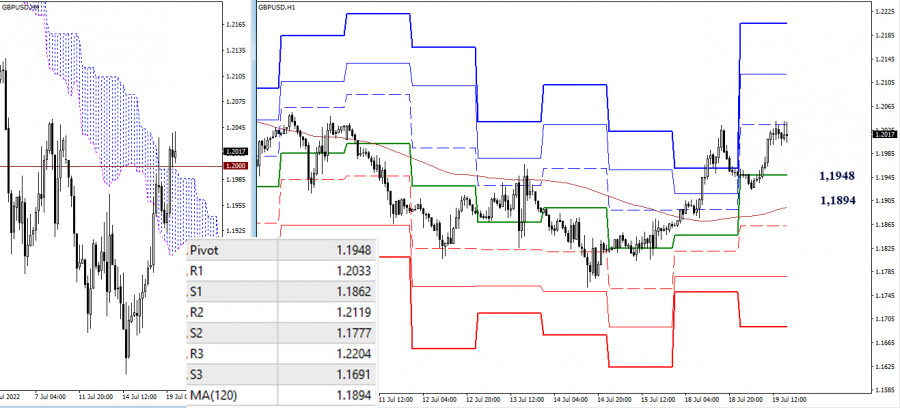
Higher timeframes Bulls closed yesterday above the daily short-term trend (1.1907), now the nearest support. Today, there is a struggle for possession of 1.2000. If bulls manage to gain a foothold higher, the next stage will be the liquidation of the daily death cross (1.2082 Kijun + 1.2158 Fibo Kijun) and the struggle for possession of the weekly short-term trend (1.2210).
H4 – H1 Bulls currently dominate the lower timeframes. They are now testing the first resistance of the classic pivot points (1.2033), then their intraday upside targets are located today at 1.2119 (R2) and 1.2204 (R3). Key levels act as supports, currently at 1.1948 (central pivot point of the day) and at 1.1894 (weekly long-term trend). The breakdown and secure consolidation below will change the balance of power in favor of the bears, restoring the relevance of downside targets. *** In the technical analysis of the situation, the following are used: higher timeframes – Ichimoku Kinko Hyo (9.26.52) + Fibo Kijun levels H1 - Pivot Points (classic) + Moving Average 120 (weekly long-term trend) The material has been provided by InstaForex Company - www.instaforex.com |
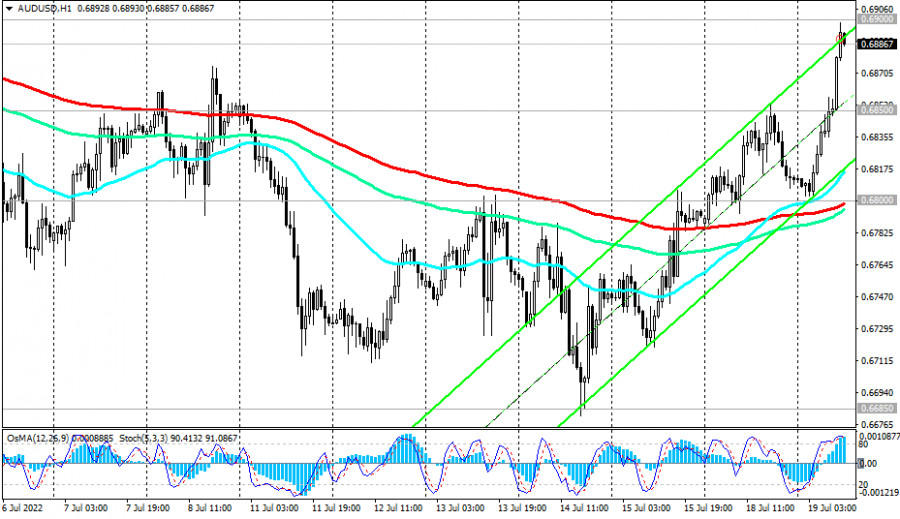
| AUD/USD Technical Analysis and Trading Tips for July 19, 2022 Posted: 19 Jul 2022 07:44 AM PDT
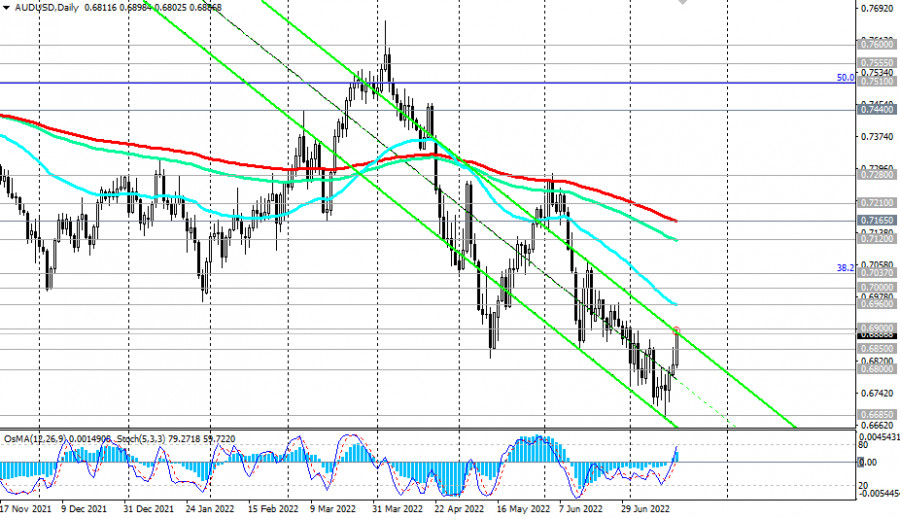
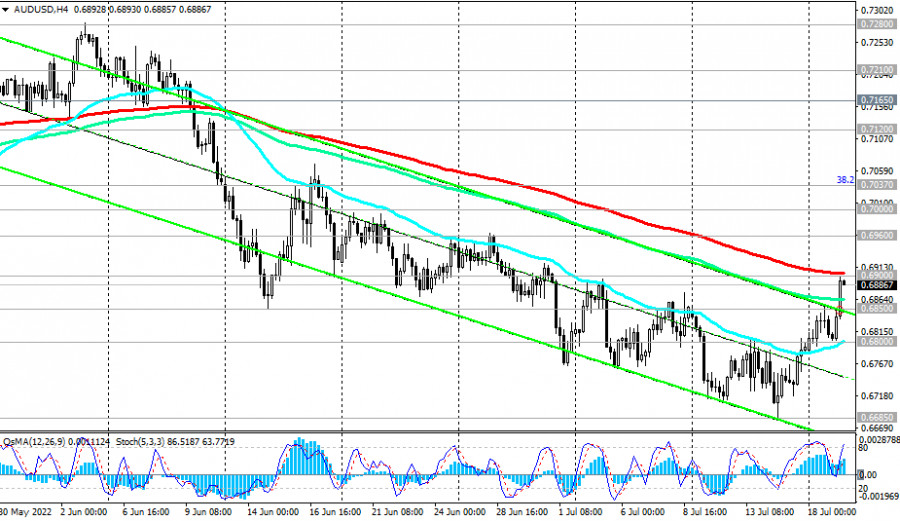
After today's publication of the minutes of the RBA's July meeting, the AUD/USD pair rose to an intraday and 12-day high of 0.6898, coming close to the resistance level of 0.6900 (200 EMA on the 4-hour chart). The upper limit of the descending channel on the daily chart also passes through this mark.
Obviously, this is a strong level of resistance, which cannot be overcome immediately. The price may still rise, but it needs to gain a foothold in the zone above the resistance level of 0.6900 in order to continue growing. But if it takes place, the next target of the corrective growth of AUD/USD will be the resistance levels of 0.6960 (50 EMA on the daily chart), 0.7000.
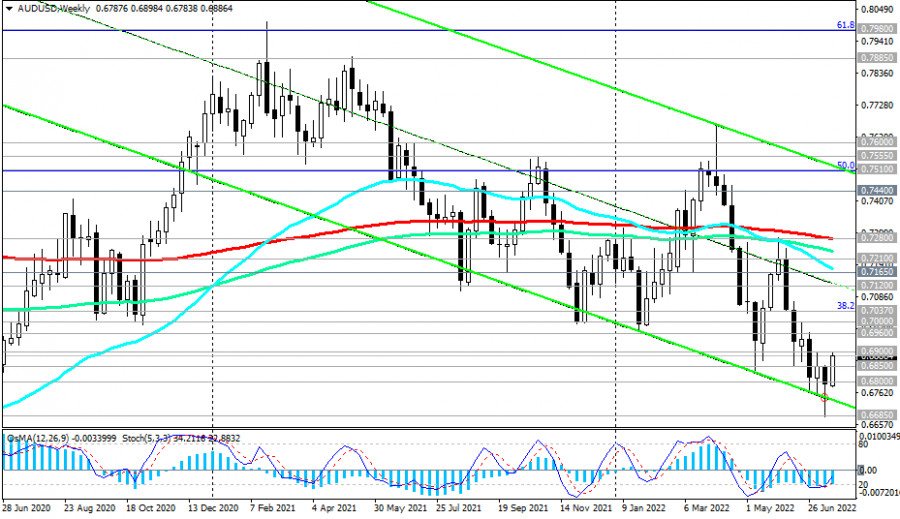
However, AUD/USD remains in the long-term bear market zone. Only a breakdown of the 0.7600 resistance level (200 EMA on the monthly chart) will bring AUD/USD into the long-term bull market zone. So far, the downward trend prevails, which makes short positions preferable. Therefore, a rebound from the resistance level of 0.6900 and a return of AUD/USD to a downward trend looks the most logical. The first signal will be a breakdown of the local support level of 0.6850, and the confirmation signal will be a breakdown of the support level of 0.6800 (200 EMA on the 1–hour chart).
The nearest targets for the decline are the support levels of 0.6685 (local long-term and intra-month low), 0.6660 (lower line of the descending channel on the daily chart). Support levels: 0.6850, 0.6800, 0.6700, 0.6685, 0.6660, 0.6500, 0.6455, 0.6270, 0.5975, 0.5665, 0.5510 Resistance levels: 0.6900, 0.6960, 0.7000, 0.7037, 0.7100, 0.7120, 0.7165, 0.7210, 0.7280 Trading Tips Sell 0.6900, Sell Stop 0.6840. Stop-Loss 0.6920. Take-Profit 0.6800, 0.6700, 0.6685, 0.6660, 0.6500, 0.6455, 0.6270, 0.5975, 0.5665, 0.5510 Buy Stop 0.6920. Stop-Loss 0.6840. Take-Profit 0.6960, 0.7000, 0.7037, 0.7100, 0.7120, 0.7165, 0.7210, 0.7280 The material has been provided by InstaForex Company - www.instaforex.com |
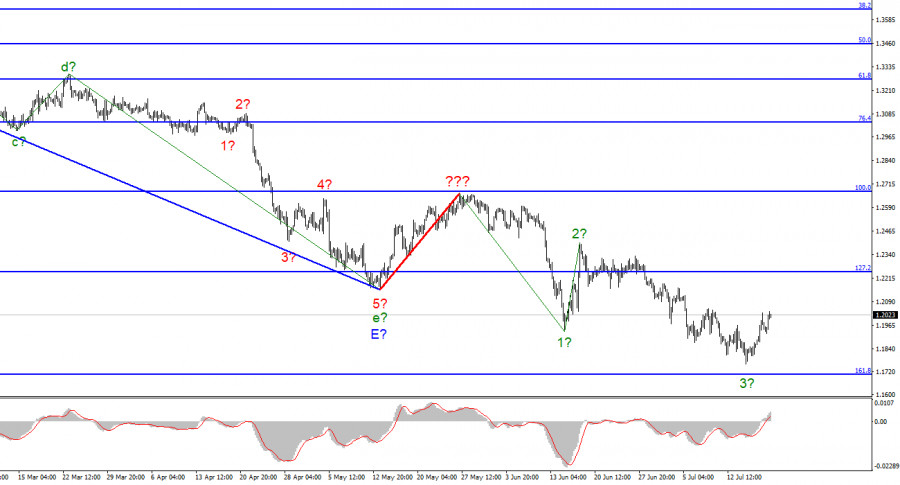
| Posted: 19 Jul 2022 07:25 AM PDT
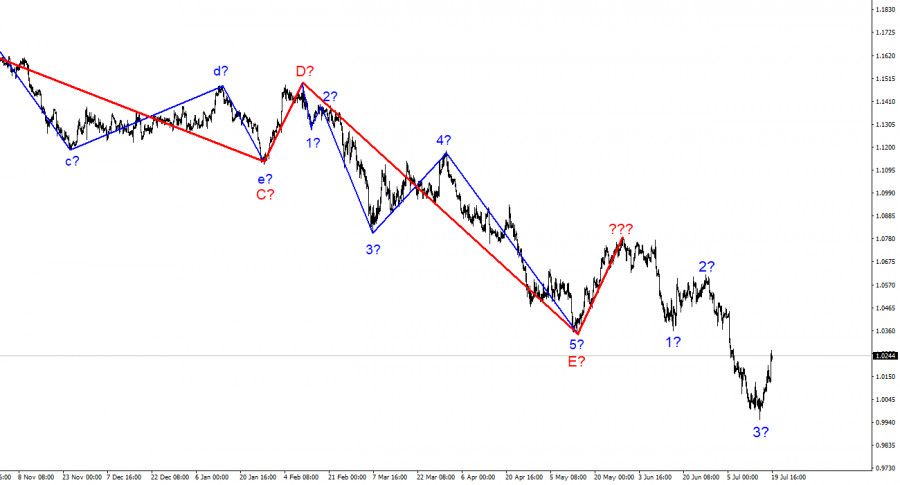
The wave marking for the pound/dollar instrument required clarifications, which were made. The upward wave constructed between May 13 and May 27 does not currently fit into the overall wave picture, but it can still be regarded as a segment of the downward trend. Thus, we can now definitively state that the building of the upward correction phase of the trend has been canceled, and the downward component of the trend will have a longer and more complex shape. I'm not a big fan of continually complicating the wave marking when dealing with a highly elongating trend zone. It would be far more practical to recognize rare corrective waves, after which new impulse structures will be built. Now that waves 1 and 2 have been completed, we may infer that the instrument is in the process of constructing wave 3. However, this wave proved unconvincing (if finished now), as its low is not significantly lower than wave 1's low. Consequently, the current downturn cannot be characterized as impulsive, but it may be a complex correction. Focus on the wave marking of the EUR/USD instrument in this regard. The unemployment rate remained steady in the United Kingdom. The exchange rate between the pound and the dollar jumped by 80 basis points on July 19. The demand for the British pound continues to rise, which is positive news. However, the current wave pattern indicates a decline in the instrument. Thus, the British pound's rise may be temporary. Several reports were released in Britain today that may have bolstered the pound but did not. The unemployment rate ended up being completely neutral at 3.8%. The 6.2% increase in salaries, including bonuses, fell short of market forecasts. The increase in wages, excluding bonuses, was in line with market estimates, at 4.3%. Consequently, none of the three reports revealed values exceeding expectations. Therefore, the British pound has increased far less today than the euro. Andrew Bailey, Governor of the Bank of England, will also deliver a speech tonight. In two weeks, there will be a meeting of the Bank of England at which the interest rate is set to rise for the sixth consecutive time. The only question is its growth rate. And Andrew Bailey may provide the market with a response to this query. If he does, we will not have to wait long for a response. However, I believe Bailey will remain silent so as not to agitate the market prematurely. In addition, the rate decision has not yet been made, and the Bank of England can raise it by either 25 or 50 basis points. A report on inflation in the United Kingdom will be revealed tomorrow, which may provide insight into what to expect from the British regulator. If it turns out that inflation is on the rise once more, the Bank of England will have to consider a 50-point hike all at once. Several members of the PEPP committee voted for a 50-point hike at their most recent meeting. I believe the likelihood of this scenario occurring at the next meeting is even greater than the likelihood of a 25-point hike. General observations. The increased complexity of the wave structure of the pound/dollar pair signals a further downturn. For each "down" MACD signal, I recommend selling the instrument with objectives at the estimated mark of 1.1708, corresponding to 161.8 percent Fibonacci. Now, there is a prospect of an upward wave forming, but I do not anticipate it to be robust and protracted.
At the higher wave scale, the image closely resembles the euro/dollar instrument. The same ascending wave does not conform to the present wave pattern followed by the same three descending waves. Thus, one thing is unmistakable: the downward segment of the trend continues to develop and can reach practically any length. The material has been provided by InstaForex Company - www.instaforex.com |
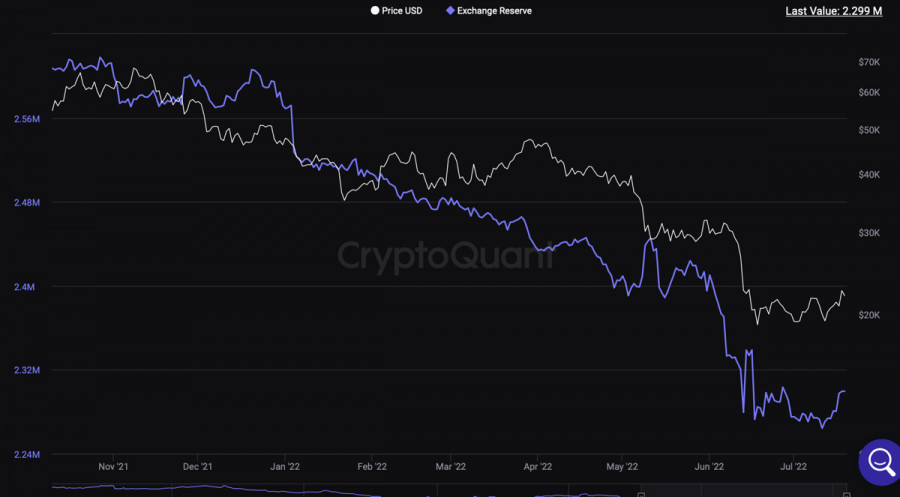
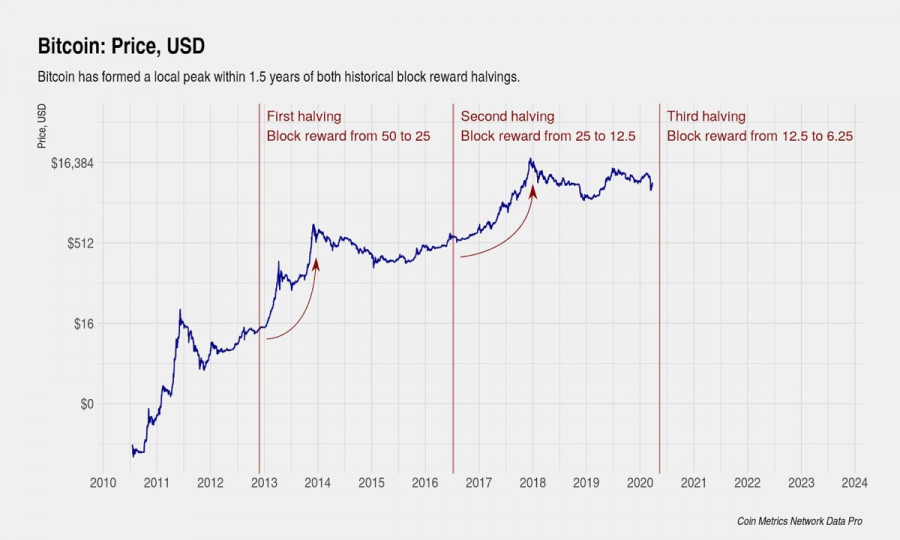
| Crypto winter will continue for another 250 days: Grayscale Posted: 19 Jul 2022 07:24 AM PDT Bitcoin is increasingly gaining upward momentum and is testing the $23k resistance zone. However, the price cannot rise beyond this level due to the large volumes of sellers. Cryptocurrency is also hampered by fundamental factors that limit the investment opportunities of market participants. As a result, Bitcoin implements upward spurts within a narrow range of fluctuations. The key factor in the inability of the cryptocurrency to go beyond the current area is the negative fundamental background. Bitcoin cannot realize its best qualities in an environment of tight monetary policy due to rising inflation, as well as an energy and liquidity crisis. The correlation with stock indices also prevents BTC from developing, as seen from the current upward momentum. It was provoked by a local correction and a weakening of the Fed's grip due to the crisis in other world currencies. The market provides a passive accumulation of cryptocurrency but does not provide volumes for strong growth.
This is partly because the market just a month ago experienced the largest capitulation since 2011, and a few weeks in consolidation is clearly not enough. Grayscale is pessimistic and believes the crypto winter will last another 250 days. As an argument, the company's experts cite the MVRV metric, which reflects the ratio of the realized value of BTC and the market value. A decrease in the level of realized value in relation to the market serves as a signal for the beginning of a bear market. Grayscale analysts believe that the last time this happened was on June 13, which means that the crypto-winter phase has just begun.
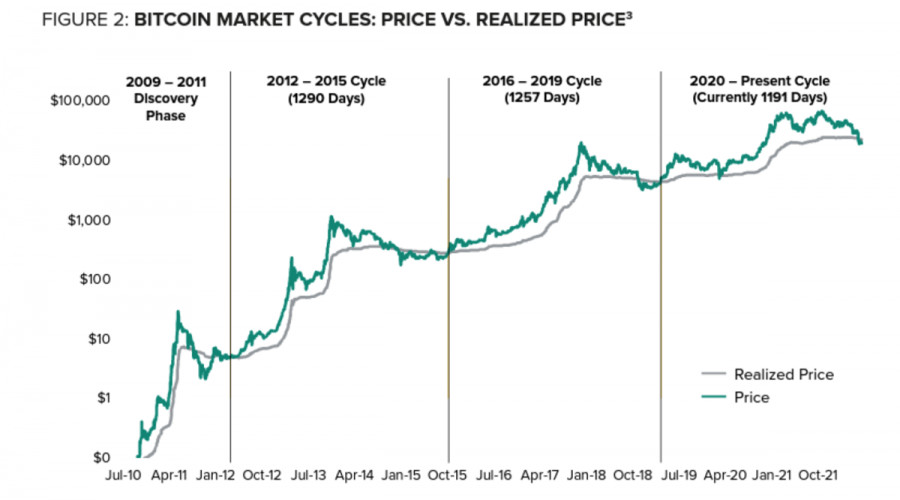
The main theory of the company is based on a four-year cycle of Bitcoin movement. We are now in the middle of the 2020–2024 period. If we take the recovery of the cryptocurrency price above the level of the previous high as the beginning of the bull market, then the conclusion of Grayscale makes sense. However, it would be wrong to say that the market has recently moved into the crypto winter stage since the main indicators indicate the formation of a local market bottom right now.
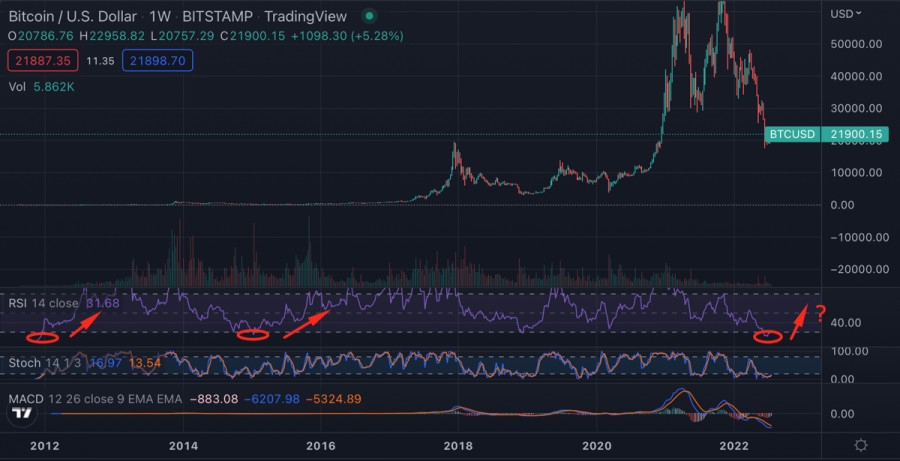
The Fear and Greed Index hit a multi-year low of 6 and stayed there for more than a week. The bottoming of market sentiment and the subsequent recovery of the indicator to 20 indicates a restoration of faith in Bitcoin. We see the first results of this thaw in the form of the local upward momentum of the cryptocurrency. In addition, the RSI index on the weekly timeframe, for the third time in the history of Bitcoin, fell below 30, which is typical for the onset of an overbought period. Historically, after reaching this level, an upward recovery movement followed.
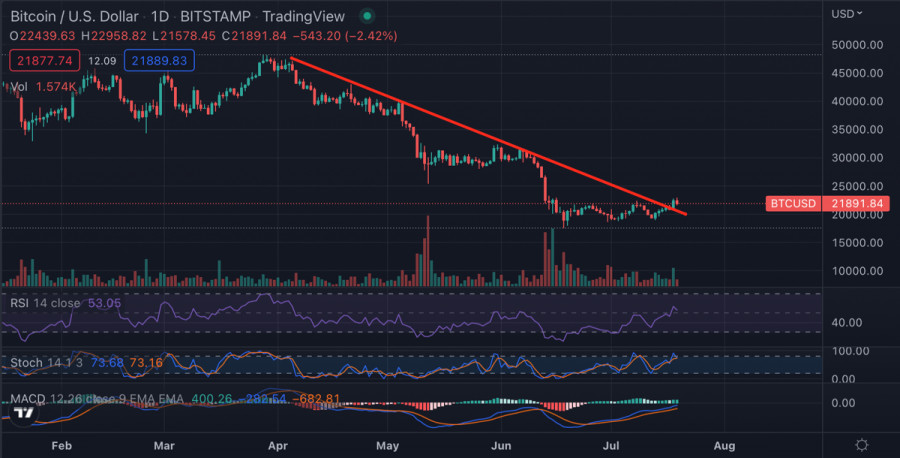
The cryptocurrency managed to break through the three-month downward resistance level. It is an important trigger in the medium term for a further recovery in the BTC/USD price. The sellers did not have enough volumes to push the price back and create prerequisites for a reversal by forming a "false breakdown" pattern. However, this did not happen due to the aggressive actions of buyers and large volumes. In the medium term, the breakdown of the three-month downward trend means that the key resistance level of $23k is approaching a successful assault.
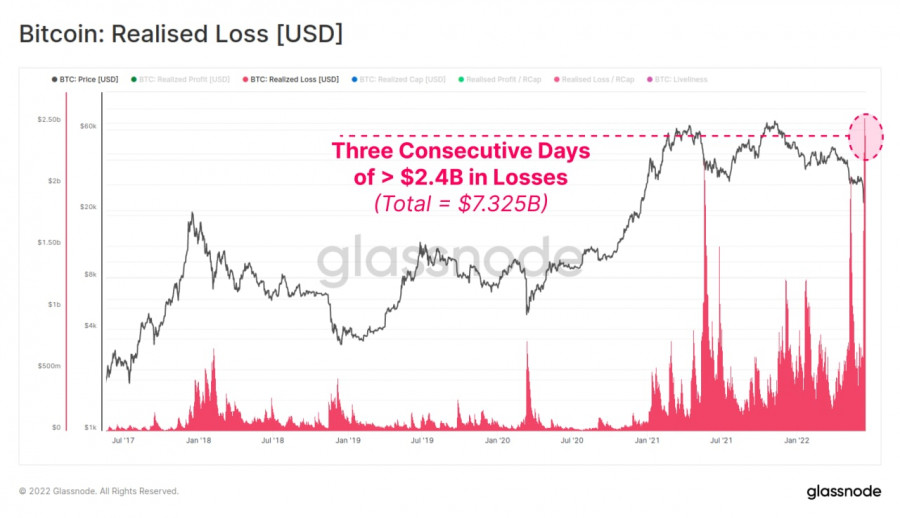
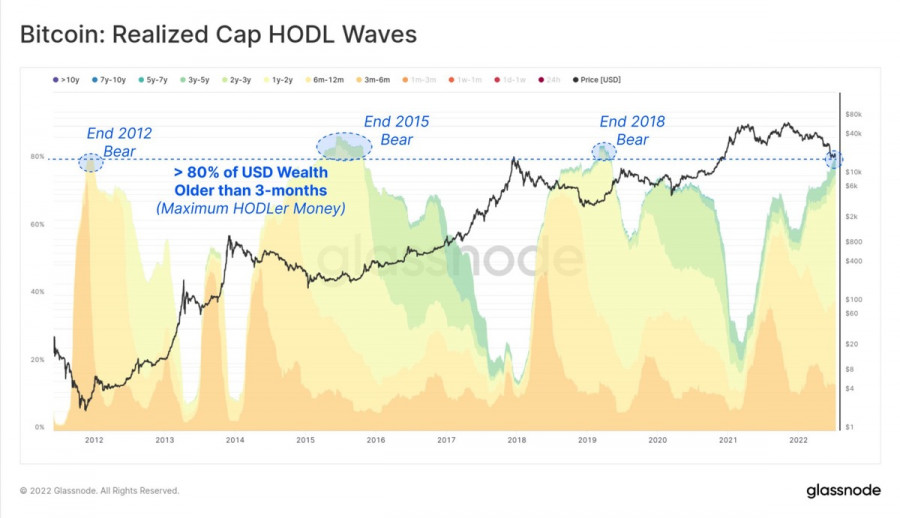
In addition, at the end of June, the market saw the largest capitulation in history. As a result, speculative investors and large amounts of borrowed funds washed out of the market. Some long-term investors who bought BTC above $40k also started selling their coins, which signals a bottom formation. Glassnode also indicated that 80% of all Bitcoin investments have been inactive for three months. If we compare this situation with what we saw in 2012, 2015, and 2018, we can conclude that this meant the end of the bearish trend.
Grayscale's statement is largely based on the use of one or more metrics. Technically, Bitcoin has already reached the bottom, and the worst period of crypto winter has passed. The asset is at the stage of forming a local low, which requires a long consolidation and a gradual flow of capital into the hands of long-term investors.
At the same time, the emergence of a full-fledged upward trend in the cryptocurrency, which will lead to an update of the historical high, is really likely in 2024. The main catalyst for the growth of BTC quotes will be halving, which will provide a shortage and increased value of coins on the market. However, until then, there will be several significant upward trends ahead of us, which will provide an exit beyond strong price ranges. The material has been provided by InstaForex Company - www.instaforex.com |
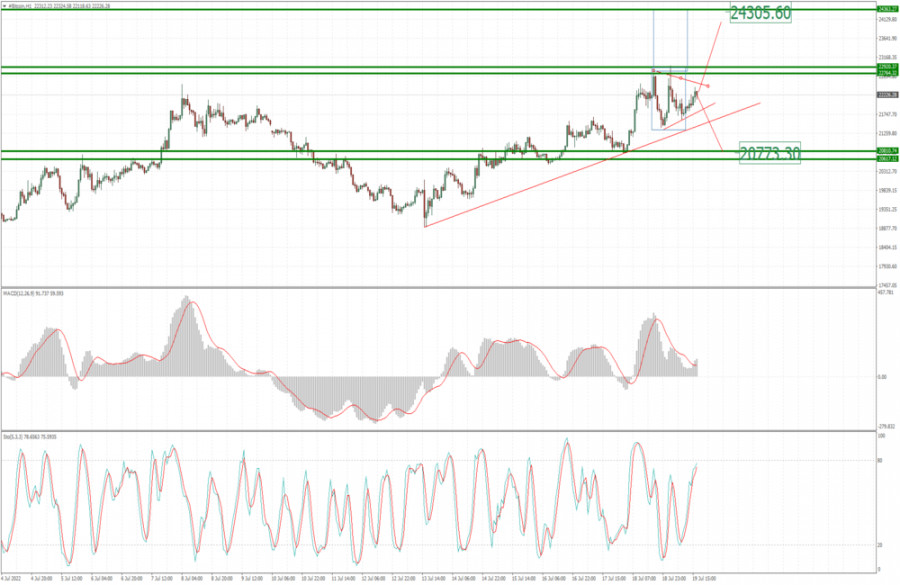
| BTC update for July 19,.2022 - Watch for the breakout of the symmetrical tirangle Posted: 19 Jul 2022 07:21 AM PDT Technical analysis:
BTCUSD has been trading sideways at the price of $22.200, I see potential for the breakout of the symmetrical triangle pattern. Trading recommendation: Due to the confluence and the symmetrical triangle in the background, I see potential for the breakout play. Watch for the potential breakout to confirm further direction. Upside breakout can lead BTC towards $24.300, in case of the upside breakout watch for buying opportunities on the intraday dips. Downside breakout of the symmetrical triangle can lead the price towards $20.770. In case of the downside breakout, watch for selling opportunities on the intraday rallies.. The material has been provided by InstaForex Company - www.instaforex.com |
| Posted: 19 Jul 2022 07:08 AM PDT
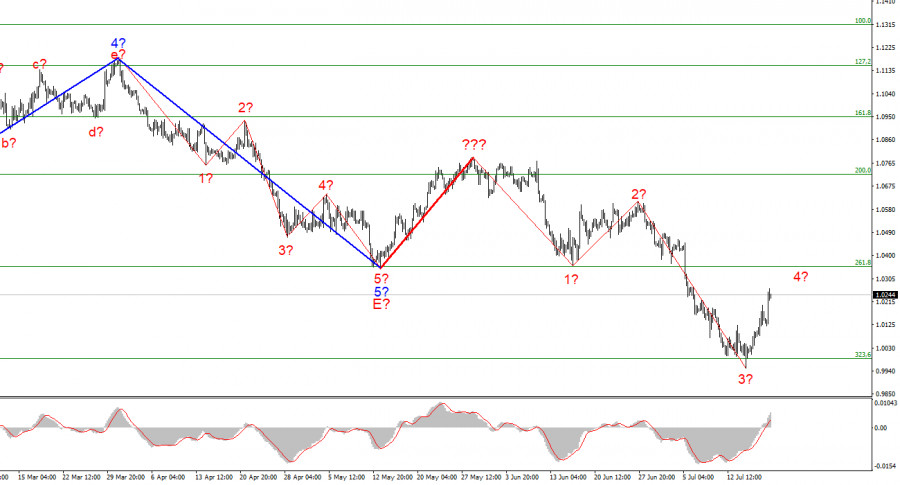
A few weeks ago, the wave markings on the 4-hour chart for the euro/dollar instrument got more complex and no longer had a holistic appearance. There was a successful attempt to break through the 261.8 percent Fibonacci level, which was also the low of the waves E and b; hence, these waves are no longer E and b. Thus, I have constructed a new wave markup that does not yet account for the ascending wave indicated by a bold red line. I've already stated that the entire wave structure can be complicated indefinitely. It is the drawback of wave analysis, as any structure is always capable of assuming a more complicated and extensive shape. Consequently, I propose to now focus on simpler wave structures, including waves of a smaller scale. As can be seen, the formation of an upward wave, which may be wave 4 of a new downward trend segment, has begun. If this prediction is right, the instrument's drop will resume within wave 5 with objectives positioned below 1.0000 after an additional 100-150 basis points gain. So far, I see no reason to anticipate additional instrument moves. Thursday is the day for the ECB meeting. Tuesday saw the euro/dollar pair increase by another 100 basis points. So far this week, the European currency has gained as much as 230 points, which has not occurred in a very long time. There may be inquiries as to why the euro began to be in demand this week. And you may find the answers to these questions in the news calendar. Today, the European Union published a report on inflation for June, revealing another rise in the indicator. This time rose 8.6% year-over-year. It should be noted that after the announcement of this data, the European currency fell only marginally, when just a few hours earlier, it had risen significantly. Nonetheless, I maintain that these are two linked occurrences. If this is not the case, there is a second significant component that cannot go overlooked. This component is the ECB meeting, whose outcomes will be summarized on Thursday. A few days before the conclusion of the meeting, the market is full of diverse predictions and speculations. No one doubts that the interest rate will be increased by 25 basis points, as the question of a rate increase appears to have been resolved. However, since the beginning of this week, there have been rumblings that the ECB may hike the rate by 50 basis points all at once. Today, due to the publication of a study detailing another spike in inflation, these beliefs have grown stronger. The market is pretty reasonable in this regard: the higher the inflation, the greater the likelihood of a sharper increase in interest rates. I'd want to remind you that the ECB rarely presents surprises. Christine Lagarde clarified that we are discussing a 25-point hike in July and the same amount in September. I believe there is no need to add anything unnecessary to this discussion. General conclusions I infer based on my findings that construction of the downward trend segment continues. Consequently, it is now viable to sell the instrument with goals near the predicted mark of 0.9397, which corresponds to 423.6 percent Fibonacci, for each "down" MACD signal, based on the building of wave 5. A failed effort to surpass the level of 323.6 percent signals the temporary unavailability of the market for new sales and the commencement of the construction of corrective wave 4. Consequently, you may also await the conclusion of this wave before resuming sales.
At the larger wave size, the wave marking of the descending trend segment becomes considerably more complex and extends in length. It can assume virtually any length. Thus I believe it is best to concentrate and focus on three and five-wave conventional wave structures at this time. The material has been provided by InstaForex Company - www.instaforex.com |
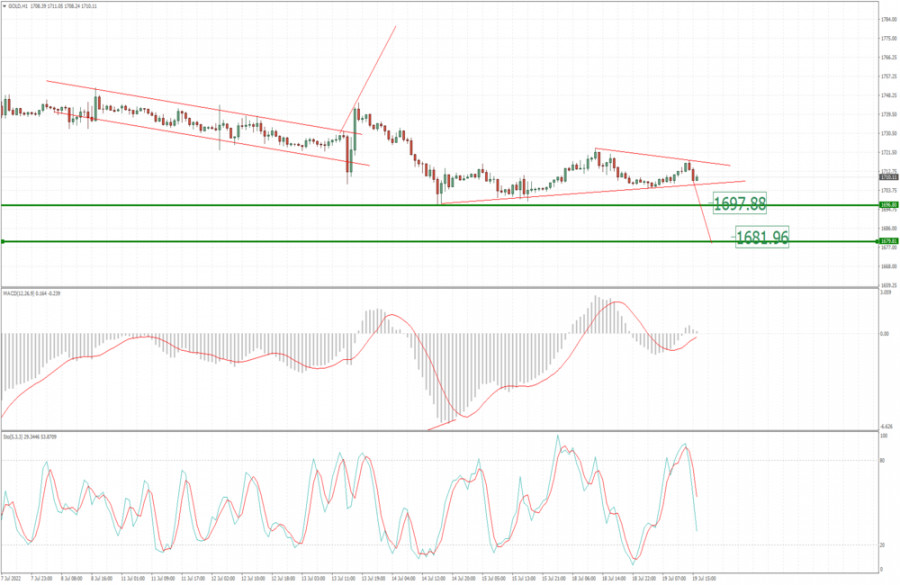
| Analysis of Gold for July 19,.2022 - Watch for the breakout of the symmetrical triangle pattern Posted: 19 Jul 2022 07:05 AM PDT Technical analysis:
Gold has been trading sideways at the price of $1.711, I see potential for the breakout of the symmetrical triangle pattern. Trading recommendation: Due to the confluence and the symmetrical triangle in the background, I see potential for the breakout play. Watch for the potential breakout of the rising trend-line to confirm further downside movement. Downside objectives are set at the price of $1.697 and $1.681. Stochastic is showing overbought condition and potential for the downside rotation. Key resistance is set at the price of $1.721 The material has been provided by InstaForex Company - www.instaforex.com |
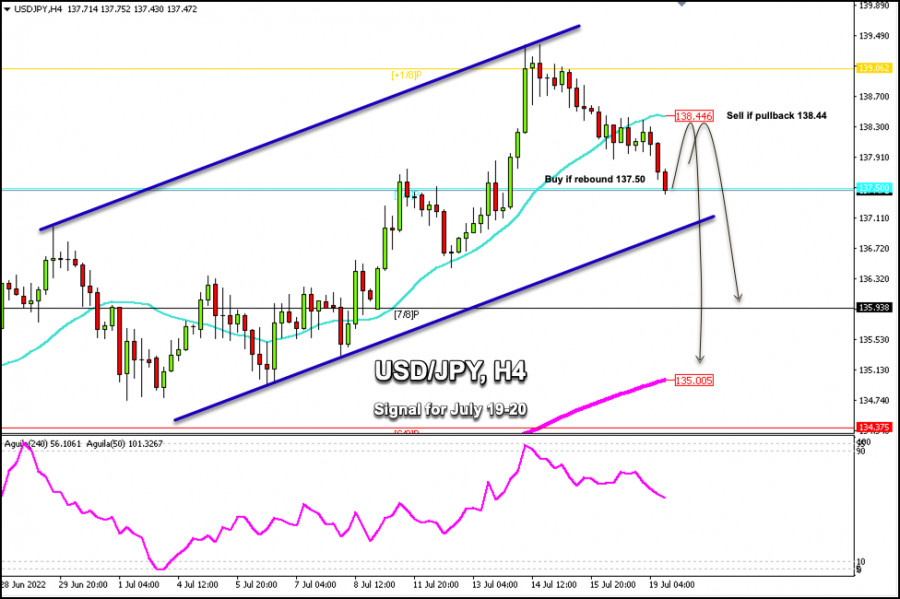
| Trading Signal for USD/JPY for July 19 - 20, 2022: key level 137.50 (8/8 Murray - 21 SMA) Posted: 19 Jul 2022 06:31 AM PDT
Early in the American session, the Japanese Yen is trading at around 137.50 with a bearish bias but it is limited by the support of 8/8 Murray. After breaking the 21 SMA (138.44), the pair accelerated its decline towards the area of 137.50. The bearish move is likely to continue and the price may reach the bottom of the downtrend channel at around 136.80. Last week, several FOMC members dispelled market expectations of a 100-basis point rate hike at the next meeting on July 26-27. This favored the recovery of the yen and it strengthened away from the high of 139.38. Another factor that may help the USD/JPY pair recover is that the dollar index is pulling back and is now trading at around 106.25. A break of this support could benefit USD/JPY and it will fall to 7/8 Murray at 135.93. On the 4-hour chart, USSD/JPY shows an uptrend, despite signs of losing strength after hitting a 24-year high of around 139.38. The bullish bias could resume if the Yen rebounds above 137.50 or returns above the 21 SMA located at 138.44. As long as the uptrend channel remains intact, the currency pair is likely to resume its main uptrend and could reach the psychological level of 140.00. The break of this level of 140.00 will be open for a challenge towards the high of August 1998 at 147.67. The chart above shows the current price level of the Yen. We can buy the pair if it bounces above 137.50. Or we can sell in case of a pullback towards the 21 SMA around 138.44. If the price breaks this level, USD/JPY could reach +1/8 Murray around 139.08. On the other hand, if bearish pressure prevails, the first support for USD/JPY would be 8/8 Murray at 137.50. A break below that level will drop towards the bottom of the uptrend channel at 136.75. A break below will expose the daily high of June 29 at 137.00, and tte pair could finally stop the decline at 7/8 Murray around 135.93. The material has been provided by InstaForex Company - www.instaforex.com |
| US Premarket for July 19: US companies lower future profit forecasts Posted: 19 Jul 2022 05:39 AM PDT Futures on US stock indices increased on Tuesday. Traders continued to scrutinize the released reports of major banks, which yesterday aided the market significantly in the first part of the trading day. However, it failed to keep the Dow Jones at its highs, thereby dragging it down. Futures on the Dow Jones Industrial Average increased by 164 points, or 0.53 percent. S&P 500 futures increased by 0.68 percent, while Nasdaq 100 futures increased by 0.72 percent.
Approximately 8% of S&P 500 businesses have reported earnings for the second calendar quarter, and almost two-thirds of these companies outperformed analyst projections. The earnings statistics of corporations and the current share prices of these corporations imply a major attraction in prices. However, investors are handicapped by the possibility of a recession, which they view as inevitable or as having already occurred. Many are concerned that the Fed's policies will result in a new wave of stock market declines and a return to yearly lows. Few individuals believe that the market has "exhaled" sufficiently before the next breakthrough to new historical highs. The Dow Jones index dropped more than 200 points yesterday and closed the day in the negative, despite a morning spike triggered by strong earnings announcements from Goldman Sachs and Bank of America. Oil prices have once again surpassed $100 per barrel. The impact on the indices resulted from the news that Apple may limit recruiting and growth spending next year in preparation for a probable economic slump. The iPhone manufacturer's stock ended the day down approximately 2.1%. Premarket Today, Johnson & Johnson reported. The corporation posted quarterly earnings above expectations, but the pharmaceutical giant lowered its profit estimate. Quarterly earnings per share were $ 2.59, up 5 cents from projections. Today, when the market closes, we are awaiting the Netflix report, and later this week, we will receive Tesla, United Airlines, American Airlines, Twitter, and Verizon's quarterly results. IBM stock sank 5% in premarket trade after the technology company decreased its prediction for the coming year, despite reporting earnings that surpassed analysts' expectations. IBM has warned about the impact of a strong currency, which impedes exports, on profitability. Following a rating boost from Morgan Stanley, Cinemark's shares climbed 4.6% in premarket trade. According to Morgan Stanley, customers' return to movie theaters is a trend not yet reflected in the stock price. In the premarket, shares of oilfield services giant Halliburton surged 1.8% as the report exceeded expectations. Profit grew by roughly 41 percent compared to the previous year due to a substantial increase in oil prices, which increased drilling demand.
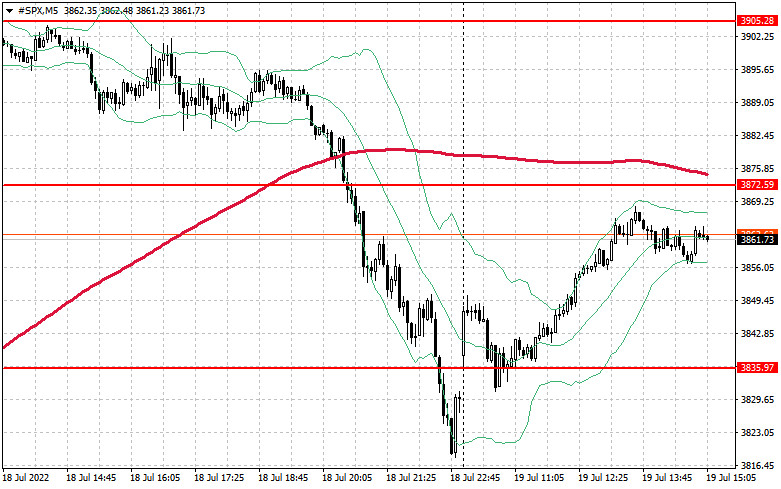
As for the S&P 500's technical picture, Following yesterday's small fall, the demand for equities is resuming. The bulls have halted trading at $ 3,905, but they must first offer something above $ 3,870. The breakthrough will allow the purchase cycle to resume and preserve hope for a speedy recovery to $ 3,942. In the vicinity of $ 3,975 and above, the index will experience a very vigorous growth, and significant sellers will return to the market. At least some traders will seek to lock in profits on long holdings. A more distant objective will be $ 4,013. If the pressure caused by weak business reports returns, purchasers must defend the closest support at $ 3,845. After failing to reach this level, the index will fall to around $ 3,801. A more stable one below this level is around $ 3,773, where buyers will resume their aggressive behavior. The material has been provided by InstaForex Company - www.instaforex.com |
| Fall of Three Arrows Capital and Crypto Lender Celsius exposes cracks in global crypto regulation Posted: 19 Jul 2022 05:17 AM PDT Bitcoin and ether continue to gain value. In just a few days, ether has added more than 15% and ran into the resistance level of $1,640. The price of BTC is heading towards $23,000. However, let's put aside technical analysis and first consider some fundamental factors affecting dynamics in the cryptocurrency market. Amid a recent collapse in the digital market, which forced a number of the largest cryptocurrency companies to declare bankruptcy, the Singapore authorities decided to broaden the scope of cryptocurrency regulations to cover more activities. They joined a worldwide push to clamp down on risks after a series of business failures rocked the industry.
The Monetary Authority of Singapore plans to consult on proposed steps to regulate cryptocurrencies as early as September or October of this year, Managing Director Ravi Menon said. The revised rules may include further tightening retail-investor access to crypto, he added without providing details. "Going forward, in line with international regulators, we're also going to be broadening the scope of regulations to cover more activities," Menon said. As noted above, this year's market crash has exposed the cracks in global crypto regulation. Digital-asset lenders and creditors have lost billions of dollars and are currently trying to claw back money from collapsed hedge fund Three Arrows Capital. The upheaval began with a collapse of the TerraUSD stablecoin. Crypto Lender Celsius also filed for bankruptcy. Many of the defunct companies operated outside the scope of existing regulations, and their failures highlighted risky business practices as well as billions of dollars in debt. Regulators from the US to Singapore are now racing to patch those holes, while acknowledging that the effort will require more global coordination.
From a technical point of view, market sentiment on bitcoin has changed a bit. Speculators are expected to make every effort to protect the nearest important support level of $21,875. If the price breaks through and fixes below this mark, the trading instrument will slide to the lows of $21,140 and $20,500. In this case, BTC may well head for $19,880 and $19,320. If an upward correction continues, bears will try to regain control of the nearest resistance level at $22,850. Only consolidation above this range will return the asset back to $24,280 and $25,750. In this situation, the $26,780 area can be seen as a more distant target. Ether is back in the spotlight. The digital asset has managed to reach fairly high levels, which makes it quite attractive. Buyers will now strive to break above $1,540. If the price rises above this level, ether will be able to hit a new high around $1,644. When the price jumps to $1,740, it will be possible to talk about a bullish trend in the medium term. Price consolidation above this mark will result in a rebound to the key level of $1,830. In case ETH comes under pressure, bulls will make every effort to protect $1,470. If the price breaks through this range, it would be a wise decision to consider long positions in the area of $1,385 and $1,320. The material has been provided by InstaForex Company - www.instaforex.com |


| You are subscribed to email updates from Forex analysis review. To stop receiving these emails, you may unsubscribe now. | Email delivery powered by Google |
| Google, 1600 Amphitheatre Parkway, Mountain View, CA 94043, United States | |


Comments