Forex analysis review
Forex analysis review |
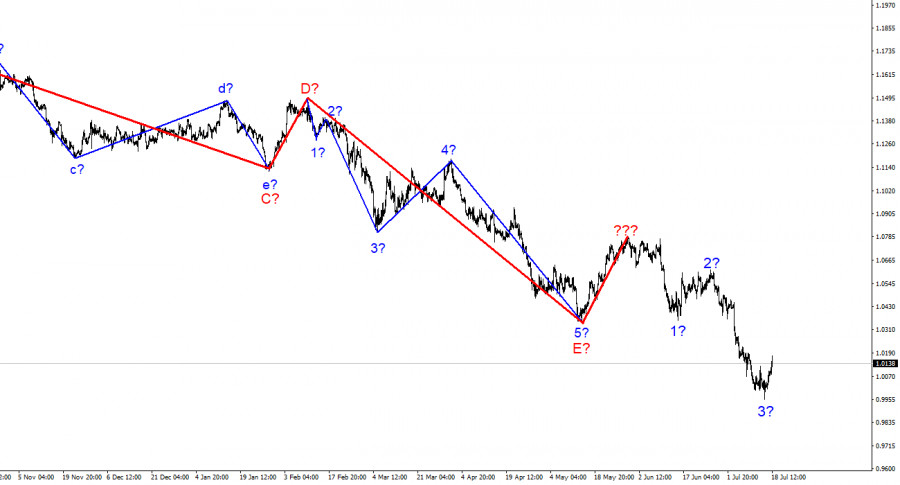
- Elliott wave analysis of EUR/USD for July 19, 2022
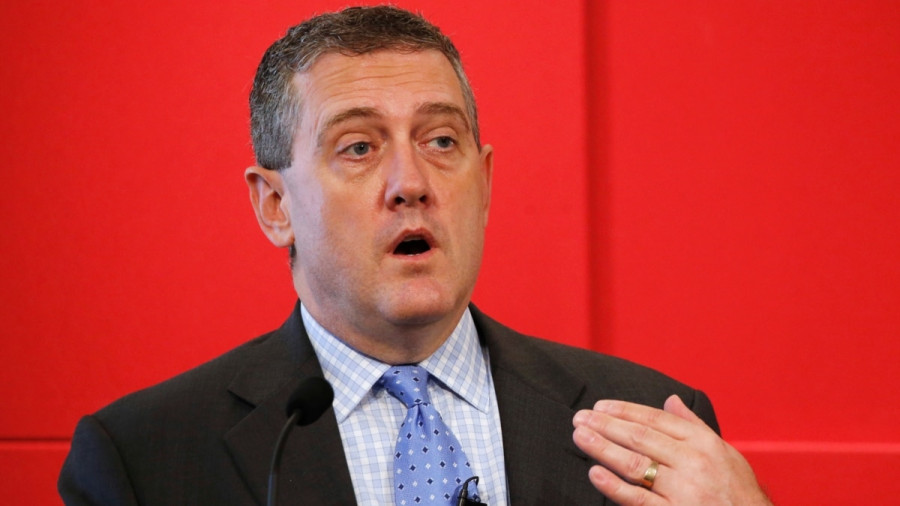
- Fed's Bullard says interest rate should rise to 4%
- Forecast and trading signals for EUR/USD for July 19. COT report. Detailed analysis of the pair's movement and trade deals.
- Technical Analysis of ETH/USD for July 19, 2022
- Technical Analysis of BTC/USD for July 19, 2022
- Technical Analysis of GBP/USD for July 19, 2022
- Technical Analysis of EUR/USD for July 19, 2022
- Trading Signal for EUR/USD for July 19 - 20, 2022: sell below 1.0185 (downtrend channel - 21 SMA)
- Forecast for GBP/USD on July 19, 2022
- Forecast for USD/JPY on July 19, 2022
- Overview of the EUR/USD pair. July 19. Important achievements of the euro and the pound.
- "Life-giving gas" for the euro: is the game with the dollar lost?
- GBP/USD analysis on July 18. The pound can complicate the already complex wave marking
- EUR/USD analysis on July 17. The pair could start building a corrective wave
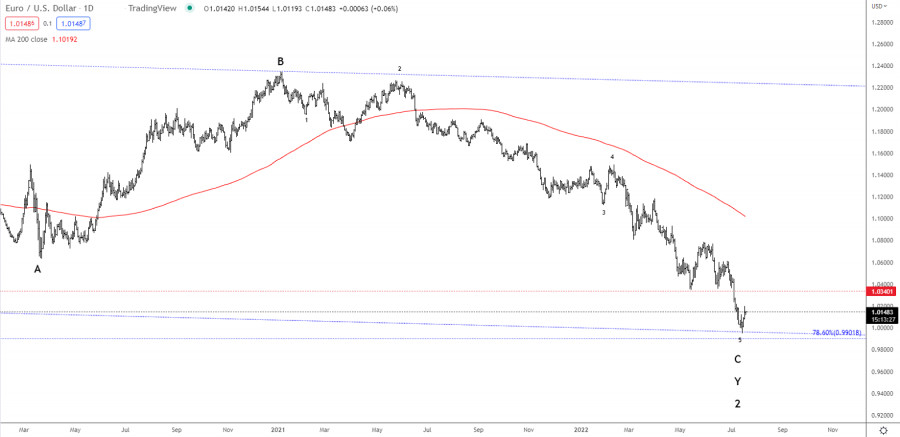
| Elliott wave analysis of EUR/USD for July 19, 2022 Posted: 18 Jul 2022 10:54 PM PDT
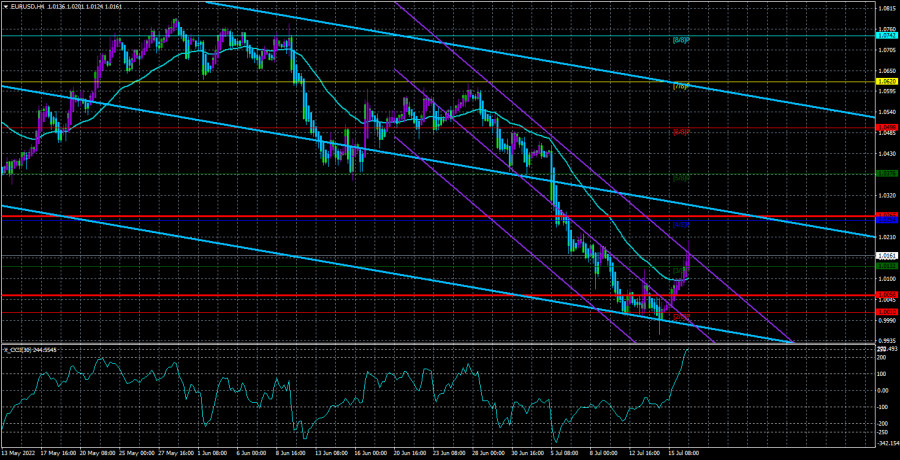
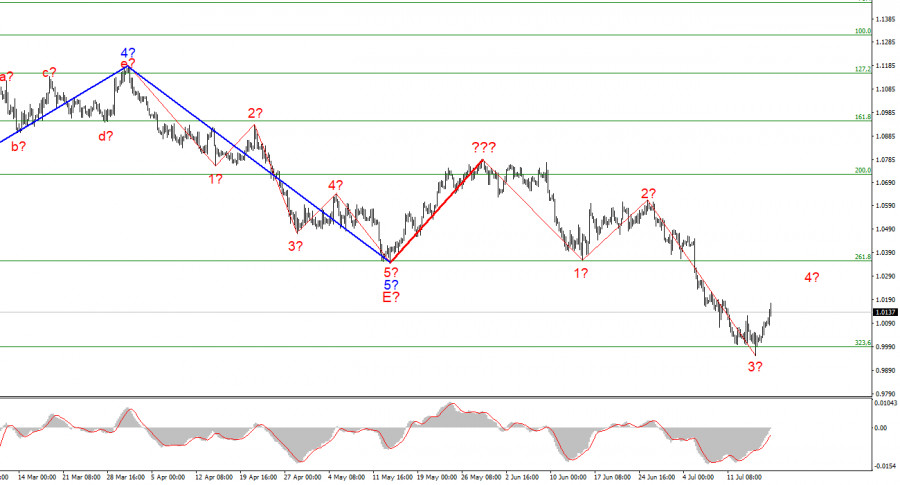
EUR/USD tested the channel support line at 0.9952 which was just above our ideal target at 0.9902. This could be enough to fulfil the target of wave C and 2 and set the stage for wave 3 higher. The expected impulsive rally in wave 3 should ultimately break above the peak of wave 1 at 1.6038. To confirm that wave 2 has indeed completed and wave 3 is in motion, we will need a break above minor resistance at 1.0220 and more importantly above resistance at 1.0615. The material has been provided by InstaForex Company - www.instaforex.com |
| Fed's Bullard says interest rate should rise to 4% Posted: 18 Jul 2022 10:15 PM PDT
The main US stock indices – the DOW Jones, NASDAQ, and S&P 500 – edged lower on Monday. With indices hovering around their yearly lows, stock market swings have been taking place. So, it is not about an upward correction but about a simple rebound after which quotes are likely to continue falling. Many experts see the US stock market continue to be bearish. Last week, some FOMC members delivered speeches. Some of their interviews were indeed interesting. Thus, the Fed's James Bullard said the interest rate should rise to 4% by the end of the year. Earlier, he backed a 3.5% rate hike. Most FOMC members used to believe that the interest rate should be gradually lifted to this level by the middle of 2023. However, Bullard has repeatedly stated that the rate should be raised to the highest level as soon as possible. It would allow the regulator to lower the rate the following year when inflation slows down steeply. So far, Bullard has been accurate in his forecasts and conclusions. We have already addressed the fact that a 3.5% interest rate will hardly be enough to ease inflation to at least 4%. We see that consumer prices are still on the rise despite a 1.75% rate increase. So, the central bank's measures have so far been ineffective. Consequently, a more aggressive approach is needed, for example, a 1.00% rate hike at the July meeting. Right now, such a scenario has a 25% probability. Other FOMC members who spoke last week advocate for a 0.75% rate increase. It remains to be seen how the Committee votes. Many FOMC officials say the primary focus should be on inflation reports, which means that the Fed might go ahead with Bullard's plan to raise the rate to 4% if inflation keeps soaring. Consequently, monetary tightening would become even more aggressive. This, in turn, would be driving the dollar further up for as long as the regulator would be lifting the interest rate. Meanwhile, the US stock market and the crypto market would be bearish. The material has been provided by InstaForex Company - www.instaforex.com |
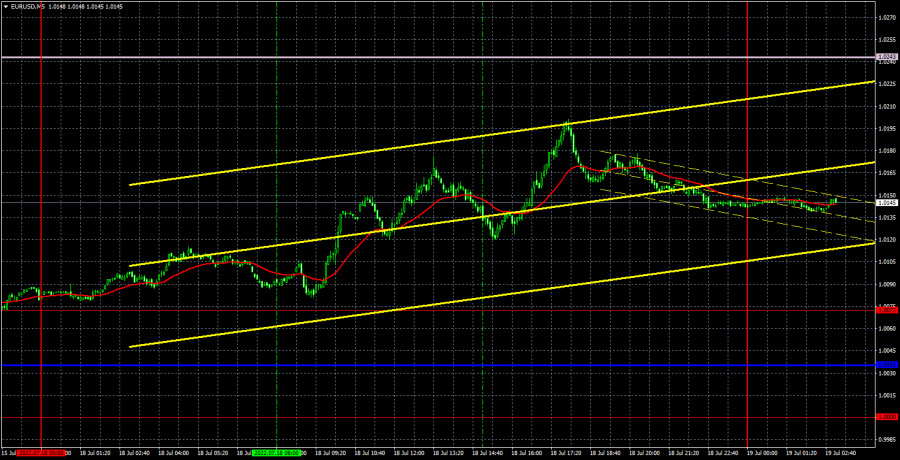
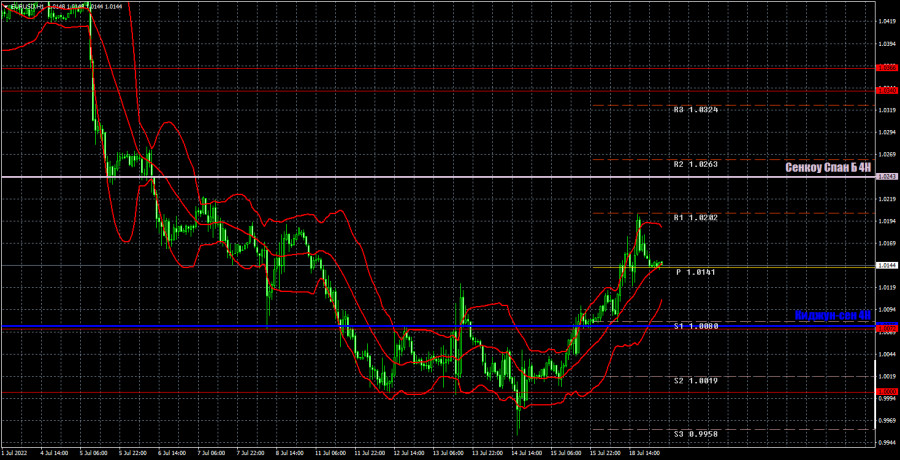
| Posted: 18 Jul 2022 09:41 PM PDT EUR/USD 5M
The EUR/USD pair unexpectedly started a strong upward correction on Monday. More precisely, it started to do so at the end of last week, and just continued on Monday. The last local high was overcome quite quickly and easily, so the pair can now continue moving up to the Senkou Span B line. But the euro's further growth will depend on the ability of traders to overcome the Ichimoku cloud on the 4-hour timeframe. Without overcoming the Senkou Span B line, there will be no succeeding growth. The euro has already grown on Monday, when there was not a single macroeconomic report. Of course, traders could start taking profits on the short positions that they have been actively opening in recent months. We talked about this earlier: it will be very problematic to predict the beginning of a correction on such a trend. Nevertheless, we still do not expect a strong growth from the euro, although we assume that the growth may continue for another 200-300 points. Still, the pair cannot move without corrections constantly in one direction. But this correction will be purely technical. But everything with trading signals was very sad on Monday, because during the day the price did not reach a single level or line. At the very beginning of the European trading session, the pair approached the level of 1.0072 within an arm's length, but still failed to work it out even with an error. Thus, trades should not have been opened during the day. COT report:
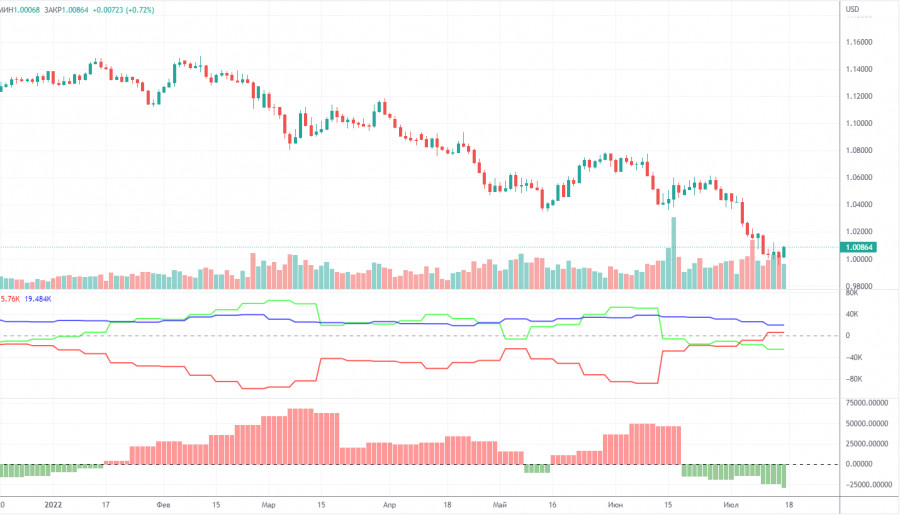
Commitment of Traders (COT) reports on the euro over the past six months have raised a huge number of questions. The chart above clearly shows that they showed a blatant bullish mood of professional players, but at the same time, the euro was falling at the same time. At this time, the situation has changed, and NOT in favor of the euro. If earlier the mood was bullish, but the euro was falling, now the mood has become bearish and... the euro is also falling. Therefore, for the time being, we do not see any grounds for the euro's growth, because the vast majority of factors remain against it. During the reporting week, the number of long positions increased by 100, and the number of shorts in the non-commercial group increased by 8,500. Accordingly, the net position decreased again, by almost 8,500 contracts. The mood of the big players remains bearish and has even increased slightly in recent weeks. From our point of view, this fact very eloquently indicates that at this time even commercial traders do not believe in the euro. The number of longs is lower than the number of shorts for non-commercial traders by 25,000. Therefore, we can state that not only the demand for the US dollar remains high, but also the demand for the euro is quite low. This may lead to a new, even greater fall of the euro. In principle, over the past few months or even more, the euro has not been able to show even a tangible correction, not to mention something more. The highest upward movement was about 400 points. We recommend to familiarize yourself with:Overview of the EUR/USD pair. July 19. Important achievements of the euro and the pound. Overview of the GBP/USD pair. July 19. The pound is resurrected from the dead. How long? Forecast and trading signals for GBP/USD on July 19. Detailed analysis of the movement of the pair and trading transactions. EUR/USD 1H
The downward trend continues on the hourly timeframe, but since there is neither a trend line nor a channel, one can only navigate along the Senkou Span B line. If the price remains below it, then the likelihood of a resumption of a long-term downward trend will increase. If it goes higher, the euro will get a chance to strengthen by another 100-200 points. On Tuesday, we allocate the following levels for trading - 1.0000, 1.0072, 1.0340-1.0366, 1.0485, as well as Senkou Span B (1.0243) and Kijun-sen (1.0075). Ichimoku indicator lines can move during the day, which should be taken into account when determining trading signals. There are also secondary support and resistance levels, but no signals are formed near them. Signals can be "rebounds" and "breakthrough" extreme levels and lines. Do not forget about placing a Stop Loss order at breakeven if the price has gone in the right direction for 15 points. This will protect you against possible losses if the signal turns out to be false. There are no major publications or events scheduled for July 19 in the US. But the EU will publish a report on inflation, to which, of course, the attention of the market will be riveted. The market shows a big reaction to data from overseas, but this report still needs to be worked out, since the future monetary policy of the European Central Bank, whose meeting will be held this week, depends on it. Explanations for the chart:Support and Resistance Levels are the levels that serve as targets when buying or selling the pair. You can place Take Profit near these levels. Kijun-sen and Senkou Span B lines are lines of the Ichimoku indicator transferred to the hourly timeframe from the 4-hour one. Support and resistance areas are areas from which the price has repeatedly rebounded off. Yellow lines are trend lines, trend channels and any other technical patterns. Indicator 1 on the COT charts is the size of the net position of each category of traders. Indicator 2 on the COT charts is the size of the net position for the non-commercial group. The material has been provided by InstaForex Company - www.instaforex.com |
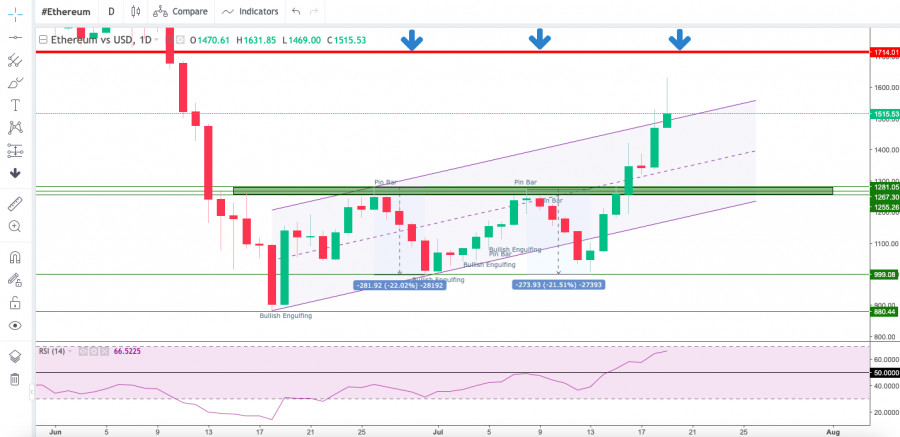
| Technical Analysis of ETH/USD for July 19, 2022 Posted: 18 Jul 2022 08:54 PM PDT Crypto Industry News: The crypto market is seeing a surge in positive sentiment as the world's two largest cryptocurrencies are experiencing solid gains, with Ethereum gaining more than 26% and Bitcoin up 6% in the past seven days. Merge - The connection will shift Ethereum to the more energy-efficient proof-of-stake protocol from the power-hungry proof-of-work protocol that Bitcoin also uses. Post-connection power consumption will drop 99.5% and the issuance of new ETH tokens will be cut by around 90%, with many analysts predicting the price of Ethereum to rise. The important news that preceded the rally was published by Ethereum developer Tim Beiko, who estimated that the Merge would take place on September 19. This date was given by Beiko during an Ethereum developer interview on Thursday. This is an approximate date and is not final. Technical Market Outlook: The ETH/USD pair had broken above the supply zone located between the levels of $1,255 - $1,281 and made a new local high at the level of $1,631. The momentum is at the level of 70 points already, so the bulls are now fully controlling the market. The intraday technical support is seen on the level of $1,319 and $1,281. The larger time frame trend remains down, however the recent breakout might be a beginning of a bigger bounce even towards the level of $1,750.
Weekly Pivot Points: WR3 - $1,617 WR2 - $1,509 WR1 - $1,470 Weekly Pivot - $1,401 WS1 - $1,362 WS2 - $1,294 WS3 - $1,185 Trading Outlook: The down trend on the H4, Daily and Weekly time frames had broken below the key long term technical support seen at the level of $1,420 and bears continue to make new lower lows with no problem whatsoever. So far every bounce and attempt to rally is being used to sell Ethereum for a better price by the market participants, so the bearish pressure is still high. The next target for bears is located at the levels below $1,000, like the last swing low seen at $880. Please notice, the down trend is being continued for the 13th consecutive week now. The material has been provided by InstaForex Company - www.instaforex.com |
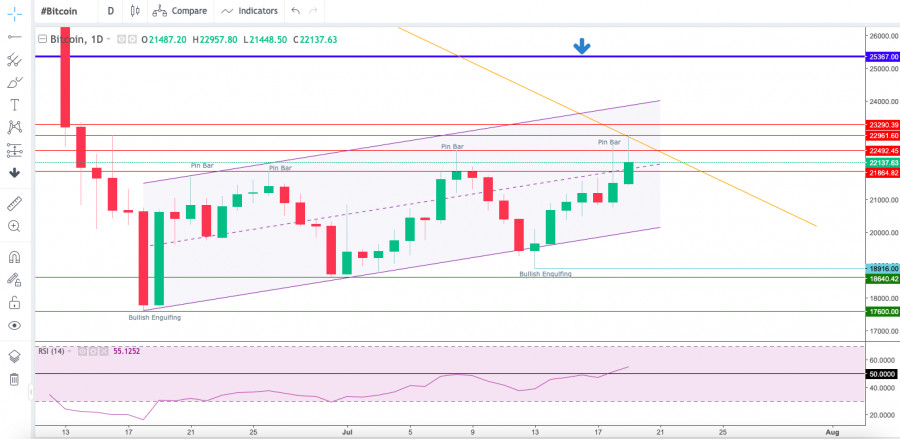
| Technical Analysis of BTC/USD for July 19, 2022 Posted: 18 Jul 2022 08:52 PM PDT Crypto Industry News: Bitcoin's price has just hit $22,957 at the time of writing - meaning that more than 45% of BTC holders have a "paper loss" or unrealized loss, according to Glassnode. In a tweet on Saturday, Glassnode noted that more than 80% of total US dollar funds invested in Bitcoin had not been touched for at least three months. In addition, the data is strikingly similar to that of previous Bitcoin den. This means that "most of the supply of BTC is dormant" and that the hunters are "increasingly reluctant to sell at lower prices," the company said. According to the Glassnode chart, other periods where similar Bitcoin hodling levels have occurred are the ends of the 2012, 2015, and 2018 bear market. Technical Market Outlook: The BTC/USD pair has bounced strongly from the lows seen at $18,916, but is still trading inside the ascending channel. The last local high was made at the level of $22,957. In a case of further bounce extension, the next target is seen at the level of $22,492, which is the local high from July 8th - for a valid breakout, the daily candle must close above this level. The level of $21,867 will now act as a technical support for bulls. The larger time frame outlook for Bitcoin remains bearish, however, we have unconfirmed Bullish Engulfing pattern on the Daily time frame chart, so please stay focused and keep an eye on the key technical levels. The gamechanger level is located at $25,367.
Weekly Pivot Points: WR3 - $23,780 WR2 - $22,629 WR1 - $22,245 Weekly Pivot - $21,487 WS1 - $21,094 WS2 - $20,326 WS3 - $19,175 Trading Outlook: The down trend on the H4, Daily and Weekly time frames continues. So far every bounce and attempt to rally is being used to sell Bitcoin for a better price by the market participants, so the bearish pressure is still high. The key long term technical support at the psychological level of $20,000 had been violated, the new swing low was made at $17,600 and if this level is violated, then the next long-term target for bulls is seen at $13,712. On the other hand, the gamechanging level for bulls is located at $25,367. The material has been provided by InstaForex Company - www.instaforex.com |
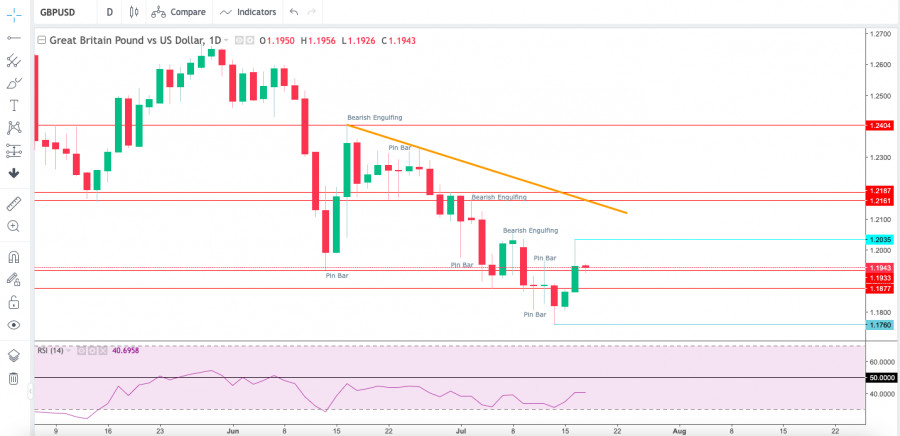
| Technical Analysis of GBP/USD for July 19, 2022 Posted: 18 Jul 2022 08:51 PM PDT Technical Market Outlook: The GBP/USD pair had bounced from the low made at the level of 1.1759 last week and the bulls are trying hard to rally towards the trend line. The weak and negative momentum on the daily time frame chart still supports the bearish outlook and the next target for bears is located at the level of 1.1410. However, the Cable had started the trading week trying to bounce higher towards the level of 1.1936 or even 1.2161. Nevertheless, the supply zone located between the levels of 1.2160 - 1.2187 is still the main short-term obstacle for bulls that needs to be broken if the rally is expected to be continued.
Weekly Pivot Points: WR3 - 1.1965 WR2 - 1.1925 WR1 - 1.1904 Weekly Pivot - 1.1885 WS1 - 1.1864 WS2 - 1.1846 WS3 - 1.1806 Trading Outlook: The price broke below the level of 1.3000 quite long time ago, so the bears enforced and confirmed their control over the market in the long term. The Cable is way below 100 and 200 WMA , so the bearish domination is clear and there is no indication of trend termination or reversal. The bulls are now trying to start the corrective cycle after a big Pin Bar candlestick pattern was made on the weekly time frame chart, however there is no visible progress here yet. The next long term target for bears is seen at the level of 1.1410. Please remember: trend is your friend. The material has been provided by InstaForex Company - www.instaforex.com |
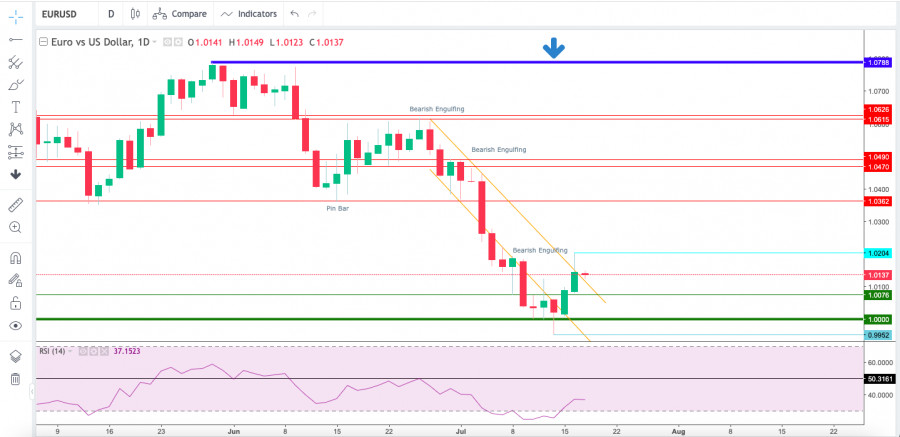
| Technical Analysis of EUR/USD for July 19, 2022 Posted: 18 Jul 2022 08:51 PM PDT Technical Market Outlook: The EUR/USD pair has bounced from the recent swing low made at the level of 0.9953 and then broken above the upper channel line around the level of 1.0146. The recent higher high was made at the level of 1.0204, but the daily time frame candle looks like a Pin Bar pattern. The next technical resistance is seen at the level of 1.0362, the nearest technical support is located at the level of 1.0076 and 1.0000. The last biggest bounce had been capped at the supply zone seen between the levels of 1.0470 - 1.0490, since then all the bounces are shallower and used to short the EUR. The weak and negative momentum on the daily time frame supports the bearish outlook for EUR.
Weekly Pivot Points: WR3 - 1.0162 WR2 - 1.0127 WR1 - 1.0107 Weekly Pivot - 1.0093 WS1 - 1.0073 WS2 - 1.0059 WS3 - 1.0025 Trading Outlook: The market continues to move lower as the down trend is still strong and the monetary parity level is the first target for bears in the long term.Nevertheless, the bullish cycle scenario is confirmed only after a breakout above the level of 1.0726, otherwise the bears will push the price lower towards the next long-term target at the level of 1.0000 or below. The up trend can be continued towards the next long-term target located at the level of 1.1186 only if the complex corrective structure will terminate soon (above 1.0000). The material has been provided by InstaForex Company - www.instaforex.com |
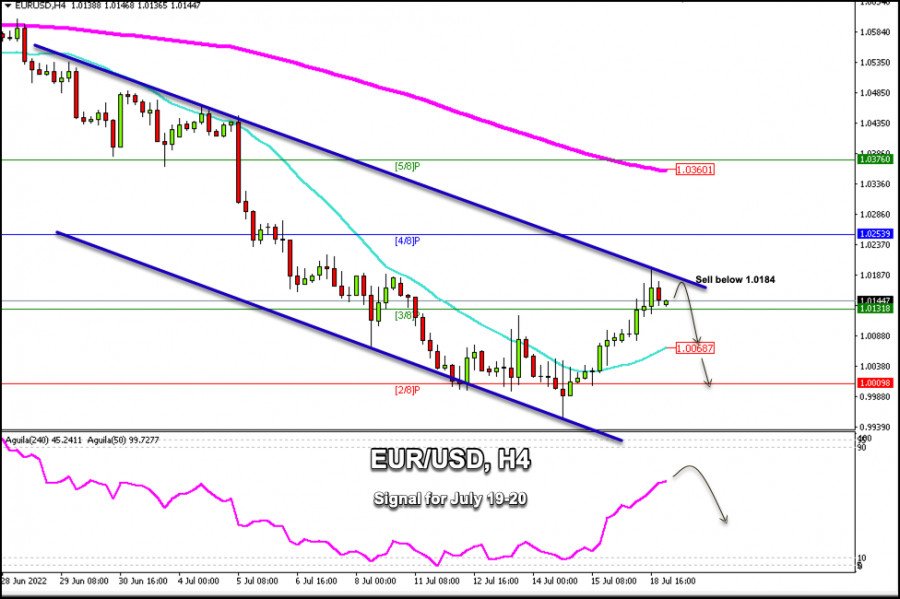
| Trading Signal for EUR/USD for July 19 - 20, 2022: sell below 1.0185 (downtrend channel - 21 SMA) Posted: 18 Jul 2022 08:44 PM PDT
Yesterday in the American session, the Euro reached the top of the downtrend channel formed on the 4-hour chart at around 1.0200. After reaching the low of 0.9951 on July 14, the euro has recovered, although the price still has a bearish bias. Currently, the EUR/USD pair is trading above the 21 SMA and above 3/8 Murray which means a positive outlook for the coming days. Yesterday in the European session, it reached levels of July 7th. Currently, this technical bounce is attributed to the fact that the Euro bears are taking profits, which has caused a momentary rally. In the short term, if the Euro trades below 1.0360, it could resume the downtrend. If the initial uptrend prevails, EUR/USD could eventually reach the 4/8 Murray resistance located at 1.0253. If the latter is broken, it will reach the July 5 levels at 1.0315, and finally the 200 EMA at 1.0362. On the other hand, the first support of EUR/USD would be 1.0131. If the price breaks below 3/8 Murray, it could drop towards the 21 SMA at 1.0068. Additionally, a daily close below this level could push the price to a 20-year low at 0.9952. If this support is broken, the next challenge for EUR/USD bears will be the lows of December 2002 at around 0.9859. The eagle indicator is showing a positive signal. However, it is approaching overbought levels. If the euro fails to break the top of the downtrend channel, we could expect a correction and the price could reach the 2/8 Murray at 1.0002. Our trading plan for the next few hours is to sell below 1.0185 with targets at 1.0068 and 1.0002. In the event of a daily close above 1.0200, we could buy with targets at 1.0250 and 1.0360. The material has been provided by InstaForex Company - www.instaforex.com |
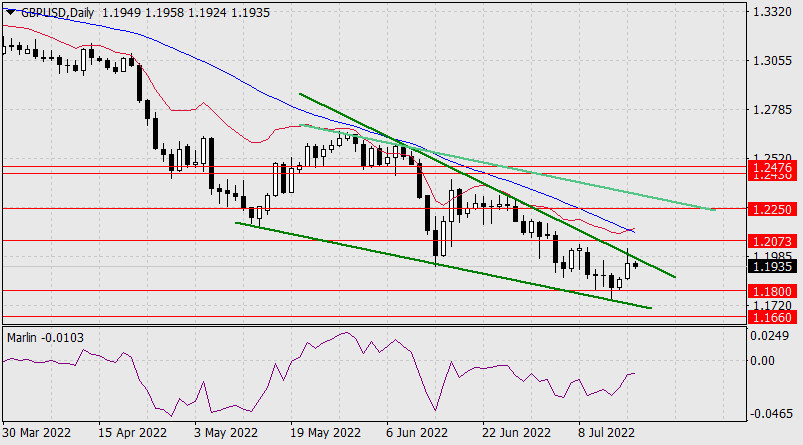
| Forecast for GBP/USD on July 19, 2022 Posted: 18 Jul 2022 08:03 PM PDT The British pound showed a good growth (at the moment by 170 points) on Monday, and by now it has rolled back more than half of this growth. As a result, the wedge-shaped formation was transformed into a longer one - built on extremes, which in the current situation shows the British currency's dependence on American players. The British nature of the development of an exchange instrument is seen through its opening and closing.
Data on the construction of new homes in the US for June will be released today, the forecast is 1.58 million y/y against 1.54 million y/y in May, and this circumstance may put even more pressure on the pound. The Marlin Oscillator on the daily scale is still in the negative area, there is a large space at the bottom of it, up to the oversold zone, it is enough for the price to come out of the wedge down. The goals of this movement are 1.1800, 1.1660. In the medium term, there is a target of 1.1410.
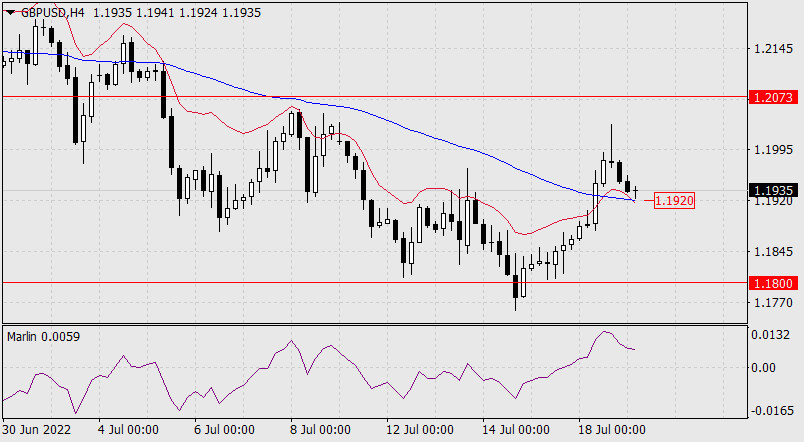
On a four-hour scale, the price approached the support of the MACD line (1.1920). Going under the line will give the first push to advance to 1.1800. The Marlin Oscillator is going down, it is still in the positive area, but by its nature in the current short-term situation it is in a leading position. The material has been provided by InstaForex Company - www.instaforex.com |
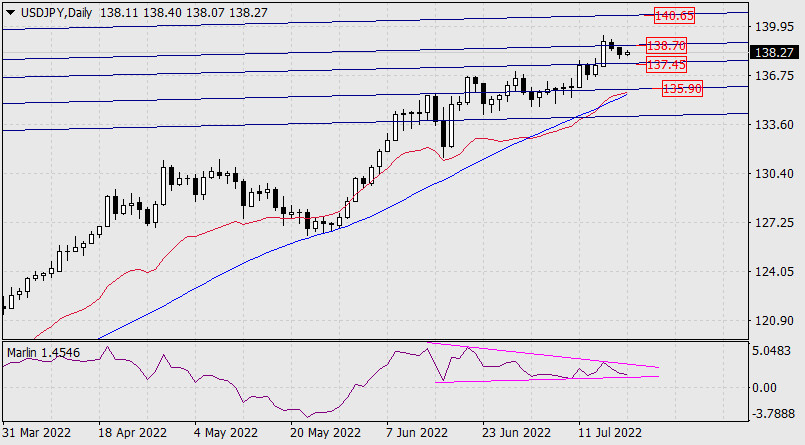
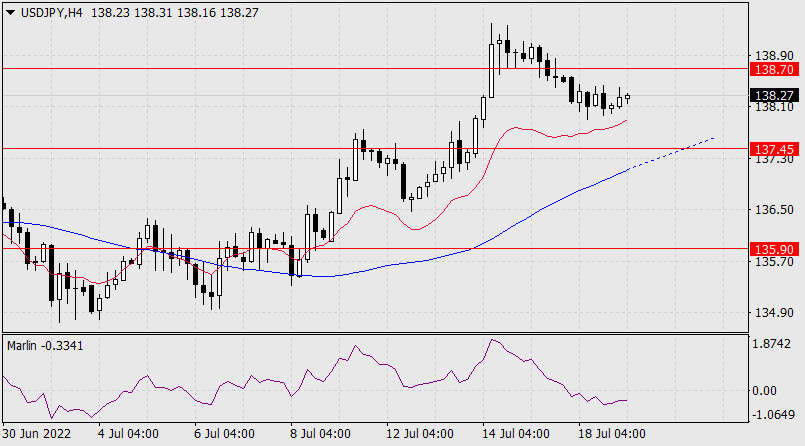
| Forecast for USD/JPY on July 19, 2022 Posted: 18 Jul 2022 08:03 PM PDT In the last two sessions, the USD/JPY pair has been declining in the range of two embedded lines of the rising channel of the monthly timeframe. At the moment, this range is defined by price marks 137.45 and 138.70. The decline was corrective.
Naturally, if the price breaks above the upper line at 138.70, it will open the target at 140.65, and if it goes below the lower line (alternative scenario), it will open the target at 135.90, which is already approaching the daily MACD line. The signal line of the Marlin Oscillator is developing in a wedge-shaped formation, which also creates an advantage for the growing scenario.
The price develops above the balance and MACD indicator lines on the H4 chart. The Marlin Oscillator is turning up with the intention of moving into an upward trend zone and helping the price develop a bullish attack. The material has been provided by InstaForex Company - www.instaforex.com |
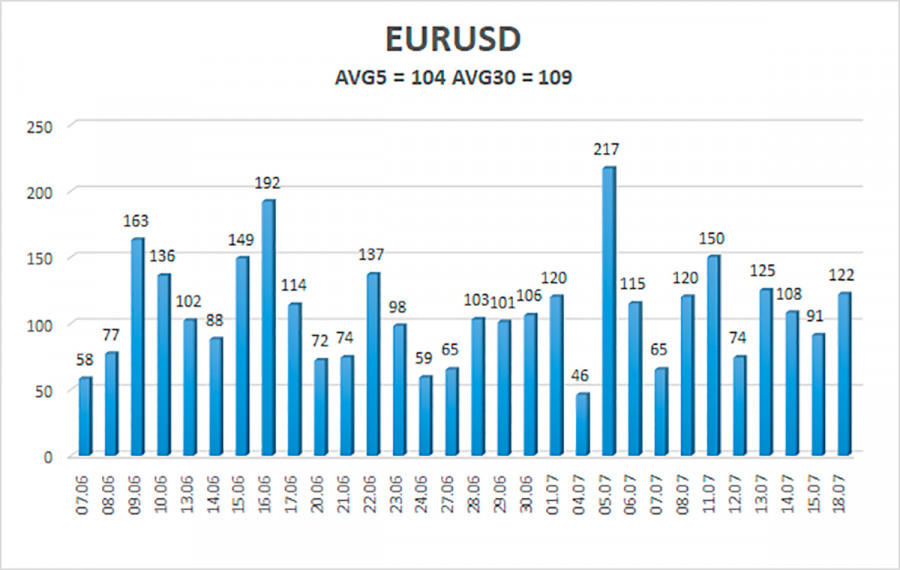
| Overview of the EUR/USD pair. July 19. Important achievements of the euro and the pound. Posted: 18 Jul 2022 05:27 PM PDT
On Monday, the EUR/USD currency pair, very unexpectedly for many, resumed the upward rise that began on Friday. In recent weeks and even months, traders have become so accustomed to the eternal collapse of the euro and pound that any growth looks weird. However, we have frequently maintained that no instrument should fall consistently. The problem is that it is practically impossible to foresee the beginning of a new correction currently. It would be easier if the market reacted significantly to macroeconomic statistics. But either the facts themselves, in most situations, favor the dollar, or market players, in most circumstances, do not pay heed to the negative data for the dollar. This leads to practically one-way traffic. And suddenly, on Monday, with an empty schedule of macroeconomic and fundamental events, we witnessed a gain of 100 points. And it doesn't matter that after this growth, the pair instantly hurried back down. The crucial issue is an increase, which implies that the pair may fall further lower. There is a very difficult attitude to almost any correction anymore. On the one hand, the pair has been falling for a very long time and quite forcefully, and any correction is viewed unconsciously as the beginning of a new rally. Conversely, the longer the pair falls, the fewer buyers remain on the market. Why trade against the trend? A significant slump nearly ensures profit for all market participants, so why bother purchasing at all? Therefore, although the pair was fixed above the moving average line yesterday, we believe the decline could restart at any moment. It doesn't even require solid statistics or big fundamental occurrences. With such a powerful trend, sales can be conducted out of the blue. The entire underlying background hinges on ECB and Fed interest rates. Do you recall how it was previously? The market frequently discussed the trade war between the United States and China, some elections in the European Union, then in the United States, and every day it was possible to analyze Donald Trump's words, who amused and continue to delight the public. "Coronavirus," stimulus packages, bonds, loans, economic recovery. Currently, nobody is interested in all of this. The pandemic, which scared the globe for two years, was swiftly and readily forgotten. It appears that the coronavirus has taken a vacation and is currently preparing to return. To accomplish this, though, someone must be interested in them, and the world's focus is currently on Russia and Ukraine. This, however, is geopolitics. Certainly, it is crucial, and 60 percent (according to our estimates) of the decline of the euro and the pound against the dollar may be attributed to it. However, there is also a theoretically more significant background than geopolitics. In addition to microeconomics, macroeconomics should also impact the trend. However, this is no longer engaging. The only issue of interest is how much the ECB and the Fed will hike interest rates at their meetings. Everyone discusses this topic nearly every day. People are busy attempting to forecast the central bank's activities during the entire interval between its two sessions, as we have entered some futuristic era. It appears that approximately 1.5 months pass between meetings on average. The Central Bank makes a decision, it can be analyzed for a few days, and then attention is shifted to other events. But currently, experts, analysts, traders, and the media are only talking about how this or that central bank would boost its key rate? And it appears that the remaining forty percent of geopolitical influence is migrating away from this issue. Because the Fed routinely raises the key rate, whereas the ECB does not. This week, the European regulator will hold a conference at which (miracle of miracles!) the rate may be increased by "up to" 0.25 percent. From our perspective, such an increase to combat inflation, which is already approaching 10 percent, is equivalent to throwing rocks at a train. Nonetheless, intelligent individuals work at the ECB, so they likely know better. We can only evaluate and respond. And based on the steady decline of the euro, the market concurs that the ECB's efforts thus far appear ridiculous. As of July 19, the average volatility of the euro/dollar currency pair for the previous five trading days was 104 points, which is considered "high." Thus, we anticipate the pair to trade between 1.0056 and 1.0265 today. The downward reversal of the Heiken Ashi indicator suggests a likely continuation of the downturn. Nearest support levels: S1 – 1.0132 S2 – 1.0010 S3 – 0.9888 Nearest resistance levels: R1 – 1.0254 R2 – 1.0376 R3 – 1.0498 Trading Recommendations: The EUR/USD pair has maintained its position above the moving average line. Maintain long positions with goals between 1.0254 and 1.0376 until the Heiken-Ashi indicator turns bearish. The pair's sales will become crucial when anchored below the moving average with targets of 1.0010 and 0.9888. Explanations for the figures: Channels of linear regression – aid in determining the present trend. If both are moving in the same direction, the trend is now strong. The moving average line (settings 20.0, smoothed) – determines the current short-term trend and trading direction. Murray levels serve as movement and correction targets. Volatility levels (red lines) represent the expected price channel the pair will trade within over the next trading day, based on the current volatility indicators. The CCI indicator — its entry into the oversold area (below -250) or the overbought area (above +250) indicates that a trend reversal is imminent. The material has been provided by InstaForex Company - www.instaforex.com |
| "Life-giving gas" for the euro: is the game with the dollar lost? Posted: 18 Jul 2022 02:46 PM PDT
The gas issue associated with the introduction of anti-Russian sanctions, and the problems that arose after the lack of fuel in the eurozone, undermined the position of the euro. Against this background, the EUR fell to parity with the greenback, and then even lower. By now, the situation has somewhat stabilized. However, many analysts believe that in terms of the global market, the euro is close to losing. The current week the euro began with attempts to rise, often unsuccessful. At the end of last week, the euro was given $1.0094, and by now it has fallen in price again. The EUR/USD pair was trading at 1.0085 on Monday morning, July 18, causing concern among traders and investors.
Market participants are looking forward to Thursday, July 21, when the decision on the gas coming through the Nord Stream pipeline will be made public. The fate of blue fuel depends on many factors, and the further dynamics of the euro depends on its receipt in the countries of the European bloc. Currency strategists are counting on the resumption of gas supply through the Nord Stream pipeline from Russia to Germany. If, after scheduled maintenance, the launch of gas does not occur, then most world currencies will be at the bottom, analysts at the Commonwealth Bank of Australia believe. In the event of the suspension of the pipeline, Europe will be covered by an energy crisis that will provoke a recession in the region. The implementation of such a scenario will put serious pressure on the euro, experts conclude. The current week will be decisive for the euro. On Thursday, the European Central Bank is expected to raise its deposit rate by 25 bp to -0.25% for the first time since 2011. However, the markets are worried about the uncertainty of the central bank on a number of issues. Fuel to the fire adds a sharp increase in the cost of imports amid rising energy prices, primarily oil and gas. As a result, an impressive trade deficit was recorded in the eurozone, if it persists, the euro will seriously sink. At the moment, the euro is under pressure from the risk of unprecedented economic stagnation caused by the biggest energy crisis in the last 50 years. An additional factor of pressure on the euro, in addition to the energy crisis, experts believe the likelihood of a debt crisis. The above risks are exacerbated by skyrocketing inflation and the rate hike by the ECB. The high likelihood of a recession and a potential shortage of gas due to reduced supplies from the Russian Federation prevent the ECV from raising rates at the same speed as the Federal Reserve. A significant difference in interest rates contributes to the weakening of the euro against the USD. According to analysts, "the rate differential in the eurozone and the US" was not in favor of the EUR. The euro was unable to take advantage of the short-term subsidence of the dollar, which started the week with a pullback from multi-year highs. Recall that this year the greenback skyrocketed thanks to a combination of rising Fed interest rates and the instability of the economies of Europe and China. Last week, the USD reached parity with the euro for the first time in 20 years, and then exceeded it. To date, the dollar has again rolled back to lower values than before, but still remains the strongest contender in the financial market. Strengthening the greenback contributes to the current monetary policy of the Fed. A key factor in the strengthening of the USD is the central bank's move to raise rates in response to record high inflation in the US. It is expected that in July, at the next meeting, the Fed will raise interest rates by 75 basis points. At the same time, some analysts and market participants expect an increase of 100 bp. However, the likelihood of such a rise is now questionable. In the context of a possible recession and an increase in interest rates in the US, investors prefer to go to the dollar. This fuels the latter's momentum, helping it rise against the euro. According to currency strategists at HSBC, further strengthening of the greenback is possible with a slowdown in global economic growth. Against this background, HSBC raised its forecast for the US currency, emphasizing that "the dollar bull run is not over yet." Strengthening the greenback during a crisis is a standard market reaction, experts emphasize. The material has been provided by InstaForex Company - www.instaforex.com |
| GBP/USD analysis on July 18. The pound can complicate the already complex wave marking Posted: 18 Jul 2022 08:07 AM PDT
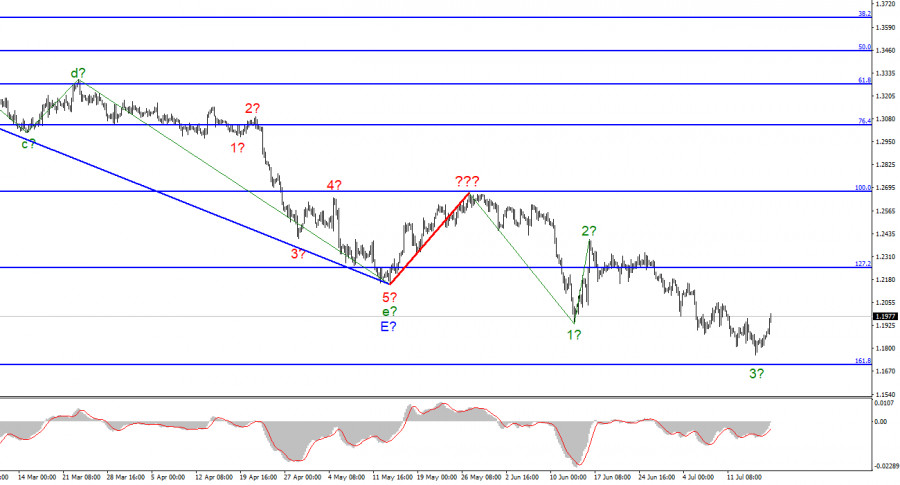
The wave marking for the pound/dollar instrument required clarifications, which were made. The upward wave constructed between May 13 and May 27 does not currently fit into the overall wave picture, but it can still be regarded as a segment of the downward trend. Thus, we can now definitively state that the building of the upward correction phase of the trend has been canceled, and the downward component of the trend will have a longer and more complex shape. I am not a huge fan of continually complicating the wave marking when dealing with a trend zone that is significantly elongating. I believe it would be far more efficient to recognize rare corrective waves, following which new impulse structures could be constructed. Now that waves 1 and 2 have been completed, we may infer that the instrument is in the process of constructing wave 3. However, this wave proved unconvincing (if finished now), as its low is not significantly lower than wave 1's low. Consequently, the current downturn cannot be characterized as impulsive, but it may be a complex correction. Focus on the wave marking of the EUR/USD instrument in this regard. The pound no longer knows what it desires. In July, the pound and dollar exchange rate jumped by 150 basis points. This is excellent news for the British, whose demand has been progressively falling over the past few months. I leave unanswered the question of why there was such an increase in the value of the British pound on Monday when no significant event occurred. The wave marking did not indicate a significant increase, as the third wave is not yet complete. However, the pound decided to confound everyone and everything. Initially, the instrument did not want to construct a logical trend correction section; now, it does not want to construct a logical trend impulse declining part. Thus, you must anticipate that the wave marking will get increasingly complex on multiple occasions. The market is currently anticipating two significant central bank meetings. Future meetings are crucial since both may include surprises. Over the past two weeks, the likelihood of a 100-basis-point rate hike by the Federal Reserve has slowly climbed as the inflation report has once again disappointed American analysts and lawmakers. Currently, this chance is less than 25 percent, but some FOMC members still support a 100-point tightening. Therefore, this possibility cannot be ruled out entirely. Additionally, the Bank of England may provide a surprise. It raised interest rates five times in a row, although this had no effect on inflation in the United Kingdom. On Wednesday, a new report will be revealed; if the consumer price index rises more than anticipated, the Bank of England may decide to take drastic action and raise the interest rate by 50 basis points. This situation may lead to a rise in demand for the pound sterling, given all previous gains were deemed insufficient by the market. General conclusions The increased complexity of the wave structure of the pound/dollar pair signals a further downturn. For each "down" MACD signal, I recommend selling the instrument with objectives at the estimated mark of 1.1708, corresponding to 161.8 percent Fibonacci. Now, there is a prospect of an upward wave forming, but I do not anticipate it to be robust and protracted.
At the higher wave scale, the image closely resembles the euro/dollar instrument. The same ascending wave does not fit the present wave pattern, followed by the same three descending waves. Thus, one thing is unmistakable: the downward segment of the trend continues to develop and can reach practically any length. The material has been provided by InstaForex Company - www.instaforex.com |
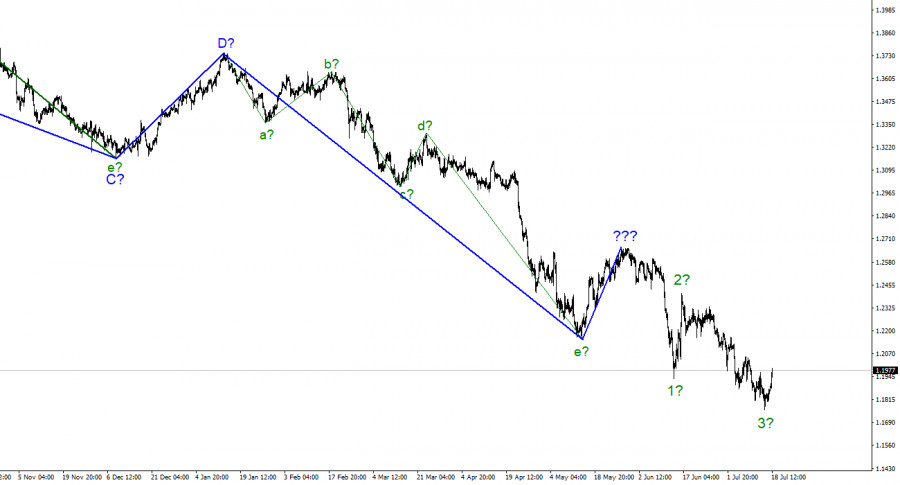
| EUR/USD analysis on July 17. The pair could start building a corrective wave Posted: 18 Jul 2022 07:30 AM PDT
A few weeks ago, the wave markings on the 4-hour chart for the euro/dollar instrument got more complex and no longer had a holistic appearance. There was a successful attempt to break through the 261.8 percent Fibonacci level, which was also the low point of the waves E and b. Hence, these waves are no longer E and b. Thus, I have constructed a new wave markup that does not yet account for the ascending wave indicated by a bold red line. I've already stated that the entire wave structure can be complicated indefinitely. This is the drawback of wave analysis, as any structure is always capable of assuming a more complicated and extensive shape. Consequently, I propose to now focus on simpler wave structures, including waves of a smaller scale. As can be seen, the formation of an upward wave, which may be wave 4 of a new downward trend segment, has begun. If this prediction is right, the instrument's drop will resume within wave 5 with objectives positioned below 1.0000 after an additional 100-150 basis points gain. So far, I see no reason to anticipate additional instrument moves. The euro surpassed parity with the dollar in terms of value. On Monday, the euro/dollar pair increased by 65 basis points. There was no news background on this day, but the market is still unwilling to wait for new inflation data or a new central bank meeting. If not for the wave that does not fit into the broader wave picture, I would conclude that the market is currently trading based only on wave analysis, with no regard for the news background. However, this is certainly not the case, and it is also impossible to dismiss the significant influence of waves. This week, something may occur that markets have anticipated, believed, or hoped for a very long time. Since 2008, the ECB may raise the interest rate for the first time. I do not believe this will instantly lead to a surge in demand for the euro and the formation of a new upward trend segment, but the event is nonetheless extraordinary and consequential. Allow me to remind you that the ECB has nearly reached an impasse. Now that inflation has reached 8.6 percent, there is no alternative but to increase the rate. However, this action should have been taken at the start of the year, when inflation was only beginning to accelerate. But at that time, the Ukrainian-Russian conflict began with uncertain repercussions for the European economy, and the ECB was hesitant to take chances in such a precarious circumstance. In addition, we are all aware of the Fed's actions: the rate is raised at each meeting, but inflation continues to climb. Perhaps the European Central Bank was not erroneous in delaying a rate hike. What difference does it make if inflation rises due to an increase in the interest rate or not? Recent quarters have shown relatively feeble growth for the European economy, and the tightening of monetary policy may be the final nail in its coffin. Moreover, the European Union does not need a strong euro. General conclusions I infer based on my findings that construction of the downward trend segment continues. Consequently, it is now viable to sell the instrument with goals near the predicted mark of 0.9397, which corresponds to 423.6 percent Fibonacci, for each "down" MACD signal, based on the building of wave 5. A failed effort to surpass the level of 323.6 percent signals the temporary unavailability of the market for new sales and the commencement of corrective wave 4. Consequently, you may also await the conclusion of this wave before resuming sales.
At the larger wave size, the wave marking of the descending trend segment becomes considerably more complex and extends in length. It can assume virtually any length. Thus, I believe it is best to concentrate and focus on three and five-wave conventional wave structures at this time. The material has been provided by InstaForex Company - www.instaforex.com |

| You are subscribed to email updates from Forex analysis review. To stop receiving these emails, you may unsubscribe now. | Email delivery powered by Google |
| Google, 1600 Amphitheatre Parkway, Mountain View, CA 94043, United States | |


Comments