Forex analysis review
Forex analysis review |
- How to trade GBP/USD on July 18? Simple tips for beginners.
- How to trade EUR/USD on July 18? Simple tips for beginners.
- USD/CAD. The Bank of Canada released the genie from the bottle
- Technical analysis of AUD/USD for July 17, 2022
- Technical analysis of BTC/USD for July 17, 2022
- Bitcoin is the most paradoxical of the existing assets.
- Is Bitcoin preparing for another collapse?
- GBP/USD analysis on July 16. The pound is not too interested in the election of a new prime minister.
- EUR/USD analysis on July 16. There is a chance for the growth of the euro.
- Analysis of the trading week of July 11-15 for the GBP/USD pair. COT report. The pound sterling has again been drowned in
- Analysis of the trading week of July 11-15 for the EUR/USD pair. COT report. Inflation in the United States has risen again,
- US stocks showed mainly a fall (by 0.3-0.5%)
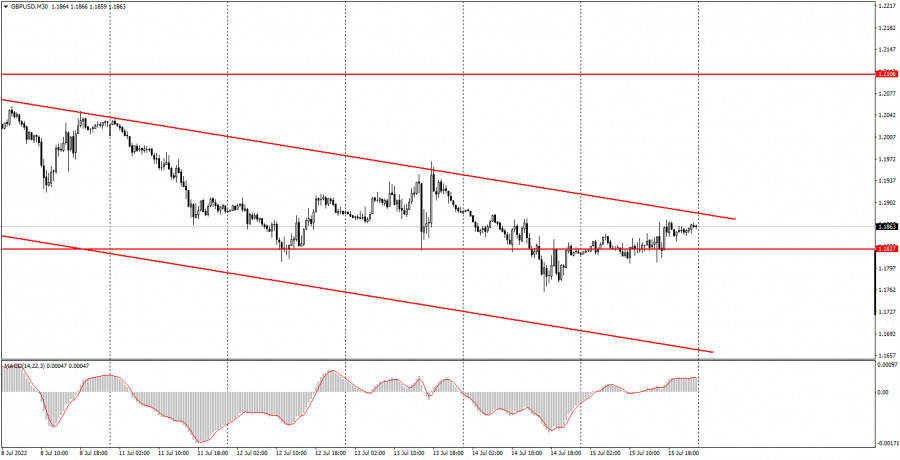
| How to trade GBP/USD on July 18? Simple tips for beginners. Posted: 17 Jul 2022 07:04 AM PDT Analysis of Friday's deals:30M chart of the GBP/USD pair
The GBP/USD pair showed an absolutely indistinct movement on Friday. By and large, the price was in a flat or very close to it the entire day, which has not happened for quite a long period of time. A small burst of activity was observed at the beginning of the US trading session, but the volatility of the day was quite low, which, again, has not happened for a very long time. As a result, the pound started an upward correction, but is still within the descending channel, so the downward trend continues. If the price overcomes the upper limit of this channel, then we can talk about the prospects for a more serious growth of the British currency, but there is one very important point here. The pair should leave the channel not in a flat. It is obvious that if the channel is descending and the price is moving sideways, then sooner or later the channel will go below the price itself. It is necessary that it be the other way around: the price must break through the channel and leave it. Otherwise, we will not receive a strong buy signal. There were no important statistics and fundamental events in the UK on Friday. Three reports in the US, which turned out to be offsetting each other, caused a slight market reaction, but it did not affect the general state of affairs. 5M chart of the GBP/USD pair
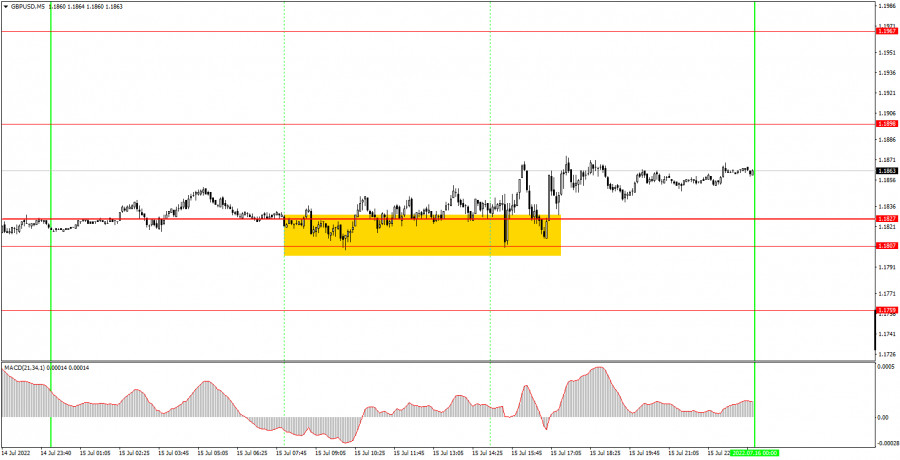
Friday's movements on the 5-minute timeframe were even more telling than on the 30-minute timeframe. By and large, the pair was trading near the 1.1807-1.1827 area for the entire European session, bouncing off it every hour. Therefore, buy signals were scattered. Since the price never settled below the indicated area, the long position (whenever it was opened) should have remained the only deal of the day, and it had to be closed manually in the late afternoon. In this case, you could even earn a few dozen points. But in general, both the movements and the signals on Friday were very complex and confusing. The pound moved away from its 2-year lows with great difficulty, and now, if it wants to continue rising, it needs to be bought by market participants. And we are not seeing much desire among traders to buy the pound or the euro. How to trade on Monday:On the 30-minute timeframe, the pair is likely to try to leave the descending channel again next week. If it manages to leave it, not as a result of a flat, this can be considered a signal for a stronger growth. Otherwise, a flat may begin or a downward movement may resume. On the 5-minute TF on Monday, it is recommended to trade at the levels of 1.1759, 1.1807-1.1827, 1.1898, 1.1967. When the price passes after opening a deal in the right direction for 20 points, Stop Loss should be set to breakeven. There are no major reports or other events scheduled for Monday in the UK and America. Volatility dropped sharply on Friday, so on Monday we will see if this is a fluke or not. If the flat and low volatility continue, this will mean that traders will be waiting. In standby mode for meetings of the Federal Reserve and the Bank of England. Basic rules of the trading system:1) The signal strength is calculated by the time it took to form the signal (bounce or overcome the level). The less time it took, the stronger the signal. 2) If two or more deals were opened near a certain level based on false signals (which did not trigger Take Profit or the nearest target level), then all subsequent signals from this level should be ignored. 3) In a flat, any pair can form a lot of false signals or not form them at all. But in any case, at the first signs of a flat, it is better to stop trading. 4) Trade deals are opened in the time period between the beginning of the European session and until the middle of the American one, when all deals must be closed manually. 5) On the 30-minute TF, using signals from the MACD indicator, you can trade only if there is good volatility and a trend, which is confirmed by a trend line or a trend channel. 6) If two levels are located too close to each other (from 5 to 15 points), then they should be considered as an area of support or resistance. On the chart:Support and Resistance Levels are the Levels that serve as targets when buying or selling the pair. You can place Take Profit near these levels. Red lines are the channels or trend lines that display the current trend and show in which direction it is better to trade now. The MACD indicator (14,22,3) consists of a histogram and a signal line. When they cross, this is a signal to enter the market. It is recommended to use this indicator in combination with trend lines (channels and trend lines). Important speeches and reports (always contained in the news calendar) can greatly influence the movement of a currency pair. Therefore, during their exit, it is recommended to trade as carefully as possible or exit the market in order to avoid a sharp price reversal against the previous movement. Beginners on Forex should remember that not every single trade has to be profitable. The development of a clear strategy and money management are the key to success in trading over a long period of time. The material has been provided by InstaForex Company - www.instaforex.com |
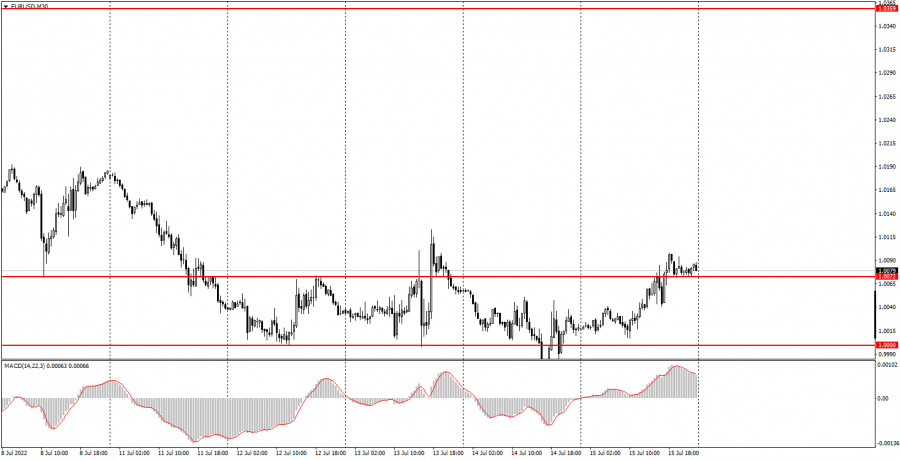
| How to trade EUR/USD on July 18? Simple tips for beginners. Posted: 17 Jul 2022 06:54 AM PDT Analysis of Friday's deals:30M chart of the EUR/USD pair
The EUR/USD currency pair tried to start a new round of corrective movement on Friday. The pair retreated from its 20-year lows with great difficulty, and in general, it cannot yet be said that the correction will be strong and long-lasting. We would even say the opposite: traders still continue to show their complete disinterest in buying the euro. The logic here is simple: the stronger the fall, the stronger the rebound should be later when traders start taking profits. At the same time, we do not observe any "strong rebound" at all, but the fall in recent months and even years has been very strong. Thus, it is likely that we will see another indistinct correction, after which the fall will resume. There is not much to say about the statistics released on Friday. If retail sales in the US showed the best dynamics in June, then industrial production declined with positive forecasts. That is, the reports were not the most significant, and even overlapped each other. Therefore, we do not connect the pair's movement on Friday with macroeconomic statistics at all. 5M chart of the EUR/USD pair
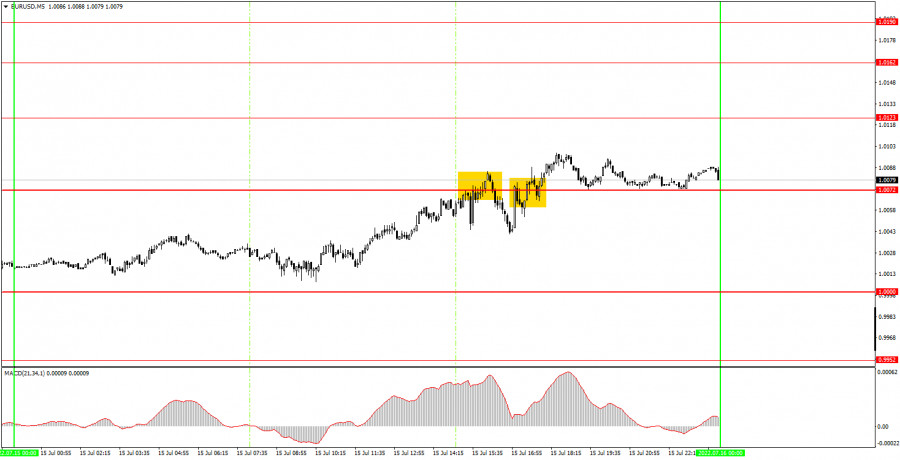
Friday's trading signals on the 5-minute timeframe were as vague as the movement itself. Despite the fact that the volatility was at least 90 points, we cannot call this movement good. Two trading signals of the day formed near the level of 1.0072, but if desired, more signals could be considered there, since the price mostly ignored this level. We left it in the chart for now so that there is no empty space, but there is a high probability that it will have to be removed. The first bounce signal from 1.0072 was very inaccurate. In fact, the pair bounced twice from this level in a short period of time. And down after the formation of the signal, it managed to reach only 20 points. And even then, after the second rebound, and after the first - not at all. That is, novice traders could have problems with the first signal. The circumstance is softened a bit by the fact that the moment when this signal was formed was when the report on retail sales was released in America and the market reaction to 23 points nevertheless followed. That is, it turns out that there was a reaction, but it was insignificant and at the same time spoiled a good signal. The second signal to overcome the level of 1.0072 was also not the most accurate. But the price still settled above this level and was able to go up 16 points, which was at least enough to set Stop Loss to breakeven. Therefore, it was definitely not possible to make money on Friday, but at least there were no serious losses. How to trade on Monday:The new downward trend continues on the 30-minute time frame, and the price with grief in half settled above the level of 1.0072. Theoretically, the euro received certain technical grounds for continuing growth, but in fact it can resume falling at any moment. On the 5-minute TF on Monday, it is recommended to trade at the levels of 1.0000, 0.9952, 1.0000, 1.0072, 1.0123, 1.0162-1.0190, 1.0235. When passing 15 points in the right direction, you should set Stop Loss to breakeven. There will be no important report or event in either the European Union or the United States. However, this does not mean that now the pair will stand still. The last two days also showed that the upward correction is still a big problem for the pair, but the volatility remains very high for the euro. Basic rules of the trading system:1) The signal strength is calculated by the time it took to form the signal (bounce or overcome the level). The less time it took, the stronger the signal. 2) If two or more deals were opened near a certain level based on false signals (which did not trigger Take Profit or the nearest target level), then all subsequent signals from this level should be ignored. 3) In a flat, any pair can form a lot of false signals or not form them at all. But in any case, at the first signs of a flat, it is better to stop trading. 4) Trade deals are opened in the time period between the beginning of the European session and until the middle of the US one, when all deals must be closed manually. 5) On the 30-minute TF, using signals from the MACD indicator, you can trade only if there is good volatility and a trend, which is confirmed by a trend line or a trend channel. 6) If two levels are located too close to each other (from 5 to 15 points), then they should be considered as an area of support or resistance. On the chart:Support and Resistance Levels are the Levels that serve as targets when buying or selling the pair. You can place Take Profit near these levels. Red lines are the channels or trend lines that display the current trend and show in which direction it is better to trade now. The MACD indicator (14,22,3) consists of a histogram and a signal line. When they cross, this is a signal to enter the market. It is recommended to use this indicator in combination with trend lines (channels and trend lines). Important speeches and reports (always contained in the news calendar) can greatly influence the movement of a currency pair. Therefore, during their exit, it is recommended to trade as carefully as possible or exit the market in order to avoid a sharp price reversal against the previous movement. Beginners on Forex should remember that not every single trade has to be profitable. The development of a clear strategy and money management are the key to success in trading over a long period of time. The material has been provided by InstaForex Company - www.instaforex.com |
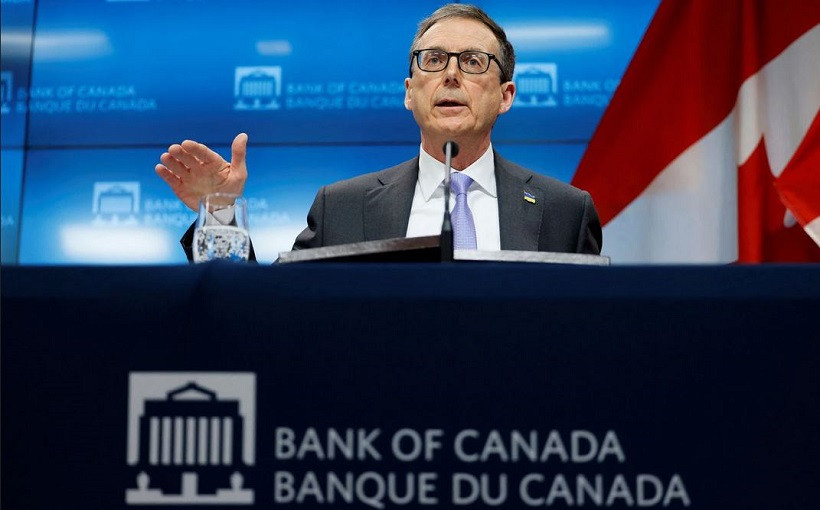
| USD/CAD. The Bank of Canada released the genie from the bottle Posted: 17 Jul 2022 06:52 AM PDT The Bank of Canada surprised this week with its hawkish attitude, despite the corresponding expectations from the majority of experts and analysts. According to general forecasts, the Canadian central bank had to raise the interest rate by 75 basis points, that is, up to 2.25%. But the central bank decided to act in a more radical way, raising the rate by 100 points at once. By the way, after this decision, rumors intensified in the market that the Federal Reserve would take a similar step. Recent inflationary releases (CPI, PPI) allow the Fed to take a more hawkish position - inflation in the US not only did not slow down its growth, but also updated a new long-term record. Therefore, the probability of a 100-point rate hike at the July meeting is now estimated at 88%.
But back to Canadian events. If the Fed is still pondering the pace of monetary tightening, the Bank of Canada is already implementing the most hawkish scenarios. Having raised the rate by 100 points, the Canadian central bank announced that it was not going to stop there. Thus, according to the head of the central bank, Tiff Macklem, a "proactive" rate hike will cool domestic inflationary pressures. At the same time, he made it clear that the central bank will maintain a hawkish course. It is noteworthy that in the accompanying statement, the central bank admitted that since the spring of last year, he underestimated inflation due to underestimation of global factors and domestic factors, mainly housing costs. Summing up the July meeting, the Bank of Canada indicated that the increase in interest rates in the short term "will help get out of this difficult period and return to normal life." The next meeting of the Canadian central bank will be held in September, so Macklem did not talk about the pace of the rate increase in early autumn. Obviously, they will depend on the dynamics of inflationary and other macroeconomic indicators. According to the latest data, inflation in Canada reached a 39-year high of 7.7%. The head of the Central Bank acknowledged that this release was decisive, but not the only argument in favor of such an aggressive tightening: excess demand and rising consumer expectations about rising prices - all these factors played a role. According to the head of the Bank of Canada, further tightening "will be determined by the bank's assessment of the state of the economy and inflation." Take note that the key macro indicators that have been published over the past few weeks have not failed. For example, the unemployment rate fell to an all-time low of 4.9% in May, on the back of a year-over-year increase in wages and a rise in the number of hours worked. Data on GDP growth in Canada also did not disappoint. The volume of the country's economy grew at an annual rate of 5.0%. In particular, the volume of industrial production (by 0.9%) and retail trade turnover (by 0.9%) increased after a decrease of 0.2% a month earlier. In other words, if inflation does not slow down its growth until September (and quite significantly), the Canadian central bank will most likely raise the interest rate by another 75 points. Perhaps, the market will regard a 50-point hike as a "dovish scenario". Prior to the July high-profile decision, the Bank of Canada had already raised its interest rate three times this year, hoping to tame inflation to its target level (2-3% range). However, all the actions taken did not bring the desired result, after which the central bank moved to more radical steps.
Separately, it is necessary to dwell on the behavior of the USD/CAD pair this week. The loonie quite adequately reacted to the hawkish results of the July meeting of the Bank of Canada. However, the Canadian central bank, figuratively speaking, let the genie out of the bottle: it was after the decision of the Canadians that the market increased the likelihood that the Fed would also raise the rate by 100 points. The latest inflationary releases in the US paved the way for such a step, but the Bank of Canada "materialized" numerous experts' assumptions. That is why, after a temporary strengthening of the Canadian currency, the loonie began to actively lose ground. Having dropped to 1.2935, the next day the pair soared to the 1.3220 target, having risen by almost 300 points in a day. By and large, the loonie became a victim of the trading principle "buy on rumors, sell on facts." The US dollar began to enjoy increased demand amid growing hawkish expectations about the further actions of the Fed. In my opinion, the loonie will not be able to organize a large-scale attack to the downside in the coming weeks. The upward trend is still in force - this is clearly visible on the weekly and monthly charts. Therefore, it is advisable to use the current price declines to open long positions. The first target is 1.3100 (upper line of the Bollinger Bands indicator on the weekly chart). The main upside target is the 1.3220 target, a 20-month price high that was reached this week. The material has been provided by InstaForex Company - www.instaforex.com |
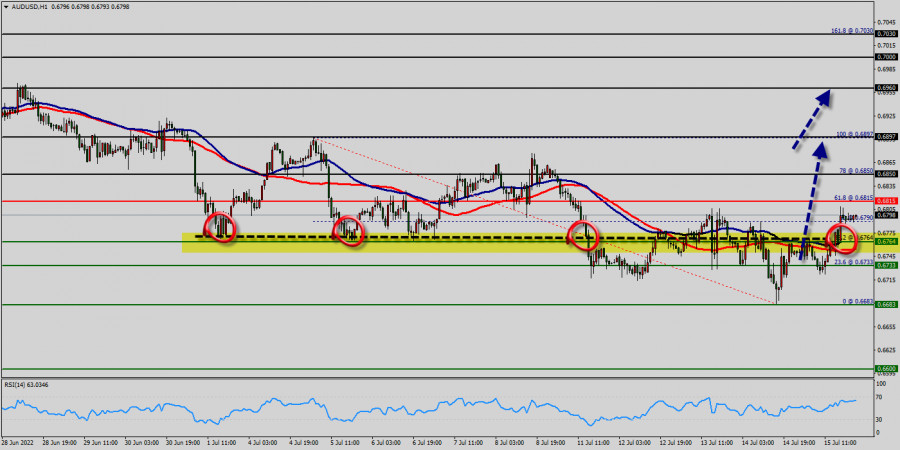
| Technical analysis of AUD/USD for July 17, 2022 Posted: 17 Jul 2022 04:53 AM PDT
The AUD/USD pair broke resistance which turned to strong support at the level of 0.6733 last week. The level of 0.6733 coincides with an important ratio (23.6% of Fibonacci), which is expected to act as major support today. The Relative Strength Index (RSI) is considered overbought because it is above 50. The RSI is still signaling that the trend is upward as it is still strong above the moving average (100). This suggests the pair will probably go up in coming hours. Accordingly, the market is likely to show signs of a bullish trend. In other words, buy orders are recommended above 0.6815 (red line) with the first target at the level of 0.6850. From this point, the pair is likely to begin an ascending movement to the point of 0.6897 and further to the level of 0.6960. The level of 0.6960 will act as strong resistance and the double top is already set at the point of 0.7000. On the other hand, if a breakout happens at the support level of 0.6683, then this scenario may become invalidated. Key levels : Resistance levels : 0.6850 - 0.6897 - 0.6960 Pivot : 0.6815 Support levels : 0.6733 - 0.6683 - 0.6600 The material has been provided by InstaForex Company - www.instaforex.com |
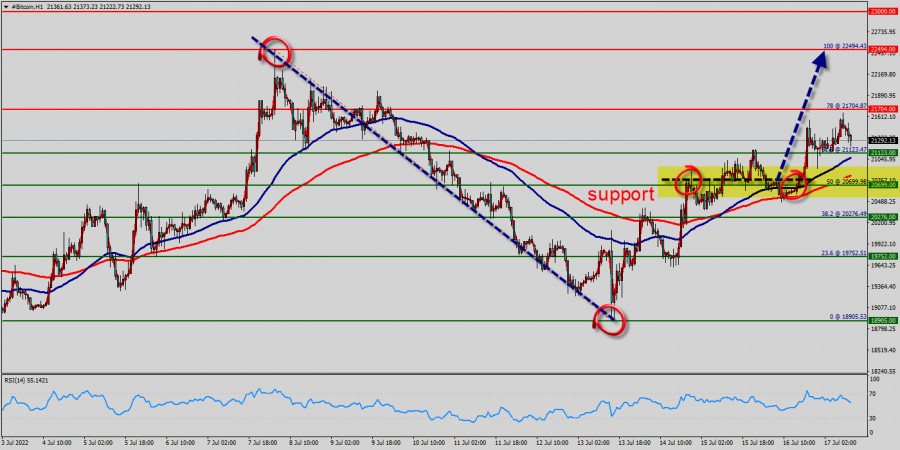
| Technical analysis of BTC/USD for July 17, 2022 Posted: 17 Jul 2022 03:55 AM PDT
The bullish trend is currently very strong for BITCOIN - BTC/USD. As long as the price remains above the support at 20,000 USD, you could try to take advantage of the bullish rally in short term. The first bullish objective is located at 21,704 USD (this price is coincided with the ratio 78% of Fibonacci retracement levels). The bullish momentum would be revived by a break in this resistance. Closing above the pivot point (20,699 USD) could assure that BTC/USD will move higher towards cooling new highs. The bulls must break through 21,000 USD in order to resume the up trend. Buyers would then use the next resistance located at 22,494 USD as an objective (this price is coincided with the ratio 100% of Fibonacci retracement levels - the double top - te last bullish wave on the hourly chart). Crossing it would then enable buyers to target 22,494 USD. Be careful, given the powerful bullish rally underway, excesses could lead to a short-term rebound. Bitcoin's price has been consolidating between the 20,000 USD and 22,494 USD over the last few weeks, following a massive rising from the 17,600 USD mark. So far, the price has been supported by the 17,600 USD - 20,000 USD range. If this is the case, remember that trading against the trend may be riskier. It would seem more appropriate to wait for a signal indicating reversal of the trend. However, considering the current price action and the third rejection from this area, a run to the 20,699 USD support level and the 50-day moving average seems more likely. A bullish breakout from these levels would initiate a rally towards the 21,704 USD - 22,494 USD supply zone – a key level to which the price's reaction would determine the mid-term trend of the market. In the very short term, the general bearish sentiment is confirmed by technical indicators. Nevertheless, a small upwards rebound in the very short term could occur in case of excessive bearish movements. After finding bids reach to 18,905 USD, bitcoin price recovered above 18,905 USD, 19,000 USD and 20,000 USD. Initial Bitcoin resistance lies near the 21,123 USD level (61.8% of Fibonacci retracement levels). A decent breakout and follow-up move above21,123 USD could open the gate for a push towards the 21,704 USD level. The main resistance remains near the area of 21,704 USD - 22,494 USD. Also it should be noted that Bitcoin and cryptocurrencies unite as the bears lose their momentum. The market is indicating a bullish opportunity above the above-mentioned support levels, for that the bullish outlook remains the same as long as the 100 EMA is headed to the upside. Trading BTC/USD : An uptrend will start as soon, as the market rises above resistance level 21,000 USD, which will be followed by moving up to resistance level 21,704 USD. Further close above the high end may cause a rally towards 22,494 USD. Nonetheless, the weekly resistance level and zone should be considered. Crypto industry news (Bitcoin News) : The BITCOIN - BTC/USD rating is 21,3000 USD (right now). On the day, this instrument lost - 2,50% and was traded between 20,000 USD and 22,494 USD over the period. The price is currently at +1% from its lowest and -3% from its highest. The Central Gaps scanner detects a bullish opening marking the presence of buyers ahead of sellers at the opening but not sufficiently marked to allow the price to register a quotation gap. The material has been provided by InstaForex Company - www.instaforex.com |
| Bitcoin is the most paradoxical of the existing assets. Posted: 16 Jul 2022 06:27 AM PDT
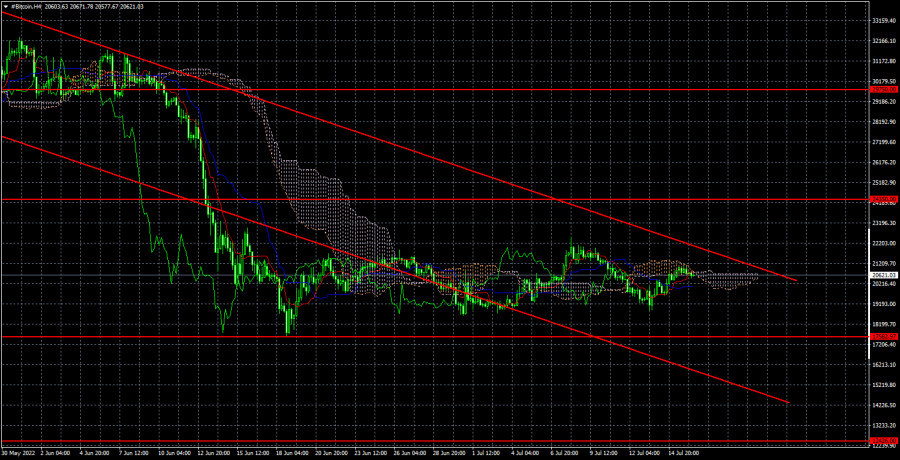
On the 4-hour TF, the current picture on bitcoin is also extremely eloquent and does not create any issues. A clear descending channel has been maintained for a long time. The cryptocurrency is not even trying to get a foothold above it, although it has been heading toward its upper limit in the previous several weeks. However, one should also take into account the fact that the upper bound itself gradually shrinks over time. In the following days, they may meet, and then, in some way, the fate of bitcoin will be decided in the near future. At the same time, we remind you that when the price exits the trend channel while moving in a flat, such consolidation is not regarded as a quality in general indications. We are seeing a flat right now. This week, one of the most noteworthy announcements (in addition to the US inflation report) was the disclosure of a reduction in the cost of production of JP Morgan's "bitcoin." The bank reported that the cost of mining one bitcoin currency might reduce from $ 20,000 to approximately $ 13,000. Let's analyze it. First, bitcoin is now considerably cheaper for miners. This means they can make a profit even at present market values. Second, most miners get rid of the bitcoin coins accessible to them, as they predict an even bigger decrease. Thus, it turns out that the amount of supply has not altered and remains high. And demand remains modest since, otherwise, bitcoin would become more expensive. Based on this, we feel that "bitcoin" can and should continue its decline. I would also like to remark that the decline in the cost price itself says a lot. Imagine, for example, a circumstance where gold mining costs are lower by 30–35 percent. You may ask, how can this be? And you get the answer: indeed, it cannot be so because gold has been mined for many years and has been a precious metal for many years. Thus, humanity has long ago established all the cheapest and most successful means to extract it. But in the case of bitcoin, a situation is completely acceptable in which energy consumption lowers due to more high-tech and efficient mining equipment, and its cost price sags quite substantially. Theoretically, if you use free energy from the sun, wind, or water, the cost can generally be a penny. And the cost price is essential for the item's final worth. The lower it is, the cheaper the real cost. In the case of bitcoin, this circumstance, as it turns out, is quite true.
On the 4-hour timeframe, the quotes of the "bitcoin" went below the level of $ 24,350. It was not feasible to acquire a foothold above the downward channel. Therefore currently, the aim remains at the level of $ 12,426. It is not advisable to contemplate buying bitcoin currently. You need to wait for at least a consolidation above the channel generally. There is also an intermediate level of $ 17,582, which is a local minimum. When the price overcomes it, it will be a signal for new sales. The material has been provided by InstaForex Company - www.instaforex.com |
| Is Bitcoin preparing for another collapse? Posted: 16 Jul 2022 06:01 AM PDT
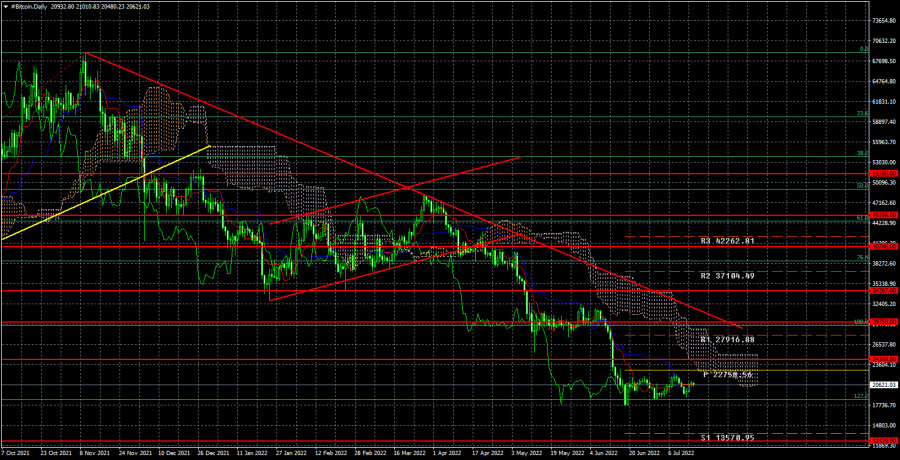
This week, the first cryptocurrency in the world continued to trade in a tight range near the Fibonacci level of 127.2 percent. Recall that Bitcoin plummeted to this level a few weeks ago during the subsequent fall and has not been able to adjust regularly since then. Does anything come to mind? The "bitcoin" is as weak as the euro or the pound. Consequently, the movement has been primarily sideways or flat for several weeks. Let's focus on the period immediately preceding the previous autumn. Bitcoin has been going exclusively sideways for several consecutive weeks. What do these portions reveal? Only that there are currently no buyers on the market. If they were, the falls would be mitigated somewhat. Consequently, we anticipate that the bitcoin price may continue to decline during the next two weeks. Is it conceivable, from a fundamental standpoint? Moreover, remember that the "foundation" has been unchanged for a long time. The Fed remains committed to hiking the federal funds rate, the QT program has begun to reduce the money supply in the US economy, and geopolitics is so complicated that very few individuals are prepared to take risks around the globe today. In such circumstances, the demand for the safest assets increases while the demand for riskier assets decreases. And bitcoin is one of the riskiest assets in the world if it can even be considered an asset. This week, a report on inflation in the United States was released, revealing another increase to 9.1 percent. In other words, inflation continues to rise regardless of any measures made by the Fed. This indicates that on July 26-27, the rate could be increased not by 0.75 percent, but by 1.00 percent immediately. Recall that a few weeks ago, even an option with an increase of 0.75 percent seemed unlikely, as this would be the second straight 0.75 percent increase. Even a 1.00 percent tightening now seems plausible. And any monetary policy tightening is a new blow to risky assets. Thus, from a fundamental perspective, bitcoin may continue to fall to at least $ 10,000 per coin without concern. Or even below. Technically speaking, the cryptocurrency is still below the trend line and is not even attempting to climb towards it. Theoretically, a fixation above this level can cause a rather substantial Bitcoin price increase. However, the price is moving away from this line, not towards it.
On a 24-hour timescale, "bitcoin" prices were locked below the $ 24,350 threshold. Consequently, the target itself is now $ 12,426. The "bitcoin" has twice attempted to surpass $ 18,500 (127.2 percent Fibonacci) and is currently attempting to do so for the third time. Bitcoin can now theoretically fall to any value, including zero. This is improbable, but we predict that the rate of 5,000 to 10,000 dollars per coin will become a reality in 2022. The breaking of the $ 18,500 threshold will signify a new buying opportunity. The material has been provided by InstaForex Company - www.instaforex.com |
| Posted: 16 Jul 2022 06:01 AM PDT
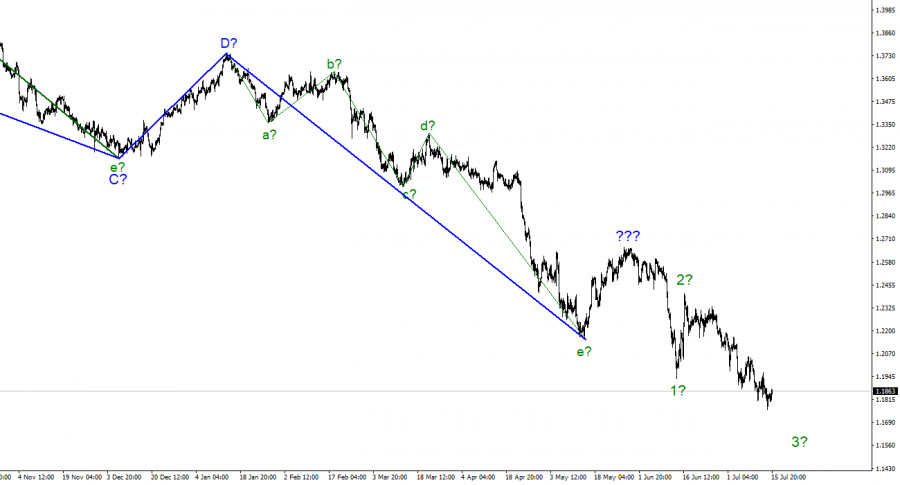
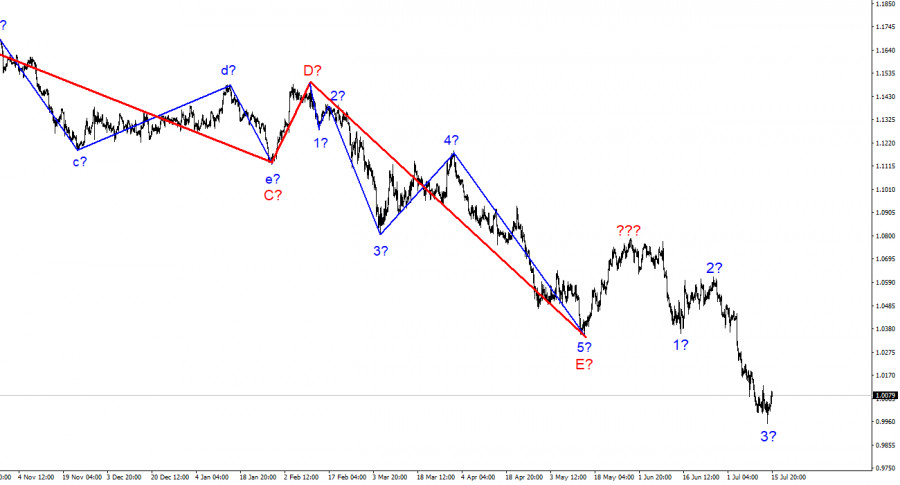
The wave marking for the pound/dollar instrument required clarifications, which were made. The upward wave constructed between May 13 and May 27 does not currently fit into the overall wave picture, but it can still be regarded as a segment of the downward trend. Thus, we can now definitively state that the building of the upward correction phase of the trend has been canceled, and the downward component of the trend will have a longer and more complex shape. I'm not a big fan of continually complicating the wave marking when dealing with a highly elongating trend zone. I believe it would be far more efficient to recognize rare corrective waves, following which new impulse structures may be constructed. Now that waves 1 and 2 have been completed, we may infer that the instrument is in the process of constructing wave 3. If this is the case, the slide may continue with objectives near the 161.8% Fibonacci level. The market has demonstrated that it is now more necessary to adhere to the trend than to mark waves. There were two rounds of voting for the new Prime Minister. In July, the pound and dollar exchange rates climbed by 40 basis points. Yesterday, there was no news background in the United Kingdom, while a number of reports were released in the United States that boosted the British economy at least a little. In June, retail sales in the United States increased by 1 percent, against market expectations for a lesser increase. Compared to predictions of +0.1 m/m, industrial production declined by 0.2% in June. The University of Michigan consumer sentiment index increased from 50.0 to 51.1. I cannot definitively state whether these figures are positive or negative. Instead, it was neutral since market expectations and actual report values were nearly identical. However, the absence of solid data may diminish demand for the US dollar. In any event, demand has not reduced to an alarming degree. And based on these statistics, the Briton did not improve his situation significantly. This week has already seen two elections for a new prime leader in the United Kingdom. Several applicants were eliminated in each round, and five are currently remaining. I will mention that Rishi Sunak, who served as Finance Minister under Boris Johnson, is currently in the lead by a wide margin. However, such leadership should not be deceptive, as only two candidates will go to the final round, and all Conservative Party members will vote for them. Consequently, those votes currently going to candidates who have already flown out or will fly out in the subsequent rounds may not go to Sunak but to the second candidate. Nonetheless, I observe that most Conservative Party members of parliament like Rishi. General observations. The increased complexity of the pound/dollar pair wave structure currently signals a further collapse. For each "down" MACD signal, I recommend selling the instrument with objectives at the estimated mark of 1.1708, corresponding to 161.8 percent Fibonacci. An unsuccessful attempt to surpass 1.1708 may result in a departure of quotes from the reached lows, but it is unlikely to produce a corrective wave 4, since the last lowering segment of the trend will have a non-standard shape in this instance.
At the higher wave scale, the image closely resembles the euro/dollar instrument. The same ascending wave does not conform to the present wave pattern, followed by the same three descending waves. Thus, one thing is unmistakable: the downward segment of the trend continues to develop and can reach practically any length. The material has been provided by InstaForex Company - www.instaforex.com |
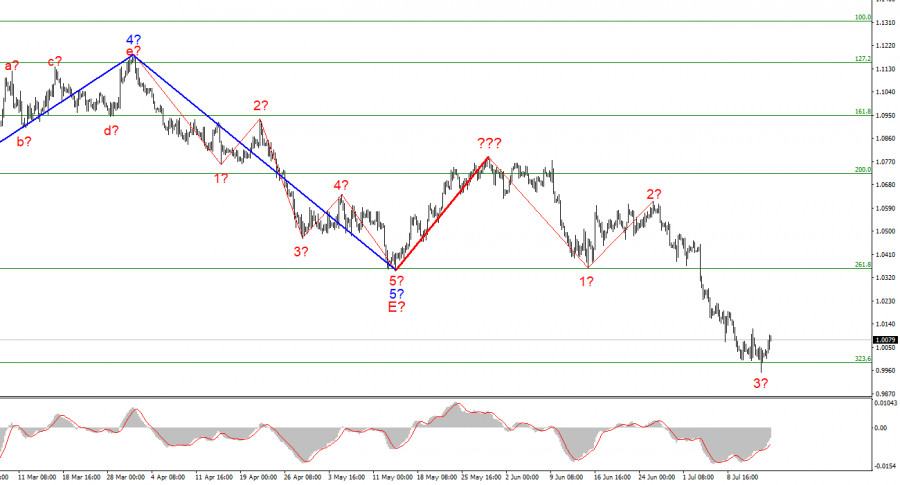
| EUR/USD analysis on July 16. There is a chance for the growth of the euro. Posted: 16 Jul 2022 06:01 AM PDT
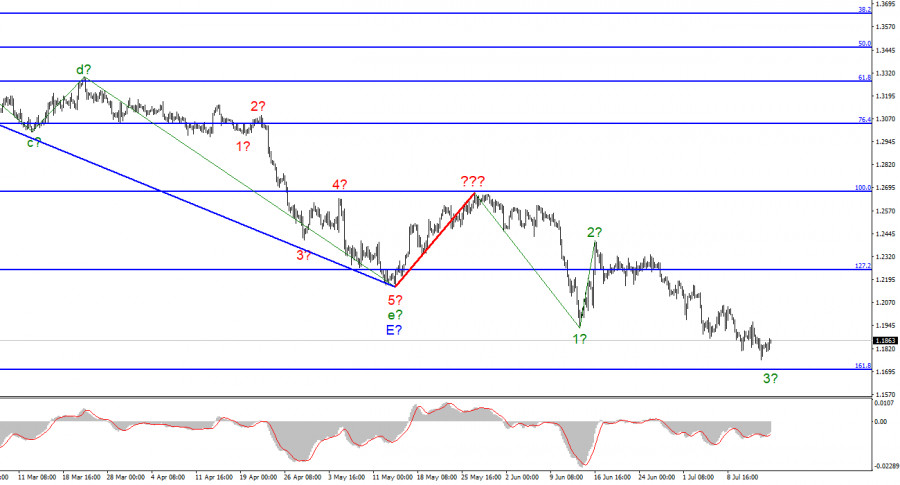
Following last week's decline of about 300 basis points, the wave marking on the 4-hour chart for the euro/dollar instrument grew more complex. Consequently, a successful attempt was made to surpass the 261.8 percent Fibonacci level, which was also the low of the waves E and b. It is now evident that they are not waves E and b. We had an excellent, promising wave design a week ago that featured a traditional five-wave falling structure. Instead of constructing at least three upward correction waves, the market opted to resume selling the instrument, indicating the secondary importance of wave analysis at this moment. Now that one corrective wave has been identified with a red line, the instrument may construct a new five-wave falling series. On a bigger scale, wave marking appears to be very challenging. Therefore, I advise focusing on the lowest wave order presently. If the current wave markup is accurate, wave 3 will continue to see a decrease in quotes. The construction of Wave 4, which may have begun yesterday, has been canceled. The euro surpassed dollar parity in terms of value. Friday saw a 65-point increase in the euro/dollar exchange rate. The effort to surpass the 323.6 percent Fibonacci level failed, and the anticipated wave 3 was fairly long. Therefore, I am awaiting the formation of an upward correction wave, presumed wave 4. If the current wave marking does not grow more complex again, then this wave will need to terminate below the 261.8 percent threshold not to surpass the low of wave 1. Thus far, the report on American inflation continued to reduce demand for the European currency throughout the week. The markets anticipated strong inflation at the start of the week and were well aware of it after the week. Consequently, the Federal Reserve, which is currently receiving the most attention, is already obligated to raise the interest rate by 75 basis points at its meeting in July. Some analysts anticipate an increase of even 100 basis points. In any case, the market has even more reasons to enhance its demand for the dollar. Upon completion of the development of the corrective wave, the instrument's drop may probably restart. I want to comment separately on the European Central Bank, which, according to reports, may increase its interest rate by 50 basis points at its meeting in July. This would be ideal for the European currency, but it is not likely to prevent further declines. The Fed is now prepared to hike interest rates and has no fear of an economic downturn in the United States. Every day, an increasing number of analysts discuss the recession, yet this does not affect the dollar's demand. I feel that this is the correct response of the market, as it is vital to react to a recession once it has begun and not when it is uncertain whether or not one will occur. Consequently, the US dollar is currently appreciating fairly justly. Conclusions in general. Based on the analysis, I've determined that the construction of the downward trend segment continues. If so, it is now possible to sell the instrument with goals near the computed mark of 0.9397, which corresponds to 423.6 percent Fibonacci, for each "down" MACD signal, based on the development of wave 5. A failed effort to surpass the level of 323.6 percent signals the temporary unavailability of the market for new sales and the start of the construction of corrective wave 4. Consequently, you may also wait until this wave has passed before resuming sales.
At a larger wave scale, the wave marking of the descending trend segment becomes notably more complex and extends. It can assume virtually any length. Thus, I believe it is preferable to isolate and focus on the three and five-wave conventional wave structures at this time. The material has been provided by InstaForex Company - www.instaforex.com |
| Posted: 16 Jul 2022 12:24 AM PDT Long-term perspective
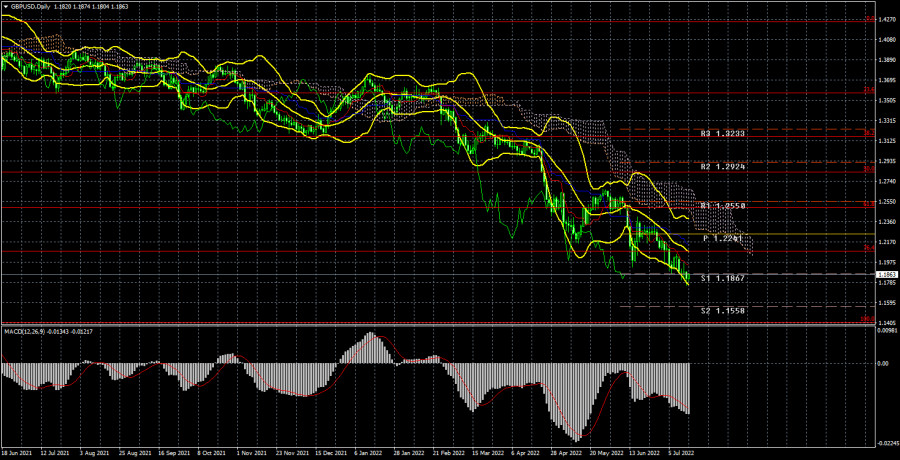
The GBP/USD currency pair has dropped 150 points during the past week. We wish to make an immediate reservation: we do not believe that the British pound will continue to collapse due to a new political crisis in the United Kingdom. Politics is currently the most important topic in the UK, and much depends on it. Recall that Boris Johnson resigned as Conservative leader and prime minister of the country. Therefore, early rounds of voting for a new leader are currently occurring. This vote is not particularly interesting on a fundamental level. Even those unfamiliar with British politics know the names of politicians like Rishi Sunak and Liz Truss, who make frequent public pronouncements. Penny Mordaunt, about whom less is known, is the third-most likely candidate. Although they occupy prominent positions in the government, the two remaining candidates are relatively unknown. We predict that one of the three candidates above will be the next Prime Minister. By the 21st of July, there should be no more than two candidates for whom the over 160 thousand Conservative Party members will vote in the final round. Boris Johnson encourages voters to abstain from casting ballots for Rishi Sunak and endorses all other candidates. Thus, it is quite unlikely that Finance Minister Sunak, who won the first two rounds, will become the new Conservative leader. The British pound is generally unaffected by current events in the United Kingdom. The pound continues to decline with composure due to unfavorable market sentiment, the geopolitical situation in Eastern Europe, and the "foundation." Furthermore, it has significantly fewer basic drivers of decline than the euro currency, as the Bank of England routinely tightens monetary policy and may adopt a more aggressive stance. Despite this, the market has already advanced and sees no reason to cease selling the pair if there is a strong slump. Analysis of COT report The most recent COT report on the British pound again revealed no changes. During the week, the non-commercial group concluded 5,700 buy contracts and 2,800 sell contracts. Consequently, non-commercial traders' net position climbed by 2,900. What difference does it make, however, if the mood of the key players continues to be "pronounced bearish," as the second signal in the preceding image demonstrates? And after everything, the pound cannot demonstrate a semblance of a recovery? What difference does it make if the British currency continues to decline against the US dollar if the net position decreased for three months and then rose for a while? We have already stated that the COT figures do not consider the current high demand for the dollar, which is not reflected in the reports. Therefore, even to strengthen the British currency, its demand must increase faster and stronger than the dollar. The Non-commercial group has opened a total of 93 thousand sales contracts and just 34 thousand purchasing contracts. For these data to level out at least, net positions will have to expand for a considerable time. Macroeconomic data or fundamental occurrences do not support the British currency. We can still only count on corrective growth, but we anticipate that the pound will continue to decline over the medium run. Fundamental occurrences are analyzed. There was essentially no noteworthy macroeconomic data this week in the United Kingdom. Yes, reports on the gross domestic product and industrial production were issued, but the market ignored them. In addition to the inflation report, industrial production, retail sales, and consumer mood data were also released in the United States. Traders' reaction to this information on Friday was limited to 20-30 points. There was a reaction, but it did not affect the broader technological picture or the current condition of affairs. Accordingly, from our perspective, "macroeconomics" continues to play the least significant function. Obviously, if inflation reports are not taken into account. What can we anticipate for the pound in the future? We believe it has far fewer reasons to decline than the euro currency. Nonetheless, the market demonstrates that it is not calculating the number of causes "for" and "against" the pound's decline. There will be a meeting of the Bank of England at the beginning of August, at which the rate may be increased by 0.5 percent, although it is believed that this will not aid the pound's growth. As long as there is a clear and severe downturn, we see no reason to attempt to catch its end. Trading strategy for July 18 – 22: 1) The pound/dollar pair has updated its two-year lows again this week and typically maintains a long-term negative trend. Thus, purchases are inapplicable at the moment and cannot be considered until the price breaks above the Ichimoku cloud. The pair remains theoretical growth potential, but the market sentiment and bulls' desire to buy are not at a level where it can be counted on seriously. 2) The pound continues to fall and is below the critical line. Currently, there are no technical reasons to anticipate an upward increase. Therefore, sales targets of 1.1410 (100% Fibonacci) are currently relevant. Explanations of the figures: Price levels of support and resistance (resistance /support), Fibonacci levels - levels used as entry points for buying or sales. Take Profit levels can be put in close proximity. Ichimoku indicators (standard settings), Bollinger Bands (standard settings), MACD (5, 34, 5). On the COT charts, the first indicator is the net position size of each group of traders. The second indicator on the COT charts is the size of the "Non-commercial" group's net position. The material has been provided by InstaForex Company - www.instaforex.com |
| Posted: 15 Jul 2022 10:59 PM PDT Long-term perspective.
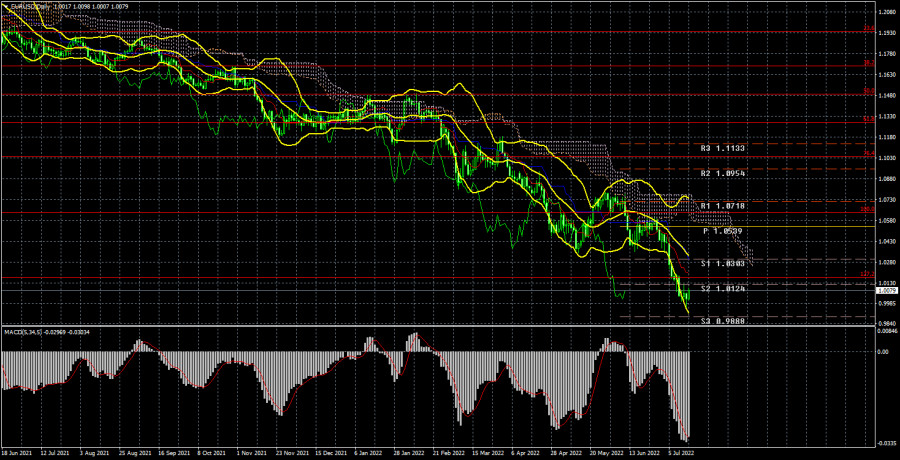
The EUR/USD currency pair has declined by 90 points in the past week. It does not appear excessive, but the fall continues nearly every week. If it continues at this rate, the euro will reach 0.9000 in a couple of months. Before a few months, this alternative appeared amazing, but it is now an objective fact. The euro is still powerless against the US dollar, and the market is delighted to capitalize on this weakness. This week, there were virtually no macroeconomic statistics or "foundations." The most significant event of the week was the release of the American inflation data, whose value did not surprise anyone. The consumer price index rose again and grew stronger than anticipated, so this week it was widely believed that the Fed would raise the key rate by 1% at its next meeting, which has not occurred in the United States in 30 years. However, the new reality necessitates new monetary strategies. We have consistently questioned whether an increase to 3.5 percent will be sufficient to return inflation to the target level. From our perspective, more extreme actions may be required. And any monetary policy tightening is positive for the dollar. Given that the ECB remains passive, the US dollar enjoys near-complete freedom of action. The technical situation has not changed during the past week on a 24-hour timescale, as one might expect. What must be altered if the pair is only traveling in one direction? There is no indication that even a minor correction is beginning, as all signs continue to point lower. Therefore, it may fall further regardless of how low the euro currency is. COT evaluation. In the past six months, COT's reports on the euro currency have raised many issues. The illustration above plainly demonstrates that professional players were in a "bullish" attitude while the European currency sank simultaneously. Currently, the circumstances are not favorable for the euro currency. If previously the sentiment was "bullish" but the euro was falling, it is now "bearish," and the euro is also falling. Therefore, we currently see no reason for the euro to grow, given the vast majority of variables continue to work against it. The number of buy-contracts climbed by 0.1 thousand during the reporting week, while the number of shorts in the "Non-commercial" group increased by 8.5 thousand.Consequently, the net position declined again by about 8,500 contracts. In recent weeks, the "bearish" sentiment of the market's major participants has increased slightly. From our perspective, this demonstrates very vividly that even expert traders do not now believe in the euro currency. The quantity of buy contracts for non-commercial traders is 25,000 less than the number of sell contracts. Consequently, we can state that the demand for the US dollar is not only fairly high, but so is the desire for the euro. It may result in a fresh, larger decline in the euro's value. In theory, the euro currency has not been able to demonstrate even a tangible correction during the past six months, let alone anything more. The greatest upward rise was almost 400 points. Evaluation of fundamental occurrences. The most important report of the week was the inflation report. However, so much has been said about it already. From our perspective, the Fed's activities are currently of no consequence, as they are so well predicted that there are no more uncertain situations. In essence, it makes no difference whether the rate is increased by 0.75 percent on July 26-27 or by 1.00 percent immediately. The local market's response may vary, but both approaches will generally benefit the US dollar. The ECB, with its first rate hike of 0.25 percent, should also occur by the end of this month. We have no idea if the market will even pretend to purchase euros on this issue. Consequently, we believe the decline of the European currency will continue. It cannot continue falling forever, and a correction will come sooner or later. However, it is futile to attempt to relate the commencement of the correction to a specific element or event. It is advisable to track it throughout a four-hour period. Trading strategy for the week of July 18-22: 1) On a 24-hour timescale, the pair updates nearly daily at its 20-year lows. Nearly all elements continue to support the dollar's long-term growth. Traders could not overcome the Ichimoku cloud. Thus the euro's upward momentum and purchases remain irrelevant. It is crucial to at least wait for consolidation above the Senkou Span B line before considering long bets. 2) The euro/dollar pair's sales remain more relevant now. The price has above the 127.2 percent Fibonacci retracement level of 1.0172. Thus it is likely to continue falling to the next objective of 0.9583. (161.8 percent Fibonacci). In addition, approaching the level of 1.0172, the pair did not even attempt to fake a bounce. Explanations of the figures: Price levels of support and resistance (resistance /support), Fibonacci levels – levels used as entry points for buying and sales. Take Profit levels may be positioned nearby.Ichimoku indicators (standard settings), Bollinger Bands (standard settings), MACD (5, 34, 5). The first indicator on the COT charts is the net position size of each trading category. On the COT charts, indicator 2 represents the net position size for the "Non-commercial" group. The material has been provided by InstaForex Company - www.instaforex.com |
| US stocks showed mainly a fall (by 0.3-0.5%) Posted: 15 Jul 2022 08:57 PM PDT
US stocks showed mainly a fall of 0.3-0.5%, although during the trading session the indicators fell much more strongly - up to 2%. As a result, the decrease in the broad S&P 500 indicator was the smallest and amounted to 0.3%, and the industrial indicator The Dow Jones Industrial Average - 0.46. Technological NASDAQ Composite managed to slightly strengthen its positions (by 0.03%). The main reason for the decline in stock indicators and the anxiety of investors, of course, is the release of the latest statistics on inflation in the country, which reached 9.1% last month. This figure was a record for the last 40 years and exceeded the forecasts of experts. At the moment, more than 80% of experts believe that the US central bank will decide at the next meeting this month to raise the interest rate by 100 points at once, to 2.5-2.75% per annum. Previously, analysts were inclined to believe that the rate will be increased by 75 basis points - the same as in June. However, judging by the comments of the Federal Reserve representatives, the central bank is not yet considering raising the rate by 100 points at once. Most likely, the rate will be increased by 75 points, as previously planned. Tougher measures will have to be resorted to if new statistical data come in, indicating that the economy cannot cope with rising prices. Another factor of concern for investors is the release of statistical data on employment. So, over the past week, the number of applications for unemployment benefits in the United States increased by 9,000 and reached 244,000. This exceeded the forecasts of experts who predicted that this figure would remain at the same level of 235,000. Preliminary information from the University of Michigan on the calculation of the consumer confidence indicator for the current month was published on Friday. Last month it dropped to a low of 50 points. Also, this institution calculates the level of inflation expectations of the US population. This figure was 5.3% in June for the current year and 3.1% for the next five years. If it turns out to be higher in July, it is likely that the central US bank will be inclined to raise the rate by 100 rather than 75 basis points. Statistical data were released on Thursday, which showed an increase in the dynamics of producer price growth to 11.3% last month on an annualized basis from the May level of 10.9%. At the same time, this indicator reached its record highs in March of this year (11.6%). Also, JPMorgan Chase & Co. and Morgan Stanley released their quarterly reports on Thursday. They turned out to be not very satisfactory, which was facilitated by a number of reasons: the rapid growth of inflation, the decline in consumer confidence, the uncertainty about the future increase in the interest rate, etc. Thus, JPMorgan Chase, which is the largest US bank, showed a decrease in net profit, which turned out to be higher than experts' expectations. The company also announced the suspension of its share repurchase program, resulting in a 3.5% drop in the value of its shares. The second major bank, Morgan Stanley, also posted lower-than-expected results last quarter, sending its stock price down 0.4%. As a result of Conagra Brands' net profit almost halving in the last quarter of the last fiscal year and earnings below market expectations, the value of its securities fell by 7.3%. Following a downgrade by JPMorgan analysts of Cisco Systems Inc. and reducing the forecast share price to $51 from $62, the quotes of its securities decreased by 0.9%. At the same time, the value of Tesla Inc. increased by 0.5%. Before that, information appeared that Andrei Karpaty had left the post of director of the artificial intelligence department. Citigroup Inc. and Wells Fargo & Co's quarterly reports were released on Friday. According to experts' forecasts, the total profit of companies included in the calculation of the S&P 500 indicator for the last quarter increased by only 4.3%. This is the lowest for the last year and a half. The material has been provided by InstaForex Company - www.instaforex.com |


| You are subscribed to email updates from Forex analysis review. To stop receiving these emails, you may unsubscribe now. | Email delivery powered by Google |
| Google, 1600 Amphitheatre Parkway, Mountain View, CA 94043, United States | |


Comments