Forex analysis review
Forex analysis review |
- Analysis and trading tips for GBP/USD on July 18
- Analysis and trading tips for EUR/USD on July 18
- Forex forecast 07/18/2022 EUR/USD, NZD/USD, USD/JPY and Bitcoin from Sebastian Seliga
- Will $1,700 become a stable support level for gold?
- NZDUSD Potential For Bullish Continuation | 18th July 2022
- USDJPY Potential For Bearish Continuation | 18th July 2022
- USDCAD, Potential For Bullish Bounce | 18th July 2022
- EUR/USD analysis and forecast for July 18, 2022
- Tips for beginner traders in EUR/USD and GBP/USD on July 18, 2022
- Indicator analysis: Daily review of GBP/USD on July 18, 2022
- Technical Analysis of ETH/USD for July 18, 2022
- Technical Analysis of BTC/USD for July 18, 2022
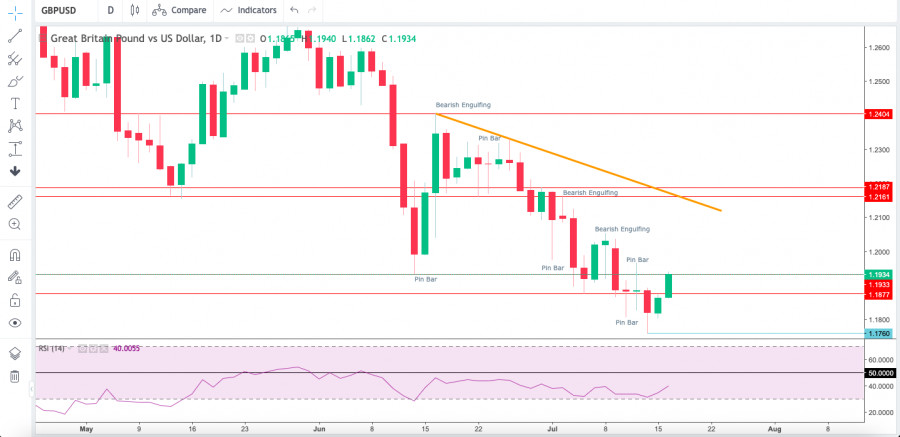
- Technical Analysis of GBP/USD for July 18, 2022
- Indicator analysis: Daily review of EUR/USD on July 18, 2022
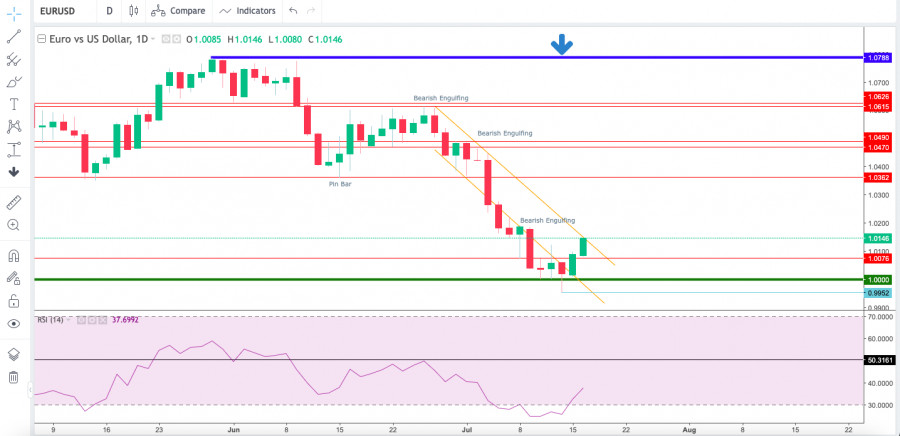
- Technical Analysis of EUR/USD for July 18, 2022
- Hot forecast on EUR/USD for July 18
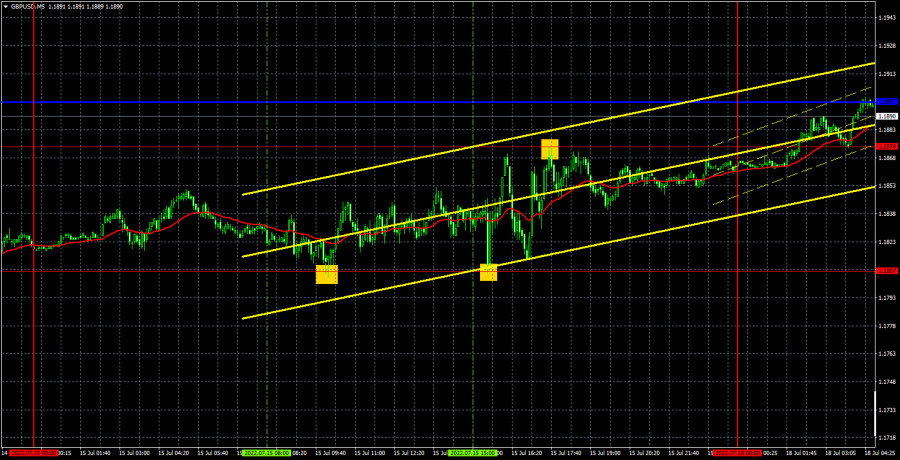
- GBP/USD trading plan for European session on July 18, 2022. COT report and overview of Friday's trade. Bulls to find obstacle
- EUR/USD: trading plan for European session on July 18. COT reports and overview of Friday's trade. EUR's further growth in
- Elliott wave analysis of Silver for July 18, 2022
- Elliott wave analysis of Litecoin for July 18, 2022
- EUR/USD: forecast and trading signals on July 18. COT report. Detailed analysis of price movement. Is it time for correction?
- GBP/USD: forecast and trading signals on July 18. COT report. Detailed analysis of price movement. GBP makes first step
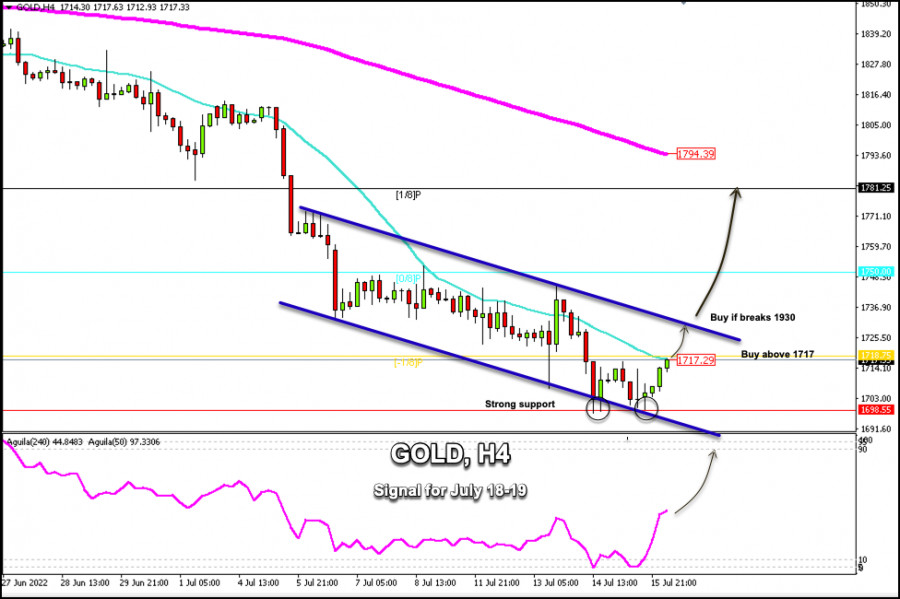
- Trading Signal for GOLD (XAU/USD) for July 18 - 19, 2022: buy in case of breaks above $1,717 (-1/8 Murray - SMA 21)
- Forecast for EUR/USD on July 18, 2022
- Forecast for GBP/USD on July 18, 2022
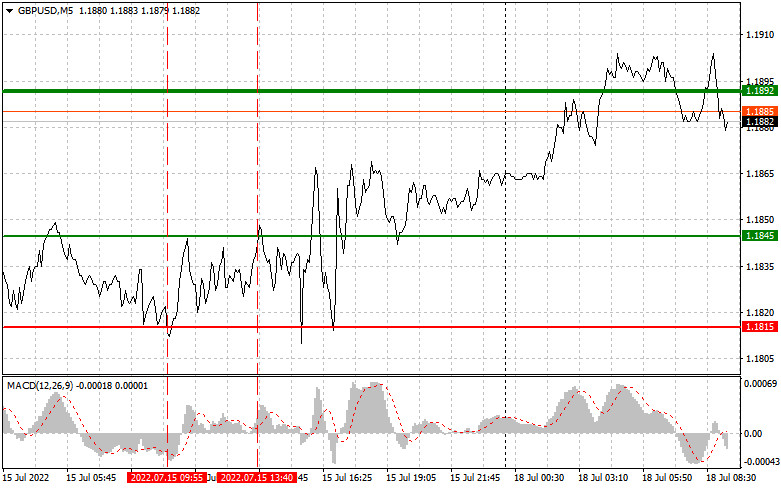
| Analysis and trading tips for GBP/USD on July 18 Posted: 18 Jul 2022 03:17 AM PDT Analysis of transactions in the GBP / USD pair GBP/USD tested 1.1815 last Friday. At that time, the MACD line was far from zero, so the downside potential was limited. Sometime later, the pair approached 1.0095 and tested it. But since the MACD line was still far from zero, the upside potential was also limited. No other signals appeared for the rest of the day.
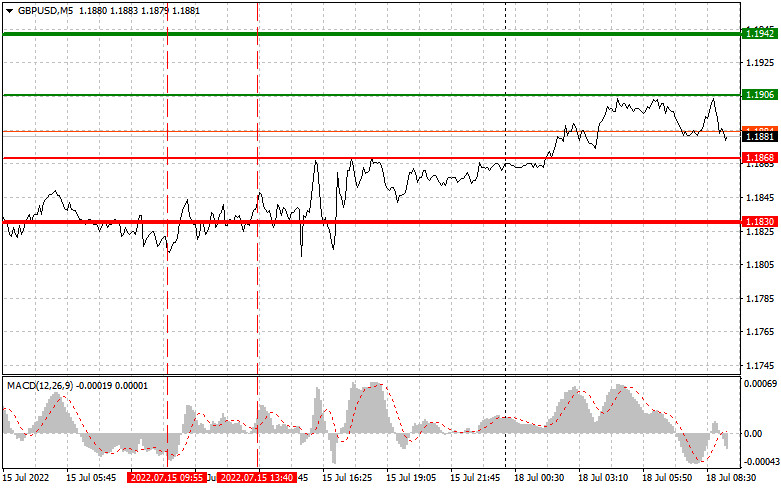
Lack of UK statistics kept GBP/USD sideways; however, pressure on the dollar increased in the afternoon despite strong US retail sales and industrial production reports. Ahead is the release of Rightmove's housing price report, as well as a speech from MPC member Michael Saunders. It is unlikely that the two will affect the market negatively, especially since the pound has been oversold lately. The US will also release data on the NAHB housing market and balance of capital account in the afternoon, but they will be of little interest, so expect continued pressure in USD. For long positions: Buy pound when the quote reaches 1.1906 (green line on the chart) and take profit at the price of 1.1942 (thicker green line on the chart). There is a huge chance that the correction that started last week will continue today. However, when buying, traders should make sure that the MACD line is above zero or is starting to rise from it. It is also possible to buy at 1.1868, but the MACD line should be in the oversold area as only by that will the market reverse to 1.1906 and 1.1942. For short positions: Sell pound when the quote reaches 1.1868 (red line on the chart) and take profit at the price of 1.1830. Pressure will return if there is no bullish activity of buyer around weekly highs. However, when selling, make sure that the MACD line is below zero or is starting to move down from it. Pound can also be sold at 1.1906, but the MACD line should be in the overbought area, as only by that will the market reverse to 1.1868 and 1.1830.
What's on the chart: The thin green line is the key level at which you can place long positions in the GBP/USD pair. The thick green line is the target price, since the quote is unlikely to move above this level. The thin red line is the level at which you can place short positions in the GBP/USD pair. The thick red line is the target price, since the quote is unlikely to move below this level. MACD line - when entering the market, it is important to be guided by the overbought and oversold zones. Important: Novice traders need to be very careful when making decisions about entering the market. Before the release of important reports, it is best to stay out of the market to avoid being caught in sharp fluctuations in the rate. If you decide to trade during the release of news, then always place stop orders to minimize losses. Without placing stop orders, you can very quickly lose your entire deposit, especially if you do not use money management and trade large volumes. And remember that for successful trading, you need to have a clear trading plan. Spontaneous trading decision based on the current market situation is an inherently losing strategy for an intraday trader. The material has been provided by InstaForex Company - www.instaforex.com |
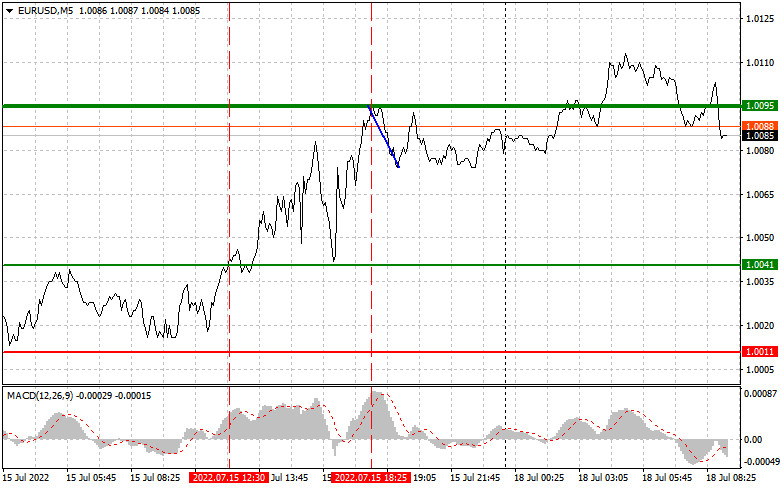
| Analysis and trading tips for EUR/USD on July 18 Posted: 18 Jul 2022 03:02 AM PDT Analysis of transactions in the EUR / USD pair EUR/USD tested 1.0041 last Friday. At that time, the MACD line was far from zero, so the upside potential was limited. Sometime later, the pair approached 1.0095, where sellers became active. This time, the price successfully fell by 20 pips. No other signals appeared for the rest of the day.
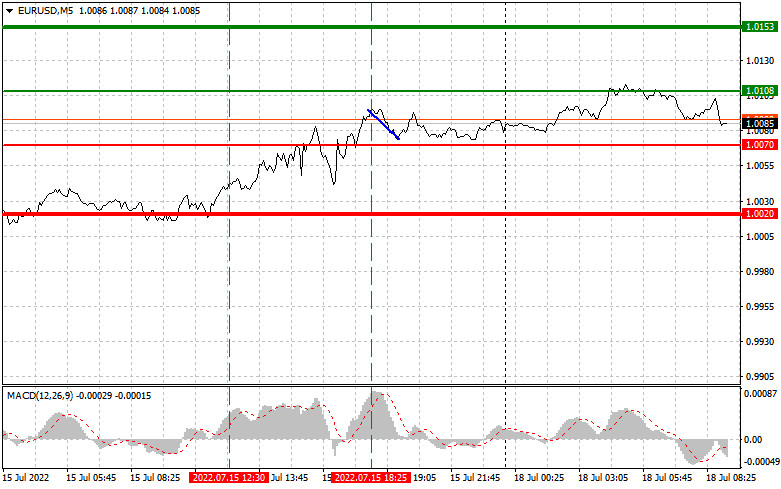
The foreign trade balance report in the Euro area did not affect EUR/USD in any way. Meanwhile, the spike in volatility following the June US retail sales and industrial output reports pushed dollar down, especially since many big players closed positions during the weekend. Just ahead is the Bundesbank's monthly report, which may indicate the need for more aggressive monetary policy by the European Central Bank. The US will also release data on the NAHB housing market and balance of capital account in the afternoon, but they will be of little interest, so expect continued pressure in USD. For long positions: Buy euro when the quote reaches 1.0108 (green line on the chart) and take profit at the price of 1.0153 (thicker green line on the chart). There is a huge chance that the correction that started last week will continue today. Take note that when buying, the MACD line should be above zero or is starting to rise from it. Euro can also be bought at 1.0070, but the MACD line should be in the oversold area as only by that will the market reverse to 1.0108 and 1.0153. For short positions: Sell euro when the quote reaches 1.0070 (red line on the chart) and take profit at the price of 1.0020. However, pressure will return only after an unsuccessful attempt to consolidate at weekly highs. Take note that when selling, the MACD line should be below zero or is starting to move down from it. Euro can also be sold at 1.0108, but the MACD line should be in the overbought area, as only by that will the market reverse to 1.0070 and 1.0020.
What's on the chart: The thin green line is the key level at which you can place long positions in the EUR/USD pair. The thick green line is the target price, since the quote is unlikely to move above this level. The thin red line is the level at which you can place short positions in the EUR/USD pair. The thick red line is the target price, since the quote is unlikely to move below this level. MACD line - when entering the market, it is important to be guided by the overbought and oversold zones. Important: Novice traders need to be very careful when making decisions about entering the market. Before the release of important reports, it is best to stay out of the market to avoid being caught in sharp fluctuations in the rate. If you decide to trade during the release of news, then always place stop orders to minimize losses. Without placing stop orders, you can very quickly lose your entire deposit, especially if you do not use money management and trade large volumes. And remember that for successful trading, you need to have a clear trading plan. Spontaneous trading decision based on the current market situation is an inherently losing strategy for an intraday trader. The material has been provided by InstaForex Company - www.instaforex.com |
| Forex forecast 07/18/2022 EUR/USD, NZD/USD, USD/JPY and Bitcoin from Sebastian Seliga Posted: 18 Jul 2022 02:01 AM PDT Let's take a look at the technical picture of EUR/USD, NZD/USD, USD/JPY and Bitcoin. The material has been provided by InstaForex Company - www.instaforex.com |
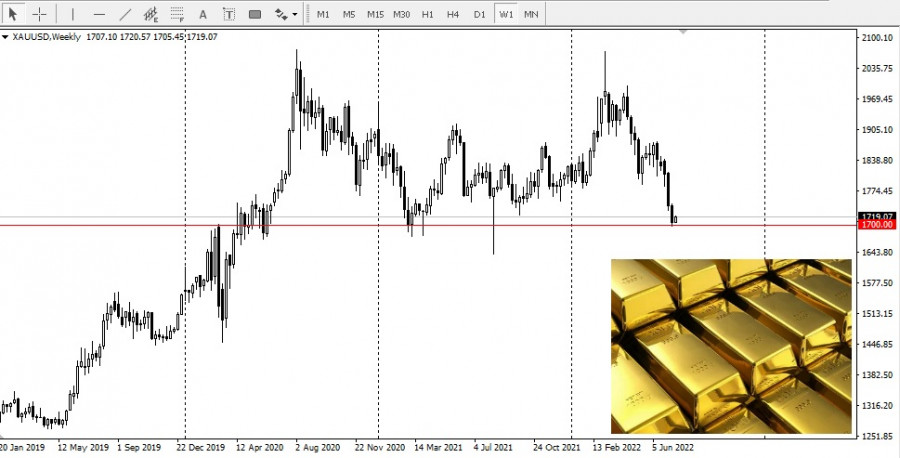
| Will $1,700 become a stable support level for gold? Posted: 18 Jul 2022 02:00 AM PDT
Gold futures traded below $1,700 for two trading days last week. And in both cases, they closed above the psychological level. Thus, it is only logical to wonder if this price point will become a stable support level or just a pause before gold prices begin to decline.
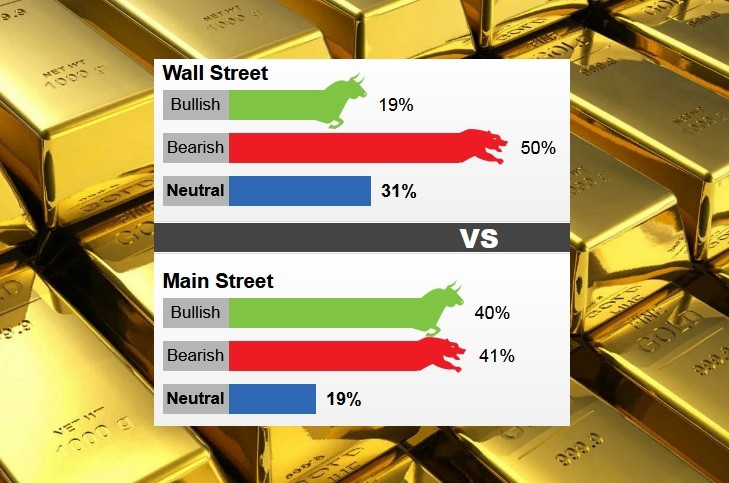
The latest weekly gold survey shows that growing bearish sentiment among Wall Street analysts and Main Street investors indicates that gold will fall below $1,700 an ounce in the near future. Sentiment has worsened over the past few weeks as investors expect the Federal Reserve to raise interest rates aggressively to lower inflation. Under these conditions, the real yield increased along with the US dollar, creating two main headwinds for the precious metal. Last week, gold fell to almost a yearly low as the US dollar reached a major milestone: it reached parity with the euro for the first time in 20 years. Analysts say that although gold has fallen to $1,700, there has been no serious capitulation in the market. According to Frank McGee, precious metals dealer at Alliance Financial, gold prices will continue to fall as more traders are forced to liquidate their unprofitable gold positions. Last week, 16 Wall Street analysts took part in the gold survey. Among the participants, three analysts, or 19%, are optimistic about gold in the short term. At the same time, six analysts, or 50%, were bearish, while five, or 31%, were neutral. In online polls on Main Street, 1,107 votes were cast. Of these, 441 respondents, or 40%, expect gold to rise this week. Another 458 voters, or 41%, said decline, while 208 voters, or 19%, were neutral.
Not only has bearish sentiment increased among retail investors, but participation in the survey has reached a monthly high, indicating that more investors are turning their attention back to the market. Despite the strong bearish sentiment in the market, some analysts are not yet ready to give up the precious metal. Saying that gold should bounce as it is technically oversold. Adam Button, chief currency strategist at Forexlive.com, said he is bullish on gold as markets anticipate a 100 basis point rate hike later this month. And they began to react to the aggressive move after the US CPI showed that inflation rose to 9.1% in June, a 40-year high. The material has been provided by InstaForex Company - www.instaforex.com |
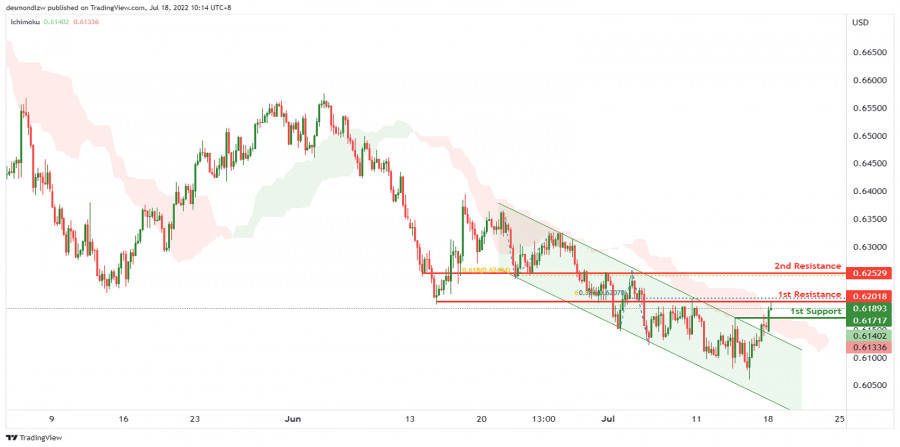
| NZDUSD Potential For Bullish Continuation | 18th July 2022 Posted: 18 Jul 2022 01:48 AM PDT
Trading Recommendation Entry: 0.62018 Reason for Entry: 61.8% fibonacci retracement and 78.6% Fibonacci projectionTake Profit: 0.62529 Reason for Take Profit:Pullback resistance in line with the 61.8% fibonacci projection Stop Loss: 0.61717 Reason for Stop Loss:Pullback support The material has been provided by InstaForex Company - www.instaforex.com |
| USDJPY Potential For Bearish Continuation | 18th July 2022 Posted: 18 Jul 2022 01:45 AM PDT
On the H4, with price reversing off stochastic resistance, we have a bearish bias that price will drop to our 1st support at 137.817 where the pullback support, 78.6% fibonacci projection and 23.6% fibonacci retracement. Once there is downside confirmation of price breaking 1st support, we would expect bearish momentum to carry price to 2nd support at 136.661 in line with overlap support and 38.2% fibonacci retracement. Alternatively, price could rise to 1st resistance at 139.377 where the swing high resistance is. Trading Recommendation Entry: 137.817 Reason for Entry: Pullback support, 78.6% fibonacci projection and 23.6% fibonacci retracement Take Profit: 136.661 Reason for Take Profit:Overlap support and 38.2% fibonacci retracementStop Loss: 139.377 Reason for Stop Loss: swing high resistance The material has been provided by InstaForex Company - www.instaforex.com |
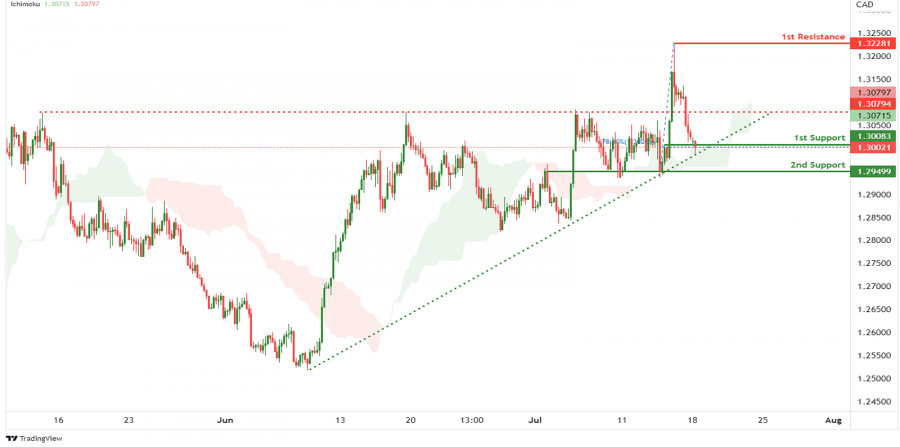
| USDCAD, Potential For Bullish Bounce | 18th July 2022 Posted: 18 Jul 2022 01:43 AM PDT
On the H4, with price bouncing off the ichimoku cloud and moving in an ascending trendline, we have a bullish bias that price will rise from our 1st support at 1.30083 where the horizontal pullback support is in line with the 78.6% fibonacci retracement to the 1st resistance at 1.32281 in line with the horizontal swing high resistance. Alternatively, price may break the support structure at the 1st support and drop to the 2nd support at 1.29499 at the overlap swing low. Take note of the pullback resistance at 1.30794 in line with multiple swing highs. Trading Recommendation Entry: 1.30083 Reason for Entry:Horizontal pullback support and 78.6% fibonacci retracement Take Profit: 1.32281 Reason for Take Profit:Horizontal swing high resistanceStop Loss: 1.29499 Reason for Stop Loss: overlap swing low The material has been provided by InstaForex Company - www.instaforex.com |
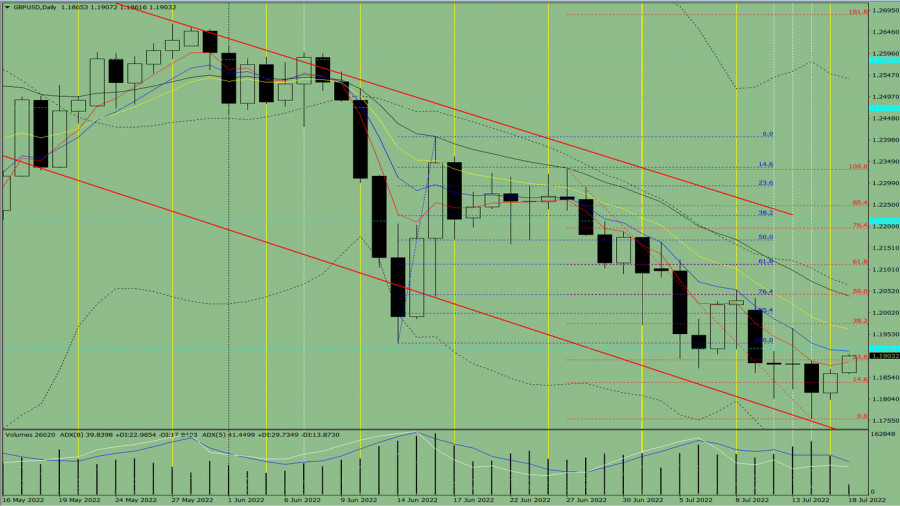
| EUR/USD analysis and forecast for July 18, 2022 Posted: 18 Jul 2022 01:35 AM PDT Consequently, during the 11–15 June auction, the EUR/USD currency pair maintained its downward trend, reaching a price of 0.9953. In a moment, we'll examine the technical picture of the primary currency pair in further detail; for now, we'll speak briefly about other data. This week, the European Central Bank will hold a meeting, after which a decision will be taken about interest rates. The mainstream expectation assumes that the ECB will raise the key interest rate by 25 basis points. However, will this be sufficient to convince the market of the decisiveness of tightening monetary policy to confront high inflation? It may be the fundamental question determining the future of the most important currency pair in the Forex market. According to the author's personal opinion, such a tardy and previously publicized hike in the key rate has already been factored into the price of the single European currency, and if that is the case, then support for the euro from this decision of the European Central Bank is unlikely. Nonetheless, the technical picture indicates a potential reversal of the euro/dollar, at least for a corrective drop. The EUR/USD weekly chart is studied. Weekly
On the weekly timescale, a candle with a suitably long-emphasized lower shadow has been generated based on the trading activity of the previous five days. The fact that this candle arose after attempting to fall below the most significant psychological and historical threshold of 1.0000 is a defining aspect of its appearance. Now that so much has been written about the accomplishment of EUR/USD parity, it has finally captured the attention of market participants. Last week, the price closed at 1.0078 after bouncing off this key level. This week's trading begins at a time when euro bulls are attempting to continue reducing the previous large losses. Given the long lower shadow of the previous candle and the impending ECB rate hike, I believe the major currency pair has a chance of exhibiting an upward trend based on the outcomes of trading over the past five days.Nevertheless, a great deal will depend on the words of ECB leaders. If a clear signal is received regarding a further and more forceful tightening of monetary policy, the probability of a last weekly increase will unquestionably increase. Without ECB support, it is doubtful that the single European currency will require support. On a weekly price chart, the region between 1.0350 and 1.0370 appears to be the closest growth objective. If the bearish trend continues, the bears will retest the 0.9953 minimum value from the previous week for a potential breakdown. Daily
On the daily chart, the red Tenkan line of the Ichimoku indicator is being tested for a break higher during the current upward trend. If these efforts are successful, the pair may ascend to the blue Kijun line, which is located at 1.0284. I believe the capacity to climb the Kijun will play a significant role. Despite the negative trend in EUR/USD, I will not be shocked by the ensuing upward movement, which should still be deemed corrective. Tomorrow's article will examine smaller time intervals to identify favorable entry points for euro/dollar bets. Given the discussed timelines, I lean toward a positive scenario. The material has been provided by InstaForex Company - www.instaforex.com |
| Tips for beginner traders in EUR/USD and GBP/USD on July 18, 2022 Posted: 18 Jul 2022 01:33 AM PDT Details of the economic calendar from July 15Retail sales in the United States accelerated to 8.4% instead of the projected slowdown from 8.1% to 6.5%. At that time, industrial production data slowed to 4.16%. Despite the multidirectional statistics, the quote was in the stage of a pullback from the local low. Analysis of trading charts from July 15The EURUSD currency pair is in the process of pulling back from the parity level, where it managed to slightly strengthen its position in the market. As a result of this movement, the quote returned to the value area of 1.0100, where in the period of July 13, there was a reduction in the volume of long positions. The GBPUSD currency pair, following the euro, went into a pullback stage, which led to an upward move by about 130 points. Despite the existing price changes, the downward mood remains in the market.
Economic calendar for July 18Monday is traditionally accompanied by an empty macroeconomic calendar. Important statistics in Europe, the UK, and the United States are not expected. Trading plan for EUR/USD on July 18Speculative downward interest persists in the market, despite a clear signal that the euro is oversold. Thus, a reverse movement to the parity level is still possible. As a result, the amplitude movement can be classified as an accumulation of trading forces. At the same time, traders consider a correction if the given pullback persists in the market. The next signal to buy the euro will occur when the price holds above 1.0150 in a four-hour period.
Trading plan for GBP/USD on July 18If the pullback stage slows down relative to the current values, a new round of growth in the volume of short positions is possible. In this case, it allows updating the local low of the downward trend. The price retention above 1.1950 in a four-hour period will allow traders to consider a prolonged pullback. This move may lead to a further move towards the upper area of the 1.2000/1.2050 psychological level. In your work, you should consider the indisputable fact of a positive correlation between the EURUSD and GBPUSD trading instruments. In this case, EURUSD is the leader, and GBPUSD is the follower.
What is reflected in the trading charts?A candlestick chart view is graphical rectangles of white and black light, with sticks on top and bottom. When analyzing each candle in detail, you will see its characteristics of a relative period: the opening price, closing price, and maximum and minimum prices. Horizontal levels are price coordinates, relative to which a stop or a price reversal may occur. These levels are called support and resistance in the market. Circles and rectangles are highlighted examples where the price of the story unfolded. This color selection indicates horizontal lines that may put pressure on the quote in the future. The up/down arrows are the reference points of the possible price direction in the future. The material has been provided by InstaForex Company - www.instaforex.com |
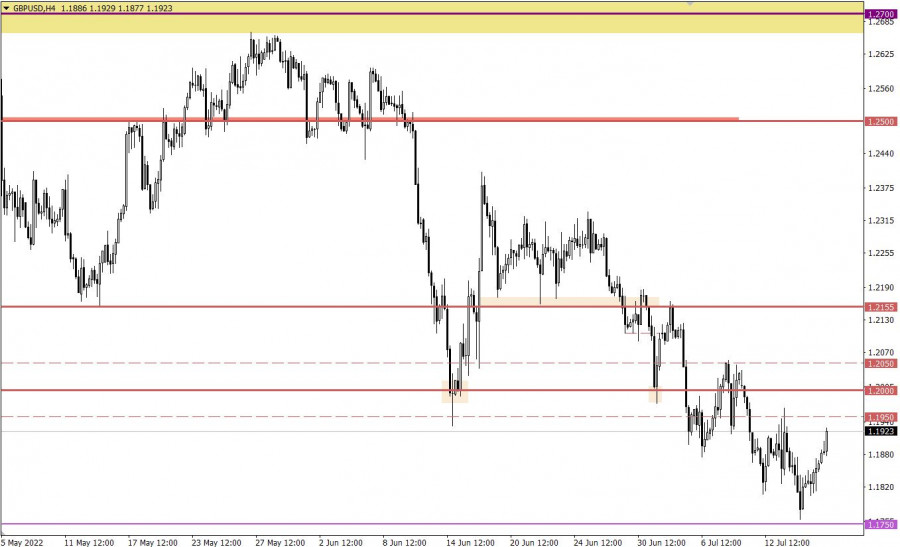
| Indicator analysis: Daily review of GBP/USD on July 18, 2022 Posted: 18 Jul 2022 01:04 AM PDT Trend analysis (Fig. 1). The pound-dollar pair may move upward from 1.1863 (close of Friday's daily candle) to the historical resistance level of 1.1920 (blue dotted line). After testing this level, the price may continue to move upward with the target of 1.1978, the 38.2% retracement level (red dotted line). Upon reaching this level, a downward movement is possible with the target of 1.1954, the 13-day EMA (thin yellow line). From this level, the price may move up.
Fig. 1 (daily chart). Comprehensive analysis:
General conclusion: Today the price may move upward from the level of 1.1863 (close of Friday's daily candle) to the historical resistance level of 1.1920 (blue dotted line). After testing this level, the price may continue to move upward with the target of 1.1978, the 38.2% retracement level (red dotted line). Upon reaching this level, a downward movement is possible with the target of 1.1954, the 13-day EMA (thin yellow line). From this level, the price may move up. Alternative scenario: from the level of 1863 (close of Friday's daily candle), the price may move downward with the target of 1.1759, the lower fractal (daily candle from 07/14/2022). Upon reaching this level, an upward movement is possible with the target of 1.1842, the 14.6% retracement level (red dotted line). The material has been provided by InstaForex Company - www.instaforex.com |
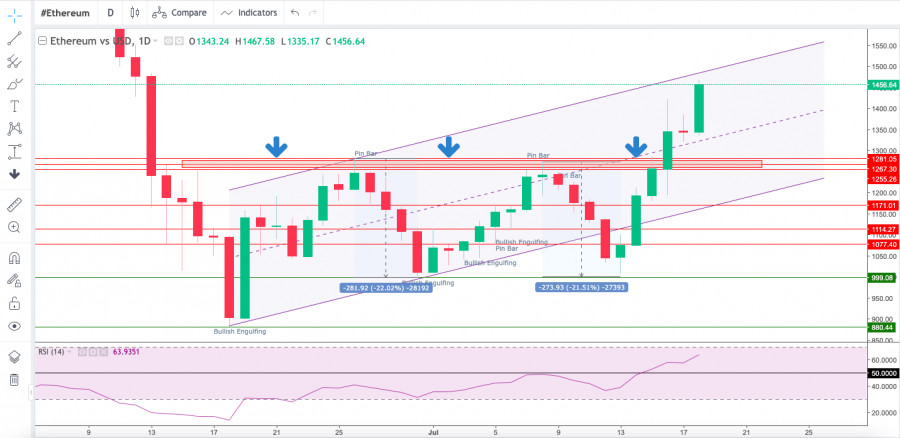
| Technical Analysis of ETH/USD for July 18, 2022 Posted: 18 Jul 2022 12:56 AM PDT Crypto Industry News: The European Central Bank has expressed concerns about the significant carbon footprint of PoW mining, while pointing to a possible ban on such assets. In an article published earlier this week, bank researchers argued that Bitcoin and Ethereum both have a significant carbon footprint. Reportedly, they consume similar amounts of energy every year as medium-sized countries, including Spain and Austia. Experts also talked about Proof-of-Stake. According to the report, a PoS-based cryptocurrency would require as much energy as a small American town with around 2,100 homes. The article notes that the benefits Bitcoin brings to society is "questionable" while blockchain may have potential benefits. Using analogies, ECB experts described PoW as a cryptographic version of fossil fuel cars and PoS as electric vehicles. Blockchains like Ethereum are already working on the transition from Proof-of-Work to Proof-of-Stake, where the process is expected to be completed by 2023. Meanwhile, ECB experts believe it is "unlikely" that Bitcoin will soon migrate to PoS. Nevertheless, the article states that the transition to renewable energy requires political and social initiatives regarding energy sources and consumption. According to experts, such decisions would favor certain actions and pose a risk to the value of crypto assets. The report also argued that PoW-based crypto assets are inconsistent with environmental, social, and governance (ESG) goals. Therefore, investors need to research whether investing in specific cryptocurrencies is in line with their ESG investment strategy. This is why Tesla has not accepted Bitcoin as payment for goods and services as of May 2021. According to Elon Musk, the company will resume BTC payments when Bitcoin miners start using more than 50% of green energy for their operations. Technical Market Outlook: The ETH/USD pair had broken above the supply zone located between the levels of $1,255 - $1,281 and made a new local high at the level of $1,462 (at the time of writing the article). The momentum is at the level of 65 points already, so the bulls are now controlling the market. The intraday technical support is seen on the level of $1,319 and $1,281. The larger time frame trend remains down, however the recent breakout might be a beginning of a bigger bounce even towards the level of $1,750.
Weekly Pivot Points: WR3 - $1,617 WR2 - $1,509 WR1 - $1,470 Weekly Pivot - $1,401 WS1 - $1,362 WS2 - $1,294 WS3 - $1,185 Trading Outlook: The down trend on the H4, Daily and Weekly time frames had broken below the key long term technical support seen at the level of $1,420 and bears continue to make new lower lows with no problem whatsoever. So far every bounce and attempt to rally is being used to sell Ethereum for a better price by the market participants, so the bearish pressure is still high. The next target for bears is located at the levels below $1,000, like the last swing low seen at $880. Please notice, the down trend is being continued for the 13th consecutive week now. The material has been provided by InstaForex Company - www.instaforex.com |
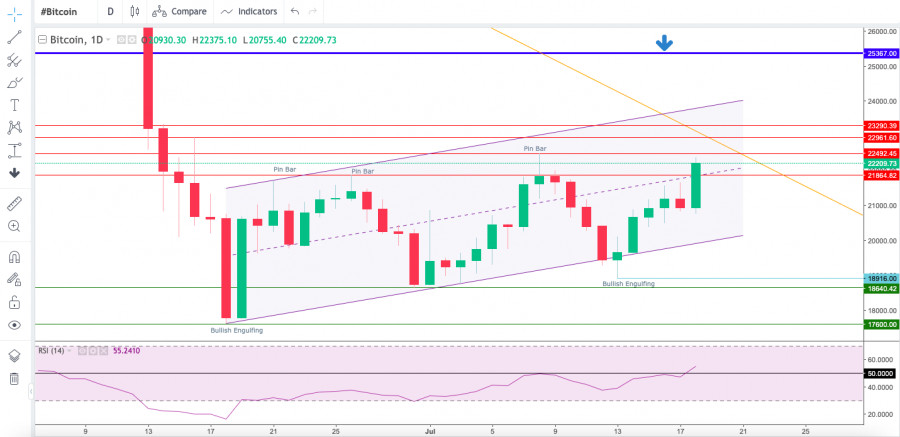
| Technical Analysis of BTC/USD for July 18, 2022 Posted: 18 Jul 2022 12:55 AM PDT Crypto Industry News: The latest data from blockchain analytics company Arcane shows that publicly traded miners sold more BTC in June than they produced. From January to April of this year, they only got rid of 20% to 40% of their production, sticking to their hodl strategy at all costs. The dynamics changed, however, as BTC plunged from $ 40,000 to $ 30,000 in May. The report identified companies such as Core Scientific and Bitfarms as the mining entities with the largest share of the decommissioning. The former dropped nearly 10,000 Bitcoins, leaving "only" 1,959 BTC, while Bitfarms sold 3,353 BTC. Meanwhile, Northern Data wiped out all of its Bitcoin and Ethereum holdings in May and June. Arcane Research said the massive sales will pay off with the upcoming infrastructure upgrades and machine deliveries. In 2021, miners were able to raise funds to cover the costs of mining. Now, however, access to external capital has weakened drastically due to rising interest rates and less investor interest in Bitcoin. Technical Market Outlook: The BTC/USD pair has bounced 7% in the last 24h, but is still trading inside the ascending channel. In a case of further bounce extension, the next target is seen at the level of $22,492, which is the local high from July 8th. The level of $21,867 will now act as a technical support for bulls. The larger time frame outlook for Bitcoin remains bearish, however, we have unconfirmed Bullish Engulfing pattern on the Daily time frame chart, so please stay focused and keep an eye on the key technical levels. The gamechanger level is located at $25,367.
Weekly Pivot Points: WR3 - $23,780 WR2 - $22,629 WR1 - $22,245 Weekly Pivot - $21,487 WS1 - $21,094 WS2 - $20,326 WS3 - $19,175 Trading Outlook: The down trend on the H4, Daily and Weekly time frames continues. So far every bounce and attempt to rally is being used to sell Bitcoin for a better price by the market participants, so the bearish pressure is still high. The key long term technical support at the psychological level of $20,000 had been violated, the new swing low was made at $17,600 and if this level is violated, then the next long-term target for bulls is seen at $13,712. On the other hand, the gamechanging level for bulls is located at $25,367. The material has been provided by InstaForex Company - www.instaforex.com |
| Technical Analysis of GBP/USD for July 18, 2022 Posted: 18 Jul 2022 12:55 AM PDT Technical Market Outlook: The GBP/USD pair had made a new low at the level of 1.1759 last week as the down trend continues to push the market lower. The weak and negative momentum on the daily time frame chart still supports the bearish outlook and the next target for bears is located at the level of 1.1410. However, the Cable starts the new trading week trying to bounce higher towards the level of 1.1936 or even 1.2161. Nevertheless, the supply zone located between the levels of 1.2160 - 1.2187 is still the main short-term obstacle for bulls that needs to be broken if the rally is expected to be continued.
Weekly Pivot Points: WR3 - 1.1965 WR2 - 1.1925 WR1 - 1.1904 Weekly Pivot - 1.1885 WS1 - 1.1864 WS2 - 1.1846 WS3 - 1.1806 Trading Outlook: The price broke below the level of 1.3000 quite long time ago, so the bears enforced and confirmed their control over the market in the long term. The Cable is way below 100 and 200 WMA , so the bearish domination is clear and there is no indication of trend termination or reversal. The bulls are now trying to start the corrective cycle after a big Pin Bar candlestick pattern was made on the weekly time frame chart, however there is no visible progress here yet. The next long term target for bears is seen at the level of 1.1410. Please remember: trend is your friend. The material has been provided by InstaForex Company - www.instaforex.com |
| Indicator analysis: Daily review of EUR/USD on July 18, 2022 Posted: 18 Jul 2022 12:54 AM PDT Trend analysis (Fig. 1). The euro-dollar pair may move upward from 1.0078 (close of Friday's daily candle) to test the historical support level of 1.0114 (blue dotted line). From here, the price may move upward with the target of 1.0204, the 38.2% retracement level (red dotted line). After testing this level, a downward pullback is possible with the target at 1.0083, the 208% Fibonacci retracement level (blue dotted line).
Fig. 1 (daily chart). Comprehensive analysis:
General conclusion: Today the price may move upward from the level of 1.0078 (close of Friday's daily candle) to test the historical support level of 1.0114 (blue dotted line). From here, the price may move upward with the target of 1.0204, the 38.2% retracement level (red dotted line). After testing this level, a downward pullback is possible with the target at 1.0083, the 208% Fibonacci retracement level (blue dotted line). Alternative scenario: from the level of 1.0078 (close of Friday's daily candle), the price may move downward with the target at 0.9952, the lower fractal (red dotted line). After testing this level, an upward movement is possible with the target of 1.0048, the 14.6% retracement level (red dotted line). The material has been provided by InstaForex Company - www.instaforex.com |
| Technical Analysis of EUR/USD for July 18, 2022 Posted: 18 Jul 2022 12:54 AM PDT Technical Market Outlook: The EUR/USD pair has bounced from the recent swing low made at the level of 0.9953 and is testing the upper channel line around the level of 1.0146. The next technical resistance is seen at the level of 1.0362, the nearest technical support is located at the level of 1.0076 and 1.0000. The last biggest bounce had been capped at the supply zone seen between the levels of 1.0470 - 1.0490, since then all the bounces are shallower and used to short the EUR. The weak and negative momentum on the daily time frame supports the bearish outlook for EUR.
Weekly Pivot Points: WR3 - 1.0162 WR2 - 1.0127 WR1 - 1.0107 Weekly Pivot - 1.0093 WS1 - 1.0073 WS2 - 1.0059 WS3 - 1.0025 Trading Outlook: The market continues to move lower as the down trend is still strong and the monetary parity level is the first target for bears in the long term.Nevertheless, the bullish cycle scenario is confirmed only after a breakout above the level of 1.0726, otherwise the bears will push the price lower towards the next long-term target at the level of 1.0000 or below. The up trend can be continued towards the next long-term target located at the level of 1.1186 only if the complex corrective structure will terminate soon (above 1.0000). The material has been provided by InstaForex Company - www.instaforex.com |
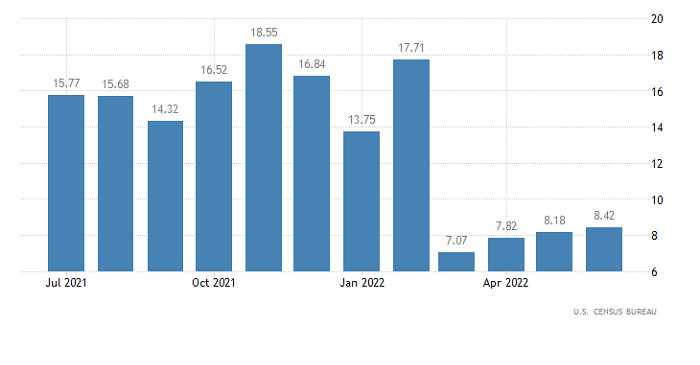
| Hot forecast on EUR/USD for July 18 Posted: 18 Jul 2022 12:41 AM PDT Markets ignored the recent retail sales data from the US even though it was much better than the forecasts. Initially, the growth rate was expected to slow down from 8.1% to 6.5%, but the actual figure was a revised 8.2% to 8.4%. Dollar surprisingly lost positions instead of rallying, which is a sign that it is heavily overbought. Retail Sales (United States):
The latest industrial output report was also ignored despite the data showing a much worse slowdown from 4.8% to 4.2%, instead of the projected 5.2% to 4.8%. This is because the retail sales data carries much more weight considering that it reflects the health of the entire service industry, which accounts for approximately 80% of the US GDP. Industrial production (United States):
Incredible imbalances caused by the heavily overbought dollar also led to the strange behavior of the market. To change this, a full-fledged correction is needed. However, its implementation is quite difficult as recent US data looks much better than Europe's. A certain scenario is also looming, where euro will hang in a channel, then move towards its lower boundary. Most likely, this momentum will continue until Thursday, when the ECB embarks on its board meeting.
EUR/USD has risen marginally in the market, trading at 1.0100 at the moment. But the RSI indicator managed to overcome the middle line 50 from the bottom up, signaling a potential change in trading interests in the short term. The same is seen in the medium term as the market, as before, retained a strong downward interest. The MA lines in the H4 chart also intersected with each other, which raises up the chance that a rebound will occur in the D1 chart. Obviously, bearish interest persists despite the clear signal that euro is oversold. The signal to buy will appear only when the price holds above 1.0150 in the H4 chart. But some analysis points to buying in the short-term and a rebound in the D1 chart. They say that indicators in the medium term signal a sell-off due to movements towards parity price. The material has been provided by InstaForex Company - www.instaforex.com |
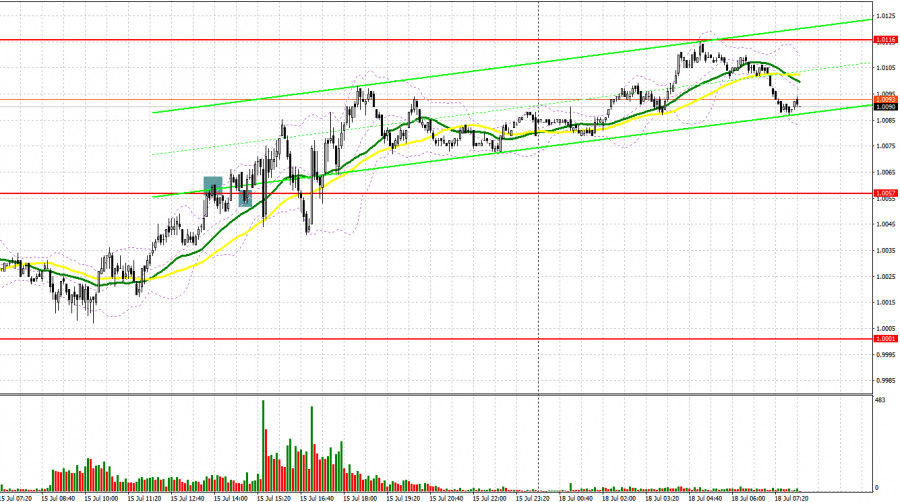
| Posted: 17 Jul 2022 11:49 PM PDT On Friday, there was just one signal formed to enter the market. Let's have a look at the 5-minute chart and try to figure out what happened there. In my morning review, I outlined the level of 1.1849 and recommended it as an entry point. Amid low market volatility, the pound bulls failed to reach the level of 1.1849, and, therefore, there was no false breakout of this level. So, I couldn't open short positions. Similarly, there were no buy signals at the level of 1.1785. In the afternoon, the pair formed a good sell signal after a failed attempt to rise above 1.1849. Yet, the price went down by just 25 pips and then the pound recovered.
For long positions on GBP/USD: At the moment, the pair bulls have closely approached the key resistance of 1.1915, which may define the further trajectory of the pair. Given that today there is no important news in the first half of the day, buyers have every chance to continue the upside correction. Yet, they need to do their best as without the breakout of 1.1915, bulls are unlikely to succeed. A breakout and a retest of this level will generate a buy signal with the further target located at 1.1964. This is where I recommend taking profit. The price area of 1.2018 will serve as a more distant target. The test of this level will seriously affect bears. In case of a decline, bulls will assert their strength only near the support level of 1.1864. Just below this level, we can see two moving averages that currently support the bullish trend. At this level, the bulls are likely to build the lower boundary of a new ascending channel in an attempt to hit the bottom. If GBP/USD drops and the bullish activity is low at 1.1864, which is a very probable scenario given a strong bearish trend, I recommend waiting until the pair reaches at least the level of 1.1810. At this point, you can buy the pair only after a false breakout. Long positions on GBP/USD can be opened right after a rebound from 1.1762, or even lower - from 1.1707, keeping in mind a possible correction of 30-35 pips within the day. For short positions on GBP/USD: Today, the main task of the sellers is to protect the resistance level of 1.1915. Given the aggressive policy of the US Federal Reserve, buyers are unlikely to act and add more long positions on the pair ahead of an important FOMC meeting. The best scenario for now will be the formation of a false breakout at 1.1915. This will put the pair under pressure again with the next downward target found at the support of 1.1864. If bulls are idle there and the price settles below the level, a retest of the level from the bottom up will create another entry point to sell the pound with the next target at 1.1810. This will be a good moment to partially lock in profit. The level of 1.1762 will serve as a more distant target. After testing this level, the pair will confirm the continuation of the downtrend. If GBP/USD rises and bears are idle at 1.1915, the situation will turn in favor of the bulls. At the same time, a deeper upward correction is also possible. If this is the case, I would advise you to wait until the price performs a false breakout of the next resistance level of 1.1964. This will create a good entry point for opening short positions considering a downside pullback of the pair. If nothing happens there as well, the price may surge to the upside as stop-loss orders set by speculative sellers will be triggered. If so, open short positions only when the price reaches the level of 1.2018. At this point, you can sell GBP/USD right after a rebound, keeping in mind a possible downside pullback of 30-35 pips within the day.
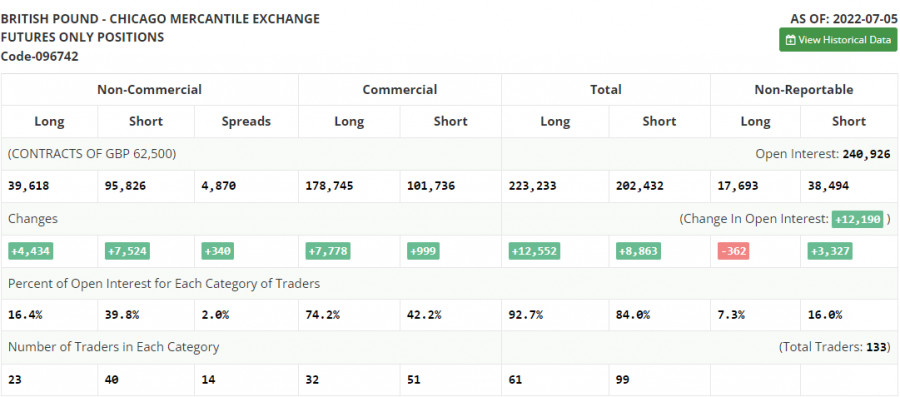
COT report The COT (Commitment of Traders) report for July 5 showed a rise in both short and long positions. However, short positions prevailed which led to an increase in the negative delta. Another attempt to buy the pair near yearly lows failed after it became clear that the Bank of England will keep raising the rate to tackle inflation. This policy will further slow down the UK economy and will push it closer to a recession. The cost of living crisis is getting more acute every day, and the recent resignation of UK Prime Minister Boris Johnson is likely to make things worse. There are currently no reasons to buy the pound apart from the fact that it has recently retested yearly lows. The Fed's policy and the pace of monetary tightening in the US provide significant support to the US dollar. Besides, the economic situation in the US is slightly better than in the UK, which is confirmed by the fresh employment data for June. According to the COT report, long positions of the non-commercial group of traders increased by 4,434 to 39,618, while short positions surged by 7,524 to 95,826. As a result, the negative non-commercial net position increased to -56,208 from -53.118. The weekly closing price declined to 1.1965 versus 1.2201.
Indicator signals: Moving Averages Trading above the 30 and 50-day moving averages indicates the formation of an upside correction. Please note that the time period and levels of the moving averages are analyzed only for the H1 chart, which differs from the general definition of the classic daily moving averages on the D1 chart. Bollinger Bands In case of an uptrend, the upper band of the indicator at 1.1910 will serve as resistance. If the pair declines, the lower band at the 1.1820 level will act as support Description of indicators: • A moving average of a 50-day period determines the current trend by smoothing volatility and noise; marked in yellow on the chart;• A moving average of a 30-day period determines the current trend by smoothing volatility and noise; marked in green on the chart;• MACD Indicator (Moving Average Convergence/Divergence) Fast EMA with a 12-day period; Slow EMA with a 26-day period. SMA with a 9-day period;• Bollinger Bands: 20-day period;• Non-commercial traders are speculators such as individual traders, hedge funds, and large institutions who use the futures market for speculative purposes and meet certain requirements;• Long non-commercial positions represent the total number of long positions opened by non-commercial traders;• Short non-commercial positions represent the total number of short positions opened by non-commercial traders;• The total non-commercial net position is the difference between short and long positions of non-commercial traders. The material has been provided by InstaForex Company - www.instaforex.com |
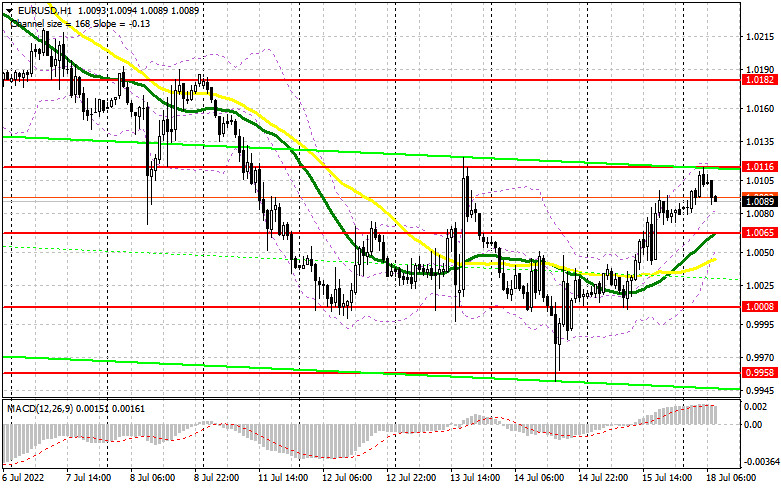
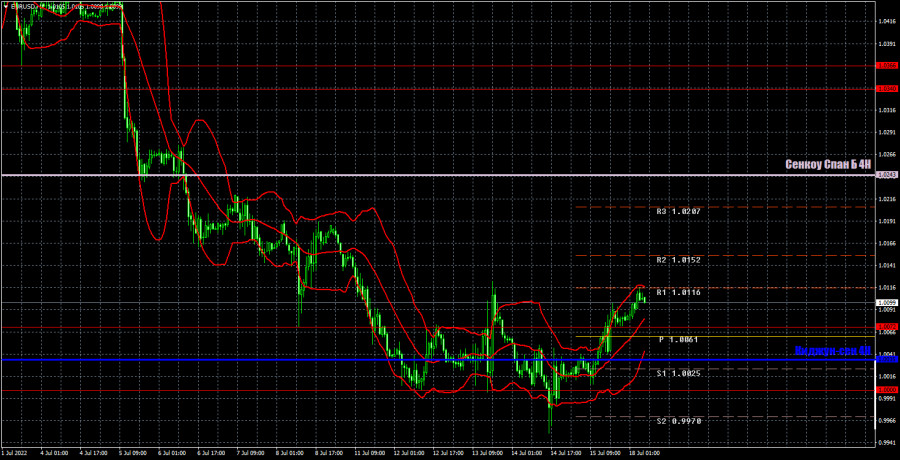
| Posted: 17 Jul 2022 11:02 PM PDT Friday was not the most efficient trading day. Let's look at the 5-minute chart and try to figure out what actually happened. EUR/USD made a minor decline which looks like an attempt of the euro traders to push EUR down in the first half of the day. The currency pair did not touch 1.0000. Therefore, I didn't find out any false breakout there. In turn, I wasn't able to enter the market with long positions. In the course of the New York session, the bears managed to defend 1.0057. It seemed there was an excellent market entry point for sell positions following the overall downtrend. However, the price didn't make a notable down move. In practice, 1.0057 was broken and tested downwards in mid-day. This price action enabled me to exit short positions and open long ones. The price moved 30 pips upward.
What is needed to open long positions on EUR/USD EUR had an upward correction as expected. Nevertheless, further growth raises doubts. Currently, EUR/USD is trading at about important resistance at 1.0116 which also acts as the upper border of the wide trading range where the price got stuck at the end of the last week. To develop a steady bullish market, the pair needs to break 1.0116 and, more importantly, defend 1.0065. I would advise you to focus on this level to make trading decisions. The economic calendar lacks any statistics in the first half of the day that could influence market sentiment. Thus, the buyers could grasp their chance. In case the trading instrument goes down, the bulls will have to protect the nearest support of 1.0065. Moving averages are passing a bit lower in favor of the buyers. After a false breakout there, we could assume a new jump as we saw on Friday. The nearest target is seen at the resistance of 1.0116. If broken and tested downwards, this will trigger stop losses of the sellers. We will also see a signal for opening long positions, reckoning a larger growth towards 1.0182. Still, it is too early to predict a large upward correction under such market conditions. 1.0271serves as the most distant target where I recommend profit taking. In case EUR/USD declines and the buyers don't open positions at 1.0065, which is highly probable under a low trade volume, EUR will come under strong pressure. In this case, I wouldn't recommend entering the market. It would be reasonable to open long positions following a false breakout at 1.0008. It would make sense to buy EUR/USD immediately at a dip from 0.9958 or lower at 0.9915, bearing in mind an upward intraday correction of 30-35 pips. What is needed to open short positions on EUR/USD On Friday, the bears loosened their grip on EUR/USD. While the pair is trading below 1.0116, the price will remain in the trading range. This will reinforce the chance of a further drop in line with the trend. In case EUR/USD grows in the first half of the day amid the empty economic calendar, a false breakout at the nearest resistance at 1.0116 will generate a signal for opening short positions on the assumption EUR/USD's decline to the middle of the sideways range at 1.0065. A breakout and consolidation below this range as well as the test upwards will create an extrasell signal that will trigger the buyers' stop losses. The price could develop a strong move towards the powerful support of the last week at 1.0008. A breakout and consolidation below this area will open the way to 0.9958 where I recommend closing sell positions in full. 0.9915 is a more distant target. In case EUR/USD goes up in the European session, and the bears lack activity at 1.0116,the sellers might face serious problems because a smooth price reversal from the parity level, which is clearly observed on the 1-hour chart, could push the pair sharply up. Under such a scenario, I recommend opening short positions until more attractive resistance at 1.0182 where moving averages are passing. The thing is that a strong breakout there will become a new market entry point for short positions. We could sell EUR/USD at a bounce off 1.0271 or higher at 1.0341, bearing in mind a downward correction of 30-35 pips.
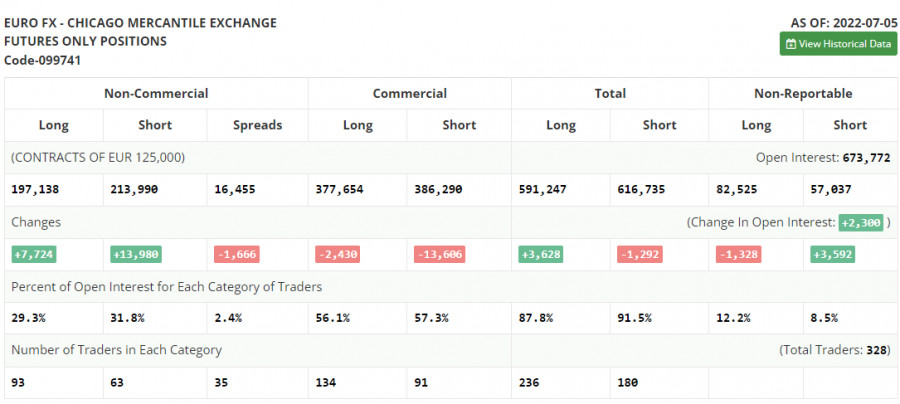
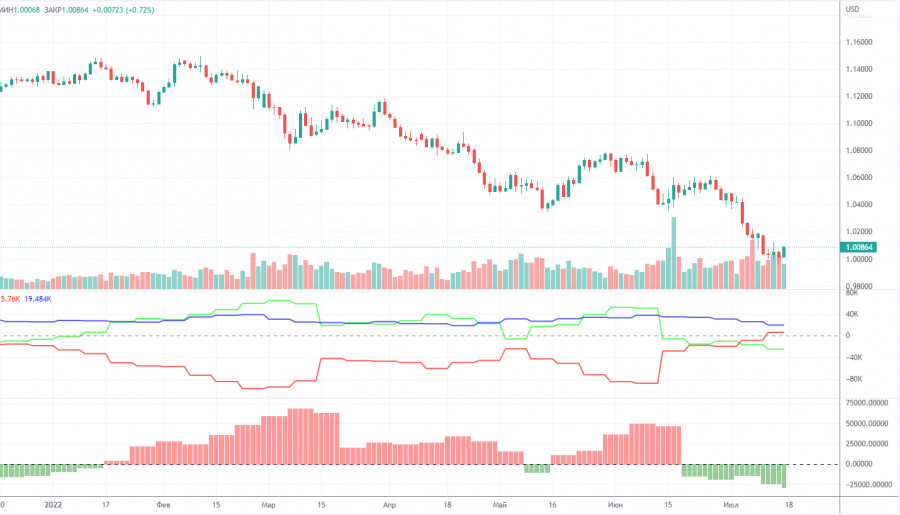
The COT (Commitment of Traders) report from July 5 indicates growth in both long and short positions. Short positions were twice more numerous than long ones. It means the overall bearishsentiment in the market formed a bigger negative delta. Last week, the EU retail sales data discouraged investors. In contrast, the US data on the labor market indicated that the Federal Reserve would be poised to pursue extremely hawkish monetary policy as a measure against high inflation. The market also was alert to remarks from ECB President Christine Lagarde who advocated for raising interest rates with the aim of curbing inflation. The highlight of the week isthe US inflation report that might again log another spike. If the actual data matches the forecast, don't be surprised about a further advance of the US dollar against the euro and the party level. According to the COT report, long non-commercial positions increased by 7,724 to 197,138whereas short non-commercial positions grew by 13,980 to 213,990. Despite the low exchange rate of EUR, traders prefer to buy USD because of the prospects of aggressive tightening by major central banks and a recession in many developed economies. As a result, the overall non-commercial net positions remained negative and came in at -16,852 against -10,569 earlier. The currency pair closed lower on Friday at 1.0316 against 1.0584 a week ago.
Indicators' signals:The currency pair is trading above the 30 and 50 daily moving averages. It indicates that EUR/USD is making attempts to push ahead with the upward correction. Moving averages Note: The period and prices of moving averages are considered by the author on the H1 hourly chart and differ from the general definition of the classic daily moving averages on the daily D1 chart. Bollinger BandsIf EUR/USD declines, the indicator's lower border at 1.0055 will serve as support. Otherwise,if the currency pair grows, the upper border at nearly 1.0116 will serve as resistance. Description of indicators Moving average (moving average, determines the current trend by smoothing out volatility and noise). Period 50. It is marked yellow on the chart. Moving average (moving average, determines the current trend by smoothing out volatility and noise). Period 30. It is marked green on the chart. MACD indicator (Moving Average Convergence/Divergence — convergence/divergence of moving averages) Quick EMA period 12. Slow EMA period to 26. SMA period 9 Bollinger Bands (Bollinger Bands). Period 20 Non-commercial speculative traders, such as individual traders, hedge funds, and large institutions that use the futures market for speculative purposes and meet certain requirements. Long non-commercial positions represent the total long open position of non-commercial traders. Short non-commercial positions represent the total short open position of non-commercial traders. Total non-commercial net position is the difference between short and long positions of non-commercial traders. The material has been provided by InstaForex Company - www.instaforex.com |
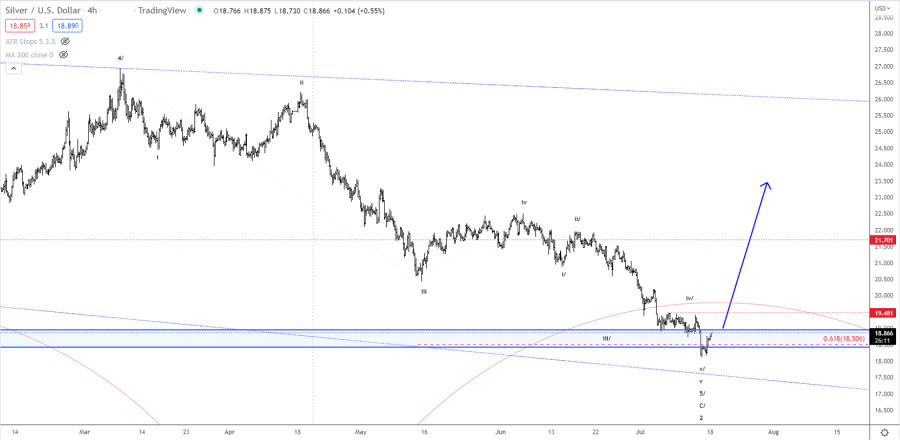
| Elliott wave analysis of Silver for July 18, 2022 Posted: 17 Jul 2022 10:41 PM PDT
|
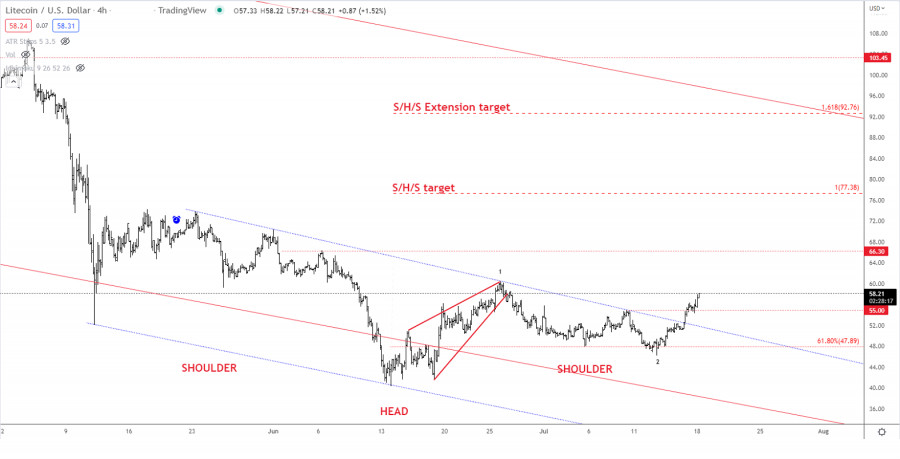
| Elliott wave analysis of Litecoin for July 18, 2022 Posted: 17 Jul 2022 10:38 PM PDT
Litecoin has broken nicely above the neckline resistance near 53.00. Besides, more importantly, resistance at 55.00 has been broken too which calls for a rally towards the S/H/S target at 77.38 and possibly even closer to the extension target seen at 92.76. The next hurdle is seen at 60.38, but we don't think it will be a major hurdle as Litecoin makes its way higher towards the S/H/S target at 77.38. The material has been provided by InstaForex Company - www.instaforex.com |
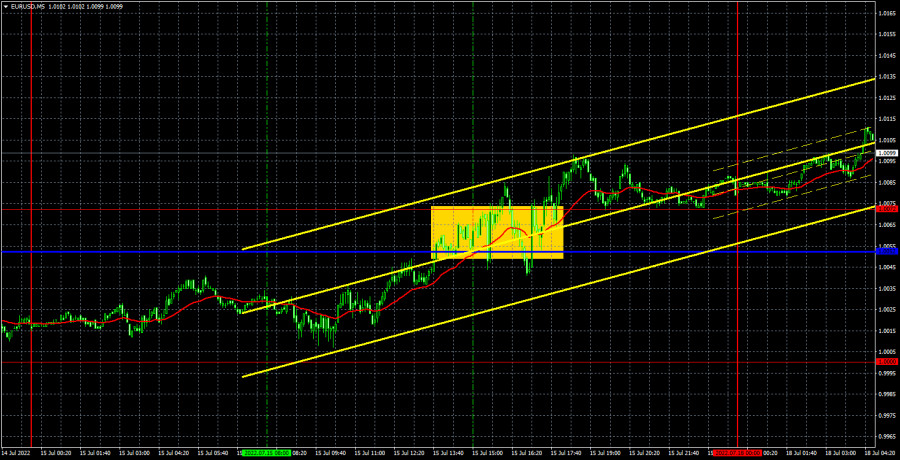
| Posted: 17 Jul 2022 10:13 PM PDT M5 chart of EUR/USD
On Friday, the EUR/USD pair started to retrace upward. At the moment, the euro is near the previous swing low, which has not been updated or broken yet. So, the downtrend may resume to the 20-year low. On Friday, macro data in the US triggered a mixed reaction in the market. Still, it is early to talk about the end of the long-term downtrend or the beginning of an upward correction. The ECB governing council meeting will take place this week, and the FOMC meeting will be held next week. Fundamental factors are still weighing on the euro. A possible 0.25% rate increase by the ECB is unlikely to support the euro amid the anticipated 0.75% rate hike by the Fed. There were a few trading signals on Friday. At the beginning of the North American session, the price entered the 1.0052-1.0072 range and hovered there for several hours. Market jitters were triggered by the release of macro data in the US (industrial production, retail sales, and consumer sentiment). Overall, those figures had no effect on both the intraday trend and the general trend whatsoever. Trading signals were made almost at the close of the trading day. So, opening trades a few hours before the close of the market was risky. COT report:
COT reports for the past six months are raising doubts because they show bullish sentiment, while the euro is bearish. The situation has now somewhat changed for the worse as sentiment has turned bearish, while the euro is still bearish. Therefore, the uptrend is highly unlikely any time soon. During the reporting week, the number of long positions increased by 100 and the number of short positions rose by 8.5K. Accordingly, the net position decreased by almost 8.5K. The sentiment of non-commercial traders remains bearish and has been even getting stronger in recent weeks. This means that non-commercial traders are unlikely to buy the euro in the near future. The number of long positions held by non-commercial traders is now 25K less than that of short ones. So, demand for the dollar is still high, which could exert additional pressure on the euro. All in all, the euro was unable to show a noticeable correction in the past few months. Its biggest upward movement was about 400 pips. H1 chart of EUR/USD
In the H1 time frame, the trend is still bearish. Should the pair break through the swing high of 1.0123, the euro will rise. Although it may well be another corrective move upward. Neither fundamental nor geopolitical background now signals to buy the pair. On Monday, trading levels are seen at 1,.0000, 1.0072, 1.0340-1.0366, 1.0485, 1.0243 (Senkou Span B), and 1.0035 (Kijun-sen). Ichimoku indicator lines can move during the day, which should be taken into account when determining trading signals. However, there have been no signals produced near support and resistance. Signals are made whenever the price bounces or breaks through extreme levels. Don't forget to place a stop-loss order at the breakeven point when the price passes 15 pips in the right direction. It can help you minimize losses when a signal turns out to be false. On July 18, the macroeconomic calendar is empty both in the eurozone and the US. Therefore, volatility may somewhat decrease today, and the pair may extend a correction or consolidate in the range. Indicators on charts: Resistance and support are thick red lines, near which the trend may stop. They do not make trading signals. The Kijun-sen and Senkou Span B lines are the Ichimoku indicator lines moved to the hourly timeframe from the 4-hour timeframe. They are also strong lines. Extreme levels are thin red lines, from which the price used to bounce earlier. They can produce trading signals. Yellow lines are trend lines, trend channels, and any other technical patterns. Indicator 1 on the COT chart shoe the size of the net position of each trader category. Indicator 2 on the COT chart reflects the size of the net position for the Non-commercial group of traders. The material has been provided by InstaForex Company - www.instaforex.com |
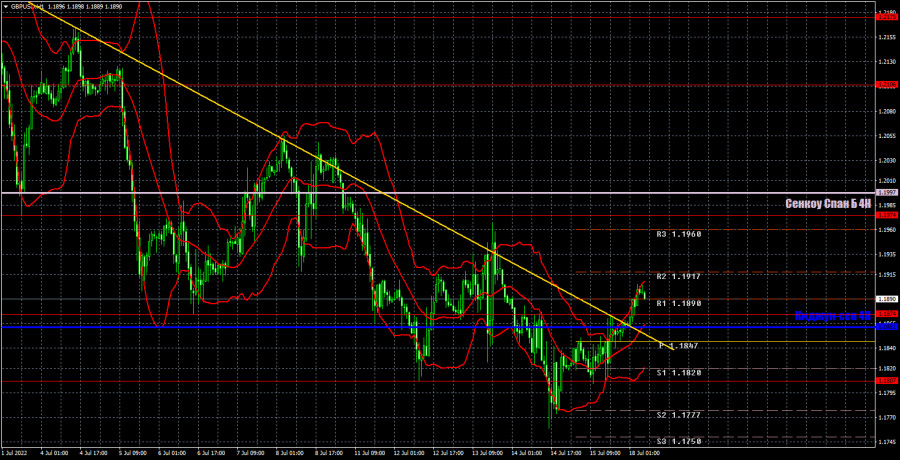
| Posted: 17 Jul 2022 10:13 PM PDT M5 chart of GBP/USD
On Friday, the movement of GBP/USD was similar to that of EUR/USD. Quotes were mostly rising during the day. Traders were still reluctant to invest in GBP. At the opening of the North American session, the release of three macro reports in the US triggered market jitters. However, volatility turned out to rater low, just 50-60 pips. All in all, the market showed no reaction to the results on US retail sales, industrial production, and consumer sentiment. By the end of the day, the pair approached the critical line. The pair has not broken through the line yet. Likewise, it has not reached the previous swing high yet. Therefore, a correction is highly unlikely. As for trading signals, GBP bounced off 1.1807 at the opening of the European session. So, it was time to go long. However, such trades brought no profit, and the pair returned to 1.1807 at the beginning of the North American session. Another rebound occurred and long positions were opened. This time, the price approached 1.1874 and pulled back. Long positions were closed with a profit of some 30-40 pips. The final sell signal was formed rather late, so it was pointless to go short. COT report:
The latest COT report revealed some changes. During the reporting week, non-commercial traders closed 5.7K long positions and 2.8K short ones. The net position increased by 2.9K. Sentiment is still bearish, according to Indicator 2 on the chart. There has been no strong upward correction so far. The net position was bearish for 3 months and then rose slightly. However, it does not matter because the pound is still falling versus the dollar. Demand for the dollar is still rather high. Therefore, for GBP to strengthen, demand for it should be rising faster than that for the greenback. Non-commercial traders now hold 93K short positions and just 34K long ones. Neither macro statistics nor fundamental factors support the British currency. The corrective move upward may extend. In the medium term, the downtrend is likely to extend. H1 chart of GBP/USD
In the H1 time frame, GBP broke the descending trend line. So, the currency now has slightly higher growth potential. Neither the fundamental nor geopolitical background has changed lately. Currently, there are some technical buy signals, but they mean little because a sell-off may start at any moment. On June 18, important levels are seen at 1.1807, 1.1874, 1.1974, 1.2106, 1.2175 as well as 1.1997 (Senkou Span B) and 1.1861 (Kijun-sen). Signals are made whenever the price bounces or breaks through extreme levels. Don't forget to place a stop-loss order at the breakeven point when the price passes 20 pips in the right direction. Ichimoku indicator lines can move during the day, which should be taken into account when determining trading signals. Support and resistance can be used for profit taking. On Monday, the macroeconomic calendar contains no important releases in the UK and the US. So, traders will have nothing to react to. Nevertheless, a sideways movement is unlikely today. Indicators on charts: Resistance and support are thick red lines, near which the trend may stop. They do not make trading signals. The Kijun-sen and Senkou Span B lines are the Ichimoku indicator lines moved to the hourly timeframe from the 4-hour timeframe. They are also strong lines. Extreme levels are thin red lines, from which the price used to bounce earlier. They can produce trading signals. Yellow lines are trend lines, trend channels, and any other technical patterns. Indicator 1 on the COT chart shoe the size of the net position of each trader category. Indicator 2 on the COT chart reflects the size of the net position for the Non-commercial group of traders. The material has been provided by InstaForex Company - www.instaforex.com |
| Posted: 17 Jul 2022 09:18 PM PDT
XAU/USD is trading around 1,716. This level coincides with the -1/8 Murray and the 21 SMA. In case the price consolidates above this zone, it is expected to resume its upward movement and could reach the top of the downtrend channel at around 1,730. The strength of the US dollar and the worsening prospects for gold demand, amid growing fears of a recession, continue to weigh on the price of the precious metal. The technical picture shows that gold remains extremely oversold and the price has been settled below the 200 EMA located at 1,794. Any failed attempt to break above this level will be seen as an opportunity to resume selling. A sharp break of the downtrend channel formed in early July (1,730) could mean an acceleration to the upside and the price could reach 1/8 Murray at around 1,781. The level of 1,718 (21 SMA) appears as the first resistance. If gold fails to consolidate above this level, we could expect a further bearish move, and the price could reach the psychological level of 1,700 and drop towards -2/8 Murray at 1,681. The market sentiment report shows that there are 86.58% of traders who are buying gold and 13.42% who are selling. This is a sign that a major technical bounce will occur in the next few days and then the metal will resume the downtrend. Our trading plan for the next few hours is to buy gold if it consolidates above 1,716 with targets at 1,730. In case of a break above the top of the downtrend channel, we could expect an acceleration to the upside and the price could reach 1,750 and 1,781. The material has been provided by InstaForex Company - www.instaforex.com |
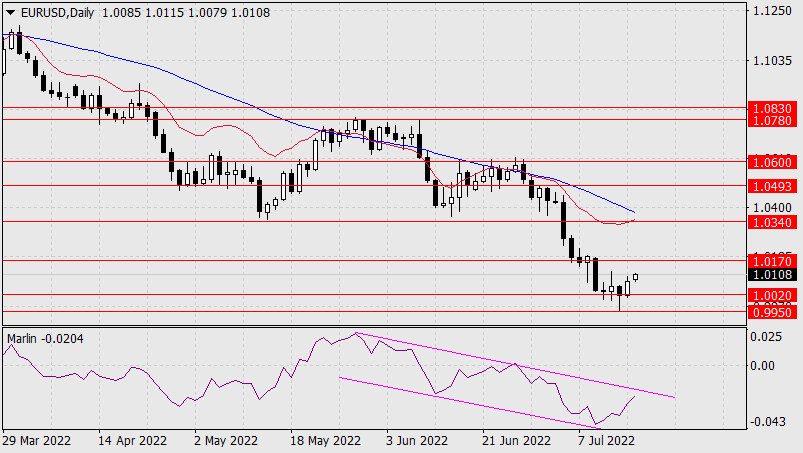
| Forecast for EUR/USD on July 18, 2022 Posted: 17 Jul 2022 08:06 PM PDT The euro consolidated above the support level of 1.0020 on Friday, and is now heading towards the target level of 1.0170. The signal line of the Marlin Oscillator on the daily chart is approaching the upper limit of its own descending channel. Taking into account the global downward trend, we expect the price to turn into a new wave of decline from the level of 1.0170.
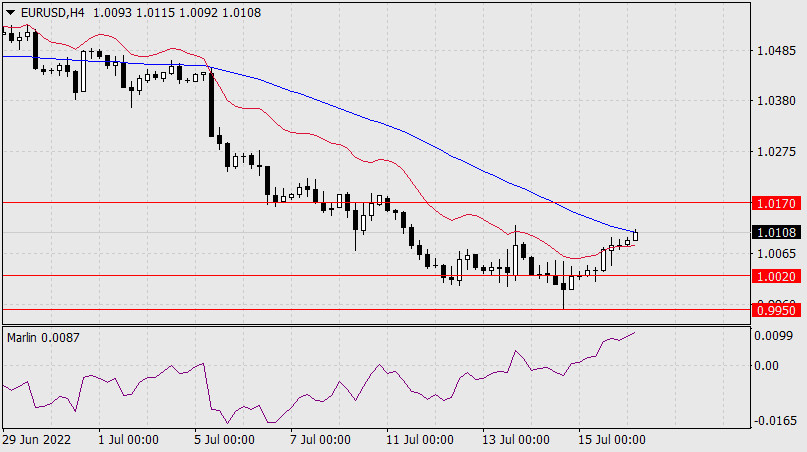
The price is struggling with the resistance of the MACD indicator line on the four-hour chart. Exit above it will finally clear the way for the price to the target resistance at 1.0170. The Marlin Oscillator still has room for growth.
Important economic data will not be released today, but inflation data (CPI) for June will be published in the euro area on Tuesday, the forecast for which is unchanged (8.6% Y/Y) and US construction data - the volume of construction of new houses in June is expected at 1.585 million Y/Y against 1.549 million Y/Y in May. The price could fall. The material has been provided by InstaForex Company - www.instaforex.com |
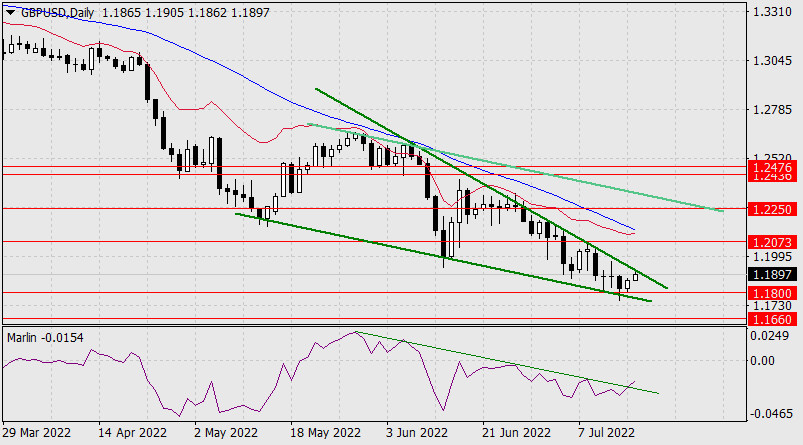
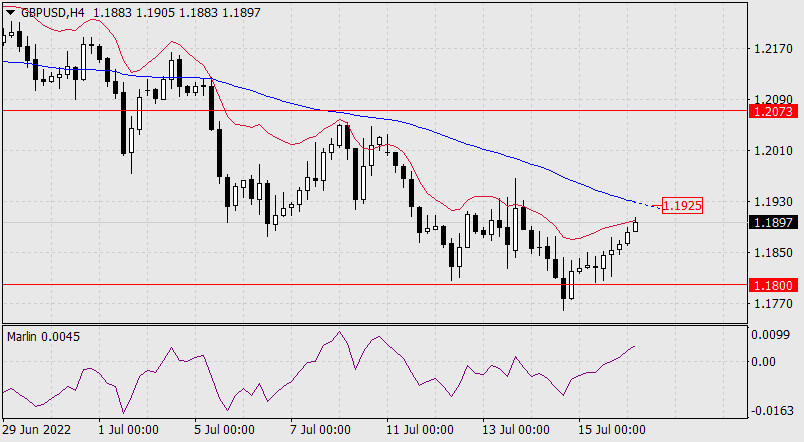
| Forecast for GBP/USD on July 18, 2022 Posted: 17 Jul 2022 08:06 PM PDT The British pound's growth from last Friday amounted to 42 points. This morning, the pound added another 32 points, coming close to the upper border of the descending wedge on the daily scale chart. Consolidating above it will open the way to the 1.2073 target level. The Marlin Oscillator is set strongly up. Its signal line has already gone above the sloping resistance line.
The price's exit from the wedge can transform it into a normal descending channel, the upper hypothetical border of which is indicated on the chart in light green. It will be a complex and ambiguous growth.
The Marlin Oscillator is growing in the positive area on the four-hour chart, there is not much left to the MACD line (1.1925). The exit above the line will give the corrective growth an additional charge of optimism. The target will be resistance at 1.2073. The material has been provided by InstaForex Company - www.instaforex.com |

 On the H4, with price recently breaking the descending trend channel and moving above the ichimoku cloud, we have a bullish bias that price will continue to rise from the 1st resistance at 0.62018 in line with the 61.8% fibonacci retracement and 78.6% Fibonacci projection to the 2nd resistance at 0.62529 at the pullback resistance in line with the 61.8% fibonacci projection. Alternatively, price may reverse off the 1st resistance and drop to the 1st support at 0.61717 at the pullback support.
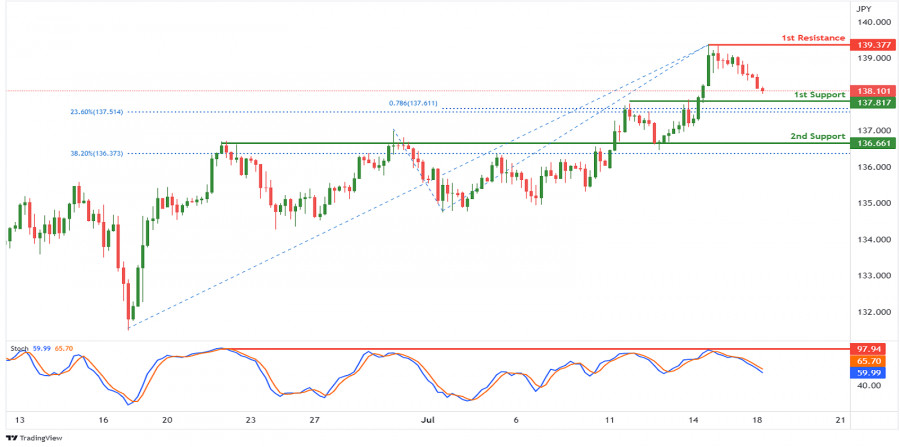

| You are subscribed to email updates from Forex analysis review. To stop receiving these emails, you may unsubscribe now. | Email delivery powered by Google |
| Google, 1600 Amphitheatre Parkway, Mountain View, CA 94043, United States | |


Comments