Forex analysis review
Forex analysis review |
- July 5, 2022 : EUR/USD daily technical review and trading opportunities.
- July 5, 2022 : EUR/USD Intraday technical analysis and trading plan.
- July 5, 2022 : GBP/USD Intraday technical analysis and significant key-levels.
- Bitcoin above major dynamic support
- GBP/USD: massive drop ahead
- Euro collapsed like a house of cards
- USD/JPY: long or short?
- Trading Signal for Gold (XAU/USD) for July 5 - 6, 2022: sell below $1,806 and buy if rebound off at $1,765 (SMA 21 - 161.8%
- AUD/USD: RBA July meeting results did not impress traders, pair tests the 67th figure
- Gold crashes as expected
- Analysis of GBP/USD on July 5. The situation for the pound is getting worse every day.
- EUR/GBP Technical Analysis and Trading Tips for July 5, 2022
- Technical analysis recommendations on EUR/USD and GBP/USD for July 5, 2022
- EUR/USD analysis on July 5. The wave pattern has become much more complicated, and now a new five-wave series can be built.
- Ichimoku cloud indicator analysis on Gold for July 5, 2022.
- EURUSD making fresh 2022 lows.
- Cardano technical view remains bearish.
- Short-term technical analysis on OIL.
- DAX challenges March lows.
- New 2022 highs for the Dollar Index.
- Asian markets advance on Tuesday
- Forecast for EUR/USD on July 5. The euro collapsed catastrophically.
- Forecast for GBP/USD on July 5. The holidays are over
- American premarket on July 5: the risk of another collapse of the US stock market is real
- GBP/USD: plan for the US session on July 5 (analysis of morning deals). The pound is on the verge of revising its annual
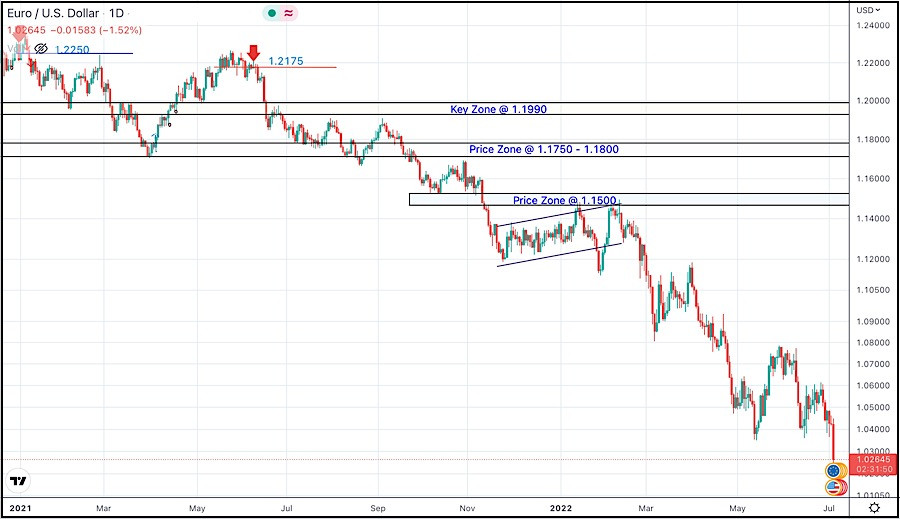
| July 5, 2022 : EUR/USD daily technical review and trading opportunities. Posted: 05 Jul 2022 11:39 AM PDT
In late September, Re-closure below the price level of 1.1700 has initiated downside-movement towards 1.1500 where some recovery was witnessed. Shortly after, Price levels around 1.1700 managed to hold prices for a short period of time before another price decline took place towards 1.1200. Then the EURUSD has temporarily moved-up within the depicted movement channel until downside breakout occurred recently. Since then, the price zone around 1.1500 has applied significant SELLING pressure when a valid SELL Entry was offered upon the previous ascending movement towards it. Shortly after, the EURUSD looked oversold while approaching the price levels of 1.0800 few weeks ago. That's where the recent upside movement was previously initiated. However, the recent movement towards 1.1200 was considered for another SELL Trade which already reached its targets. Any ascending movement towards 1.0800 should be watched for selling pressure and a possible SELL entry. The material has been provided by InstaForex Company - www.instaforex.com |
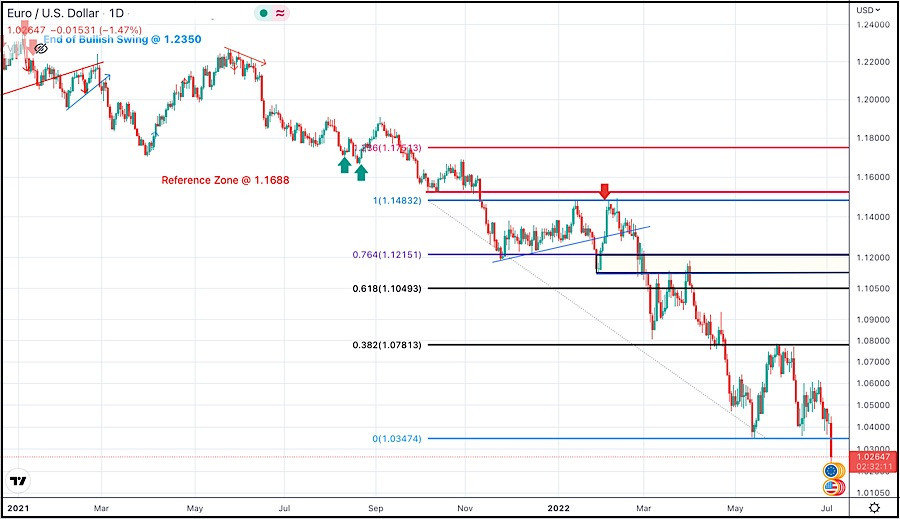
| July 5, 2022 : EUR/USD Intraday technical analysis and trading plan. Posted: 05 Jul 2022 11:37 AM PDT
The EURUSD looked oversold while approaching the price levels of 1.0800. That's when a temporary upside movement was approaching the price levels around 1.1200. This recent movement towards 1.1200 was suggested for another SELL opportunity which already reached its targets beyond the price level of 1.0400. The previous ascending movement above 1.0600 enabled further advancement towards 1.0800 where evident bearish rejection arised again. The pair had been trapped between 1.0350 (the newly recorded Low) and 1.0750 which corresponds to the nearest existing SUPPLY level until bearish breakout below 1.0350 was attempted earlier Today. Currently, the EURUSD pair is approaching new price levels around 1.0100 that haven't been visited since 2003. That's where price action should be watched cautiously. The material has been provided by InstaForex Company - www.instaforex.com |
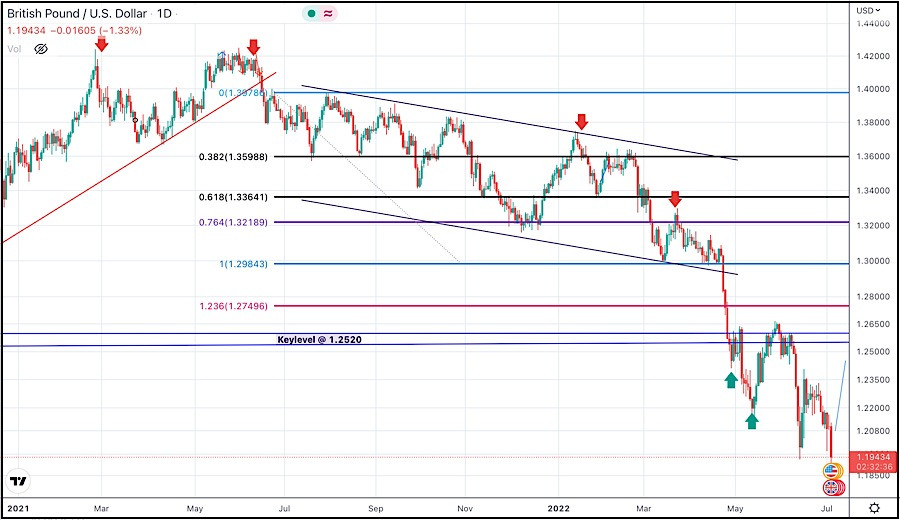
| July 5, 2022 : GBP/USD Intraday technical analysis and significant key-levels. Posted: 05 Jul 2022 11:31 AM PDT
Recently, the GBP/USD pair remained under bearish pressure to challenge the new low around 1.2150 again which was temporarily bypassed few days go. Immediate bullish rejection was expressed around 1.1950 bringing the pair back above 1.2150 again towards higher price levels. Bullish persistence above 1.2300 (when achieved) will probably enable further bullish continuation towards 1.2550 and probably 1.2650 where further decisions can be taken. On the other hand, another bearish visits may be expected to challenge the price level of 1.1950 again if sufficient bearish momentum is expressed. Significant bullish recovery has been witnessed during the recent bearish dip that took place earlier Last week. This favours the bullish scenario at least towards 1.2520 unless bearish persistence below 1.1900 is achieved The material has been provided by InstaForex Company - www.instaforex.com |
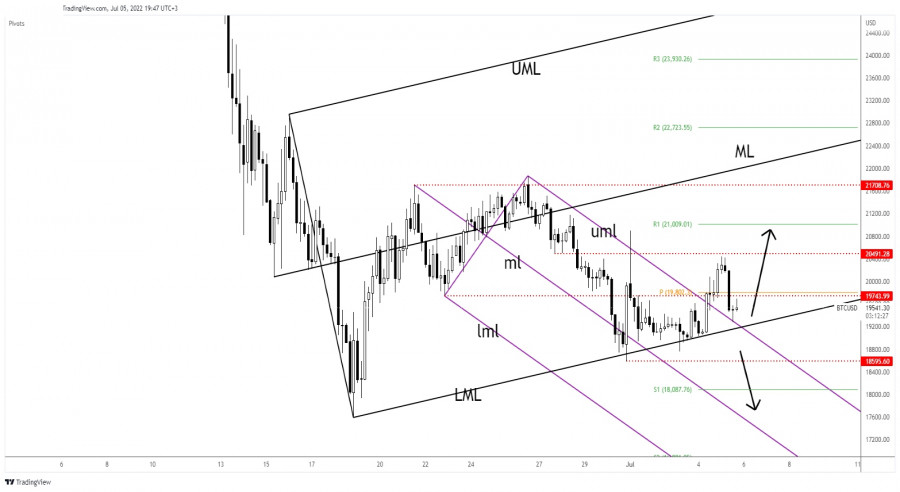
| Bitcoin above major dynamic support Posted: 05 Jul 2022 10:40 AM PDT BTC/USD dropped in the short term and now it retests the near-term downside obstacles. As you already know from my analyses, Bitcoin maintains a bearish bias despite temporary rebounds. It could drop towards new lows anytime. BTC/USD dropped by 5.67% from today's high of 20,440 to 19,281 daily low. In the last 24 hours, Bitcoin is down by 0.90% and by 5.53% in the last 7 days. In the short term, it is moving somehow sideways, that's why we'll have to wait for a fresh opportunity. BTC/USD Retests The Buyers!
As you can see on the H4 chart, the cryptocurrency escaped from the descending pitchfork's body but it has failed to make a new higher high signaling strong sellers. Still, as long as it stays above the lower median line (LML) of the ascending pitchfork, the bias remains bullish. This line represents strong dynamic support, the rate was rejected by this obstacle. Technically, we have a confluence area at the intersection between the lower median line (LML) with the upper median line (uml). BTC/USD Forecast!False breakdowns below the confluence area, through the lower median line (LML) could announce a new bullish momentum. Also, a new higher high could activate a larger growth. With a valid breakdown through the confluence area, a new lower low could activate more declines. The material has been provided by InstaForex Company - www.instaforex.com |
| Posted: 05 Jul 2022 10:39 AM PDT
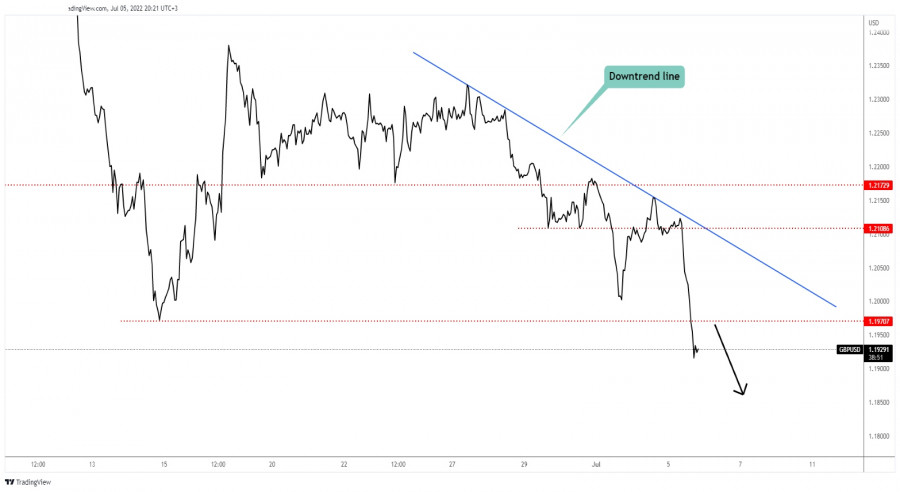
GBP/USD Downside Obstacle Violated!The GBP/USD pair dropped significantly after failing to stay above the 1.2108 level. You found out from my previous analysis that the price could drop deeper if it slips below this downside obstacle. As you can see on the H1 chart, personally, I've drawn a downtrend line which stands as an upside obstacle. As long as the price stays above this line, the GBP/USD pair could approach and reach fresh new lows. GBP/USD Trading Conclusion!For now, it has dropped below the 1.1970 former low which was seen as a downside obstacle. Dropping below this line confirmed strong sellers and a potential downside continuation. After its massive drop, we cannot exclude a minor growth. The price could come back to test and retest the 1.1970 broken obstacles before resuming its drop. A minor growth towards this level could bring new selling opportunities. The material has been provided by InstaForex Company - www.instaforex.com |
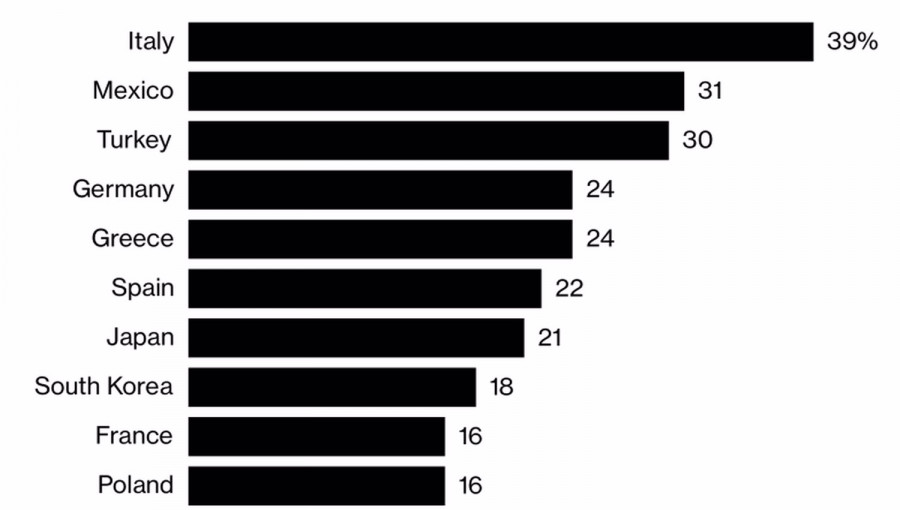
| Euro collapsed like a house of cards Posted: 05 Jul 2022 08:47 AM PDT While the United States is debating whether there will be a recession or not, the euro has fallen to a 20-year low against the US dollar. An energy crisis could trigger a recession in the eurozone much faster than in the US, and Russia's gas shutdown is fraught with the currency bloc's members fighting among themselves. The risks of the collapse of the community are growing by leaps and bounds, and with them, the very idea of the existence of a euro, is being seriously questioned. When prices for blue fuel in the euro area soar by 700% since the beginning of 2021, you begin to understand that it is not only a weapon of geopolitical struggle, but also an analogue of oil in the 1970s. Current events are often compared with those that took place half a century ago. Then the main driver of inflation acceleration was oil, now it is gas. The dependence of the eurozone countries on it is so great that the entire economy of the currency bloc was in danger of destruction. Share of gas in total energy consumption
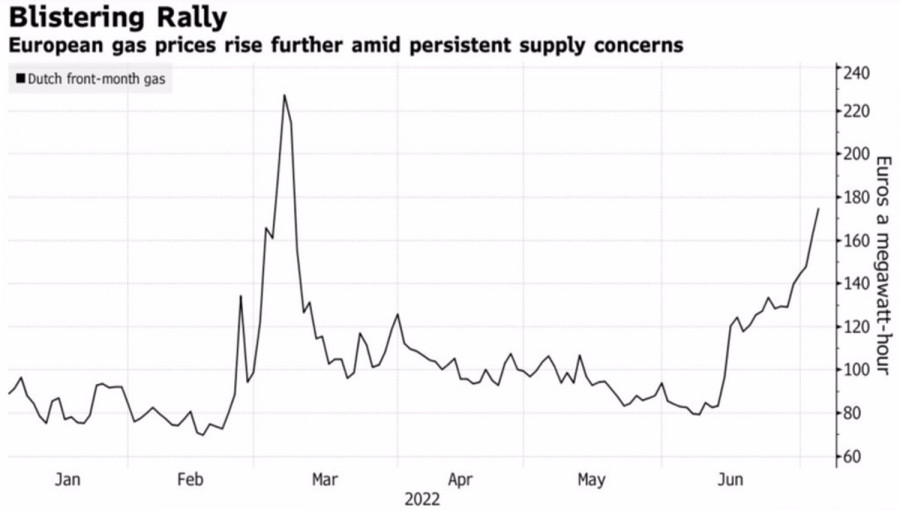
Once Germany starts to develop an emergency rescue plan, what will the weaker countries do? They will squabble over access to reserves, threatening to leave the eurozone, which makes them fearful about the future of the community and the regional currency. The fact that a recession is able to come to Europe earlier than to the US, says the words of German Economy Minister Robert Habeck. In his opinion, the rescue of the gas giant Uniper SE, which is negotiating with the government on a €9 billion bailout package, and Lehman Brothers, which provoked the economic crisis of 2007–2008, have a lot in common. The economy can collapse like a house of cards, and this is certainly a strong argument in favor of selling EURUSD. Dynamics of gas prices in Europe
Another reason to get rid of the euro is the extremely clumsy central bank. While the Fed has already raised rates by 150 bps and intends to add another 75 bps in July, the ECB starts very slowly. At the same time, increased risks of a downturn in the eurozone economy and fragmentation of the debt market are forcing derivatives to reduce expectations of the future value of the deposit rate. This year it is expected to grow by 140 bps compared to 190 bps three weeks ago. European borrowing costs by the end of 2022 will be 1%, and American 3.5%. Why not a reason to sell EURUSD?
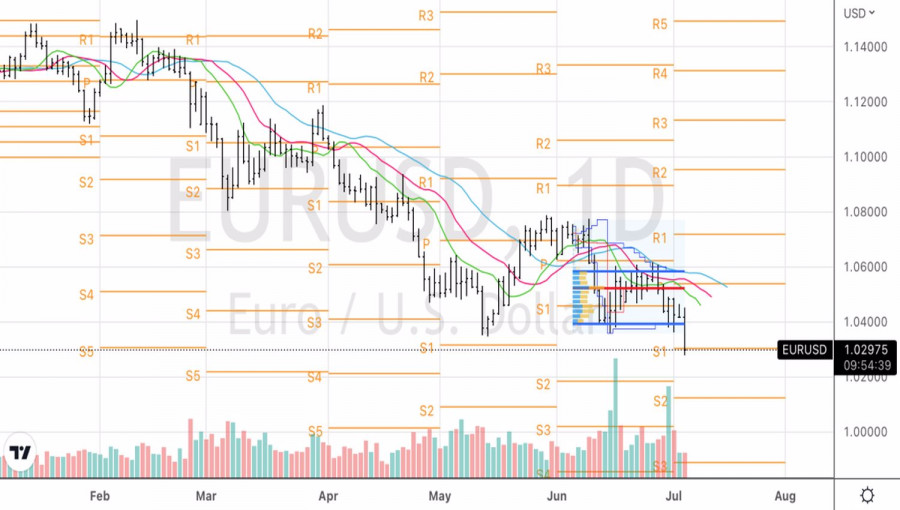
Now the issue of parity in the main currency pair is a matter of time. According to Bloomberg's options pricing model, the odds that the euro will be worth one US dollar by the end of the year jumped from 46% to 60% in just 24 hours. Technically, there is no reason to doubt the strength of the EURUSD downward trend. The pair's inability to cling to the 1.03 pivot level on the daily chart is a sign of bullish weakness. The recommendation is to sell the euro against the US dollar on any pullbacks. The level of 1.02 announced in my previous materials should be used as a target for the downward movement. Its achievement will open the door to a movement towards parity. The material has been provided by InstaForex Company - www.instaforex.com |
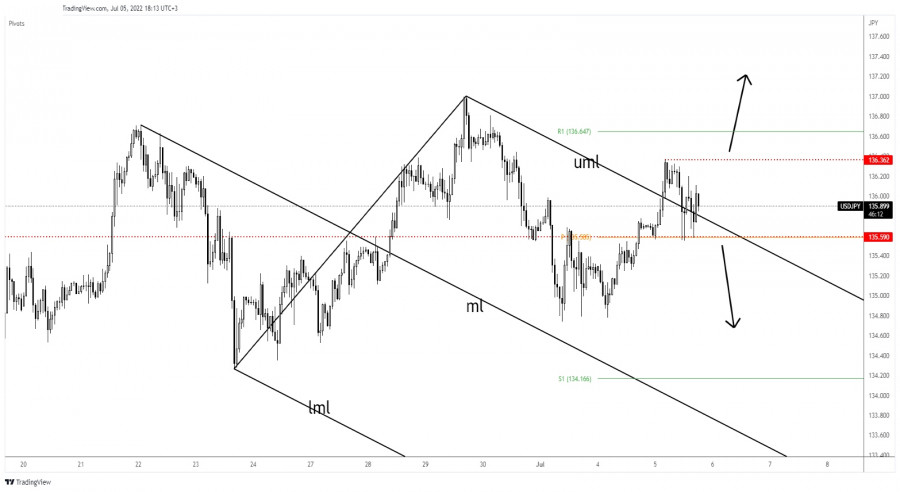
| Posted: 05 Jul 2022 08:43 AM PDT The USD/JPY pair is trading in the red at 135.81 on the H1 at the time of writing. In the short term is trapped between critical levels. It remains to see if this will be a buy or a sell, we need strong confirmation. The currency pair seems overbought even if the Dollar Index reached fresh new highs. USD/JPY retreated as the Japanese Yen Futures rebounded. Fundamentally, the Japanese Average Cash Earnings rose by 1.0% versus 1.5% expected. On the other hand, the US Factory Orders surged by 1.6% versus the 0.5% growth forecasted. Tomorrow, the FOMC Meeting Minutes and JOLTS Job Openings are seen as high-impact events and could really shake the markets. USD/JPY At Crossroads!
As you can see on the H1 chart, the USD/JPY pair failed to stabilize above the upper median line (uml) which represented a dynamic resistance. Technically, the rate signaled exhausted buyers after failing to make a new higher high. Now, it challenges the 135.59 static support. This is seen as a critical downside obstacle. A new lower low could activate more declines. Only staying above this level and above the upper median line (uml) followed by a new higher high could activate further growth. USD/JPY Outlook!Dropping and closing below 135.59 could invalidate further growth and could bring a new selling opportunity with a first downside target at 134.74. The material has been provided by InstaForex Company - www.instaforex.com |
| Posted: 05 Jul 2022 08:33 AM PDT
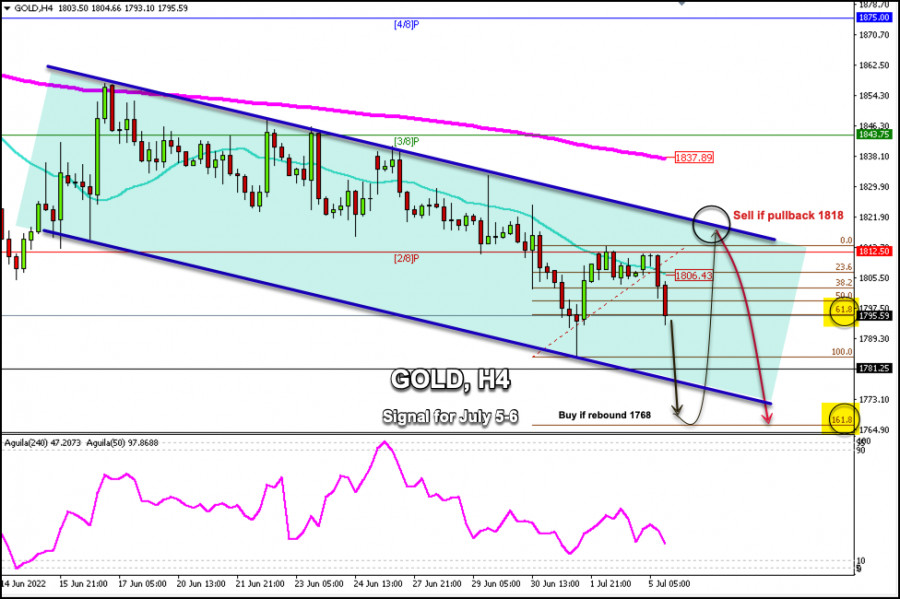
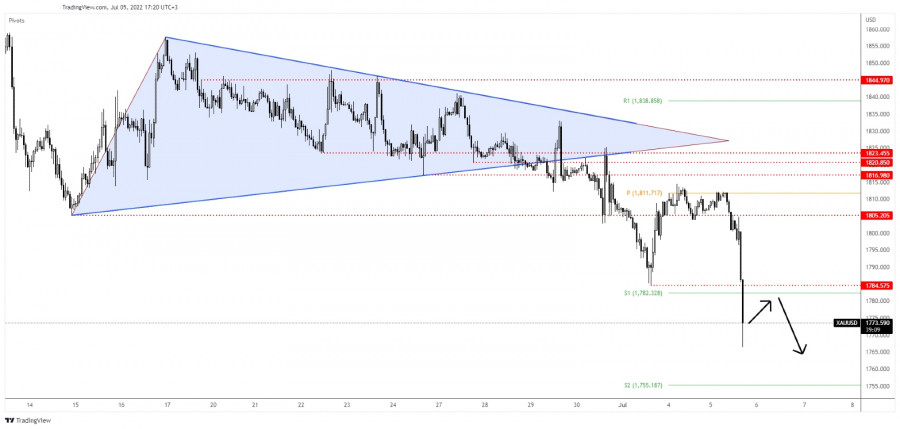
Early in the American session, gold (XAU/USD) is trading below the 21 SMA located at 1,806 and around the 61.8% Fibonacci. If gold fails to consolidate above 1,795 in the next few hours, it is likely to continue its decline to reach the Fibonacci 161.8% at around 1,765. Gold tried to break the 2/8 Murray resistance at around 1,812 but failed. The price is now consolidating below this level. The bearish pressure is likely to accelerate and we could see a decline in the price of gold. The lingering rumors surrounding the Federal Reserve about raising rates to curb high inflation turned out to be a key factor that continued to put pressure on Gold. That's why investors prefer to take refuge in the US Dollar. US Treasury bond yields are rising due to further aggressive tightening by the Fed. This outlook brought the dollar (USDX) back close to its 2002 highs and put additional pressure on gold. The minutes of the latest FOMC monetary policy meeting will be released on Wednesday and the US monthly NFP employment report on Friday. Strong market volatility is expected and gold is likely to trade in the range of 1,781 to 1,820. According to the 4-hour chart, gold is likely to continue its downward move in the coming hours. Below 1,806, gold is expected to be under strong downward pressure. On the contrary, in case gold resumes its upward movement, it is expected to consolidate above 1,806 and the price could reach the top of the downtrend channel at around 1,818. A pullback to the top of the downtrend channel will be a clear signal to sell gold with targets at 1,765, the 161.8% Fibonacci expansion zone. Additionally, if gold reaches these support levels and consolidates above the 161.8% Fibonacci, it will be a signal to buy in case there is a technical bounce. The price is likely to retreat and reach 1,781 and 1,806. The material has been provided by InstaForex Company - www.instaforex.com |
| AUD/USD: RBA July meeting results did not impress traders, pair tests the 67th figure Posted: 05 Jul 2022 08:23 AM PDT The Reserve Bank of Australia (RBA) announced the results of its July meeting today. The results fully coincided with the forecasts of most experts: the regulator raised the interest rate by 50 basis points, that is, up to 1.35%. Despite such a hawkish decision, the Australian dollar reacted stolidly to this fact—primarily since the central bank implemented the base, widely expected scenario, which was already taken into account in prices. While the rhetoric of the RBA's accompanying statement, as well as Philip Lowe's comments, disappointed with their neutral tone. Amid the rising inflation indicators, AUD/USD traders expected more: at least at previous meetings, the head of the central bank voiced more militant statements, signaling the aggressive pace of monetary tightening. Therefore, after a short-term upward surge to the borders of the 69th figure, the Aussie began to actively decline and is currently beating the thresholds of the 67th price level.
Undoubtedly, the main driving force behind the decline in AUD/USD is the US dollar, which is strengthening its positions throughout the market today. But the Aussie also contributed by reacting negatively to the very cautious theses of the final RBA communique. In an accompanying statement, the central bank said medium-term inflation expectations remain "strongly contained." In this context, the regulator emphasized that the scope and timing of future rate hikes "will depend on incoming data." Lowe generally repeated the main messages of the accompanying statement. According to him, inflation in Australia is "high, but not as high as in many other countries of the world," so the pace of monetary tightening will be determined by "incoming data and assessment of inflation and labor market prospects." In other words, the head of the RBA once again outlined the hawkish course of the central bank, but this time his rhetoric was more cautious and vague. As a result of the July meeting, the probability of a 50-point increase in August decreased, the pace of monetary policy tightening will likely slow down in the second half of the year. Lowe himself, in a recent interview, said that there is a narrow line between optimal tightening, sufficient to control inflation, and "too strong," which will plunge the Australian economy into recession. The RBA is now trying to find the notorious golden mean. Thus, the Australian dollar today did not receive support from the RBA, despite the 50-point rate hike. The AUD/USD pair demonstrates a downward trend, approaching the support level of 0.6750 (the lower line of the Bollinger Bands indicator on the D1 timeframe). Overcoming this target will allow the bears to go to the bottom of the 67th figure with subsequent testing of the main price line at 0.6700.
The pair was also pressured by news from China, where an outbreak of coronavirus was again recorded. About 700,000 residents have been quarantined in Anhui province, and public transport has been suspended, Reuters reported. Anhui accounts for the majority of new infections in China. In the country as a whole, there is also an increase in the number of infections: the day before, the National Health Commission reported that 473 new cases of COVID-19 were registered in mainland China. For comparison, it can be noted that a day earlier, 268 new cases were registered. Given the current policy of "zero tolerance" for Covid, it can be assumed that China will again be covered by a wave of lockdowns. In the end, the AUD/USD pair is declining due to the overall strengthening of the greenback. After a long three-day weekend, the US currency began to gain momentum throughout the market. The US dollar index reached 20-year highs amid growing anti-risk sentiment and increased hawkish sentiment from the Fed. Last week, several Fed representatives (Mester, Williams, Bowman, Kashkari) came out in favor of a 75-point rate hike in July. And while Fed Chairman Jerome Powell is still teetering on the issue (between a 50-point and 75-point increase), the pendulum seems to be swinging in the direction of a more hawkish scenario. At least the US dollar is now in high demand, also due to this fundamental factor. All this suggests that short positions on the pair are still relevant. Any corrective upward pullbacks should be used as a reason to enter sales. From a technical point of view, the AUD/USD pair is between the middle and lower lines of the Bollinger Bands indicator and under all the lines of the Ichimoku indicator on the D1 timeframe, demonstrating the bearish Parade of Lines signal. All these technical signals also indicate the priority of the downward movement. The first, and, so far, the main target of the downward trend, is located on the lower line of the Bollinger Bands indicator—0.6750. The material has been provided by InstaForex Company - www.instaforex.com |
| Posted: 05 Jul 2022 08:01 AM PDT Gold plunged after retesting the near-term upside obstacles. It was trading at 1,774 at the time of writing. XAU/USD dropped by 2.53% from 1,812 today's high to 1,766 daily low. The yellow metal also crashed because the Dollar Index rallied. USD's appreciation forced XAU/USD to approach and reach new lows. Fundamentally, the price of Gold crashed as the central banks are expected to continue hiking rates. Today, the RBA increased the Cash Rate from 0.85% to 1.35% as expected. Earlier, the Factory Orders rose by 1.6% exceeding the 0.5 estimates. XAU/USD Targeting New Lows!
XAU/USD dropped like a rock after testing and retesting the weekly pivot point of 1,811. Its failure to stay above the 1,805 key level signaled exhausted buyers and a potential downside movement. You knew from my analyses that, XAU/USD could drop deeper after escaping from the triangle pattern. After its last massive drop, a temporary rebound was somehow expected. Also, after today's sell-off, the price of gold could try to come back to test and retest the near-term resistance levels before resuming its sell-off. XAU/USD Trading Conclusion!Today's valid breakdown below 1,805 signaled more declines. This was seen as a selling opportunity. Right now, it's too late to go short on Gold only because the rate could try to rebound and recover. A temporary rebound, coming back to test and retest the 1,784 level or the S1 (1,782) could bring new selling opportunities. The weekly S1 (1,755) stands as a downside obstacle if the rate continues to drop. The material has been provided by InstaForex Company - www.instaforex.com |
| Analysis of GBP/USD on July 5. The situation for the pound is getting worse every day. Posted: 05 Jul 2022 07:57 AM PDT
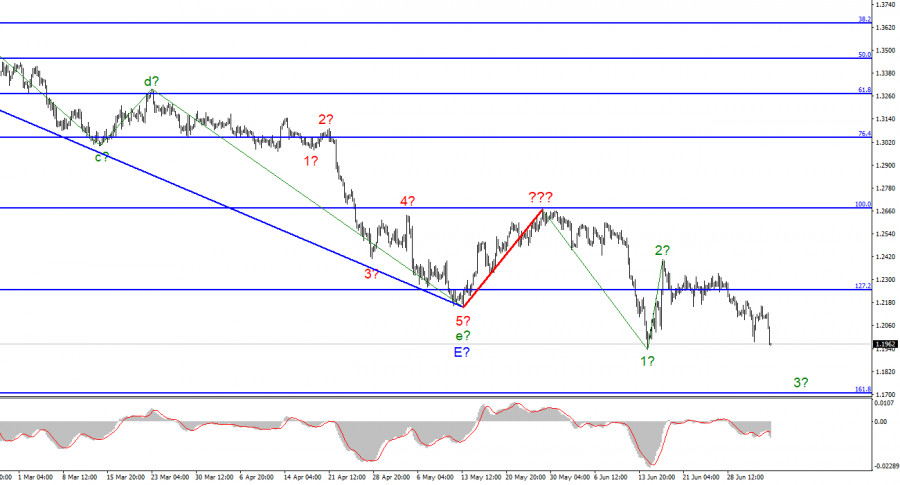
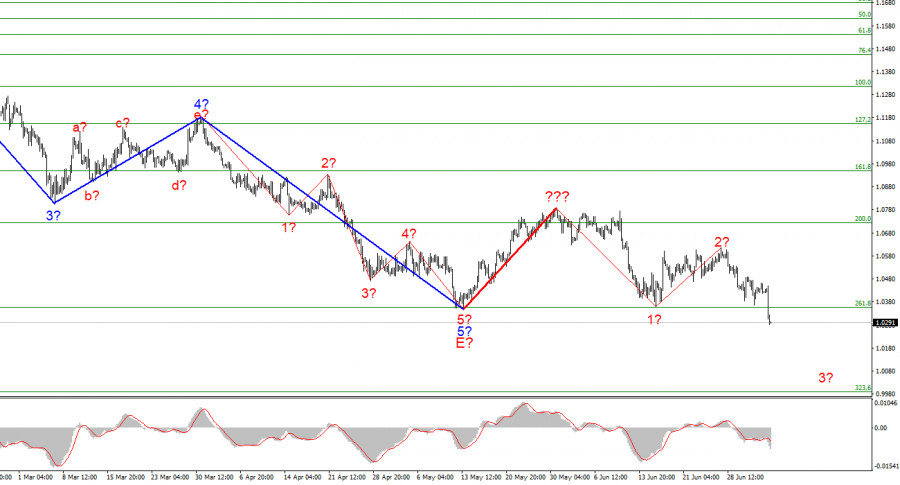
The wave marking for the pound/dollar instrument requires clarity. The last falling wave has already surpassed the minimum of the preceding wave, indicating the continuation of the downward trend section. In addition, today's decrease in the instrument's price has resulted in the current downward wave surpassing the previous one's minimum. Thus, it is certain that the construction of the trend's correction portion has been canceled, and the trend's downward segment will assume a more protracted form. I'm not a big fan of continually complicating the wave marking when dealing with a highly elongating trend zone. I believe it would be far more efficient to recognize rare corrective waves, following which new impulse structures may be constructed. We are currently observing waves 1 and 2. Thus we can assume that the instrument is currently constructing wave 3. If this is the case, the slide may continue with objectives near the Fibonacci level of 161.8%. Economic activity in the United Kingdom's services sector is declining. At the time of writing, the exchange rate for the pound/dollar instrument declined by 170 basis points on July 5. A significant fall in demand for the pound could result from a huge event or, as silly as it may sound, nothing at all. The current news background is irrelevant if the market sentiment remains unchanged for an extended period. It does not influence the decisions of market players. For instance, today. Does anyone believe that the index of business activity in the UK services sector caused such a significant decrease in the instrument? Although this metric has deteriorated since the previous month, it has not fallen below the critical 50.0 threshold. Therefore, commercial activity stays at a level at which it is possible to speak of the sector's expansion and not its contraction. However, this does not affect the British sellers. Therefore, I am inclined to believe that the current news environment does not affect market activity.I believe it is prudent to begin with, the wave marking for the most junior order. According to the theory, the construction of the third wave of a new downward impulse has now commenced. General observations. The increased complexity of the pound/dollar pair wave structure currently signals a further collapse. For each "down" MACD signal, I recommend selling the instrument with objectives at the estimated mark of 1.1708, corresponding to 161.8% Fibonacci. The material has been provided by InstaForex Company - www.instaforex.com |
| EUR/GBP Technical Analysis and Trading Tips for July 5, 2022 Posted: 05 Jul 2022 07:46 AM PDT
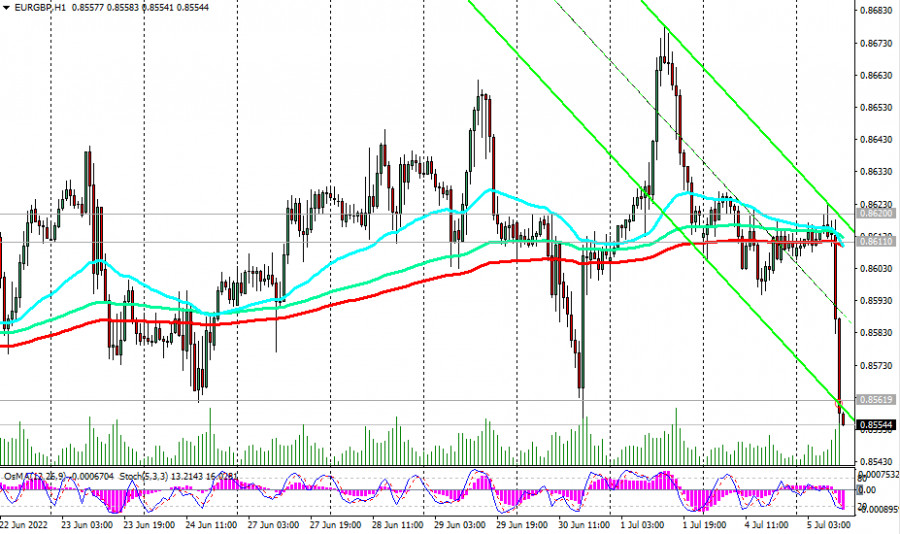
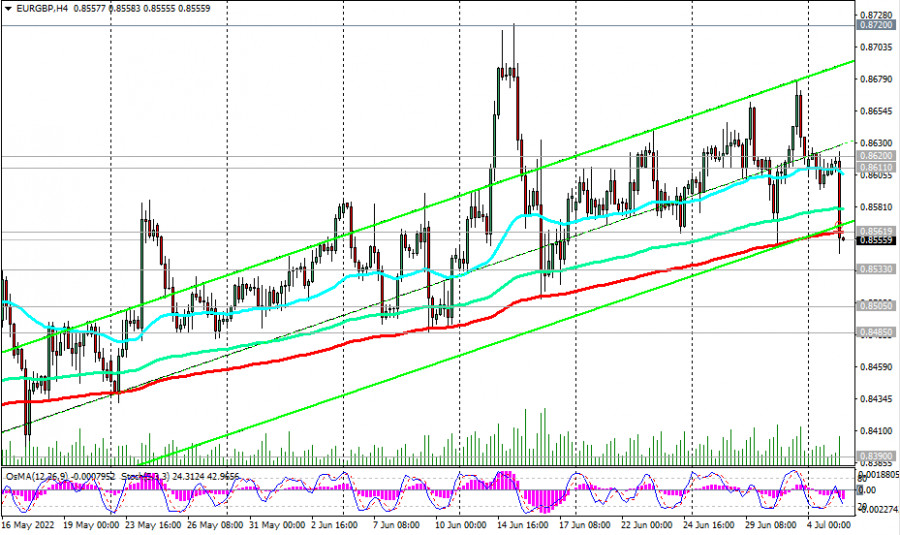
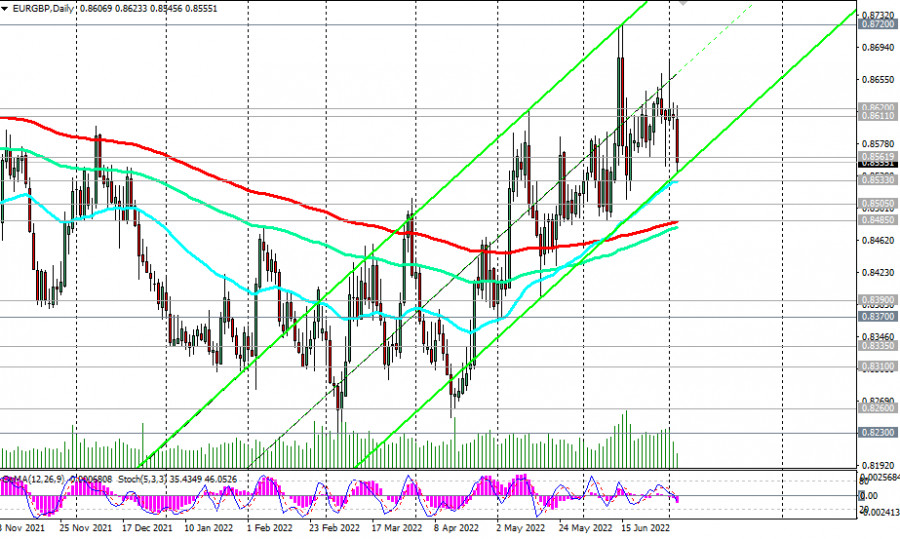
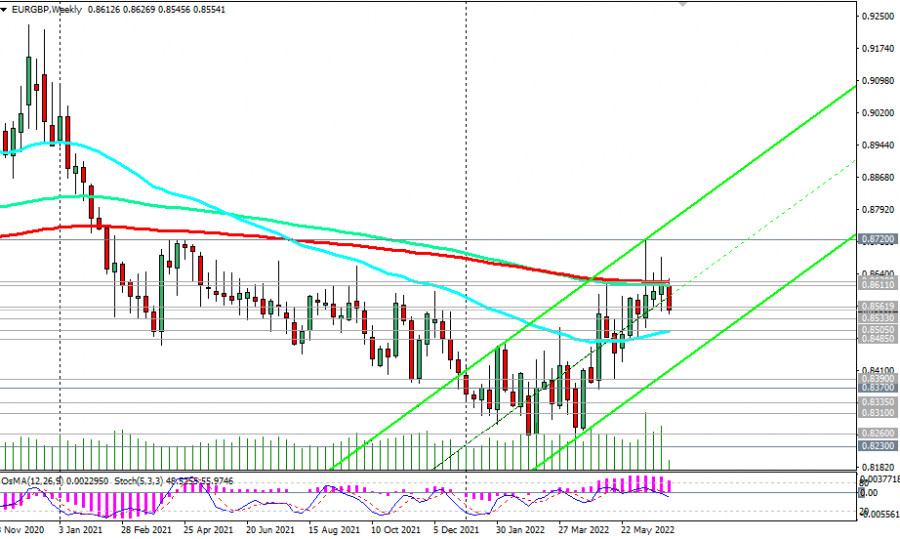
Against the background of a sharp weakening of the euro, the pair EUR/GBP fell sharply at the beginning of the European session today, reaching an intraday low of 0.8543, which is 63 points below the opening price of today's trading day. By the way, the lower line of the rising channel on the daily chart also passes through the level of 0.8543. At the same time, such sharp fluctuations often create good trading opportunities. Probably, today's fall is just such a case, given the established (since mid-April) general upward trend of this pair.
As the EUR/GBP upward trend continues, for now, the support level at 0.8562 (200 EMA on the 4-hour chart) should probably be considered a suitable zone to enter or increase long positions.
If the decline still continues, then additional buy orders can be placed near the support level of 0.8533 (50 EMA on the daily chart). Based on our assumption and in anticipation of a resumption of growth in EUR/GBP, the nearest targets are the resistance levels of 0.8611 (200 EMA on the 1-hour chart) and 0.8620 (200 EMA on the weekly chart). Their confirmed breakdown and consolidation in the zone above 0.8620 will indicate that EUR/GBP is entering the zone of a long-term bull market.
In an alternative scenario, the price will break through the support level of 0.8533, and EUR/GBP will head towards the key support level of 0.8485 (200 EMA on the daily chart). Its breakdown, in turn, will return EUR/GBP to the zone of a long-term bear market. Support levels: 0.8562, 0.8533, 0.8505, 0.8485, 0.8400, 0.8390, 0.8370 Resistance levels: 0.8600, 0.8611, 0.8620 Trading Tips Sell Stop 0.8540. Stop-Loss 0.8570. Take-Profit 0.8533, 0.8505, 0.8485, 0.8400, 0.8390, 0.8370, 0.8335, 0.8310, 0.8260, 0.8230, 0.8200, 0.8145 Buy Stop 0.8570. Stop-Loss 0.8540. Take-Profit 0.8600, 0.8611, 0.8620, 0.8675, 0.8700 The material has been provided by InstaForex Company - www.instaforex.com |
| Technical analysis recommendations on EUR/USD and GBP/USD for July 5, 2022 Posted: 05 Jul 2022 07:20 AM PDT EUR/USD
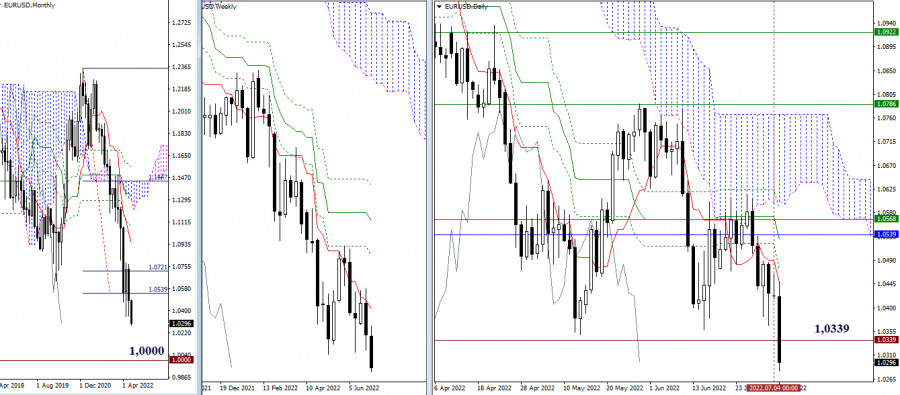
Higher timeframes Yesterday did not bring changes in the balance of power. Today we are witnessing a fairly large-scale activity of bears—they have updated the local low 1.0349–39, which have served as bearish reference points over the past two months. If the bears manage now not only to mark a new low, but also to hold their positions, then new prospects can be considered. Further attention of bears could be directed to the significant psychological level of 1.0000.
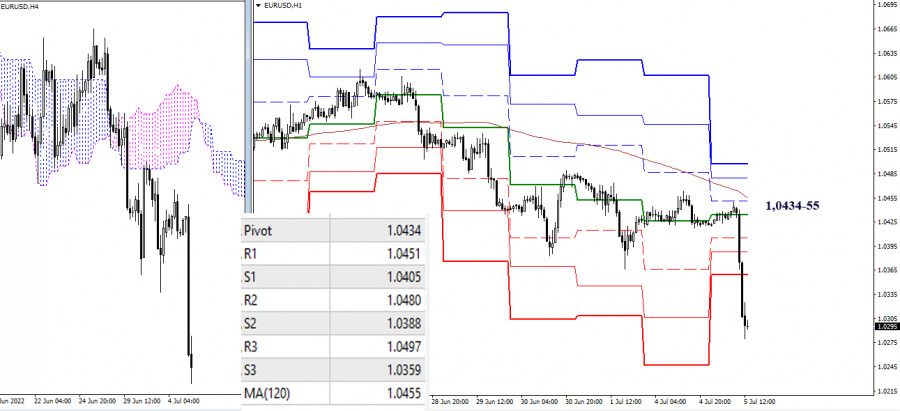
H4 – H1 At the moment, the advantage in the current situation is on the side of the bears. Sellers today exceeded the expectations formed on the lower timeframes in the form of classic pivot points. The passed levels now, in case of the recovery of bullish positions, can serve as resistance 1.0359 – 1.0388 – 1.0405 – 1.0434–55. *** GBP/USD
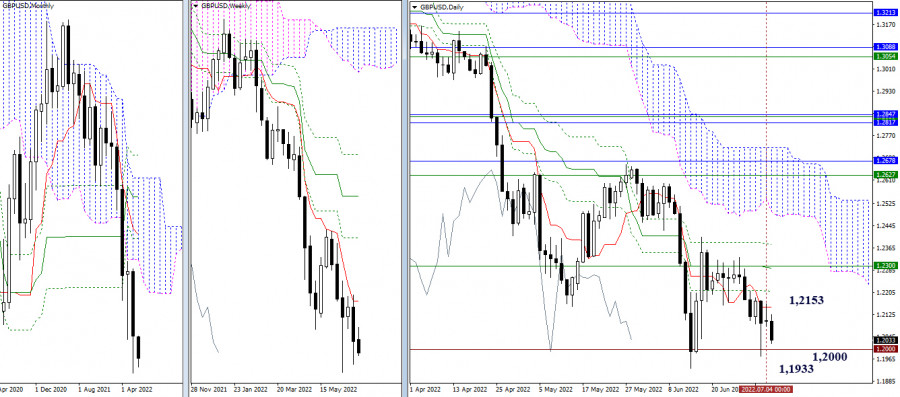
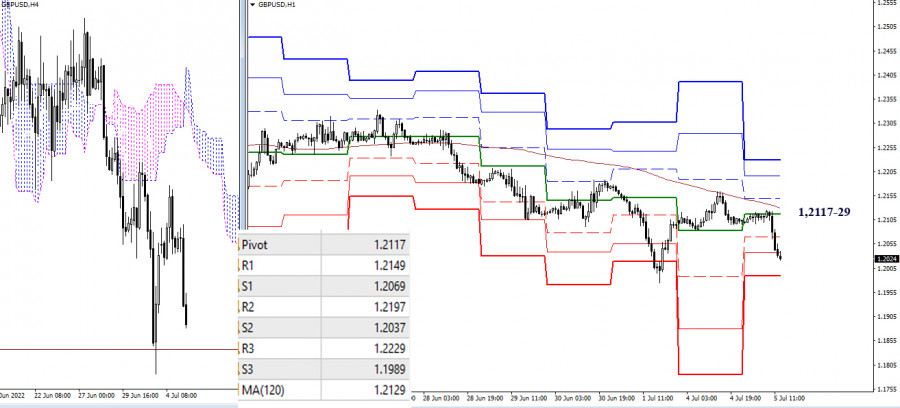
Higher timeframes The situation did not change significantly yesterday. The role of the resistance in this area was confirmed yesterday and maintained by the daily short-term trend (1.2153). Today, bears are trying to be active and achieve results. Their task now is to overcome the immediate supports, which are the psychological level of 1.2000 and the local low of 1.1933. Reliable consolidation below will allow us to consider new prospects.
H4 – H1 The key level of lower timeframes (weekly long-term trend) did not allow to change the current balance of power yesterday. The advantage remained on the side of the bears. Today, the area 1.2117–29 (central pivot point of the Day + weekly long-term trend) is responsible for maintaining bearish advantages. The reference points for strengthening bearish sentiments within the day are the classic pivot points. By now, the first two supports have already passed the bears, ahead of S3 (1.1989). Further attention will be directed to the support of the higher timeframes at 1.1933. *** In the technical analysis of the situation, the following are used: higher timeframes – Ichimoku Kinko Hyo (9.26.52) + Fibo Kijun levels H1 - Pivot Points (classic) + Moving Average 120 (weekly long-term trend) The material has been provided by InstaForex Company - www.instaforex.com |
| Posted: 05 Jul 2022 07:00 AM PDT
As a result of today's decline of about 200 basis points, the wave markings on the 4-hour chart of the euro/dollar instrument have grown more complicated. Consequently, a successful attempt was made to surpass the Fibonacci level of 261.8%, which was also the low of the waves E and b. It is already evident that these waves are likely not E and b, but the current market sentiment is gaining prominence. A few days ago, we had a fantastic, promising wave pattern consisting of a five-wave descending structure. Instead of constructing at least three upward correction waves, the market opted to resume selling the instrument, indicating the secondary importance of wave analysis at this moment. Occasionally, the market completely disregards the waves. However, I want to remind you that the market frequently disregards the news background and numerous technical signs. The key is to recognize that this has occurred promptly and adapt to the new market circumstances. Now that one corrective wave has been identified with a red line, the instrument may construct a new five-wave falling series. On a broader scale, the wave markup appears unintelligible. Thus I propose focusing on the lowest wave order presently. The euro currency began the week with optimism, which rapidly disintegrated. Tuesday saw a decline of 140 basis points in the euro/dollar exchange rate relative to the day's opening price. There was no news context on Monday, and on Tuesday, the business activity index in the European Union's services sector declined from 56.1% to 53.3% in June. Such a significant decline could reduce demand for the euro currency, but not to the extent that the instrument breaks the wave marking or falls by 140 points, in my opinion. In the end, business activity is not a report on the Gross Domestic Product, inflation, or a meeting of the ECB or Fed. I believe it has everything to do with the gloomy market sentiment, which persists unabatedly. If this is accurate, the news environment may not affect market sentiment in the coming weeks when the following five-wave descending structure is being constructed. As evidenced by the beginning of the week, the rhetoric about an American recession did not influence the market's willingness to increase dollar demand. Therefore, why pay attention to the news background if the tool is heading in one direction? A report on retail sales will be revealed in the European Union tomorrow, but I have a feeling that neither the market nor investors will care. The ISM index is more significant for the US services sector, but the euro can only count on a tiny rebound in the context of a new segment of a downward trend. General conclusions. Based on the analysis, I conclude that the building of the segment with the declining slope has resumed. If so, it is now viable to sell the instrument with goals at the estimated 0.9988 level, which corresponds to the Fibonacci level of 323.6%, for each "down" MACD signal, based on the development of wave 3. A successful attempt to surpass the level of 261.8% signals the market's readiness for stronger instrument sales and the cancellation of the scenario involving the creation of rising structures. The material has been provided by InstaForex Company - www.instaforex.com |
| Ichimoku cloud indicator analysis on Gold for July 5, 2022. Posted: 05 Jul 2022 06:38 AM PDT
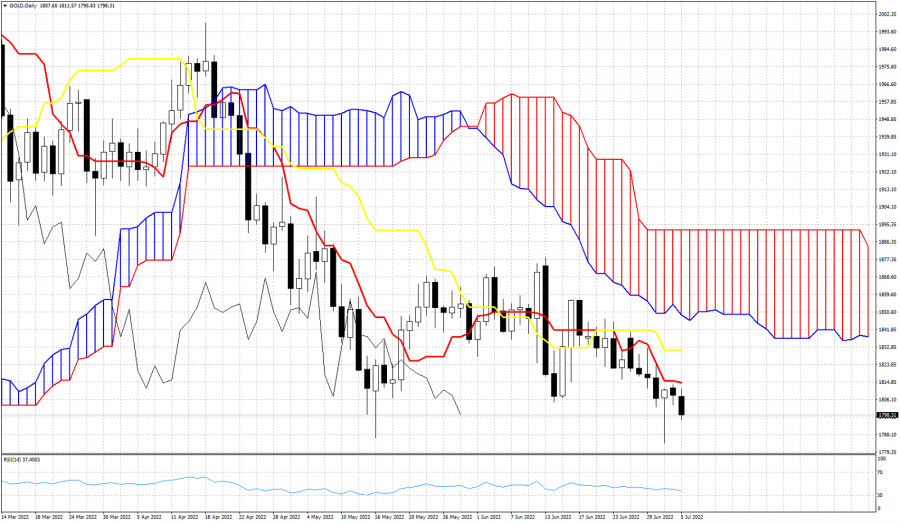
Gold price is under pressure. Price is trading around $1,790-97. Although Friday's daily candle was very promising for bulls, there was no follow up and price is about to challenge recent lows. As we mentioned in previous posts, as long as Gold price is below $1,850-30, Gold is vulnerable to more downside. Gold is still below the tenkan-sen (red line indicator). Price continues to get rejected at the tenkan-sen confirming that bears remain in control of the trend. In order for this to change, bulls will first need to recapture $1,831 (kijun-sen yellow line indicator) and next break into cloud resistance above $1,850. Until then Gold price remains vulnerable to new lows towards $1,750. The material has been provided by InstaForex Company - www.instaforex.com |
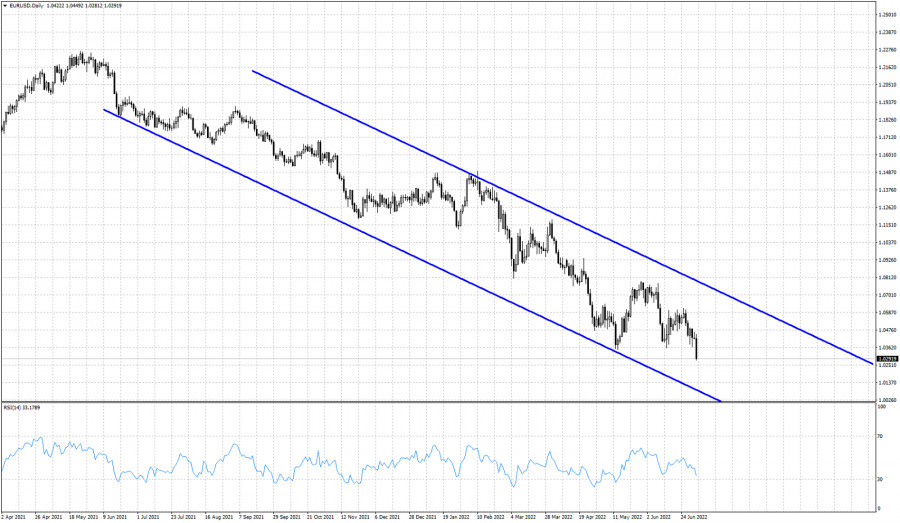
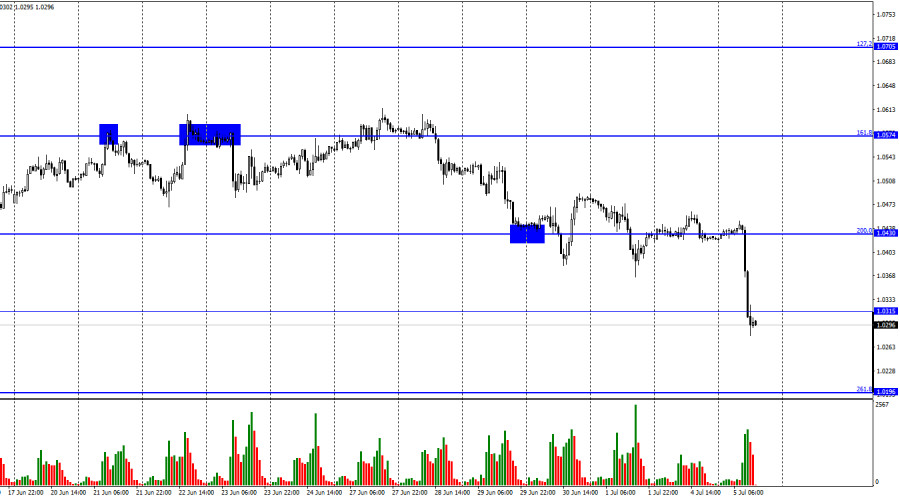
| EURUSD making fresh 2022 lows. Posted: 05 Jul 2022 06:33 AM PDT
Blue lines- bearish channel EURUSD is trading below 1.03. Price remains inside the medium-term bearish channel and having broken below our key support levels that we mentioned in previous posts, has lead price to a move below 1.03 and potential to reach parity. It is clear that trend is bearish as price is making lower lows and lower highs. The lower channel boundary is now at price level 1 (parity) and we should be heading towards that level or close to that level before making a bounce higher. The RSI is providing a bullish divergence but I don't know if this can last or it will get cancelled with a new lower low by the RSI. Bears remain in control of the short-term trend after the break below 1.05 and the rejection at 1.06-1.0630. Our Ichimoku cloud analysis warned bulls with the rejection on time that we were getting bearish signals. The material has been provided by InstaForex Company - www.instaforex.com |
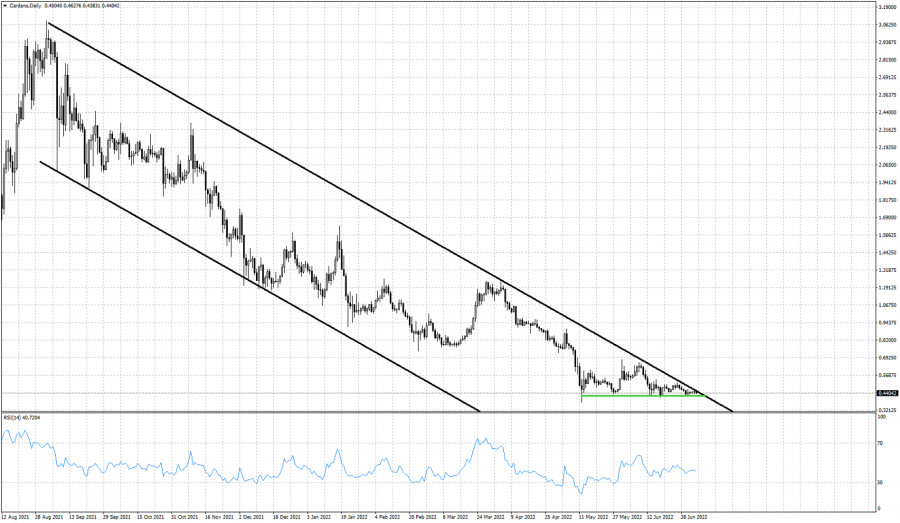
| Cardano technical view remains bearish. Posted: 05 Jul 2022 06:29 AM PDT
Black lines- bearish channel Green line- horizontal support Cardano price is around $0.43. There is no real progress price wise over the last couple of weeks as price is mostly moving sideways. Despite this sideways movement, price remains trapped inside the medium-term bearish channel. Price has now reached the upper channel boundary and there are increased chances that we will see lower price levels. With horizontal support at $0.42, a combination of channel rejection with support break down would be very bearish for Cardano. This could lead price below May lows. Trend remains controlled by bears. The material has been provided by InstaForex Company - www.instaforex.com |
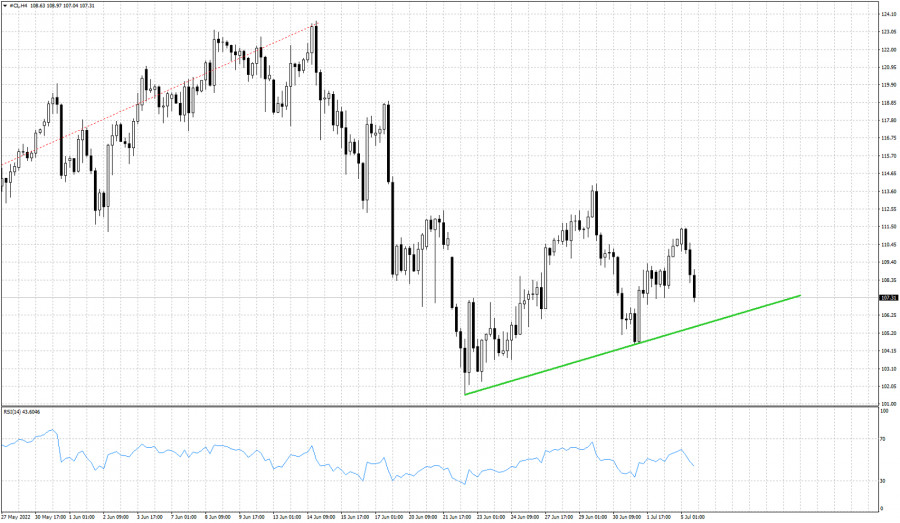
| Short-term technical analysis on OIL. Posted: 05 Jul 2022 06:26 AM PDT
Green line- support trend line Oil prices are again under pressure. With price forming lower highs, it is most probable that Oil prices will continue lower towards $102 and maybe lower. Short-term support by the green support trend line is found at $105.60. Oil price is vulnerable to a break below 105 specially if the recent higher low at $104.55 is broken. Resistance is at the recent lower high of $111.43 and as long as price is below this level, we remain pessimistic for the short-term. Oil price could very well move below $100 over the next few sessions. The material has been provided by InstaForex Company - www.instaforex.com |
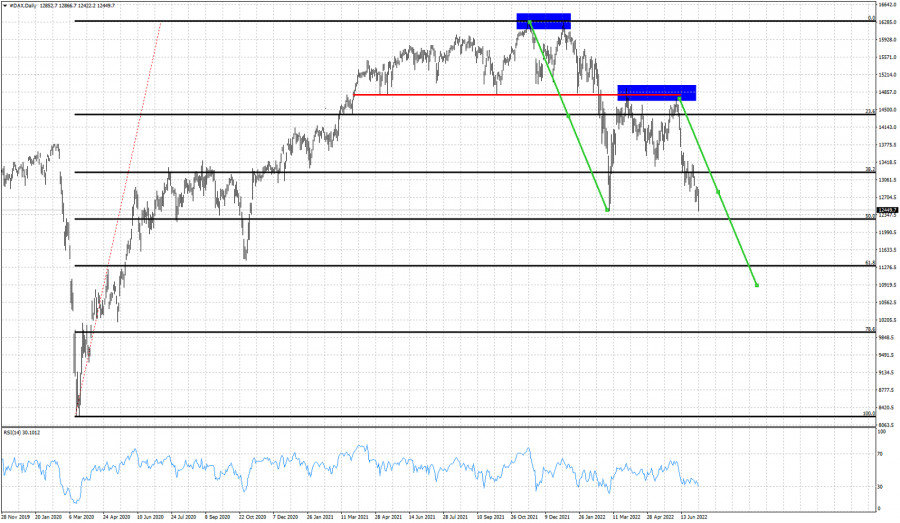
| Posted: 05 Jul 2022 06:22 AM PDT
Green lines- expected size of decline Black lines- Fibonacci retracements Blue rectangles- lower highs Red line- neckline resistance (once support) German Dax index is trading around 12,455 very close to the March 2022 lows. At 12,250 we also find the 50% Fibonacci retracement of the entire rise from 2020 lows so expect to find bulls defending this area. Failure to keep price above this Fibonacci level, will increase chances for a move lower towards 11,300. DAX remains in a bearish trend making lower lows and lower lows. We mentioned in previous posts that the rejection at the neckline resistance was the major sell signal and price is now moving according to our expectations in order to reach the 61.8% retracement target. The material has been provided by InstaForex Company - www.instaforex.com |
| New 2022 highs for the Dollar Index. Posted: 05 Jul 2022 06:16 AM PDT
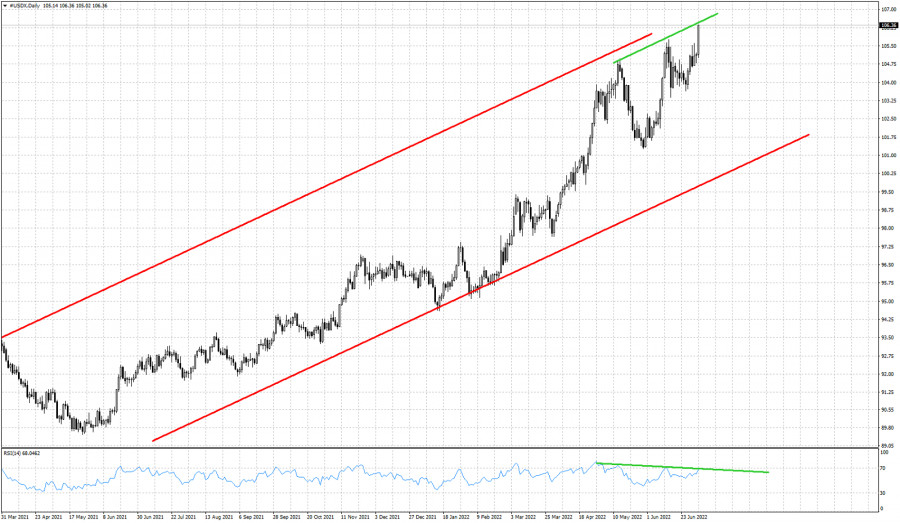
Red lines- bullish long-term channel Green lines- bearish RSI divergence With EURUSD, the major component of the Dollar index, making new 2022 lows, the Dollar index is pushing also to new 2022 highs towards 106.50. Trend remains bullish. Price remains inside the long-term bullish channel. So far there is no sign of stopping this up trend. But there are signs of a weakening up trend. The RSI is not making new higher highs, it is making lower highs. This bearish divergence should not be ignored. It is an important warning. Price has resistance at 106.50 area. Support is at 104. Bulls need to defend this in case of a pull back. A break below 104 could signal the start of a bigger pull back towards 101-100. The material has been provided by InstaForex Company - www.instaforex.com |
| Asian markets advance on Tuesday Posted: 05 Jul 2022 05:46 AM PDT
Asian markets largely finished Tuesday in positive territory, with most indexes posting gains. The S&P/ASX 200 added 0.57%, while the KOSPI rose by 1.52%. The Shenzhen Composite increased by 0.75%, the Nikkei 225 gained 0.95%, and the Hang Seng Index advanced by 0.69%. The Shanghai Composite decreased by 0.11%. US President Biden plans to roll back some tariffs on Chinese consumer goods as early as this week. Furthermore, the Biden administration plans to allow companies importing goods from China to request exemptions for import duties. These planned measures have boosted optimism of investors. Market players also analyzed the latest statistical data from South Korea. In June, consumer prices increased by 6% year-over-year, up from 5.4% in May. Inflation in South Korea reached the highest level in 24 years, when it jumped by 6.8%. Consumer prices have also reached a 4-year high in the Philippines. South Korea's central bank is now expected to increase interest rates by 50 basis points this month. The regulator has hiked the rate 5 times to 1.75% over the past year. Shares of LG Electronics, Inc. and Samsung Electronics, Co. rose by 5.4% and 0.5% respectively. In Australia, the central bank hiked interest rates to 1.35% from 0.85% for the third month in a row. In May, the regulator increased the interest rate by 25 bps, which was followed by a 50 bps hike in June. Inflation in Australia is expected to reach 7% this year, and bringing it under control could take years, analysts say. The best-performing Australian stocks were Regis Resources, Ltd. (+10%) and Polynovo, Ltd. (+9%). Shares of BUBS Australia, Ltd. advanced by 3.2% after the company announced plans to issue shares worth $43.2 million to accelerate growth. In China, services PMI rose to 54.5 in June compared to 41.1 in May thanks to easing of quarantine restrictions in the country. The index reached its highest reading since July 2021. A reading above 50 indicates expansion in the services sector. On the Hang Seng Index, Wuxi Biologics (Cayman), Inc. jumped by 8% following reports that the company could be potentially removed from the US red-flag export list. Yeahka, Ltd. slumped by 15.5% after the company announced it would issue $70 million worth of convertible bonds. On the Nikkei 225, the biggest gainers were Pacific Metals Co., Ltd. (+5.5%), M3, Inc. (+4%), and Fast Retailing Co., Ltd. (+3.7%). Shares of Kusuri No Aoki Holdings, Co. fell by 9% after the company reported that its full-year net profit fell by 18.4% in fiscal year 2021. The material has been provided by InstaForex Company - www.instaforex.com |
| Forecast for EUR/USD on July 5. The euro collapsed catastrophically. Posted: 05 Jul 2022 05:15 AM PDT
On Monday, the EUR/USD pair traded near the corrective level of 200% (1.0430). It appeared that the European currency would not be able to continue its downward trend this week, as indicated by the senior charts. Monday in the United States was also a holiday (Independence Day). On Tuesday, however, traders anticipated a straightforward surprise. The European currency fell sharply in the morning and dropped 140 pips over two hours. The only background information available was the June business activity index in the service sector. And it must be addressed in greater detail for it to be understood that it has nothing to do with the euro's fall into the abyss. The preliminary and final values of the business activity index are published each month. Typically, the final one coincides exactly with the preliminary one, so traders should generally react to the preliminary one. This time it was the same. After a value of 56.1 in May, the indicator was 53 in June. The initial index value was 52.8. Thus, the final value, which was released this morning, was slightly better than the preliminary one. If the euro currency had reacted to this report, it should have been with growth, not a decline. However, even if you close your eyes right now, the euro's decline began one hour before the release of the PMI index. Therefore, I believe there is no connection between this index and the euro's demise. It turns out that traders waited several weeks before resuming mass sales of the euro in the most unexpected manner possible. Even when examining the 4-hour chart, nothing out of the ordinary occurred. The decline began well before today, and the prevailing sentiment among investors remains "bearish." Thus, the most surprising aspect of the euro's decline today was no significant background information.
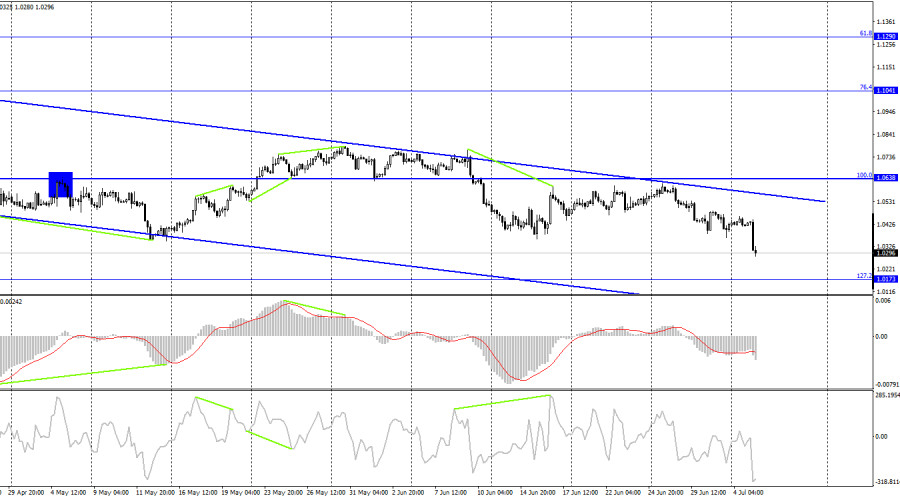
On the 4-hour chart, the pair reversed in favor of the US dollar and continues to fall towards the correction level of 127.2% (1.0173). Fixing the pair's rate above the downward trend corridor, which continues to characterize traders' "bearish" sentiment, will allow us to count on the euro currency's growth in the direction of the corrective level of 76.4% (1.1041). There are currently no maturing divergences observed in any indicator. Report on Commitments of Traders (COT):
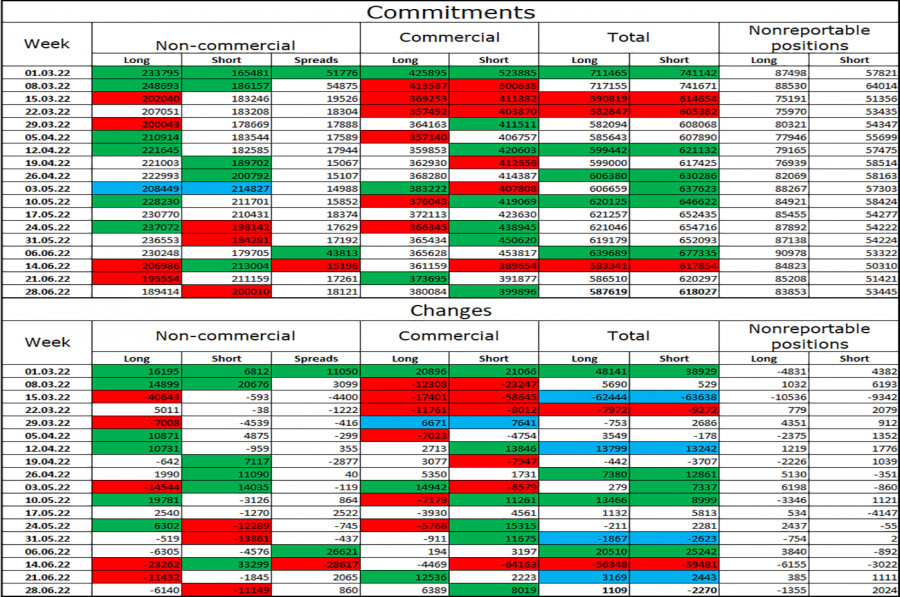
Speculators closed 6,140 long contracts and 11,149 short contracts during the previous reporting week. It indicates that the "bearish" sentiment of the major market participants has weakened slightly but remains "bearish." The total number of long contracts held by speculators is 189 thousand, and the number of short contracts is 200 thousand. The difference between these figures is very small, but it is not in favor of the bulls. Most "non-commercial" traders have recently maintained a "bullish" outlook on the euro, which has not helped the euro currency. Recent COT reports indicate that new sales of the EU currency may follow, as speculators' sentiment has shifted from "bullish" to "bearish" over the past few weeks. The Fed and the ECB have not provided positive updates regarding the euro. News calendar for the United States and Europe: EU - Index of service sector business activity (08:00 UTC). On July 5, the economic event calendars of the European Union and the United States are nearly empty. I have previously stated that the index of business activity in the service sector could not have precipitated a 140-pip decline in the euro. There are no other noteworthy events scheduled for today. Therefore, the information context's effect on traders' sentiment will be absent. EUR/USD forecast and trader recommendations: I suggested selling the pair on the hourly chart when it anchored below 1.0430 with a target of 1.0315. This threshold has been attained. New sales – under 1.0315 at the close, with a target of 1.0196. On a 4-hour chart, I advise buying the euro when the price is above the corridor with a target of 1.1041. The material has been provided by InstaForex Company - www.instaforex.com |
| Forecast for GBP/USD on July 5. The holidays are over Posted: 05 Jul 2022 05:15 AM PDT
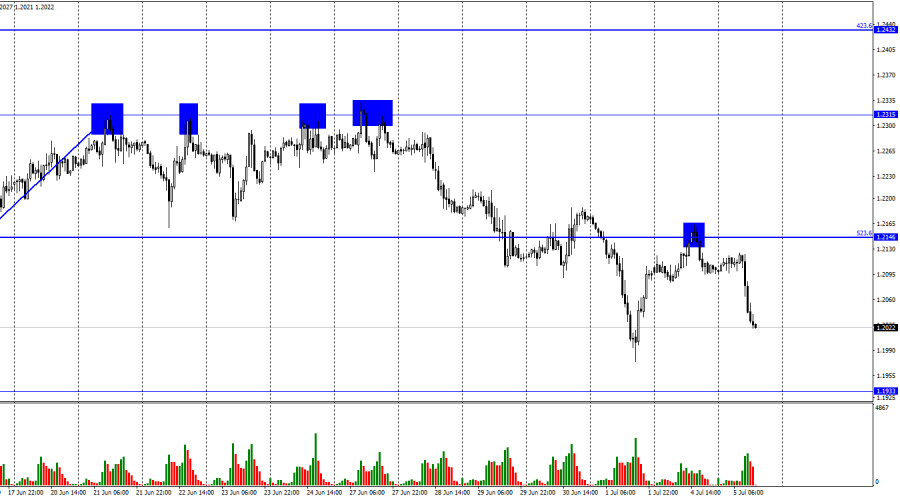
According to the hourly chart, the GBP/USD pair increased to the corrective level of 523.6%-1.2146 on Monday, followed by a rebound and reversal in favor of the US dollar. Already today, a significant decline has begun in the direction of 1.1933. As I stated in the euro/dollar analysis, the business activity index could not have affected the sentiment of traders to the extent that the pair dropped 140 pips in two hours. The same can be said for the pound dollar. The final value of the PMI business activity index for the service sector in the United Kingdom for June has also been revealed today; it was higher than the preliminary figure. In this instance, the dollar should have been sinking, not increasing. After realizing this, it becomes clear that European and American statistics have little to do with this morning's foreign exchange market decline. It turns out that the dollar's strong appreciation began for very different reasons. Who are they? Yes, the most basic ones. Examine the 4-hour or daily charts, and everything will become evident. The negative trend has persisted for a long time; in recent weeks, the British and Europeans have attempted to reverse this tendency, but they have failed again. Thus, after a brief break, traders resumed the operations that had generated profits in recent months: selling the euro and the pound. It is the complete explanation. I expected the significant action to repeat closer to the end of the week when crucial nonfarm payrolls and unemployment rates would be reported in the United States, but most traders made their own decisions. Moreover, it is also probable that we are currently observing a reaction to the upcoming payroll report. There is a chance that this report will be positive, so dollar purchases are rational now. However, such activities by speculators are difficult to predict.
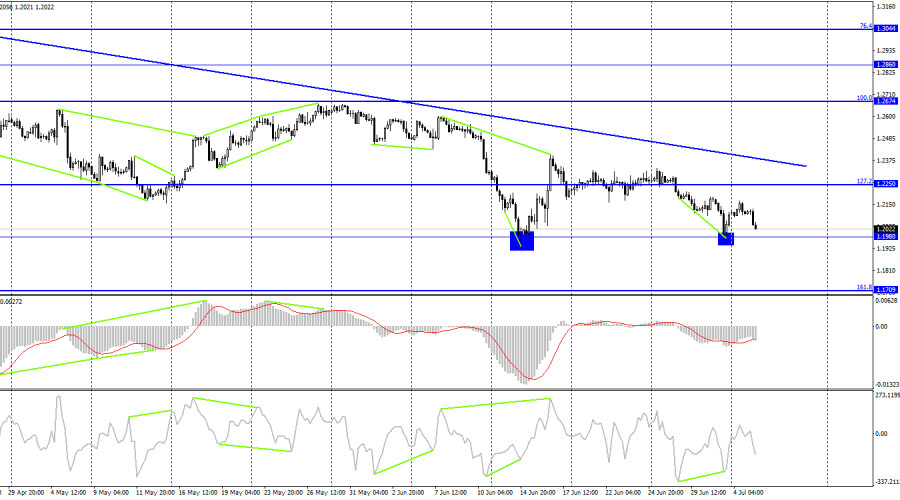
On the 4-hour chart, the pair executed a new reversal in favor of the US dollar and is returning to the 1.1980 level. The comeback of quotes from the level of 1.1980 will benefit the British pound and signal the start of a new upward trend toward the corrective level of 127.2%-1.2250. Fixing the pair's exchange rate below 1.1980 will increase the likelihood of a further decline in the direction of the next Fibonacci level of 161.8% (1.1709). Today, no indicator has any divergences in the works. Report on Commitments of Traders (COT):
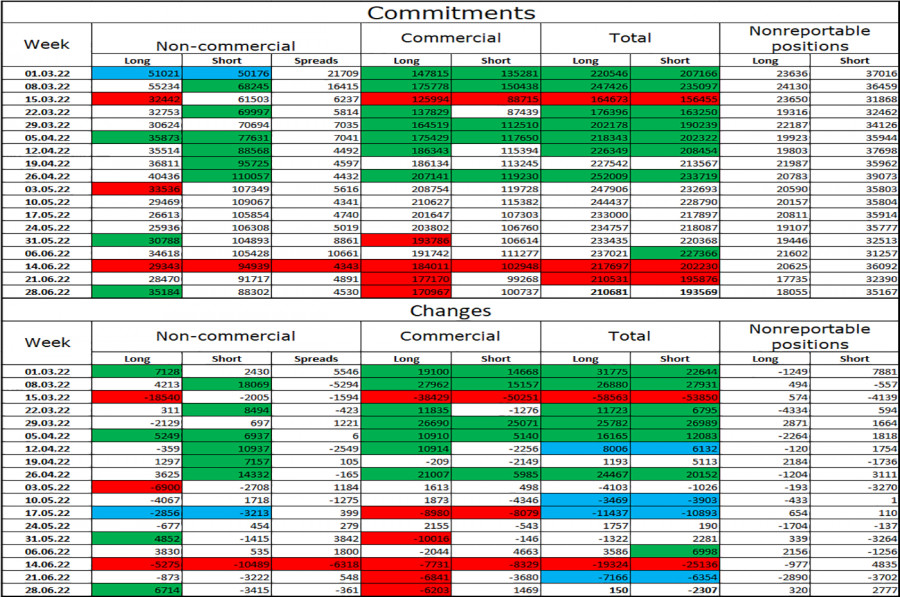
Over the past week, the sentiment of "Non-commercial" traders has become slightly more "bullish." The number of long contracts held by speculators climbed by 6,714, while the number of short futures declined by 3,415. Thus, the general sentiment of the key participants remained unchanged at "bearish," and the number of long contracts continues to outnumber short contracts by a factor of three. Most major players continue to shed pounds, and their mood has not changed significantly recently. Consequently, I believe the British pound could continue to drop over the next few weeks. A significant disparity between the number of long and short contracts may signal a trend reversal, but the context of the information is currently of greater importance to key players. And it continues to be against the pound. To date, it makes no sense to dispute that speculators sell more than they purchase. News calendar for the United States and the United Kingdom: UK - index of service sector business activity (08:30 UTC). Tuesday is a nearly vacant day for economic events in the United Kingdom and the United States. One report has already been released in the United Kingdom, and nothing else. Thus, the information background will not affect the sentiment of traders today. However, the British do not require this influence now. GBP/USD prediction and trader recommendations: On the hourly chart, I suggested selling the British pound when it rebounded from the level of 523.6% (1.2146) with a goal of 1.1933. I recommend purchasing the British pound when the price closes above the trend line on the 4-hour chart with a target of 1.2674. The material has been provided by InstaForex Company - www.instaforex.com |
| American premarket on July 5: the risk of another collapse of the US stock market is real Posted: 05 Jul 2022 05:06 AM PDT Futures for US stock indices declined at auction on Tuesday, following another week of losses. Futures on the Dow Jones Industrial Average decreased 118 points or 0.38 percent. S&P 500 futures also declined 0.39 percent , and Nasdaq 100 futures fell 0.46 percent. The prospect of a recession and worries about economic growth continue to place investors under intense pressure. After a dismal first half of the year, there were hopes for a resurgence in business, but there is little reason to be optimistic. Yesterday, US Treasury Secretary Janet Yellen and Chinese Vice Premier Liu He held virtual discussions on various macroeconomic problems, but this had no beneficial effect on investors. Rising interest rates and the anticipation of relatively gloomy second-quarter reports from many firms only exacerbate the problem.
After last week, the Dow was down 1.3%, the S&P 500 was down 2.2%, and the Nasdaq was down 4.1%. The June employment data for the United States will be revealed this week. According to experts' projections, job growth would stall in June, resulting in an even steeper decline in the indices. The experts expect the unemployment rate to continue at 3.6%, but the number of new jobs will drop significantly compared to May. Let me remind you that Jerome Powell, the chairman of the Federal Reserve, has been paying close attention to the solid labor market, which continues to promote price increases and accelerate inflation. Powell stated that it seemed appropriate to slightly chill the labor market by raising interest rates, which inevitably results in a rise in the cost of borrowing, particularly for enterprises that are recruiting new staff. This week will also see the publication of the Federal Reserve's June meeting minutes. It is doubtful that we will get any new knowledge from it. Thus this occurrence will be regarded as regular. As for the S&P 500's technical picture The bears took a little halt on Friday, but this does not indicate that the worldwide trend has changed. Now, purchasers must overcome the resistance level of $ 3,835. A breach in this range will allow you to escape a new prolonged peak and lead to an active movement of the trading instrument up to the $ 3,867 region, where large sellers will reenter the market. At least some traders will seek to lock in profits on long holdings. The $ 3,905 level is a more distant objective. In the event of pessimism, regular discussion of high inflation and the need to combat it, as well as a harsh rejection of risks, as is presently the situation in the foreign exchange market, the trading instrument will easily retrace to the closest support at $ 3,788. A breakdown of this range will result in a new sale between $ 3,744 and $ 3,704 if no bulls are present. The material has been provided by InstaForex Company - www.instaforex.com |
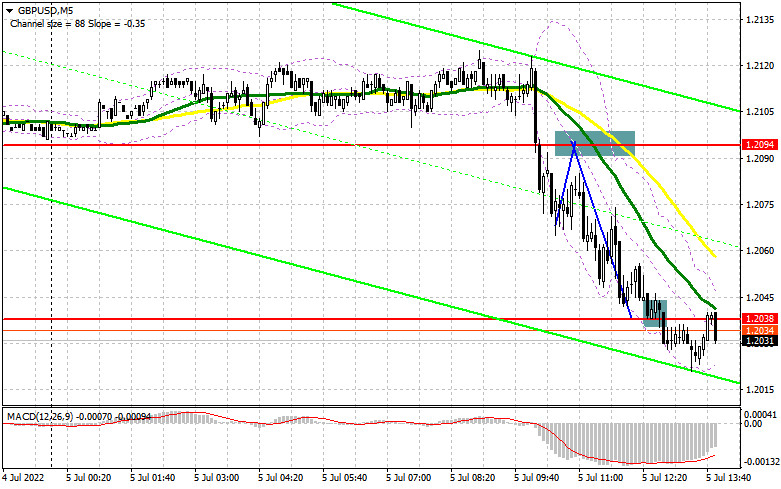
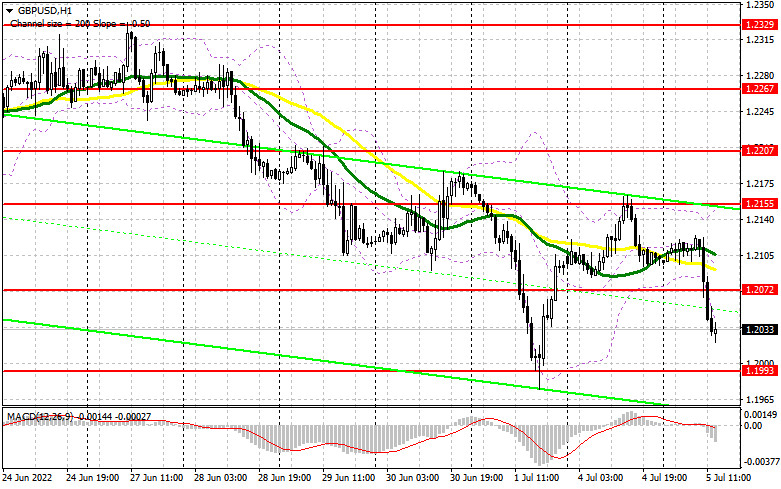
| Posted: 05 Jul 2022 04:31 AM PDT In my morning forecast, I highlighted the level of 1.2094 and advised basing choices on it. Let's examine the 5-minute chart to determine what transpired there. The breach of this range, especially against very satisfactory UK economic data, demonstrates the current pessimism that has permeated the markets due to fears of an oncoming recession. Unfortunately, I did not wait for the 1.2094 reversal test from the bottom up, so short positions were not allowed. The entire technical picture was altered during the day's second portion. And where did the euro enter circulation?
To establish long positions on the GBP/USD, you must: Based on current conditions, purchasers of the British pound have no motive to establish long positions. Moreover, today's statistics demonstrated this; robust data prevented the bulls from remaining above the 21st figure. Reports on the volume of industrial production in the United States are anticipated in the afternoon. Good data will prompt an update of the lows and a test of the new support level at 1.1993. The development of a false collapse will be the first indication to begin long trades to return to the area of 1.2072, where the moving averages favor sellers. It will be possible to discuss the end of the bear market only when buyers reclaim 1.2072. A breakout and a top-down test of this range will generate a buy signal with 1.2155 as the target. A similar breach of this level will result in a second opportunity to enter long positions with the potential to hit 1.2207, where I propose taking profits. If GBP/USD continues to fall, which is more likely, and there are no buyers at 1.1993, it will be impossible to avoid revising the annual lows. I advocate delaying long positions until the next support at 1.1938 is reached. I encourage you to only purchase there on a false decline. It is conceivable to initiate long bets on GBP/USD immediately for a rebound from 1.1876, or even lower – around 1.1816, with the goal of a 30-point-per-day drop. To open short GBP/USD positions, you must have: The bears tried everything in their power to seize control of the market, as seen by the pound's steep decline in the first part of the day despite favorable statistical conditions. In the near future, the shortage of buyers prepared to purchase below 1.2100 is another factor that will intensify the pressure on the British pound. In the event of negative US data, it will be possible to notice a pullback of the pound to the region of 1.2072. The formation of a false breakdown at that level will produce a sell signal in the continuance of a bear market, with the possibility of an update to 1.1993. The consolidation below 1.1993 and the reversal test from the bottom up are heavily influenced by the bulls' stop orders, which provide an extra entry point for selling the pound to bring it down to 1.1938, where I advocate partially fixing profits. A more distant objective will be the region around 1.1876 when the yearly minimum of 1.1816 can be attained. With the possibility of GBP/USD growth and the absence of bears around 1.2072 in the afternoon, we can anticipate 1.2155 as the next point of resistance. A false breakout at this level will provide an excellent entry point for short positions in anticipation of a pair retracement. If there is no trading action at 1.2155, another upward shock may occur against speculative sellers who have canceled their stop orders. In this instance, it is prudent to delay short positions until 1.2207. You can sell GBP/USD immediately for a rebound from 1.2267 if you anticipate a 30-35-point drop within a day.
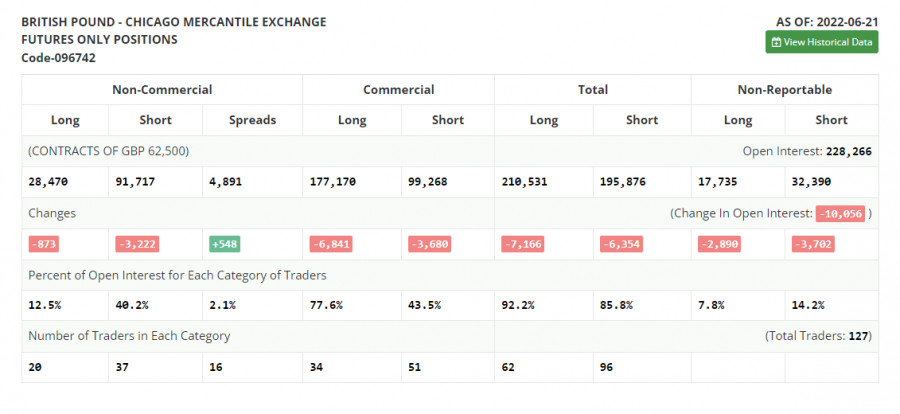
The COT report (Commitment of Traders) for June 21 revealed a decline in both long and short positions, although the fall in short holdings was greater, resulting in a modest decrease in the negative delta. Last week, the Bank of England's stance on monetary policy was validated by inflation data from the United Kingdom. Even according to the official estimates of the regulator, the consumer price index will surpass the mark of 11.0 percent by the end of the year. Thus, the high inflationary spike in May of this year did not come as a surprise to traders. As a result of another collapse of the British pound, the major players took advantage of the situation and boosted their long positions. However, according to the source, fewer people are prepared to sell at present lows, which favors the British pound. No one will likely be startled by the Federal Reserve System's policy and rate of interest rate increases. Thus it is time to consider purchasing cheaper hazardous assets. The COT report reveals that long non-commercial positions declined by only 873 to 28,470, and short non-commercial positions decreased by 3,222 to 91,717. This resulted in a decline from -65,596 to -63,247 in the negative value of the non-commercial net position. The weekly ending price rose to 1.2295 from 1.1991, a gain of 0.5%.
|


| You are subscribed to email updates from Forex analysis review. To stop receiving these emails, you may unsubscribe now. | Email delivery powered by Google |
| Google, 1600 Amphitheatre Parkway, Mountain View, CA 94043, United States | |


Comments