Forex analysis review
Forex analysis review |
- Forecast for EUR/USD on July 15, 2022
- Forecast for GBP/USD on July 15, 2022
- Technical analysis of GBP/USD for July 14, 2022
- Oil price forecast for the second half of 2022
- EUR/USD. Bears are getting bolder: bears have plunged under the parity level again
- Euro choked by Italy
- Technical analysis of EUR/USD for July 14, 2022
- Gold fresh new lows as bulls fail to produce a strong bounce above $1,740.
- Short-term technical analysis on EURUSD for July 14th, 2022.
- Ethereum's big test at $1,280 is approaching.
- Short-term technical analysis on AUDUSD for July 14, 2022.
- Bulls remain in control of the trend in USDJPY.
- USD/JPY retests buyers from around 138.60 support
- EUR/USD: Euro breaks $1
- EUR/USD: more declines possible
- GBP/USD analysis on July 14. The pound falls into the abyss
- XAU/USD Technical Analysis and Trading Tips for July 14, 2022
- XAU/USD: inflation has accelerated, but gold continues to fall in price
- EUR/USD analysis on July 14. Inflation in the US has increased, and the euro currency is falling again.
- Trading Signal for USD/JPY for July 14 - 15, 2022: sell below 139.06 (+1/8 Murray)
- Forecast for EUR/USD on July 14. The euro currency has fooled traders
- Forecast for GBP/USD on July 14. The pound does not notice the departure of Boris Johnson.
- Trading Signal for Gold (XAU/USD) for July 14 - 15, 2022: key level $1,700
- US Premarket on July 14: JPMorgan report puts pressure on the US stock market
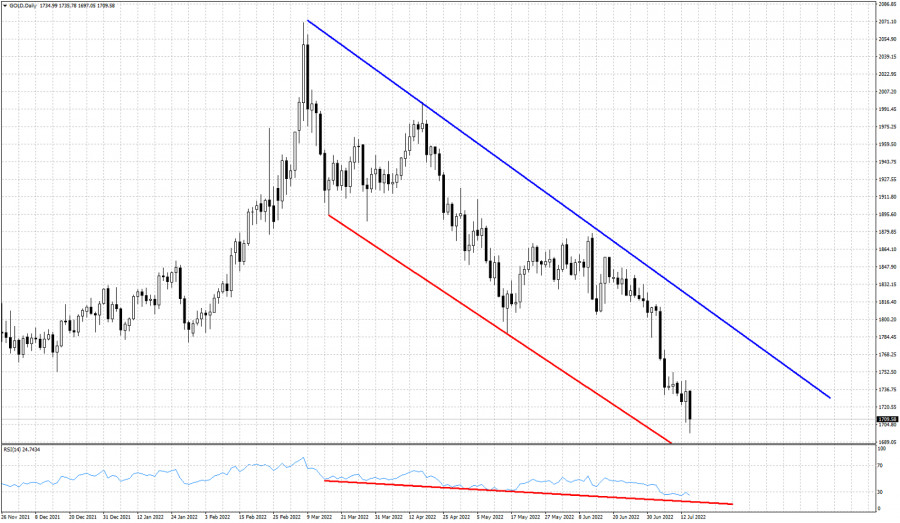
- Technical analysis of gold and platinum
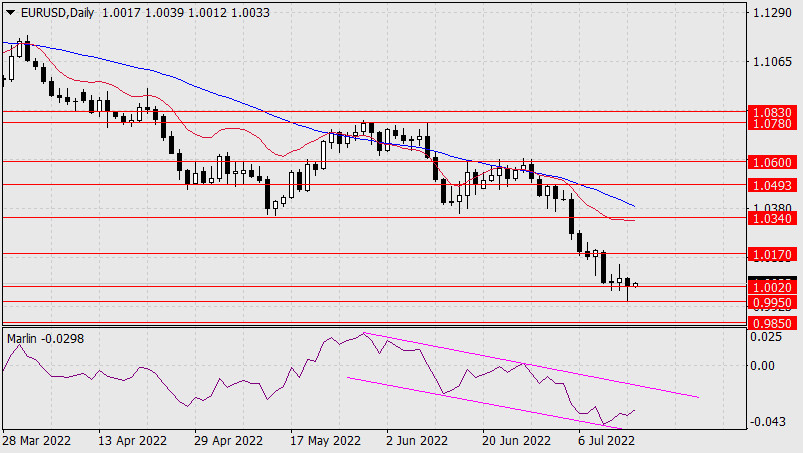
| Forecast for EUR/USD on July 15, 2022 Posted: 14 Jul 2022 08:00 PM PDT Yesterday, the euro fulfilled its task - it reached the target support of 0.9950. But the price did not settle under 1.0020 on a daily scale. The signal line of the Marlin Oscillator, having turned up from the lower border of its own descending channel, continues to grow.
Tension is being created on the market, which may turn into a corrective growth up to 1.0170. Visually, at this moment, the oscillator line will touch the upper border of the channel. If the movement of the price and the oscillator are synchronized by that moment, we expect a reversal into a new downward wave from 1.0170. If the price can overcome the support at 0.9950 immediately, then the next target will be the level of 0.9850.
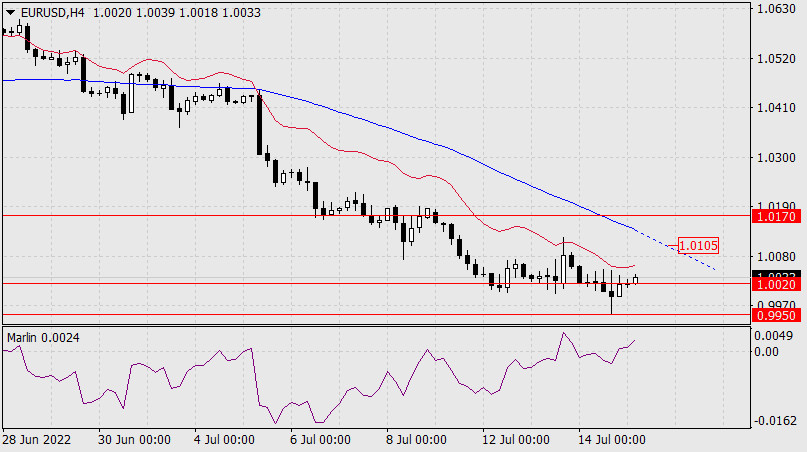
The H4 chart also shows the tension and ambiguity of the situation. The Marlin Oscillator took a neutral state near the zero line, the price returned to the consolidation range on the 12th-14th. It is possible that a full-fledged correction will not take place, the growth can be stopped by the MACD indicator line (1.0105), then the price stop at 1.0020 will continue in the form of a normal consolidation. In this situation, it is advisable to wait a bit, perhaps wait out the correction in order to resume short positions with less risk. The material has been provided by InstaForex Company - www.instaforex.com |
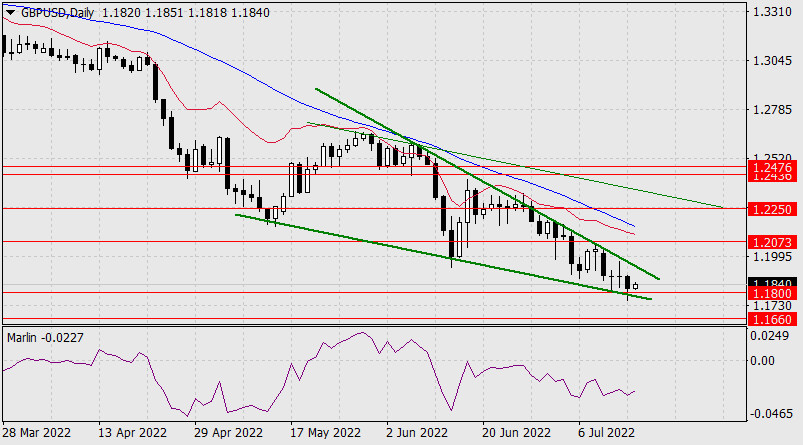
| Forecast for GBP/USD on July 15, 2022 Posted: 14 Jul 2022 08:00 PM PDT Yesterday, the pound made an attempt to overcome the strong support formed by the lower border of the falling wedge on the daily chart and the target level of 1.1800. The first attempt failed, today may be the second.
If there is no second attempt today, or on Monday, then, due to the ending wedge, the price may exit it upwards, into a correction, reach the target level of 1.2073 or even 1.2250, and transform the wedge into a regular downward channel, and a wide one at that. The Marlin Oscillator is in a neutral position, waiting for a signal from the price.
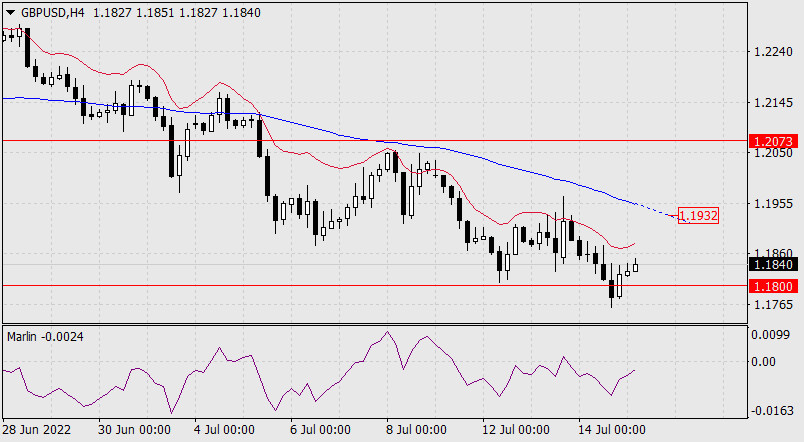
On the four-hour chart, the Marlin Oscillator is already showing the intention to go into the positive area. This will give the price an incentive to attack the MACD line (1.1932), and consolidating above it will prolong the growth to 1.2073. The material has been provided by InstaForex Company - www.instaforex.com |
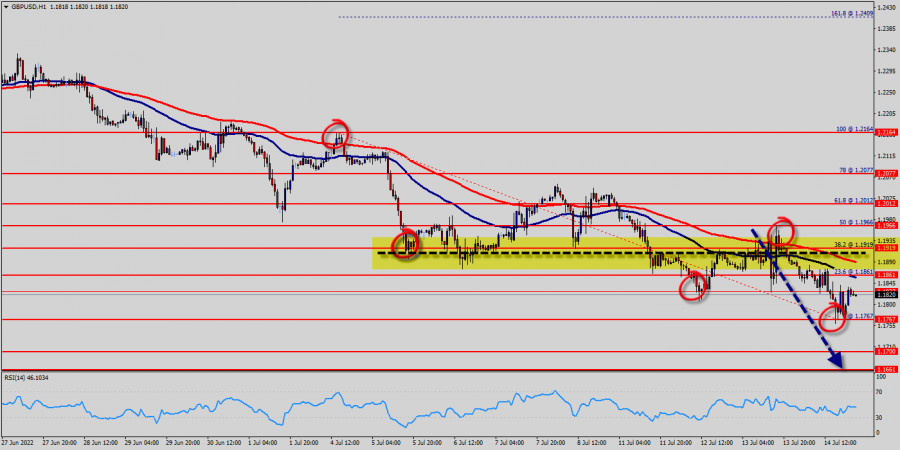
| Technical analysis of GBP/USD for July 14, 2022 Posted: 14 Jul 2022 02:56 PM PDT
The GBP/USD pair dropped from the level of 1.1966 to the bottom around 1.1767. But the pair has rebounded from the bottom of 1.1767 to close at 1.1820. Today, the first support level is seen at 1.1767, and the price is moving in a bearish channel now. Furthermore, the price as been set below the strong resistance at the level of 1.1966 , which coincides with the 50% Fibonacci retracement level. This resistance has been rejected several times confirming the downtrend. Additionally, the RSI starts signaling a downward trend. As a result, if the GBP/USD pair is able to break out the first support at 1.1767, the market will decline further to 1.1700 in order to test the weekly support 2. The pair will probably go down because the downtrend is still strong. Consequently, the market is likely to show signs of a bearish trend. The strong resistance is seen at the level of 1.1861 because it represents the weekly resistance 1. Equally important, the RSI and the moving average (100) are still calling for a downtrend. Therefore, the market indicates a bearish opportunity at the level of 1.1861 in the H1 chart. So, it will be good to sell below the level of 1.1861 with the first target at 1.1767 and further to 1.1700. At the same time, the breakup of 1.1966 will allow the pair to go further up to the levels of 1.2077 in order to retest the weekly resistance 2. Always rememebr that the market analysis posted here is meant to increase your awareness, but not to give instructions to make a trade. Forecast (GBP/USD) : The volatility is very high for that the GBP/USD is still moving between 1.1861 and 1.1700 in coming hours. Consequently, the market is likely to show signs of a bearish trend again. Hence, it will be good to sell below the level of 1.1861 with the first target at 1.1767 and further to 1.1700 in order to test the daily support 2. However, if the GBP/USD is able to break out the daily support at 1.1966, the market will rise further to 1.2077 to approach support 2 next week. The material has been provided by InstaForex Company - www.instaforex.com |
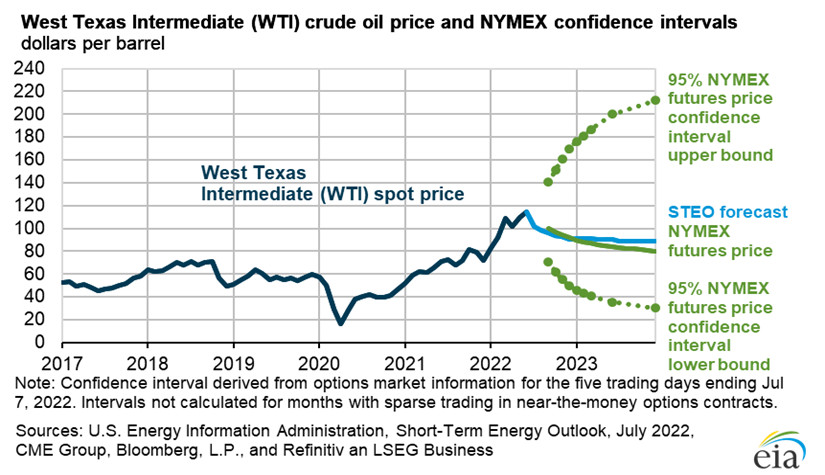
| Oil price forecast for the second half of 2022 Posted: 14 Jul 2022 02:48 PM PDT Hello, dear colleagues! The main event that has occurred in recent days has been the parity of the euro and the dollar. However, for those who constantly monitor financial markets, this event is not news. Parity has been talked about for quite a long time, and those traders who know at least a little about fundamental and technical analysis have managed to make good money on this, with which I cordially congratulate them. A much more difficult puzzle for traders is the dynamics of oil prices, and it is the prospects of the oil market that pose a non-trivial task for us, because the one who solves it will receive fabulous profits, and the loser will pay in full. And this applies not only to you and me, but also to the future of the world order. So, let's try to figure out what is happening with oil and what are its prospects for the second half of the year. According to the latest published forecast from the US Energy Information Agency - US EIA - the most likely event in the near future will be a decline in oil prices (Fig.1), which we have been observing since June in our terminals.
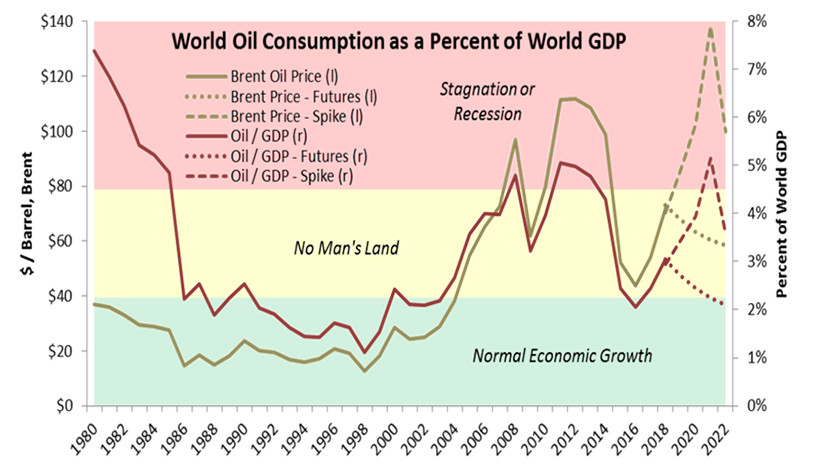
Fig. 1: Forecast of oil price dynamics from US EIA and NYMEX exchange traders The increased uncertainty in the short-term outlook is due to Russia's special military operation in Ukraine and lower-than-expected global energy consumption. Setting the outlook for the trend, the US EIA and NYMEX options traders believe that in the second half of the year the price of oil will be lower than in the first half, averaging $104 per barrel of Brent this year and $94 per barrel in the future. It is also expected that this year the world oil consumption will increase by 2.2 million barrels, reaching the level of 101.6 million barrels per day. At the same time, the production of OPEC countries and the United States will continue to increase, which in the third and fourth quarters of this year will lead to an oil surplus in the market of 1.59 and 0.84 million barrels. At the same time, in the first quarter of 2023, the markets will again experience a daily deficit of 600,000 barrels. If we take this forecast as a baseline, then in this case, nothing special threatens oil prices. However, there are a number of risks that could lead to a more significant drop in prices, and the main reason is a sharp decline in the global economy. There is a direct relationship between oil consumption and world GDP growth. At the same time, the price of oil above $80 per barrel leads to stagnation and, ultimately, to a recession in the global economy (Fig. 2).
Figure 2: Correlation of oil price with world GDP and periods of economic development As follows from the diagram, from 1980 to 2018, an increase in the price of oil above $80 led to a recession in the global economy after some time. However, in fairness, it should be noted that there were only two such periods, in 2008 and 2012, so this is not a sufficient statistical sample. Among other things, it should be taken into account that from 1990 to 2022 the world economy was the economy of the dollar, and the fall in the price of oil to $20 per barrel was one of the reasons that destroyed the USSR. Without going deep into geopolitics, why not assume that the rise in the price of oil above the level of 80 for just a couple of years will be one of the reasons that destroy the Anglo-Saxon world domination? Nothing good awaits the global economy and the dollar as a reserve currency even if the baseline forecast from the US EIA is realized, according to which the price of Brent oil in 2023 will be $94 per barrel. Perhaps that is why the G7 countries are so concerned about setting marginal prices for Russian oil? After all, for further economic growth and curbing inflation, they desperately need oil at $80 and below. By the way, the countries that are members of the International Energy Agency, which unites the main consumers of oil, liked the idea of limiting the marginal price of Russian oil so much that they wanted to lower the price of refined products as well. The essence of the idea of limiting the marginal price is to buy Russian oil no more than $60 per barrel, and to impose secondary sanctions against those who buy at higher prices. Since, according to American officials, the idea of once again throwing Russia on the dough should appeal to everyone, US Treasurer Janette Yellen rushed to India to persuade the third economy of the world and threaten it with a bony fist, offering various buns in case of joining the agreement. Russia, as usual, forgot to ask at the same time, and not only Russia. The Bank of India signed an order to use the rupee as the currency of international settlements, and this is where the fun begins. According to the budget rule adopted by the Ministry of Finance of the Russian Federation until 2020, the revenue cut-off price was $40 per barrel. This means that if the price of oil is $60 per barrel, it will bring excess profits to the country's budget. Thus, India and China, within the framework of trade in national currencies, will trade for a joint benefit at 60, and the US, EU countries and Japan will buy oil at 100 and above. It may be objected that the rupee is a very bad non-reserve currency, but it is not. The rupee allows you to buy consumer goods, including pharmaceuticals, and its volatility over the past year was significantly lower than that of the euro. The euro fell against the dollar by 19%, in turn, the rupee fell by only 7%. The Japanese yen fell by 35%, while the Chinese yuan also fell by only 7%. Moreover, unlike the euro, Russia can spend rupees and yuan. Summing up this analysis, we can assume with a high degree of certainty that in the second half of the year oil prices will undergo some decline, for example, in the range of 85-100, where they will remain until the market finds a new equilibrium point or finds growth drivers or decline. Among the positive factors are the growth of the world economy, primarily due to Asian countries, which will be supported by relatively cheap energy resources from Russia. Of the negative factors, the price will be pressured by the resumption of Covid-19 lockdowns and the rapid growth of the US recession. At the same time, by the end of the year, amid a future shortage, oil may start a new wave of growth. Despite the local decline, oil is still in an upward trend, and may again return above $100 per barrel. Be careful and cautious, follow the rules of money management. The material has been provided by InstaForex Company - www.instaforex.com |
| EUR/USD. Bears are getting bolder: bears have plunged under the parity level again Posted: 14 Jul 2022 02:48 PM PDT The euro-dollar pair tested the area of the 99th figure again on Thursday, plunging under the parity level. Wednesday's upward pullback, which we observed after the release of data on the growth of US inflation, ended just after it began. The inflation report was completely on the side of the greenback, so there were no grounds for a correction or (especially) a trend reversal. The sharp rebound in the price could only be explained by the level of parity, which is a "red line" for many traders: they do not risk holding short positions below the 1.0000 mark.
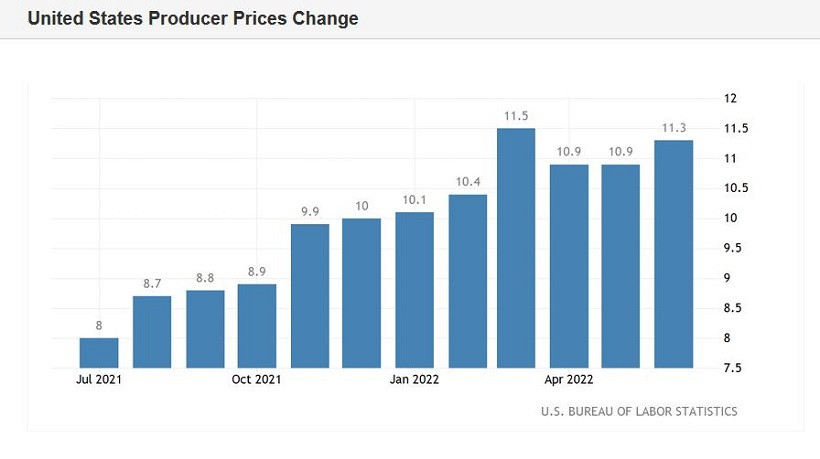
Nevertheless, the downward trend is in full swing. Judging by Thursday's price dynamics, market participants are gradually getting used to the new realities when the dollar is more expensive than the euro. Therefore, they are already acting much bolder, probing the price territory, which has been "uninhabited" for almost 20 years. In general, there was no doubt that traders would test the parity zone again: the only question is how far the EUR/USD bears will move away from the 1.0000 mark and whether they will be able to settle in the area of the 99th figure in order to claim more ambitious goals. The formal reason for the next downward momentum of EUR/USD was the data report on the growth of the producer price index in the United States. As you know, this indicator is an early signal of changes in inflationary trends (or their confirmation). The release was a good addition to the consumer price index published on Wednesday. Like the CPI growth report, the figures also came out in the green zone. On a monthly basis, the indicator was at 1.1%, with a forecast decline to 0.8%. In annual terms, the index reached 11.3% (with a forecast of growth up to 10.7%). In other words, the producer price index supplemented the fundamental picture positive for the greenback, reinforcing the already strong hawkish expectations regarding the Federal Reserve's next steps. So, according to CME data, traders estimate the probability of the Fed raising the interest rate by 100 basis points at the July meeting at 85%. Let me remind you that a few weeks ago, Fed Chairman Jerome Powell stated that the members of the central bank would choose between a 50-point and 75-point hike. At the moment, the question is no longer this way: traders are almost certain that the US central bank will have to resort to more aggressive counteraction measures: +100 points in July and +75 points in September.
And although such strong hawkish expectations are fraught with negative consequences for the dollar (if the Fed does not live up to its expectations), the greenback is in high demand on Thursday due to the trading principle "buy on rumors...". Moreover, talk of a 100-point rate hike is taking place amid the phlegmatic position of the ECB, which still cannot decide whether it should raise the rate by 50 basis points in July or limit itself to a 25-point increase? The US dollar is strengthening its position due to the strengthening of anti-risk sentiment in the market. Key Wall Street indices are trading deep in the red today, reflecting the flight from risks. Geopolitical tensions, the energy crisis, high inflation and the risk of a global recession – all these factors increase the demand for a safe dollar. By the way, the price of Brent crude oil has dropped to $94 per barrel. The fall in the price of oil is associated with the expectation of the onset of the global economic crisis. Meanwhile, in Europe, the price of gas is rising again in the face of news about an accident at a field in Norway and the shutdown of the Russian Nord Stream gas pipeline for repairs. On Wednesday, the nearest (August) TTF futures on the ICE Futures exchange jumped to 1909 dollars per thousand cubic meters. Thus, the prevailing fundamental background contributes to a further decline in the price of EUR/USD. But on the other hand, we see that traders still do not risk staying below the parity level for a long time. The "scouts" gradually go deeper into the area of the 99th figure, but then they still come back. This suggests that the downward targets still need to be placed above the 1.0000 mark, and short positions should be opened on corrective rollbacks to the 1.0100 target. Despite the strength of dollar bulls, traders prefer to take profits under the parity level. Therefore, it is advisable to use corrective waves here to open short positions as far as possible from the key mark of 1.0000. Downward targets can be located at 1.0050, 1.0000. The material has been provided by InstaForex Company - www.instaforex.com |
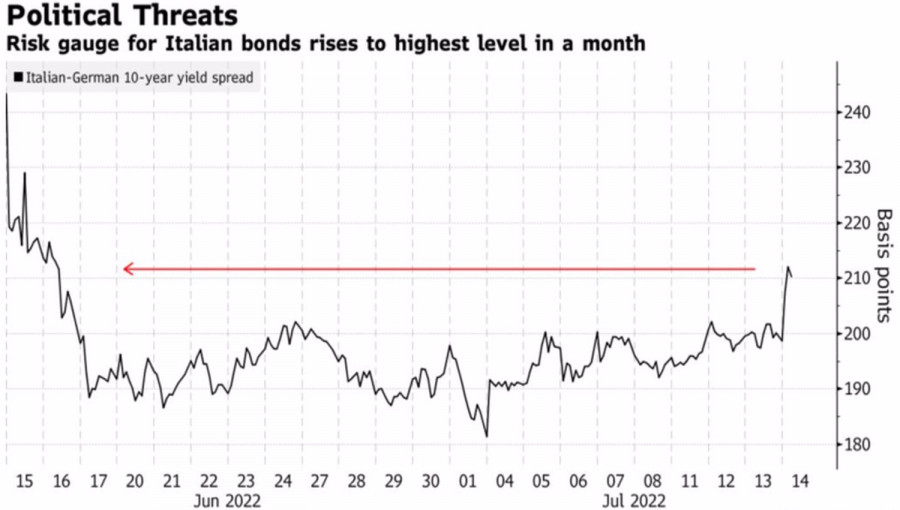
| Posted: 14 Jul 2022 02:47 PM PDT Trouble doesn't come alone. In addition to the energy crisis, increased risks of a eurozone recession, and an increase in the number of COVID-19 infected in the eurozone, another problem has been added for EURUSD bulls. Another political crisis may break out in Italy, which will become another headache for the European Central Bank in the decision-making process on the speed of raising the deposit rate. The third economy of Europe, even at the time of the creation of the currency bloc, caused fears in Germany. A debt-ridden country could become the destroyer of an entire community that had to live by its own rules. Too tough for Rome. A lot of water has flowed since then. In Italy, ten prime ministers and 14 governments have been replaced. It would seem that the coming to power of ex-ECB head Mario Draghi, before whom the whole of Europe bowed its head, was supposed to stabilize the situation. So it was at first. Nevertheless, as soon as the main coalition partner, the Five Star Party, refused to support the prime minister's proposal to provide subsidies to enterprises affected by rising energy prices, Draghi's fate hung in the balance. He threatens his resignation, which causes a wave of panic in the financial markets. The yield spread of 10-year Italian and German bonds, a key indicator of political risk in Europe, is soaring up, which in the past had a negative impact on EURUSD. Dynamics of the Italian and German bond yield differential
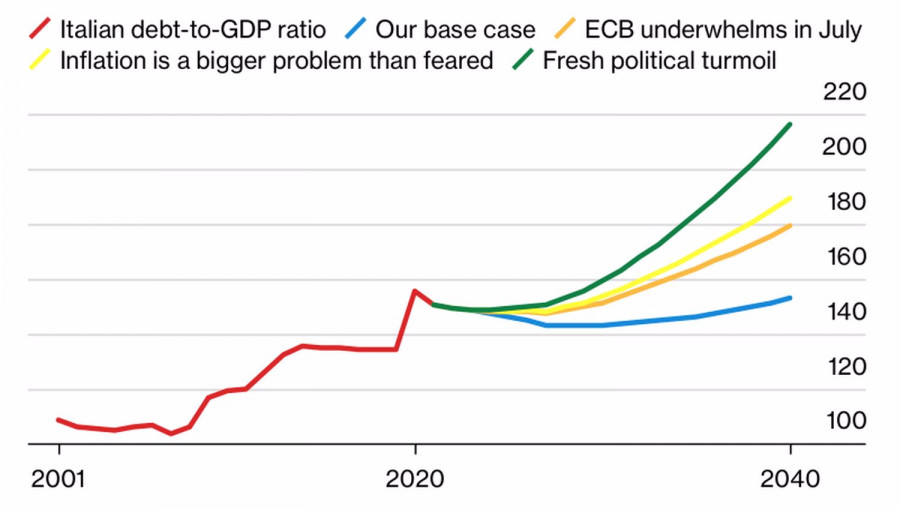
Naturally, the ECB should intervene. But if it fails to cope with the task of closing spreads or goes too far with a rate hike, or a political crisis breaks out in Italy, including early parliamentary elections, the euro will continue its protracted peak against the US dollar. In fact, the regional currency faced all the problems at once, including the devaluation of 1999, the financial crisis of 2008, Greece's intention to withdraw from the eurozone and the pandemic of 2020. Should we be surprised by the collapse of EURUSD? Especially since the US dollar, with its aggressively anti-inflation Federal Reserve, is so strong. Scenarios for the growth of Italian public debt
It is clear that the weakening of the euro is not at all what the ECB wants to see. Not only does it contribute to the acceleration of inflation due to the rapid rise in import prices, it also aggravates the energy crisis. Enterprises have to pay more for gas, their costs are rising, their incomes are declining.
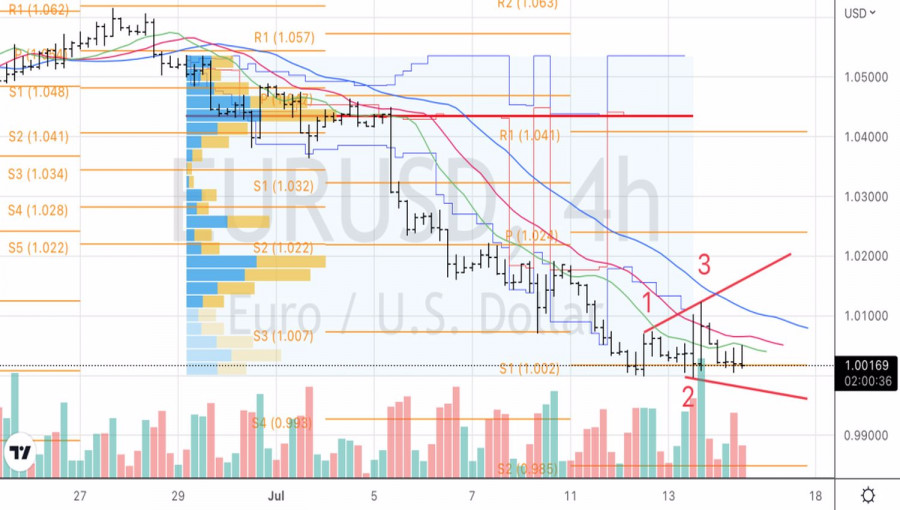
To solve the problem, the central bank has two options: either start raising the deposit rate more aggressively than currently expected, or use foreign exchange interventions. The last time the ECB intervened in the life of Forex was at the end of 2000, when the euro was worth $0.85. Technically, on the 4-hour EURUSD chart, after a clear development of the strategy presented in the previous article, the Expanding Wedge pattern begins to form. A necessary condition is the bears' inability to take quotes below 1 for a long time. We sell on a breakout of 0.9995, when the pair returns to 1.01, we buy. The material has been provided by InstaForex Company - www.instaforex.com |
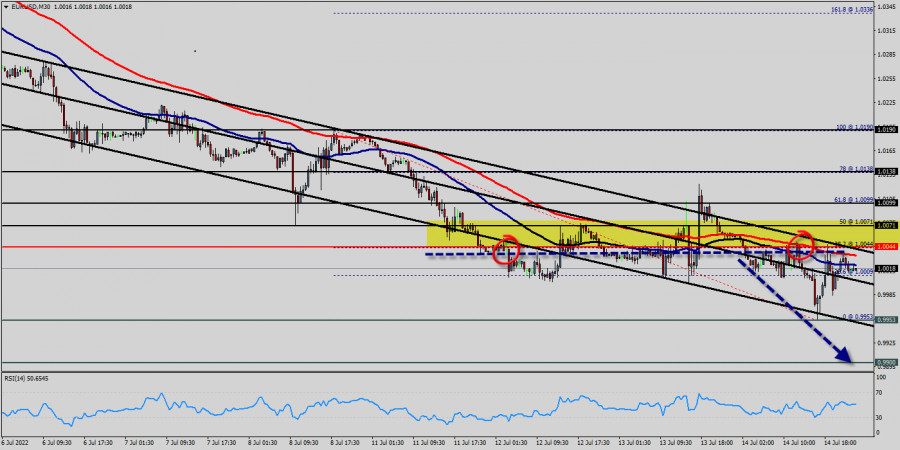
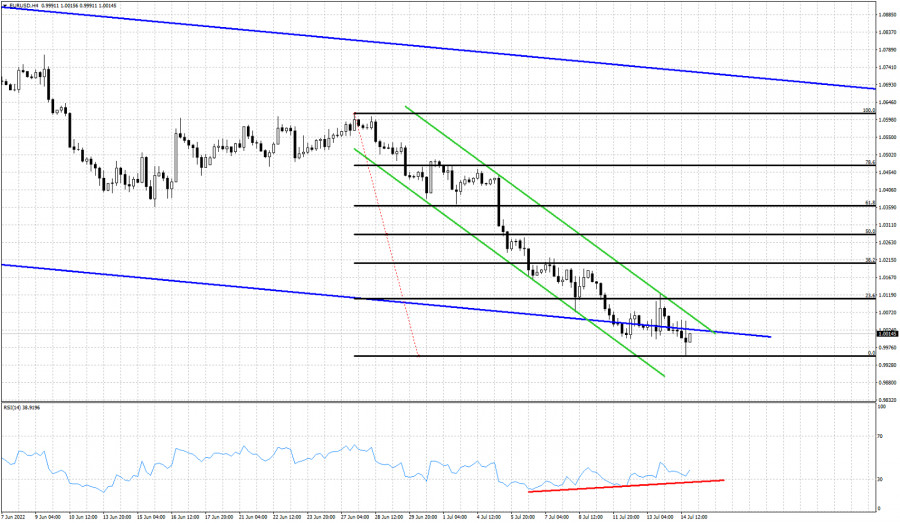
| Technical analysis of EUR/USD for July 14, 2022 Posted: 14 Jul 2022 02:43 PM PDT
Euro parity still in play ahead of decisive US inflation data, for that common currency came within whisker of $1 this week. Right now, the EUR/USD pair is still moving around the price of 1.0000. The currency pair EUR/USD is trading below the resistance levels of 1.0190, 1.0.138, 1.0099 and 1.0071. The euro to US dollar (EUR/USD) rate has fallen about 2% year-to-date to trade around 1.0000. The decline is comparable to losses last seen for 7 years, when the European Central Bank unleashed its massive stimulus programme. The EUR/USD pair continues to move downwards from the level of 1.0099, which represents the double top in the M30 chart. Yesterday, the pair dropped from the level of 1.0099 to the bottom around 0.9953. Today, the first resistance level is seen at 1.0099 followed by 1.0138, while daily support is seen at the levels of 0.9953 and 0.9900. According to the previous events, the EUR/USD pair is still trading between the levels of 1.0099 and 0.9953. Hence, we expect a range of 146 pips in coming hours (1.0099 - 0.9953) . The first resistance stands at the price of 1.0099, therefore if the EUR/USD pair fails to break through the resistance level of 1.0099, the market will decline further to 0.9953. This would suggest a bearish market because the RSI indicator is still in a negative area and does not show any trend-reversal signs. The pair is expected to drop lower towards at least 0.9953 in order to test the second support (0.9900). The US Dollar and the Euro are two of the most prominent and well-known currencies in the world. The Euro versus US Dollar (EUR/USD) currency pair has the largest global trading volume, meaning it is the world's most-traded currency pair. Whether you find the instrument easy or difficult to trade on, it's not a pair that many traders neglect, due to its daily volatility and price movement. Conclusion : Downtrend scenario : On the downside, the 1.0099 level represents resistance. The next major resistance is located near the 1.0138, which the price may drift below towards the 1.0099 resistance region. The breakdown of 1.0000 will allow the pair to go further down to the prices of 0.9953 and 0.9900. The material has been provided by InstaForex Company - www.instaforex.com |
| Gold fresh new lows as bulls fail to produce a strong bounce above $1,740. Posted: 14 Jul 2022 12:28 PM PDT
Red lines -lower lows trend line Blue line- resistance trend line Gold price is trading just above $1,700 but earlier today we saw price fall even below $1,700 as we expected. Trend remains bearish and as price is making lower lows, the RSI continues making lower lows as well. There is no sign of a weakening downtrend. Yes we might see a bounce higher but most probably it will be a counter trend move. The RSI has entered oversold levels. A bounce higher is justifies and expected. So far no reversal signal. Price could bounce towards $1,750-70 area as we mentioned in previous posts. Bears need to be cautious as it seems that the downside potential is very limited in the short-term. The material has been provided by InstaForex Company - www.instaforex.com |
| Short-term technical analysis on EURUSD for July 14th, 2022. Posted: 14 Jul 2022 12:24 PM PDT
Red line -bullish divergence Green lines- short-term bearish channel Blue lines- medium-term bearish channel Black lines- Fibonacci retracement EURUSD made a new low after the recent rejection at the upper boundary of the short-term bearish channel. Price continues making lower lows and the RSI continues making higher lows. The bullish RSI divergence continues but so far price has not produced a bullish reversal signal. EURUSD has resistance at 1.0065 and next at 1.0122. If bulls manage to break above these levels, we will get the first short-term reversal signal. Our 1st target would then be at 1.0210 and next at 1.0360. Until then, bears remain in control of the trend. The material has been provided by InstaForex Company - www.instaforex.com |
| Ethereum's big test at $1,280 is approaching. Posted: 14 Jul 2022 12:10 PM PDT
Green line- trend line resistance Red line- horizontal resistance Ethereum bounced off $1,000 and is now moving above $1,100 in an attempt to reach and test the horizontal resistance at $1,280 where it got rejected twice so far. Price has made no real progress over the last few weeks as it continues its sideways movement. Ethereum is bouncing higher and has potential to test $1,280 once again. The RSI has moved out of the oversold levels. We continue to consider that this sideways movement is only a pause to the major downtrend. Ethereum has potential to bounce towards $1,470, but I believe that this is a counter trend move and we will soon see price under pressure again. The material has been provided by InstaForex Company - www.instaforex.com |
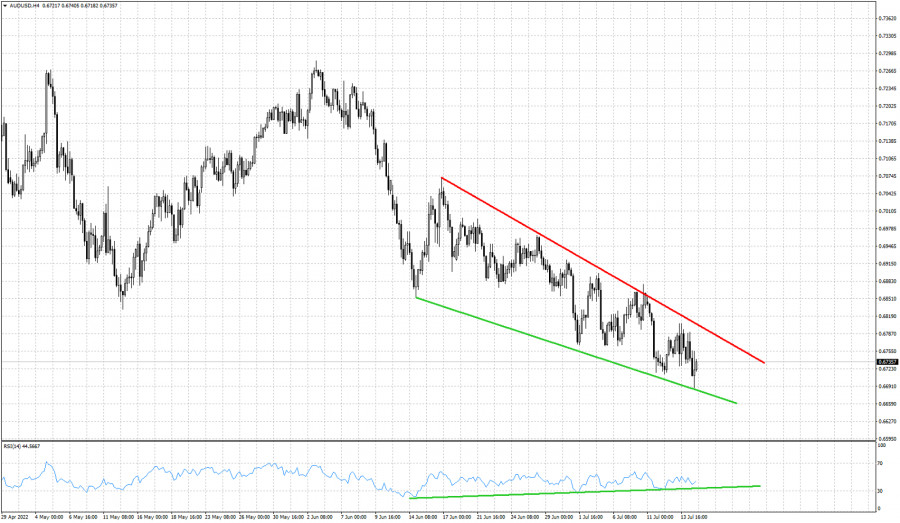
| Short-term technical analysis on AUDUSD for July 14, 2022. Posted: 14 Jul 2022 12:06 PM PDT
Green lines - bullish divergence Red line- resistance trend line AUDUSD made new lows today approaching even closer to the lower end of our long-term target. Price reached 0.6684 but bulls stepped in and try end the day near yesterday's close. Price remains trapped inside a downward sloping wedge pattern while the RSI continues forming higher lows. AUDUSD is trading very close to the lower wedge boundary. Price has potential to bounce higher towards the red trend line at 0.68. Trend remains bearish as price continues making lower lows and lower highs. Once again the bullish RSI divergence is only a warning of a weakening downtrend, not a reversal signal. The material has been provided by InstaForex Company - www.instaforex.com |
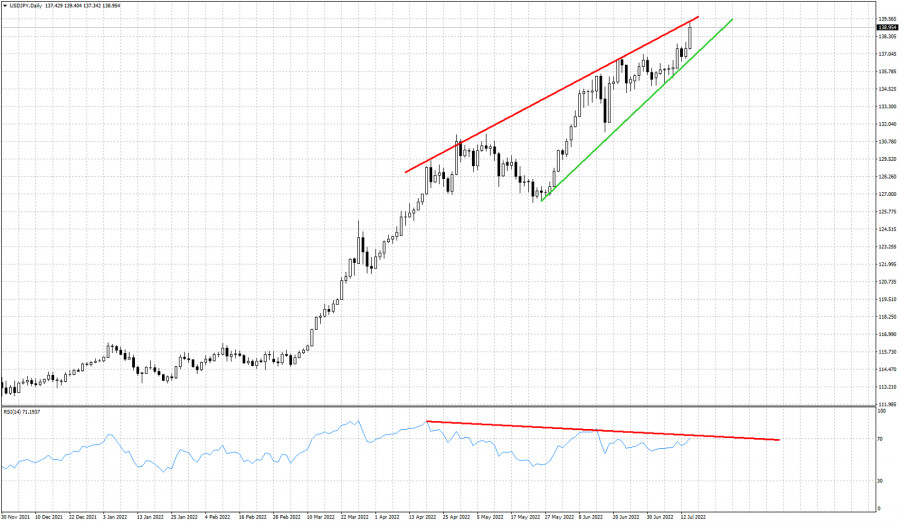
| Bulls remain in control of the trend in USDJPY. Posted: 14 Jul 2022 12:01 PM PDT
Red lines- bearish RSI divergence Green line -support trend line USDJPY made a new higher high for 2022 today reaching as high as 139.40. Our long-term view remains bullish USDJPY as we remind our readers the major long-term inverted head and shoulders break out that occurred when price broke above 126.40. In the near term price remains in a bullish trend making higher highs and higher lows. So far we only got warnings from the RSI as it makes lower highs producing bearish divergence signals. Price continues to respect support shown above as a green line. Yesterday's low at 136.70 area is now a key support. Bulls remain in control as long as price is above it. Breaking below it will also bring price below the green trend line. This would be a bearish signal. The material has been provided by InstaForex Company - www.instaforex.com |
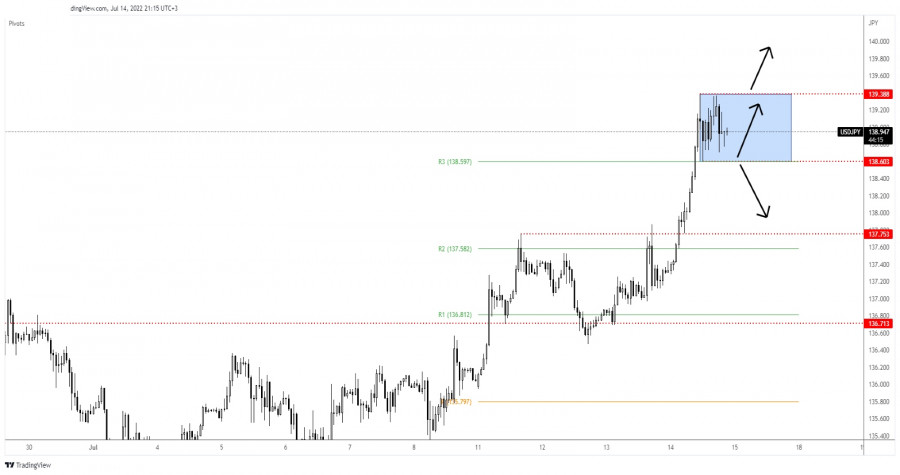
| USD/JPY retests buyers from around 138.60 support Posted: 14 Jul 2022 11:28 AM PDT The USD/JPY pair climbed as much as 139.38 today where it has found resistance. Now, it is traded at 138.92 at the time of writing. The price retreated slightly after the Dollar Index slipped lower while the Japanese Yen Futures rebounded. The bias remains bullish, but a minor drop was natural after its amazing rally. Fundamentally, the Japanese Revised Industrial Production dropped by 7.5% versus 7.2% expected. In the short term, the USD could lose some ground after the Core PPI rose by only 0.4% versus 0.5% expected, while the Unemployment Claims indicator was reported at 244K compared to 235K expected. Tomorrow, the US retail sales data could be decisive, the economic figures are seen as high-impact so the fundamentals could take the lead. USD/JPY Temporary Drop!
The USD/JPY pair retreated but the bias remains bullish as long as it stays above the 138.60 level, above the weekly R3 (138.59). It's trapped between 138.60 and 139.38 levels. Escaping from this range pattern could bring new opportunities. Technically, the retreat could bring new long opportunities. Before resuming its growth, it could only test and retest the immediate downside obstacles. USD/JPY Forecast!Testing and retesting the 138.60, registering only false breakdowns below this level may announce a new bullish momentum. This scenario could bring new buying opportunities. An upside continuation could be activated by a valid breakout above 139.38. Only a valid breakdown below 138.60 could announce a larger downside movement. This scenario could help the sellers to catch more declines. The material has been provided by InstaForex Company - www.instaforex.com |
| Posted: 14 Jul 2022 10:40 AM PDT
The euro has depreciated by almost 12% against its American counterpart since the start of the year. That has happened largely because growing fears of a global recession supported the dollar. The single currency has suffered as investors see Europe as the epicentre of the global slowdown. Divergence in the Fed and ECB monetary rates also contributed to this. The US Central Bank has already increased the cost of borrowing by 150 basis points. It seems to be flexible to raise rates in the future, as the United States economy still looks resilient. As for the European regulator, it is only preparing to raise rates. However, its flexibility is already limited, given that cutting or cutting off gas supplies from Russia to the EU could trigger an economic downturn in the region. Flash inflation data released in the United States yesterday triggered the dollar to jump to multi-year highs of around 108.60 points. The data also put pressure on a wide range of risk assets led by US equities and the euro. The US Department of Labor reported that US consumer prices rose at the fastest rate in more than 40 years in June. The figure climbed by 9.1% year-on-year against an increase of 8.6% a month earlier and an expected rise of 8.8%. Data on accelerating inflation in America is not stimulating growth in the country's stock markets. In early trading on Wednesday, main US stock indices edged down amid fears that the Fed will have to do more than what is already priced in to suppress the surge in prices. This increases the probability of a recession in the US economy. The fact that the yield on two-year US government bonds is already around 25 basis points above the yield on 10-year securities also indicates this. According to Deutsche Bank, the 2-10 yield curve is at its most inverted.
There are more problems for the US equity market. The rapid and massive increase in US government bond yields (10-year yields rose from 1.5% at the start of the year to 3%) has made it very difficult for the S&P 500 to compete with Treasuries for investors' money. According to Bloomberg, over the past couple of decades, slightly more than 20% of S&P 500 components could offer investors a higher dividend yield than 10-year US government bonds. This now stands at just over 10%, the lowest level since 2007. With the prospect of a recession and higher borrowing costs, US companies are choosing to save for a rainy day rather than share with investors. Furthermore, the stronger dollar is harming US exports and foreign-currency-denominated profits of US companies. Refinitiv estimates that on an annualized basis, each percentage point increase in the USD leads to a decline of about half a point in the S&P 500's profits. For the S&P 500, the main problem is that major multinationals with large capitalizations have a lot of influence. For example, Alphabet, Amazon, Apple, Microsoft and Netflix account for a fifth of the index's capitalization. Some of these companies have already warned of currency headwinds. The initial market reaction to the June inflation data waned rather quickly. Although US stock indices slipped on Wednesday, by the end of the session they had managed to cut the losses seen during trading. In particular, the S&P 500 fell by 0.45% to 3,801.78 points. Meanwhile, the implementation of the 'buy the rumour, sell the news' strategy caused the greenback to pull back to 107.40. The euro was able to recover, having previously fallen below $1 for the first time since December 2002. The EUR/USD pair spiked above 1.0100, but then gave up much of this daily gain and closed near 1.0060. The dollar moved back above 108.00 points after Atlanta Fed president Raphael Bostic said that there was a possibility of a full percentage-point increase in the Fed's benchmark rate. Against this backdrop, traders priced in an 80% probability of an immediate 1% increase in the cost of borrowing in the United States at the end of July's FOMC meeting. On Tuesday, there was only a 7.6% chance of such a radical rate hike. Markets seem to have overestimated expectations from the Fed. At least annual core inflation in America has been slowing for the past three months, reaching 5.9% in June against a peak of 6.5% in March. For this reason, there is a possibility that the Fed, after the big rate hike at the end of July, will reassure the markets that it will move more measuredly from here, so as not to overcool the economy. In September, another 50-basis-point interest rate hike to 3.25% is expected. In November, the Federal Reserve is due to rise interest rate by 50 basis point to 3.75%. According to the futures market, this will be the end of the monetary policy tightening cycle in the US. A rate cut is already expected next summer. At the same time, Fed policymakers do not yet believe that there are no signs of the inflationary threat.In particular, the annual inflation index could increase by 2.3% just because of rents. If services and goods, with the exception of energy, do not become cheaper, it will threaten the regulator's plan to curb inflation. The Fed will wait for signals from this particular sector. However, so far there are none. FOMC officials intend to continue tightening until they reach the acute phase of the recession, which will be harmful to employment. At this stage the focus will be on the labour market recovery. That would result in at least a suspension of QT and at most new QE. This could happen in the next 12 months. So far, with the strength of the US labour market, the Fed is sticking to its current policy normalization plans. So, there is no reason to expect a policy change any time soon. Therefore, the gap between the Fed and ECB rates looks set to widen further. "Stubbornly high inflation increases the risk that the FOMC continues to hike aggressively and triggers a recession," Commonwealth Bank of Australia analysts said. They believe this is becoming an increasingly common case scenario in the market and recession fears will continue to support USD as a defensive asset.
On Thursday, the greenback rose to a multi-year high above 109.00 after US data showed the country's producer price index jumped to 11.3% year-on-year in June from 10.9% recorded in May. The data intensified speculation about a sharp Fed rate hike at the end of July meeting and kept global stock indices in the red zone. Key Wall Street indicators are losing about 1.5% on average today. Reflecting investors' risk aversion, EUR/USD first reached parity and then slipped below this psychologically important mark, touching its lowest level since December 2002 at 0.9955. Persistent euro weakness could accelerate the pair's fall towards the 0.9915-0.9910 area on the way to the next support zone of 0.9850-0.9845. Alternatively, the 1.0100 level acts as an immediate strong resistance. Any subsequent move upwards is likely to face a tough resistance in the 1.0275-1.0280 area before the 1.0300 level. The fundamental backdrop still favors the bears and suggests that any recovery attempt could still be seen as a selling opportunity. EUR/USD has held above an important level since the beginning of the week. However, it broke above this mark amid increasing policy divergence between the Fed and the ECB. The latest euro drop came after gas flows through Russia's Nordstream 1 pipeline shut for 10 days for maintenance. However, if Moscow extends the shutdown, Germany, which is already in stage two of a three-tier emergency gas plan, may be forced to ration fuel. "If the gas pipeline that's closed for 10 days doesn't reopen and we get more gas rationing, in that situation we may not have seen the weakest levels of the euro," Barclays strategists said.
According to analysis by BNP Paribas, the euro suffers more than other developed currencies from gas price shocks, falling an average of 4.5% during such times. JPMorgan noted the euro area is already facing "parabolic" gas price spikes, with supplies down 53% in June. Industrial powerhouse Germany has witnessed a 60% supply decline. The bank cut its euro-dollar target to 0.95. The worst case could bring a test of $0.90, JPMorgan said, citing the Bundesbank's forecast of a 6% hit to German GDP in the first year if supplies stop completely. Nomura's experts reckon the euro may fall to $0.95 by end-August, but in a scenario where gas storage tanks fail to replenish by winter, it could slip to $0.90. Citi analysts predict a Russian supply halt will send gas prices surging well above current levels of around €170 per megawatt hour. All else being equal, the euro will fall to $0.98 if gas hits €200, while at €250, it would trade below $0.95, they added. In theory, the ECB could intervene by selling dollars to prop up the euro as it did back in 2000, when the currency fell to around $0.83. However, the regulator has made it clear that it may not step in this time, possibly because the euro's real exchange rate, against trade partners' currencies and adjusted for inflation, is well above where it was in 2002, the last time euro-dollar parity was hit. The material has been provided by InstaForex Company - www.instaforex.com |
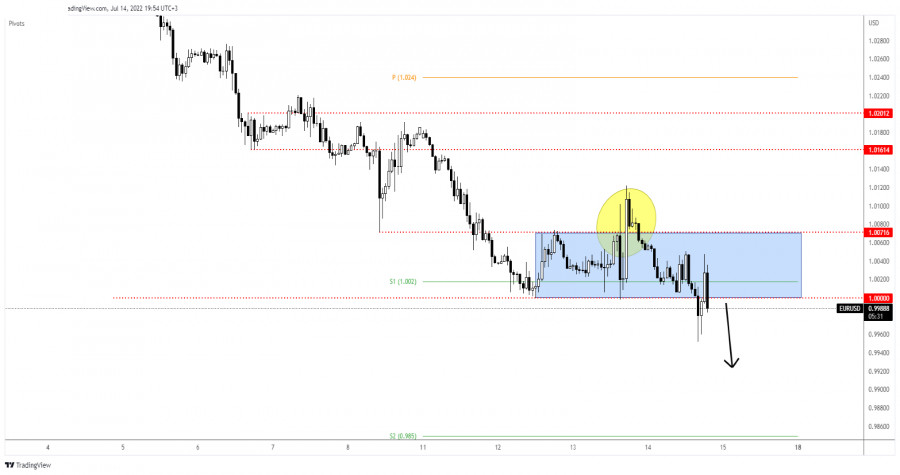
| EUR/USD: more declines possible Posted: 14 Jul 2022 10:12 AM PDT The EUR/USD pair is trading in the red at 0.9988 on the H1 at the time of writing. The price plunged today and reached 0.9952 fresh new low as the Dollar Index rallied towards new highs. As you already know, the USD remains bullish after the US reported a higher-than-expected CPI in June. The Federal Reserve is widely expected to hike interest rates again in the July meeting. In the last hours, the EUR/USD pair rebounded as the US data came in mixed while the DXY retreated a little. The PPI rose by 1.1% versus 0.8% expected, Core PPI registered a 0.4% growth less versus the 0.5% growth expected, while the Unemployment Claims came in at 244K in the last week versus 235K estimated. EUR/USD Retests The Sellers!
As you can see on the h1 chart, the pair rebounded but it has failed to stay above the weekly S1 (1.0017) resistance (support turned into resistance) and now is back below parity, below the 1.0000 psychological level. Stabilizing below this key level may signal more declines. Technically, a false breakout above the 1.0071 resistance announced that the rebound ended and that the EUR/USD pair could drop deeper. EUR/USD Outlook!Stabilizign below the 1.0000 key level could signal a downside continuation. A new lower low, dropping and closing below 0.9952 activates a larger drop and could bring new short opportunities with a potential downside target at 0.9900. The material has been provided by InstaForex Company - www.instaforex.com |
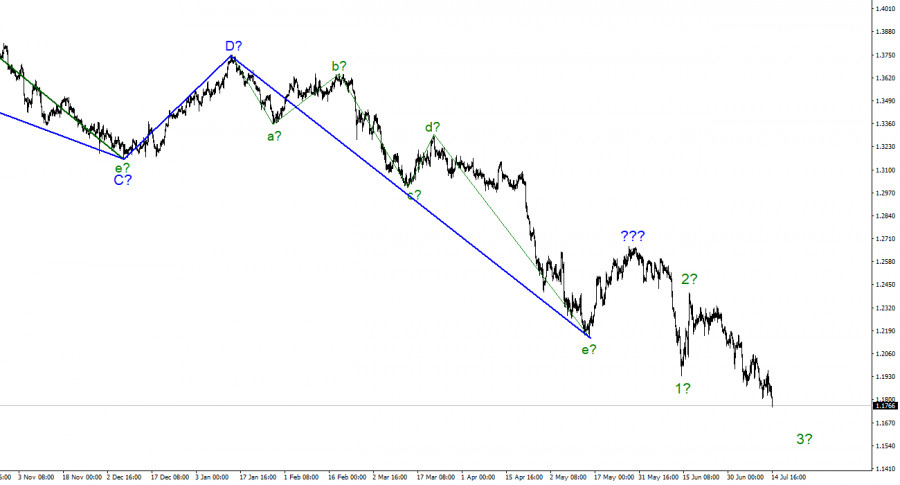
| GBP/USD analysis on July 14. The pound falls into the abyss Posted: 14 Jul 2022 09:17 AM PDT
The wave marking on the pound/dollar instrument required clarifications, which were made. The upward wave constructed between May 13 and May 27 does not currently fit into the overall wave picture, but it can still be considered corrective as a segment of the downward trend. Thus, we can now definitively state that the construction of the upward correction section of the trend has been canceled, and the downward section of the trend will assume a longer and more complex shape. I am not a big fan of continually complicating the wave marking when dealing with a trend zone that is significantly elongating. I believe it would be considerably more efficient to identify rare corrective waves, after which new impulse structures could be constructed. Currently, there are waves 1 and 2, so we can assume the instrument is in the process of constructing wave 3. If this is the case, the decline may continue with targets near the 161.8% Fibonacci level. The market has demonstrated that it is now more important to adhere to the trend than to mark waves. British decline is less rapid than European In July, the pound and dollar exchange rate decreased by 100 basis points. I can assume that the new decrease in the instrument results from yesterday's report of 9.1 percent inflation in the United States. If the market was uncertain about what to do with the euro and the dollar last night, it was no longer uncertain today. The construction of descending wave 3 continues, and the 161.8 percent Fibonacci level should not sustain the decline for too long; otherwise, the construction of a corrective wave may commence, surpassing the low of wave 1. In such a scenario, the wave structure of even the most recent descending segment of the trend will become increasingly complex and cannot be considered impulsive. The euro and the pound continue to exhibit nearly identical movements, but the pound continues to fall slower than the euro. This is readily apparent in the graphs. Regarding the euro, there are no concerns regarding the complexity of the wave marking of the descending segment. Thus, both currencies appear to continue a steep decline, but the British are still attempting to gain ground against the US dollar. Today, only one report was published in the United States and none in the United Kingdom. Despite this, the amplitude is relatively high, and the market is active. The number of initial claims for unemployment benefits reached 244,000 last week, exceeding expectations of 235 thousand. Tomorrow, the market will digest reports on retail sales and industrial production in the United States, as well as the consumer sentiment index from the University of Michigan. However, it is unlikely that these reports will be able to replace the inflation report, which has long-term consequences in the form of monetary policy changes. I believe the market will respond slowly to this information. On Friday, there will be no interesting events in the United Kingdom. General conclusions The increased complexity of the wave pattern of the pound/dollar pair now suggests a further decline. Consequently, I recommend selling the instrument with targets near the estimated mark of 1,1708, which corresponds to 161.8 percent Fibonacci for each "down" MACD signal. An unsuccessful attempt to surpass 1.1708 may result in a departure of quotes from the reached lows, but it is unlikely to produce a corrective wave 4, as the final descending segment of the trend will assume a non-standard shape in this case.
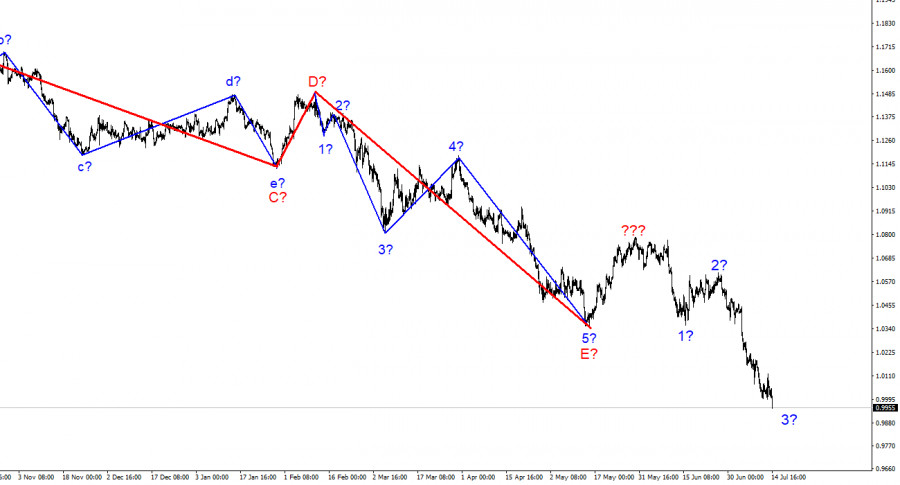
The image closely resembles the euro/dollar instrument at the higher wave scale. The same ascending wave does not fit the current wave pattern, followed by the same three descending waves. Thus, one thing is unmistakable: the downward segment of the trend continues to develop and can reach almost any length. The material has been provided by InstaForex Company - www.instaforex.com |
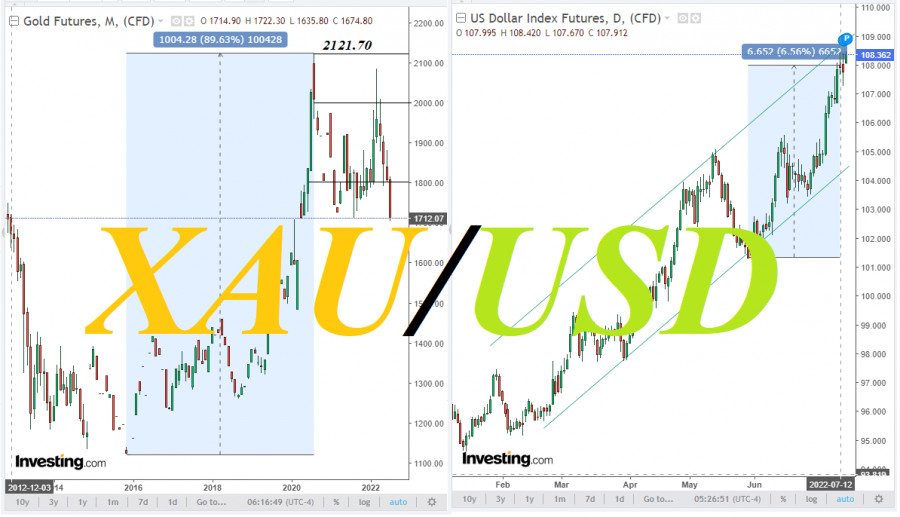
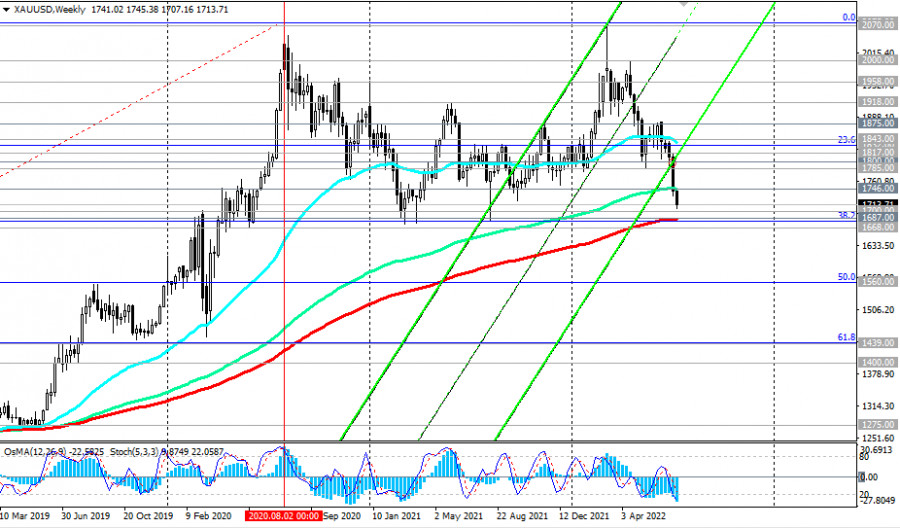
| XAU/USD Technical Analysis and Trading Tips for July 14, 2022 Posted: 14 Jul 2022 08:10 AM PDT In the current situation, investors are putting the Fed's policy first, relegating geopolitical and inflationary risks to the background, also preferring the dollar as a protective instrument. It continues to strengthen in the currency market, and its DXY index reached a new local high of 108.47 today.
Meanwhile, XAU/USD continues to decline for the fourth month in a row, and yesterday the price hit a new low since September 2021, below 1708.00. As we suggested in our previous reviews dated 05/02/2022, 05/23/2022, and 06/02/2022, a breakdown of support levels 1800.00, 1785.00 will push XAU/USD to further decline to key support levels 1738.00, 1700.00. At that time, the scenario worked, and the price moved, as we assumed, towards the 1700.00 mark. Given the prevailing market sentiment and trends, it is likely that this mark will be reached soon. Also, most likely, the key long-term support levels 1687.00 (200 EMA on the weekly chart), 1682.00 (38.2% Fibonacci retracement level to the growth wave since December 2015 and 1050.00) will be reached soon.
But the breakdown of the long-term support level at 1668.00 (50 EMA on the monthly chart) may "push" XAU/USD out of the long-term bull market zone, directing it towards the support levels of 1275.00 and 1050.00, the breakdown of which will complete this process. In an alternative scenario, there will be a rebound from the support levels of 1682.00, 1687.00, and an upward correction of XAU/USD will begin with the prospect of growth towards the recent "balance line" passing through the 1800.00 mark.
The breakdown of the resistance levels 1746.00 (144 EMA on the weekly chart) and 1752.00 (200 EMA on the 1-hour chart) will signal this. It is also possible that investors will remember gold as a defensive asset in the face of strong geopolitical and inflationary risks—this is the period we are currently experiencing.
Support levels: 1700.00, 1687.00, 1682.00, 1668.00 Resistance levels: 1746.00, 1752.00, 1785.00, 1800.00, 1817.00, 1832.00, 1843.00, 1875.00 Trading Tips Sell Stop 1706.00. Stop-Loss 1753.00. Take-Profit 1700.00, 1687.00, 1682.00, 1668.00 Buy Stop 1753.00. Stop-Loss 1706.00. Take-Profit 1785.00, 1800.00, 1817.00, 1832.00, 1843.00, 1875.00 The material has been provided by InstaForex Company - www.instaforex.com |
| XAU/USD: inflation has accelerated, but gold continues to fall in price Posted: 14 Jul 2022 08:00 AM PDT According to data from the US Bureau of Labor Statistics released on Wednesday, inflation in the US jumped in June to the highest level in the last 40 years, amounting to 9.1% (year-on-year) against 8.6% in May and market expectations of 8.8%. At the same time, monthly inflation accelerated from 1.0% to 1.3%. The core consumer price index, which does not regard volatile food and energy prices, although it decreased in June, still exceeded the forecast of economists and came out with a value of 5.9% (against 6.0% in May). Such a sharp increase in inflation, despite the actions of the Fed, strengthened the expectations of market participants regarding a faster tightening of the monetary policy of the US central bank, which resulted in the continued strengthening of the dollar, well ahead of its main competitors in the foreign exchange market. The dollar index (DXY) broke through the 108.00 mark at the beginning of this week, and today, dollar buyers on strong US inflation indicators forced the DXY to renew the local multi-year high above 108.45.
Now almost none of the economists doubt that the interest rate will be raised at the Fed meeting on July 26 and 27 by 75 basis points. Moreover, the likelihood that the Fed will immediately raise the interest rate by 0.1% has increased, taking into account yesterday's inflation statistics, especially since yesterday the Bank of Canada had already taken this path (more aggressively raising interest rates), unexpectedly raising its interest rate by 100 bps to 2.5%. In anticipation of more aggressive actions on the part of the Fed's leadership in relation to curbing inflation, market participants are more actively buying the rising dollar. Considering also the long-term upward trend in DXY, in which it has been since March 2011, the breakdown of today's local high of 108.47 will be a signal to increase long positions in DXY futures with the prospect of growth towards multi-year highs of 121.29 and 129.05, reached, respectively, in June 2001 and in November 1985. Taking into account the prevailing mood of investors in the market, who are waiting for further steps by the Fed to tighten its monetary policy, today, after yesterday's attempt at an upward correction, gold prices resumed falling. It does not bring investment income, but is in active demand in geopolitical and economic uncertainty and a protective asset in conditions of rising inflation. However, its quotes are extremely sensitive to changes in the monetary policy of the world's leading central banks, especially the Fed. When interest rates rise, gold prices usually decrease as the cost of acquiring and storing it increases. In the current situation, it seems that when assessing the possibility (or necessity) of investing in this precious metal, investors put the Fed's policy first, relegating geopolitical and inflationary risks to the background, also preferring the dollar as a protective tool.
As for the XAU/USD pair, last week, it broke through the important long-term support level of 1746.00, and today it continues to decline towards the strongest support levels of 1687.00, 1682.00, 1668.00. Their breakdown may "push" XAU/USD out of the long-term bull market zone, sending it towards the support levels of 1275.00, 1050.00, the break of which will complete this process. And from the news for today, market participants will pay attention to the publication at 12:30 (GMT) of weekly data from the US labor market and US producer price indices (PPI), which are likely to confirm the increase in inflation in the US. The material has been provided by InstaForex Company - www.instaforex.com |
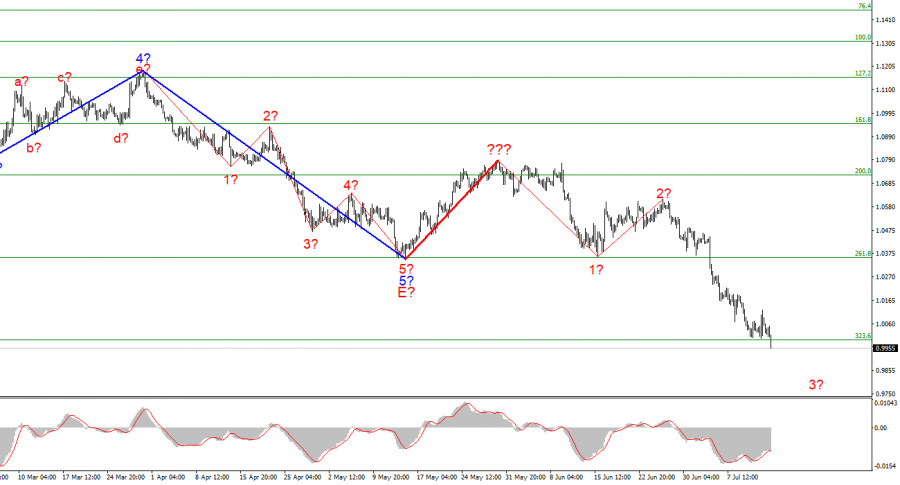
| Posted: 14 Jul 2022 07:12 AM PDT
The wave marking of the 4-hour chart for the euro/dollar instrument became more complicated after the quotes fell by almost 300 basis points last week. Thus, a successful attempt was made to break through the 261.8% Fibonacci level, which was also the low of the waves E and b. Now it is clear that these waves are not E and b, but the market sentiment comes first in importance. We had an excellent, promising wave layout just a week ago, which contained a classic five-wave descending structure. Instead of building at least three correction waves up, the market preferred to resume selling the instrument, indicating the secondary importance of wave analysis. Now we have one correction wave marked with a red line, and the instrument can build a new five-wave descending series. I recommend paying attention to the lowest wave order now because wave marking looks very difficult on a larger scale. If the current wave markup is correct, then the decline in quotes continues within wave 3. Wave 4, which could have started its construction yesterday, has been canceled. The euro broke through price parity with the dollar. The euro/dollar instrument declined by 110 basis points on Thursday. Yesterday, a report on inflation in the United States was released, which I recommended paying close attention to. As it turned out, not in vain, since this report has changed a lot in the market. In particular, a correction wave could have started its construction yesterday, which required increased demand for the euro. And this could happen if inflation showed a slowdown. But it did not show and rose to 9.1% y/y, which was higher than market expectations. Towards Wednesday evening, the European currency still managed to rise slightly, but already that evening, the demand for it began to decline again, and now the instrument has broken through its last low and, for the first time in many years and decades, has fallen below the 1.0000 mark. There is no news background on the European Union and the USA today. But this does not prevent the market from continuing to reduce demand for the euro and raise the dollar. The current wave marking is being worked out perfectly so far, and the targets of the descending wave set are up to 94 figures. It is up to this level that the euro currency may fall over the next weeks if the foreign exchange market does not change. But it's very difficult for me even to guess what might change. The ECB and the Fed continue to stick to their plans. The Fed is aggressively raising interest rates, and the ECB is not doing anything. The military-political conflict between Ukraine and Russia persists. Europe is on the verge of a gas embargo, with this already on the part of Russia. The situation remains very complicated and "acute," and at the same time, unstable. No one can say what will happen in a few weeks, and the market prefers to transfer its assets to the most stable currencies at such times. The dollar is such. General conclusions. Based on the analysis, I conclude that the construction of the downward trend section has been resumed and continues. If so, it is now possible to sell the instrument with targets near the calculated mark of 0.9397, which equates to 423.6% Fibonacci, for each MACD signal "down," counting on the construction of waves 3 or 5. An unsuccessful attempt to break through the level of 323.6% will indicate the temporary unavailability of the market for new sales and the construction of corrective waves 4. But I think the attempt will be successful.
At the higher wave scale, the wave marking of the descending trend segment becomes noticeably more complicated and lengthens. It can take on almost any length, so I think it's best to isolate three and five-wave standard wave structures and work on them. The material has been provided by InstaForex Company - www.instaforex.com |
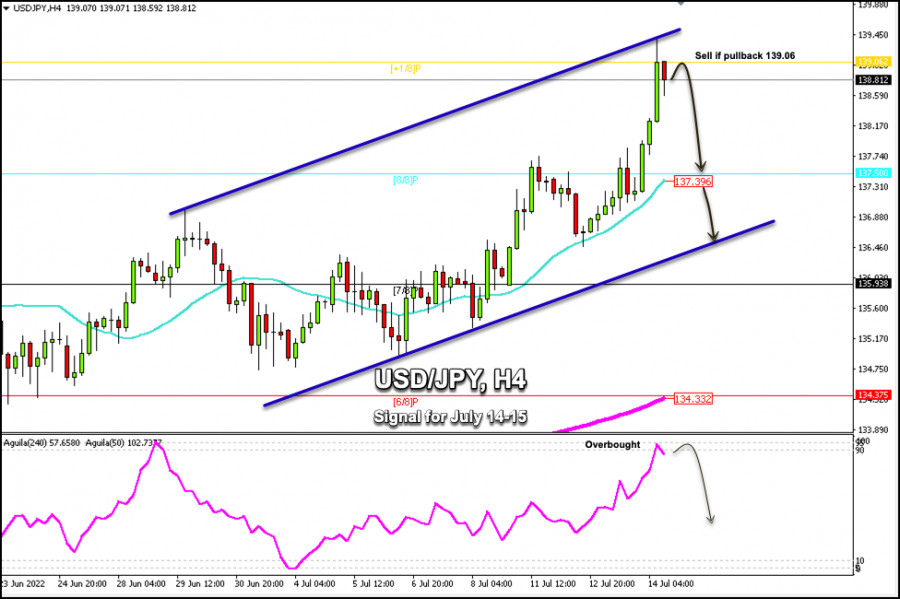
| Trading Signal for USD/JPY for July 14 - 15, 2022: sell below 139.06 (+1/8 Murray) Posted: 14 Jul 2022 06:55 AM PDT
USD/JPY stopped its strong negative move after it had reached a 24-year high near the 139.37 area. The price is currently pulling back and trading below +1/8 Murray (139.06). According to the 4-hour chart, we can see that the Japanese yen is extremely overbought. Hence, a strong technical correction is expected in the next few hours. USD/JPY could fall towards 8/8 Murray at around 137.39. The material has been provided by InstaForex Company - www.instaforex.com |
| Forecast for EUR/USD on July 14. The euro currency has fooled traders Posted: 14 Jul 2022 06:47 AM PDT
Yesterday, the EUR/USD pair executed a reversal in favor of the European currency and a slight rise with a close above 1.0080. It appears that this is the moment for the euro. An hour after this event, however, a reversal in favor of the US dollar occurred, and by the time this article was written, the European quotes had returned to the lowest levels of the week, month, and past 20 years. Thus, the falling process can continue in the direction of the corrective level of 323.6% (0.9963). One event alone was remembered from yesterday. Even though there were reports from the European Union and the United Kingdom yesterday, they had little impact on the sentiment of traders. However, after the release of the inflation report, such movements began. Inflation in the United States has risen again and now stands at 9.1%. From my perspective, the remaining inflation figures are unimportant, and this is why. As much as one would like to believe otherwise, the Fed is not more concerned with the underlying inflation rate (excluding food and fuel). According to the most recent report, core inflation can decline when the primary indicator rises. In recent months, the price of oil (gas and gasoline) has broken all previous records, so all goods whose price includes transportation costs become automatically more expensive after hydrocarbons. How can you turn a blind eye to many first-rate necessities for humans? Let me remind you that, first and foremost, the lower class of the population suffers from high inflation, and for them, the rise in food prices is of immense significance. More than half of the US population that does not have an extra $500-$1000 per month to cover rising costs is impacted negatively by high inflation, so it is no surprise that this is already being stated. From my perspective, rising inflation makes it plausible that the Fed will raise rates by 0.75 percentage points in July. Today, some agencies and analysts began discussing an increase of even 1.00 percent.
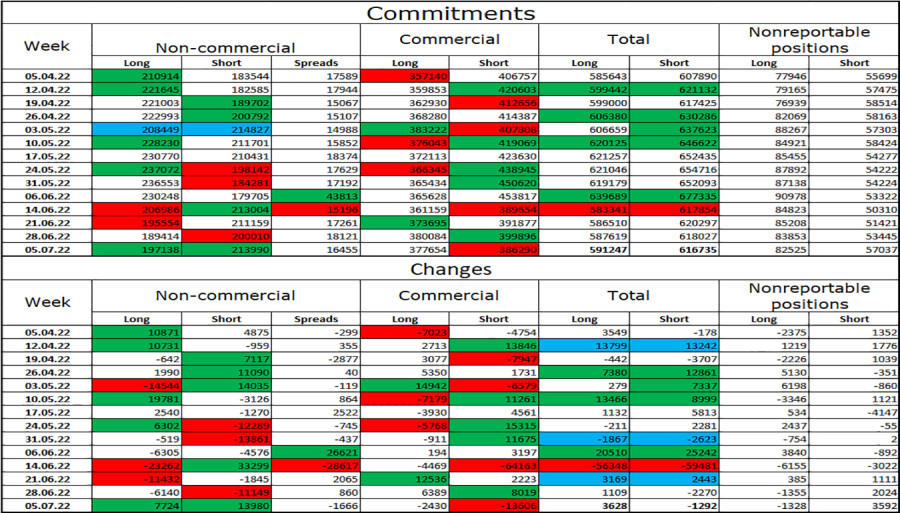
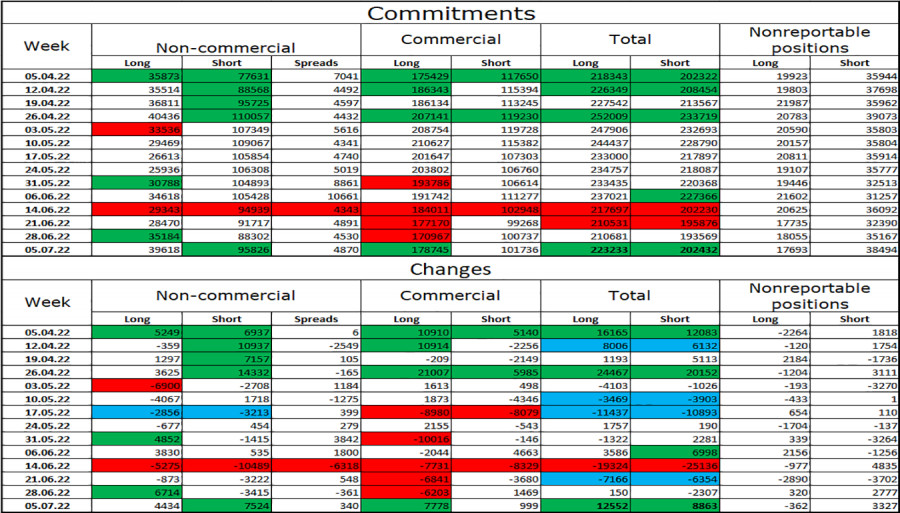
On the 4-hour chart, the pair has positioned itself below the corrective level of 127.2% (1.0173). Consequently, the price decline can continue in the direction of the subsequent corrective level of 161.8 percent, or 0.9581. The downward trend corridor continues to characterize "bearish" sentiment among traders. Both indicators have formed "bullish" divergences, which have thus far did not affect the sentiment of traders. Report on Commitments of Traders (COT):
Last reporting week, 7,724 long contracts and 13,980 short contracts were opened by speculators. This indicates that the "bearish" sentiment of the major players has again intensified and continues to be "bearish." The total number of long contracts held by speculators is now 197 thousand, and the number of short contracts is 214 thousand. The disparity between these numbers is slight, but it does not favor the bulls. Most "Non-commercial" traders have maintained a "bullish" outlook on the euro in recent months, which has not helped the euro currency. Recent COT reports indicate that new sales of the EU currency may follow, as speculators' sentiment has shifted from "bullish" to "bearish" over the past few weeks. This is the exact development of events that we are currently witnessing. News calendar for the United States and Europe: The number of initial claims for unemployment benefits in the United States (12:30 UTC). The economic event calendars of the European Union and the United States contain one entry for two on July 14. The report on applications for unemployment benefits is not likely to elicit a strong reaction. Today, the impact of the information background on the sentiment of traders may be negligible or nonexistent. EUR/USD forecast and trader recommendations: I suggested selling the pair when it reached a closing price of 1.0196, with targets of 1.0080 and 0.9963; the first target has been reached, and the second can be reached today. On a 4-hour chart, I advise buying the euro when the price is above the corridor with a target of 1.1041. The material has been provided by InstaForex Company - www.instaforex.com |
| Forecast for GBP/USD on July 14. The pound does not notice the departure of Boris Johnson. Posted: 14 Jul 2022 06:47 AM PDT
According to the hourly chart, the GBP/USD pair rose to the trend line and the level of 1.1933, rebounded from them, executed a reversal in favor of the US dollar, and resumed falling towards the corrective level of 685.4% (1.1684). The market reacted strongly to yesterday's inflation report in the United States. The dollar has experienced significant growth, significant decline, and significant growth again. And everything concluded where British stock quotes remained on Wednesday. In my opinion, the US dollar should have shown growth. Growth with no upward pullbacks or tests of the trend line. However, at some point, traders conducted dollar sales that did not correspond to the inflation report's value. By doing so, they misled other merchants who may have mistakenly purchased a Briton for no reason (except for the British statistics released earlier in the day, which turned out to be quite good). In any case, everything eventually fell into place, and traders should now focus on political events in the UK, as there are no significant economic events scheduled for this week. Remember that it was announced last week that Boris Johnson would resign. In addition, the first round of voting for the new Conservative Party leader took place yesterday. Rishi Sunak, the former finance minister who resigned last week due to a new scandal involving Boris Johnson, is currently in the lead in the vote. Six out of eleven candidates advanced to the next round. The next round should occur today, and the candidate with the fewest votes will be eliminated after each subsequent vote. Two candidates should remain until July 21, after which the entire legislature will adjourn for the summer.
On the 4-hour chart, the pair reversed in favor of the British after forming a "bullish" divergence at the MACD indicator but has since resumed the process of falling quotes in the direction of the corrective level of 161.8% (1.1709). The descending trend line still characterizes bearish sentiment. Technically, the British are trading quite far from this line, so growth is possible; however, to end the downward trend, the price must close above the trend line. Report on Commitments of Traders (COT):
The sentiment of "Non-commercial" traders has become more "bearish" in the past week. The number of long contracts held by speculators increased by 4,434, while the number of short contracts increased by 7,524. Thus, the general sentiment of the major players remained unchanged at "bearish," and the number of short contracts continues to outnumber long contracts by several. Most major players continue to shed pounds, and their mood has not changed significantly recently. Consequently, I believe the British pound could continue to decline over the next few weeks. A significant disparity between the number of long and short contracts may signal a trend reversal, but the context of the information is currently of greater importance to major players. And it continues to be against the Briton. To date, it makes no sense to dispute that speculators sell more than they purchase. News calendar for the United States and the United Kingdom: US - number of initial applications for unemployment benefits (12:30 UTC). There are no economic events scheduled in the United Kingdom on Thursday. There will be a single report in the United States, which is unlikely to be of interest to traders. Today, I believe the influence of the informational context will be absent. GBP/USD forecast and trader recommendations: When the British retraced from the trend line on the hourly chart, I suggested new sales with a target of 1,1709. Now, it is possible to maintain these open deals. I recommend buying the British pound when the hourly price closes above the trend line with a target of 1.2146. The material has been provided by InstaForex Company - www.instaforex.com |
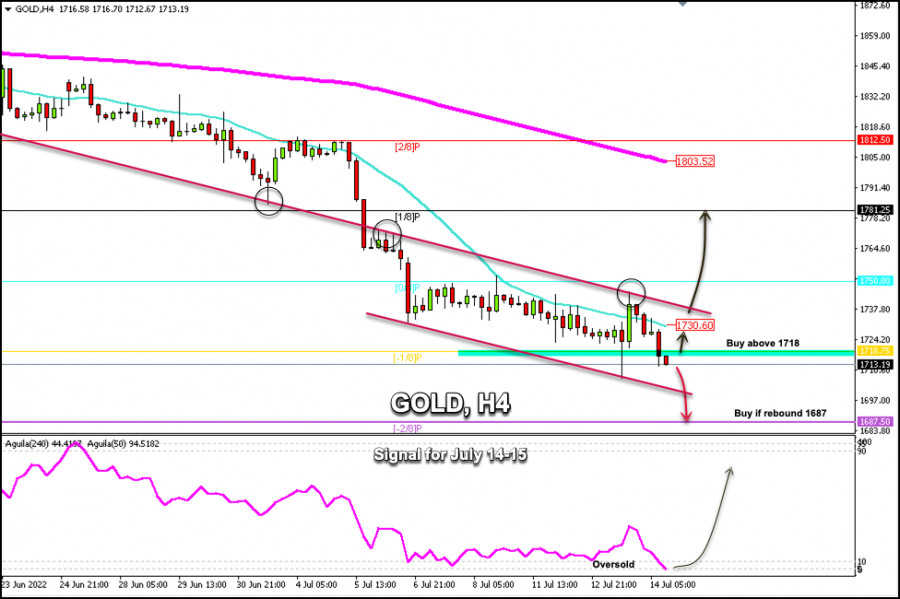
| Trading Signal for Gold (XAU/USD) for July 14 - 15, 2022: key level $1,700 Posted: 14 Jul 2022 06:46 AM PDT
Early in the American session, gold (XAU/USD) is trading at around 1,713. The metal is still weighed down by bearish pressure. The price is likely to fall in the next few hours towards the bottom of the downtrend channel at around 1,690 and could even reach -2/8 Murray at 1,687. Treasury yields are pulling back which could help gold rebound, but we should expect it to trade back above 1,718 (-1/8 Murray). On Wednesday, investors found out that the annual rate of consumer inflation in the US climbed to 9.1% in June, the highest level in four decades, which adds pressure on the Federal Reserve to continue raising the interest rate. This led the market to expect a 1.00% rise in the interest rate at the next meeting. Yesterday in the American session, gold could not overcome 1,750. Just at this level, it crosses a downtrend line which acted as a strong barrier and prevented gold from extending its technical rebound. Gold is currently trading below -1/8 Murray which could be a negative sign. Hence, we could expect a drop towards the psychological level of 1,700. If this level is lost, gold could quickly fall towards the area -2/8 Murray at 1,769 and could even hit the low 2021 in the area of 1,650. As for the upside, bearish pressure could ease if the metal settles above 1,718. Only a daily close above the 21 SMA and a sharp break above the downtrend channel around 1,737 could confirm the start of a gold rally. If so, the price could reach 1/8 Murray at 1,781. On the 4-hour chart, we can see the formation of a Japanese candlestick called a pin bar. This is a sign of a probable recovery in gold. It will be confirmed provided that the price holds above the low of 1,700. The material has been provided by InstaForex Company - www.instaforex.com |
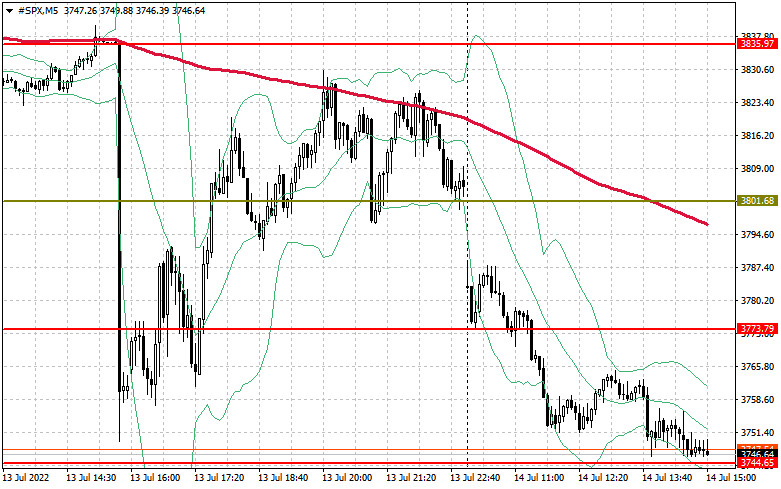
| US Premarket on July 14: JPMorgan report puts pressure on the US stock market Posted: 14 Jul 2022 05:11 AM PDT During yesterday's publication of a soaring inflation report, futures for US stock indices continued to decline in trading on Thursday. Traders weighed the likelihood of a further tightening US monetary policy against the backdrop of the report. The Dow Jones Industrial Average futures lost 411 points or 1.34 percent. S&P 500 futures fell 1.26 percent, and Nasdaq 100 futures fell 0.89 percent. The S&P 500 has reached yesterday's low; a breach of this level will significantly increase the pressure on the trading instrument, resulting in a larger sell-off. However, we will discuss the technical picture below.
The data released yesterday revealed that the consumer price index in the United States increased by 9.1 percent in June compared to the same month last year, exceeding economists' expectations of an increase of 8.8 percent. The core consumer price index, which excludes volatile food and energy prices, increased by 5.9% versus the expected 5.7%. The Beige Book report from yesterday confirmed fears of an impending recession in light of rising inflation. The yield on 2-year Treasury securities increased by nine basis points to 3.138 percent, while the yield on 10-year Treasury securities decreased by four basis points to 2.919 percent. The inversion of the two instruments is a well-known recession indicator. As soon as yesterday's data was released, rumors began to circulate that the Federal Reserve may raise interest rates by 1 percent, or 100 basis points, at the end of this month. The Fed's policy depends on incoming data, and the central bank will continue to aggressively tighten monetary conditions until inflationary pressure reaches its peak and begins to decline. Jerome Powell has repeatedly warned that he is extremely serious about combating price pressure, so politicians will likely opt for another sharp rate hike. Today, we anticipate reports on weekly applications for unemployment benefits and the producer price index for June in the United States. Premarket JPMorgan Chase's quarterly earnings fell short of analyst expectations, which added to the index's pressure. Earnings per share were $ 1.39, compared to the $ 1.53 predicted by analysts. The actual revenue was $ 13.13 billion versus the forecasted $ 13.48 billion. Profit decreased 29 percent from the previous year to $ 2.5 billion, or $ 1.39 per share. The 11 percent decline in revenue to $ 13.13 billion was caused by a 55 percent decline in investment banking services. In the premarket, shares of the financial corporation fell by more than 4 percent. A report from Morgan Stanley will be released shortly after that, which may further harm the market.
As for the S&P 500's technical picture Increased pressure on the index does not preclude a new wave of decline. Only the return of the $ 3,773 level will allow the current sales cycle to be paused while maintaining hope for a recovery to $ 3,081. This will allow for an active movement of the trading instrument upwards to the $ 3,835 and $ 3,872 levels, where large sellers will return to the market. At least some traders will seek to lock in profits on long positions. A more distant objective will be $ 3,975. In the event of additional pessimism, weak economic reports, and high inflation, the trading instrument will continue to decline. This will result in a fresh rejection of risks and a revision of the closest support at $ 3,744. A decline in this sector will bring the index to $ 3,704. Below that is a more stable level at $ 3,677, where buyers will resume their aggressive behavior. The material has been provided by InstaForex Company - www.instaforex.com |
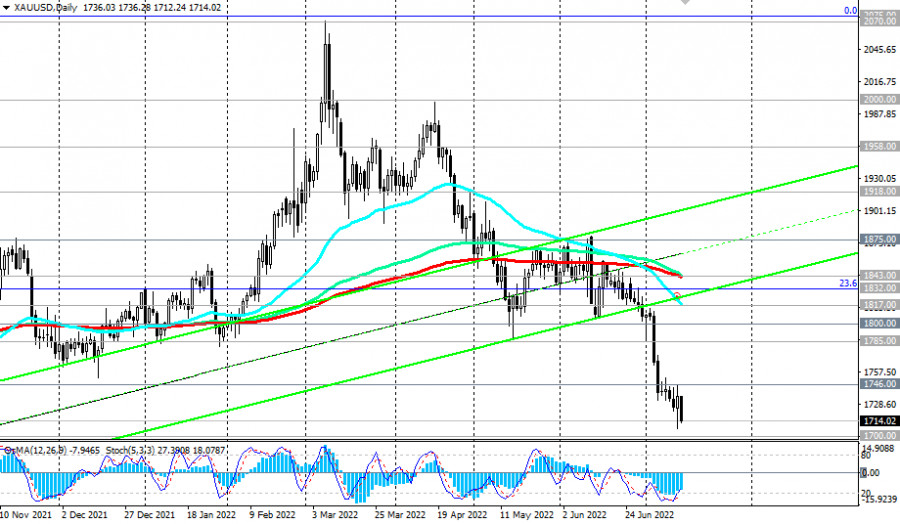
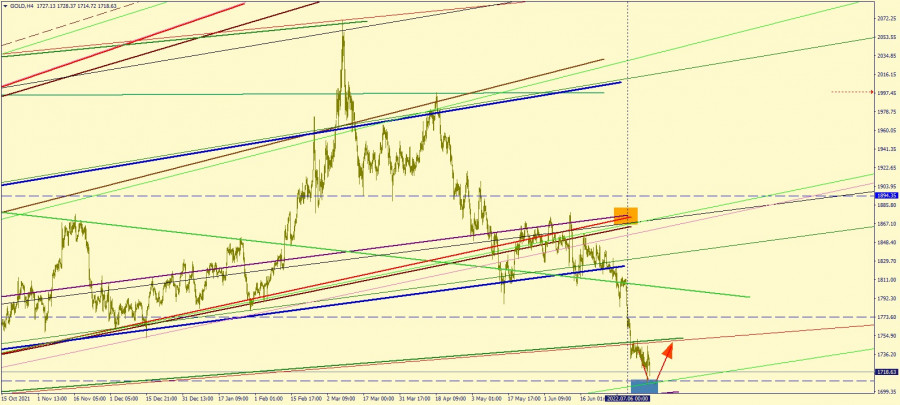
| Technical analysis of gold and platinum Posted: 14 Jul 2022 04:55 AM PDT Gold (#GOLD):
The chart shows the current movement of gold in the 4-hour (H4) chart. Yesterday, July 14, gold tested a new support level located at $1705.0. It then rose to the resistance level of $1754.0 (represented by the green sloping line), before returning to the support level. The metal may linger around the area of the support and resistance levels. A breakdown of $1747.0 -1750.0 may lead to a test of $1773.0, while the breakdown of the support level will result to a test of the lower level at $1670.0. Platinum (#PLF):
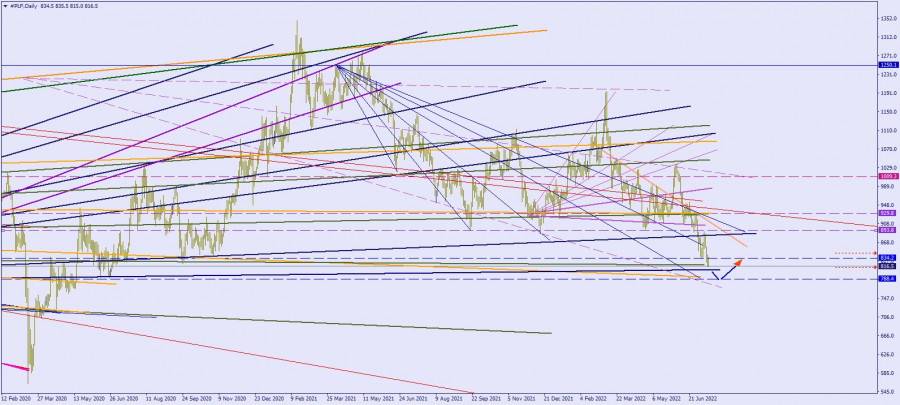
The chart shows the current movement of platinum in the daily (D1) chart. The metal continues to decline to $788.0, which can be considered as a key support level and a possible trend reversal. A breakdown of this level will continue the trend to $747.0. As far as we know, the cost of producing platinum from different producers is around $830.0. In this case, sellers will stop until the spot market for secondary platinum becomes scarce. The material has been provided by InstaForex Company - www.instaforex.com |


| You are subscribed to email updates from Forex analysis review. To stop receiving these emails, you may unsubscribe now. | Email delivery powered by Google |
| Google, 1600 Amphitheatre Parkway, Mountain View, CA 94043, United States | |


Comments