Forex analysis review
Forex analysis review |
- EUR/USD. Preview of the week. ECB report, Fed and Nonfarm report
- How to trade GBP/USD on July 4? Simple tips for beginners.
- How to trade EUR/USD on July 4? Simple tips for beginners.
- EUR/USD. Key inflation reports of the week: more questions than answers
- The dollar's hands are untied
- AUD/USD: Aussie is sinking and there is no lifeboat on the horizon
| EUR/USD. Preview of the week. ECB report, Fed and Nonfarm report Posted: 03 Jul 2022 07:46 AM PDT The euro-dollar pair, following last week's results, failed to settle within the 3rd figure. The price repeatedly plunged under the level of 1.0400 for two days - on Thursday and Friday, amid a general strengthening of the US currency. But the EUR/USD bears failed to develop a downward attack. As soon as the pair began to approach the levels of five-year lows (1.0340-1.0350), the downward dynamics faded. Traders took profits, reasonably doubting that the pair would overcome such a powerful price outpost. Especially amid a slowdown in the growth of the core PCE index and disappointing data on the growth of the US economy (the final estimate of GDP growth for the first quarter was revised downward to -1.6%).
And yet, the mood for the pair still remains bearish. With all the doubts about the prospects for strengthening the greenback, traders for the most part treat the euro with even more skepticism. Last week's inflationary releases suggested that the European Central Bank would not raise interest rates at an aggressive pace. First of all, German inflation surprised: the report on the growth of the consumer price index in Germany unexpectedly came out in the red zone. All components of the release fell short of forecast levels, and the core CPI on a monthly basis even dropped into the negative area for the first time since January last year. People were also puzzled by the pan-European report. The general CPI in the euro area once again surprised with record growth, while the core index disappointed: for the first time in the last four months, it slowed down its growth. Following the release of this report, the EUR/USD pair tested the 3rd figure again, dropping to 1.0373 on Friday. In the context of the releases, the report on the ECB's June meeting was of particular interest, which will be made public on Thursday, July 7th. Here it should be noted that there is no consensus on the pace of tightening monetary policy among the members of the ECB. The only thing that can be said with certainty now is that at the July meeting the rate will be increased by 25 basis points. Future prospects look vague. Many currency strategists at major banks are pricing in a 50-point rate hike in September. However, ECB representatives are very cautious about such prospects. For example, ECB President Christine Lagarde said that the central bank can act "more decisively if the situation requires it." But at the same time, she did not voice the relevant criteria. Suppose the central bank is prepared to act "more decisively" if core inflation continues to slow down as headline CPI accelerates? In general, many representatives of the ECB continue to show indecisiveness on this issue. Executive Council member Fabio Panetta said on Friday that the normalization of monetary policy "should remain gradual." According to him, after the rate hike to zero, further adjustments "will depend on the development of the outlook." If the minutes of the June meeting of the members of the ECB Governing Council also reflect their indecision (on how to proceed after the July increase), the euro will come under additional pressure. Another important document that could provoke increased volatility for the EUR/USD pair will be published on Wednesday. We're talking about the Federal Reserve minutes. The minutes of the June meeting should show how determined the Fed is about moving forward. It is known that at the July meeting the central bank will decide whether to raise the rate by 75 points (as in June) or by 50. It is also known that the decision on the 75-point increase was not unanimous: the head of the Kansas Federal Reserve City Esther George. After the June meeting, Fed Chairman Jerome Powell, speaking in the US Congress, voiced a rather interesting phrase: "the pace of further rate hikes will continue to depend on incoming data and changing economic conditions: the Committee will make a decision from meeting to meeting." These words put pressure on the greenback. If the Fed's minutes reflect the more hawkish sentiment of the majority of the committee members, the dollar will gain support. Otherwise, EUR/USD bulls can count on a corrective price increase. The most important macroeconomic report of the week for traders of the pair will be the Nonfarm data, which will be published on Friday, July 8. Here it is worth recalling that the key components of the previous (May) release did not disappoint, but did not impress market participants either. The main indicator - the unemployment rate - was in the red zone. However, here it is necessary to take into account the fact that this component of the release disappointed only by the fact that it came out at the level of the previous month, that is, at around 3.6% (instead of the predicted decline to 3.5%). The average hourly wage rose by 5.2% in May (year-on-year). On the one hand, this is a fairly good result, but on the other hand, the growth rate of this indicator is slowing down for the second consecutive month. The number of people employed in the non-agricultural sector increased by 390,000 in May, while experts expected to see this indicator slightly lower, at around 325,000. According to the general forecast, the June labor market indicators will also demonstrate a contradictory result. The growth rate in the number of employees should rise to 290,000, although the growth rate of the average hourly wage on an annualized basis may slow down to 5.0% (in this case, there will already be a steady downward trend). The unemployment rate, in turn, should fall to a two-year low of 3.5%. Among the main macroeconomic reports of the week, we should also highlight: the European producer price index (Monday), the change in the volume of factory orders in the US (Tuesday), the index of business activity in the services sector from ISM, (Wednesday) a report from the ADP agency (Thursday). In general, in my opinion, traders of the EUR/USD pair will again try to settle in the area of the 3rd figure next week. But a powerful informational occasion is needed to move below 1.0350 (the price low of the current year) - otherwise, the downward momentum will fade when approaching the middle of the third figure. Therefore, any corrective bursts of price should be used to open short positions with fairly modest price targets: 1.0400 and 1.0360-1.0370. The material has been provided by InstaForex Company - www.instaforex.com |
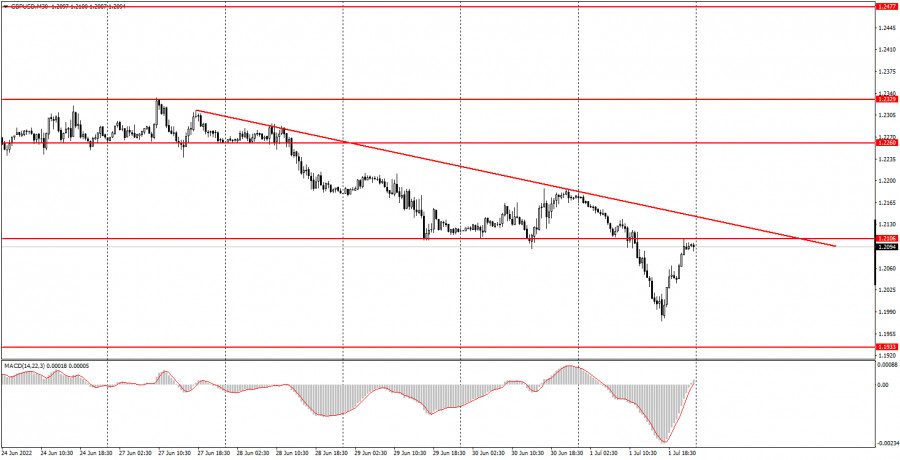
| How to trade GBP/USD on July 4? Simple tips for beginners. Posted: 03 Jul 2022 07:29 AM PDT Analysis of Friday's deals:30M chart of the GBP/USD pair
The GBP/USD pair also traded down most of the day on Friday. It should be noted right away that if there were reasons for the euro to fall, since the inflation report again showed its acceleration, then there were no macroeconomic statistics for the pound, at least in the first half of the day. Nevertheless, the British currency started to decline at night and fell by 200 points, which is a lot even for it, especially given the lack of macroeconomic and fundamental backgrounds. The pair managed to recover slightly during the US trading session, which was triggered by a weak ISM business activity index in the manufacturing sector. It fell from 56.1 to 53.0, so the US dollar had a reason to fall after the release of this report. As a result, the pound/dollar pair showed strong volatility almost out of the blue. The downward trend has resumed, but the pound has stopped a step away from updating its 2-year lows. Thus, the technical picture for the euro and the pound is still actually the same. 5M chart of the GBP/USD pair
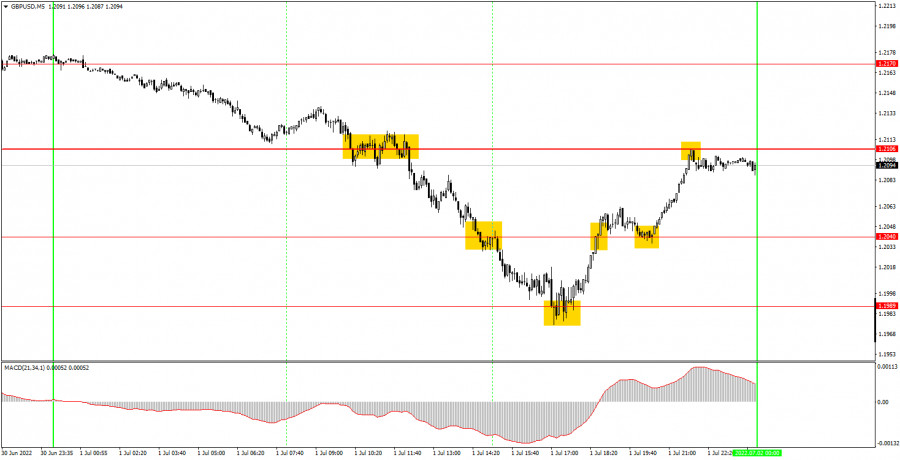
Friday's trading signals were almost perfect on the 5-minute time frame. First, the price overcame the level of 1.2106, after which it fell right down to the level of 1.1989. The downward movement was practically recoilless and naturally it should have been worked out with a short position. When the pair rebounded from the 1.1989 level, it should have been closed and a long position taken. In total, it was possible to earn about 90 points on a short position. Then the price began a rather strong growth and overcame the level of 1.2040 on the way up to the level of 1.2106. Traders could decide for themselves where to close the long position, since this only affected the level of their profit on the second transaction. At least 50 more points could be earned on it. Thus, although the high-volatility movements on Friday were practically unfounded, the presence of a trend once again helped novice players make good money. Once again, we remind you that trading on a trend movement is always good. How to trade on Monday:The pair formally started a new downward trend on the 30-minute timeframe this week. In the case of the pound, it was possible to form a downward trend line, which visualizes the trend. If the pair settles above it, then the downtrend can be considered completed (it can also be short-term). Otherwise, the pair will continue to seek to renew its 2-year lows around 1.1933. On the 5-minute TF on Monday, it is recommended to trade at the levels of 1.1933, 1.1989, 1.2040, 1.2106, 1.2170, 1.2216, 1.2260. When the price passes after opening a deal in the right direction for 20 points, Stop Loss should be set to breakeven. Neither the US nor the UK has a single important or even interesting event scheduled for Monday. Thus, newcomers will have nothing to react to during the day. It is a holiday in the US on Monday, so many sites and all banks will be closed. This means that the volatility can drop a lot, and the pair is in a flat all day. Basic rules of the trading system:1) The signal strength is calculated by the time it took to form the signal (bounce or overcome the level). The less time it took, the stronger the signal. 2) If two or more deals were opened near a certain level based on false signals (which did not trigger Take Profit or the nearest target level), then all subsequent signals from this level should be ignored. 3) In a flat, any pair can form a lot of false signals or not form them at all. But in any case, at the first signs of a flat, it is better to stop trading. 4) Trade deals are opened in the time period between the beginning of the European session and until the middle of the American one, when all deals must be closed manually. 5) On the 30-minute TF, using signals from the MACD indicator, you can trade only if there is good volatility and a trend, which is confirmed by a trend line or a trend channel. 6) If two levels are located too close to each other (from 5 to 15 points), then they should be considered as an area of support or resistance. On the chart:Support and Resistance Levels are the Levels that serve as targets when buying or selling the pair. You can place Take Profit near these levels. Red lines are the channels or trend lines that display the current trend and show in which direction it is better to trade now. The MACD indicator (14,22,3) consists of a histogram and a signal line. When they cross, this is a signal to enter the market. It is recommended to use this indicator in combination with trend lines (channels and trend lines). Important speeches and reports (always contained in the news calendar) can greatly influence the movement of a currency pair. Therefore, during their exit, it is recommended to trade as carefully as possible or exit the market in order to avoid a sharp price reversal against the previous movement. Beginners on Forex should remember that not every single trade has to be profitable. The development of a clear strategy and money management are the key to success in trading over a long period of time. The material has been provided by InstaForex Company - www.instaforex.com |
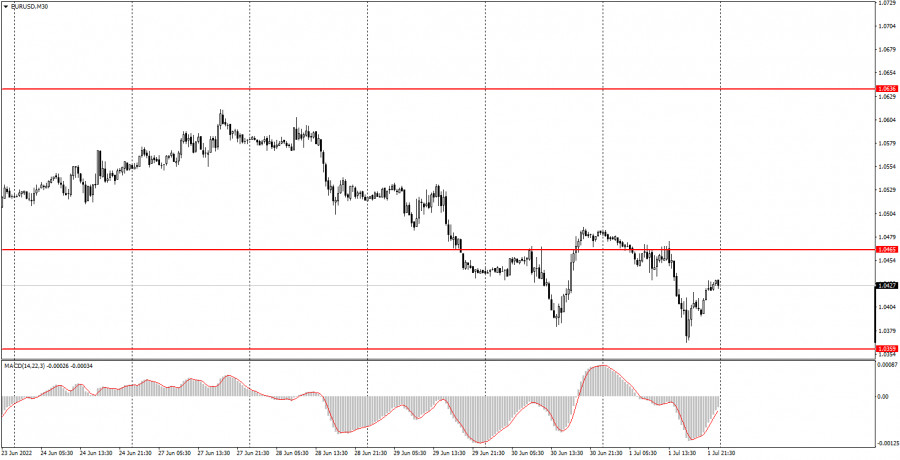
| How to trade EUR/USD on July 4? Simple tips for beginners. Posted: 03 Jul 2022 07:29 AM PDT Analysis of Friday's deals:30M chart of the EUR/USD pair
The EUR/USD currency pair resumed its downward movement on Wednesday after a correction on Thursday. Thus, after several weeks of actual sideways movement, the downward trend has resumed. At the moment, the pair's quotes are again approaching their local and 20-year lows, so they can be updated in the near future. The euro has not managed to correct normally over the past two months, but we have trends of a different scale on the 30-minute timeframe. And at the moment we have a new downward trend. It is not a fact that traders will be able to overcome the level of 1.0359 on the second attempt. Still, the pair is very low for itself, so some traders already doubt the expediency of short positions at such low price values. Nevertheless, the euro may continue to fall, as the vast majority of factors continue to work in favor of the dollar. By the way, the European Union released another report on inflation on Friday, which showed another acceleration in price growth. In the US, this would mean that the Federal Reserve would have to reconsider the pace of the rate hike, but this means nothing in the European Union, since the European Central Bank has not even raised the rate for the first time. Therefore, from our point of view, the euro's decline on Friday is logical. 5M chart of the EUR/USD pair
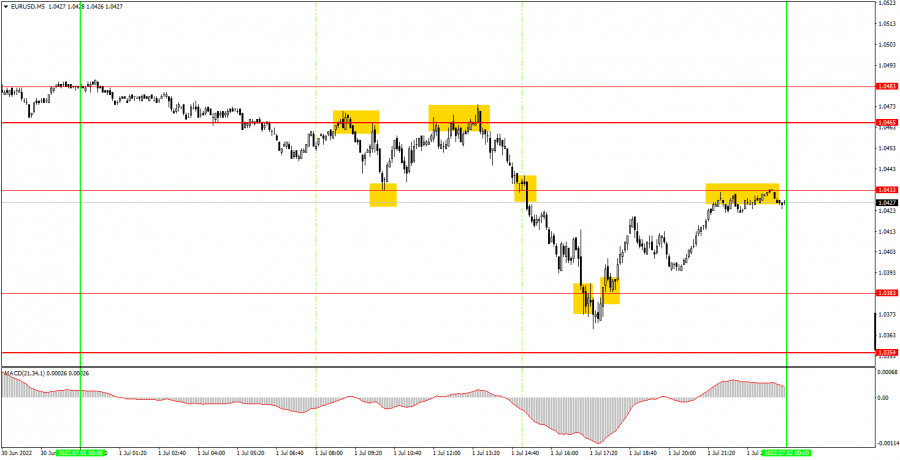
A huge set of trading signals were formed on the 5-minute timeframe on Friday. The movement was quite volatile. The first sell signal was formed near the level of 1.0465, after which the price dropped to the level of 1.0433 and rebounded from it. It was possible to earn about 10 points and it was necessary to open long positions immediately. Then the pair returned to 1.0465 and bounced off this level three times. Accordingly, longs should have been closed in profit for another 10 points and opened new shorts. The price began to fall and this time did not stop near the level of 1.0433, but continued to move to the downside and went even below 1.0383. Therefore, a short position should have been closed at the nearest buy signal, which was formed when consolidating above 1.0383. Beginners could earn about 70-80 points already on these three deals. The last signal for longs could also be worked out and it was also possible to make a profit, but it still formed quite late, so it could also be missed. How to trade on Monday:A new downtrend has formed on the 30-minute time frame, but there is still no trend line or channel, which makes trading a bit more difficult. If in the future the pair will trade in a trendy and volatile way, then it's okay, since you can earn money on a good movement simply by levels. On the 5-minute TF tomorrow it is recommended to trade at the levels of 1.0354, 1.0383, 1.0433, 1.0465, 1.0483, 1.0535. When passing 15 points in the right direction, you should set Stop Loss to breakeven. It is a public holiday in America in honor of Independence Day on Monday. Meanwhile, no important events are scheduled for this day in Europe either. Most likely, volatility will be very low tomorrow, and there will be no trend. Basic rules of the trading system:1) The signal strength is calculated by the time it took to form the signal (bounce or overcome the level). The less time it took, the stronger the signal. 2) If two or more deals were opened near a certain level based on false signals (which did not trigger Take Profit or the nearest target level), then all subsequent signals from this level should be ignored. 3) In a flat, any pair can form a lot of false signals or not form them at all. But in any case, at the first signs of a flat, it is better to stop trading. 4) Trade deals are opened in the time period between the beginning of the European session and until the middle of the American one, when all deals must be closed manually. 5) On the 30-minute TF, using signals from the MACD indicator, you can trade only if there is good volatility and a trend, which is confirmed by a trend line or a trend channel. 6) If two levels are located too close to each other (from 5 to 15 points), then they should be considered as an area of support or resistance. On the chart:Support and Resistance Levels are the Levels that serve as targets when buying or selling the pair. You can place Take Profit near these levels. Red lines are the channels or trend lines that display the current trend and show in which direction it is better to trade now. The MACD indicator (14,22,3) consists of a histogram and a signal line. When they cross, this is a signal to enter the market. It is recommended to use this indicator in combination with trend lines (channels and trend lines). Important speeches and reports (always contained in the news calendar) can greatly influence the movement of a currency pair. Therefore, during their exit, it is recommended to trade as carefully as possible or exit the market in order to avoid a sharp price reversal against the previous movement. Beginners on Forex should remember that not every single trade has to be profitable. The development of a clear strategy and money management are the key to success in trading over a long period of time. The material has been provided by InstaForex Company - www.instaforex.com |
| EUR/USD. Key inflation reports of the week: more questions than answers Posted: 03 Jul 2022 06:59 AM PDT The euro-dollar pair again tested the area of the 3rd figure at the end of the trading week. Such price dynamics are due to both the strengthening of the greenback and the weakening of the single currency. The rapid rise of the US dollar index, which again reached the 105th figure (for the first time since mid-June) on Friday, "redrew" the configuration of the main currency pairs of the major group. In the case of the EUR/USD pair, the latest report on the growth of inflation in the eurozone also made its contribution. The conflicting numbers of this release did not allow bulls to turn the tide in their favor. On the contrary, the report was interpreted against the euro, despite all its ambiguity. As a result, the bears seized the initiative and again appeared below the target of 1.0400, updating the two-week low along the way.
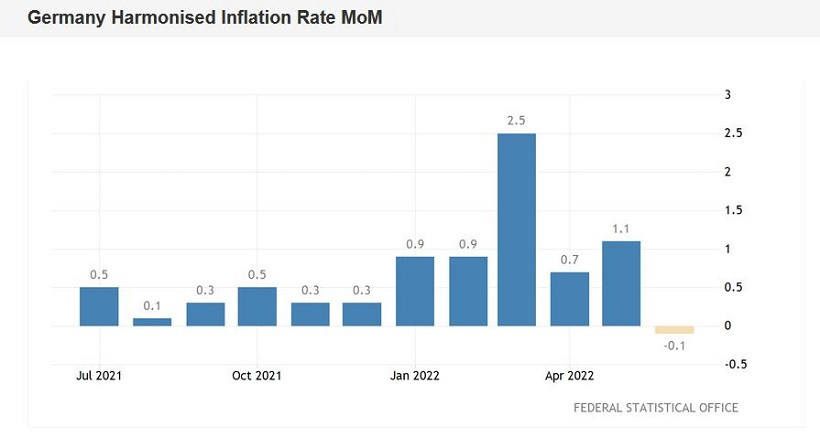
The first "alarm bells" for the euro sounded the day when data on the growth of the consumer price index in Germany were published. German inflation unexpectedly slowed down: all components of the release came out in the red zone, to the surprise of most experts. In annual terms, the overall CPI came out at around 7.6%, with an increase forecast to 8.0%. The June result unexpectedly reflected a slowdown in growth, instead of the predicted next spurt. On a monthly basis, the indicator also fell short of the forecasted values, being at 0.1% in June (after rising 0.9% in May). The Harmonized Consumer Price Index similarly came out in the red zone both in monthly and annual terms. By the way, on a monthly basis, the core index even dropped into the negative area (-0.1%) for the first time since January 2021.
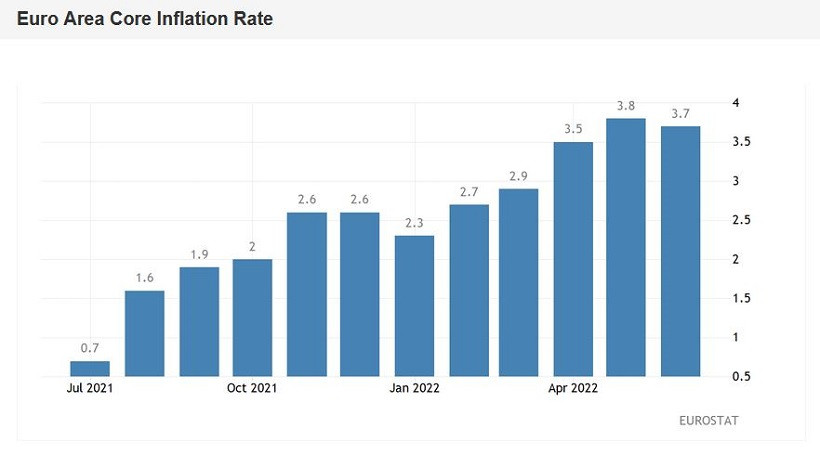
The report on the growth of German inflation, as a rule, outlines the approximate trajectory of pan-European figures. Therefore, such disappointing data put pressure on the EUR/USD pair. But the price eventually managed to stay within the 4th figure, due to the base price index for personal consumption expenditures in the US (PCE), which was also disappointing. The most important inflation indicator for the Federal Reserve has been slowing down for the third consecutive month. Price "swings" were observed throughout almost the entire week. The pair then fell to the area of the third figure, then rose to the boundaries of the 5th price level. It is noteworthy that both Fed Chairman Jerome Powell and European Central Bank President Christine Lagarde made it clear in their recent speeches that the pace of monetary tightening (by the Fed and the ECB, respectively) will depend on the dynamics of key inflationary indicators. In the case of the Fed, the choice is between a 50-point and 75-point rate hike. Whereas in the case of the ECB, a possible 50-point increase in the rate is at stake - in July or September. Given the fact that EUR/USD traders were disappointed by both German inflation and the PCE index, the price has not decided on the vector of its movement. For the development of the downward trend, the bears of the pair need to settle in the area of the 3rd figure (ideally, below 1.0360). The bulls of the pair, in turn, need to consolidate above the target of 1.0530 (the middle line of the Bollinger Bands indicator on the daily chart) in order to claim the area of the 6th figure. The latest report on the growth of European inflation had, so to speak, a "golden share": it could support both bulls and bears of EUR/USD. But this release also left more questions than answers. The overall consumer price index once again went into the green zone, reflecting a record increase. The indicator jumped to 8.6% - this is the highest value in the entire history of observations, that is, since 1997. However, the core index (excluding volatile energy and food prices) on an annualized basis unexpectedly slowed down its growth, being at around 3.7% instead of the planned growth to 3.9%.
In the face of weak German data, this circumstance was interpreted against the euro. Adding fuel to the fire was Fabio Panetta, a member of the ECB's executive board, who said that the normalization of the ECB's monetary policy "should remain gradual." According to him, after the rate hike to zero, further adjustments "will depend on the development of the outlook." This suggests that he favors a 25-point rate hike in July and September. Whereas market expectations are more hawkish, suggesting one 50-point rate hike in the July or September meeting. As a result, the scales tipped in the direction of the EUR/USD bears: the price renewed the two-week low, reaching 1.0373. At the same time, bears failed to overcome 5-year lows - especially after the release of the ISM manufacturing index, which fell to 53 points (the weakest result since July 2020). Thus, EUR/USD traders faced a real puzzle this week: inflation reports somewhere surprised, somewhere disappointed, both bears and bulls of the pair. Still, the pair remains bearish, with a 75-point Fed rate hike still highly likely, while the ECB is likely to look back at German inflation and core European inflation when discussing the September outlook (a 25-point rate hike in July has already been factored into prices). Therefore, any corrective surges in the pair are still advisable to use as a reason to open short positions. The first, and so far the main target is the level of 1.0350 (the lower line of the Bollinger Bands indicator on the D1 timeframe). The material has been provided by InstaForex Company - www.instaforex.com |
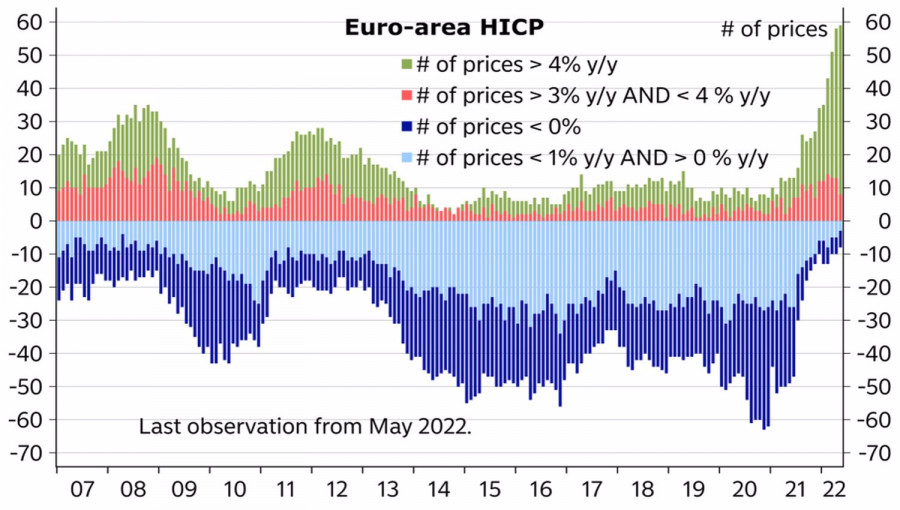
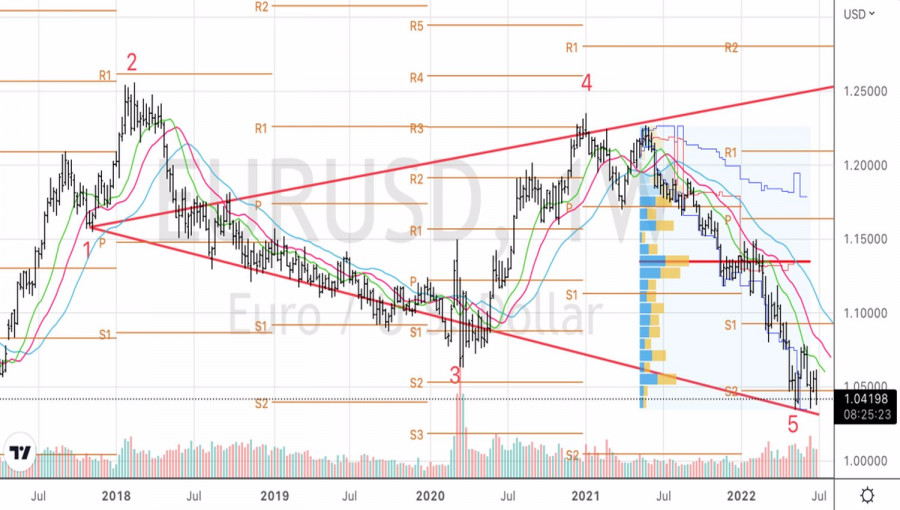
| Posted: 03 Jul 2022 06:33 AM PDT One black sheep spoils the whole flock. When even the shepherd does not know what to do. Bulls on EURUSD failed to take advantage of the favorable background and instead of continuing the attack started a week earlier, the main currency pair closed the five-day period by July 1 in the red zone. The main culprits were German inflation and European Central Bank President Christine Lagarde's lack of hawkish rhetoric in Sintra, Portugal. The euro started for health, and ended for peace. Fans of the single currency sincerely hoped that Lagarde would act in the style of Mario Draghi and not only promise that the central bank would do everything necessary to save the euro, but also hint at a 50 bp increase in the deposit rate in July. In fact, after Lagarde's speech, there was a feeling that she did not know what to do. Is it worth abandoning the plan announced earlier by the Frenchwoman to increase borrowing costs by 25 bp? At the next meeting of the Governing Council, followed by a rate hike above zero in September? Or step up hawkish rhetoric? The head of the ECB chose the first option and lost. More precisely, the bulls lost on EURUSD. The inflation data in Germany for June completed the debacle. Consumer prices unexpectedly slowed down to 8.2%, which was perceived by investors almost as a victory for the ECB. Which, by the way, has not yet begun to tighten monetary policy. Alas, German inflation is the exception, not the rule. Its counterparts in France accelerated from 5.8% to 6.5%, in Italy - from 7.3% to 8.5%, in Spain - from 8.5% to 10%, in the eurozone - from 8.1% up to 8.6%. At the same time, price pressure is getting wider, and a slowdown in the core CPI in the currency bloc from 3.8% to 3.7% is unlikely to calm the aggressive hawks of the ECB. Dynamics and structure of inflation in the eurozone
Across the Atlantic, the picture is different. The core US personal consumption spending index continues to slow down. It fell to 4.7% in May and is likely to fall below the Federal Reserve's forecast of 4.3% by the end of the year. The structure of inflation in the United States is fundamentally different from the European one, its main driver is domestic demand. Consequently, the Fed has much more room to curb high prices. And it is already showing. Another thing is how the labor market will react to the high inflation over the past four decades and the tightening of monetary policy.
The release of US employment data is the key event of the week by July 8th. Bloomberg analysts predict an increase of 295,000, the worst in the last 12 months. However, this is clearly better than before the pandemic. Coupled with unemployment remaining at around 3.6%, this gives the Fed a free hand in aggressively raising the federal funds rate. Technically, on the EURUSD weekly chart, the bulls' failure to win back the inner bar is a sign of their weakness. Consolidating below its lower limit at 1.046 suggests the bears' dominance and provides an opportunity for further short positions in the direction of 1.02. The material has been provided by InstaForex Company - www.instaforex.com |
| AUD/USD: Aussie is sinking and there is no lifeboat on the horizon Posted: 01 Jul 2022 03:28 AM PDT
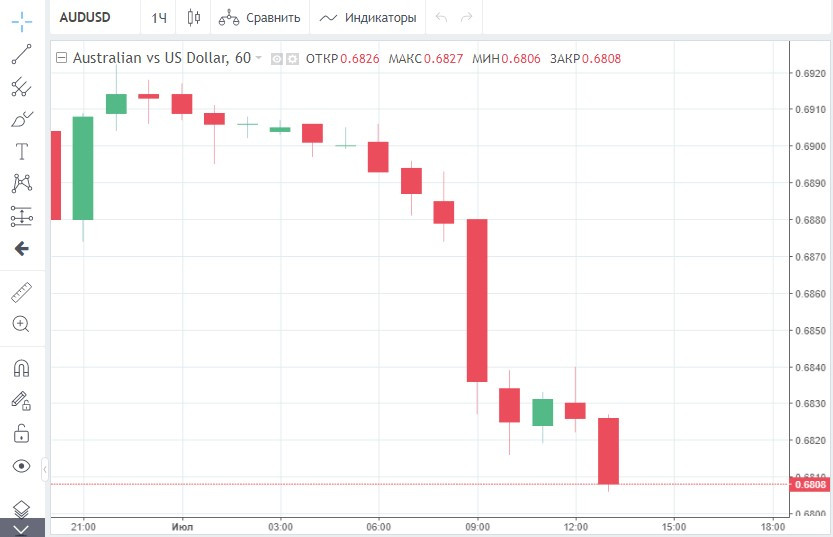
The Reserve Bank of Australia may raise rates by 50 bps again next week. But it seems that this time we should not expect a rapid growth of the Australian dollar. The forecasts for it are very negative. The AUD/USD pair fell at the beginning of Friday, testing new 2-year lows literally every hour.
Now the aussie stubbornly ignores any positive factors, focusing only on the negative – increasing fears about a slowdown in global economic growth. The AUD/USD pair is declining, even despite a significant increase in the index of business activity in the Australian manufacturing sector from S&P Global for June. As it became known, the indicator exceeded the initial forecast of 55.8 and reached 56.2, whereas in the previous month it was equal to 55.7. Also, the Australian currency does not benefit from the escalation of talk about the next RBA rate hike. Last month, the central bank surprised the markets with an unexpected increase in the indicator by half a percentage point at once. Investors now expect the Australian bank to also announce a 50bp rate hike next Tuesday. The aggressive course is dictated not only by the need to combat rising inflation, but also by the RBA's desire to reduce divergence with the policy of the Federal Reserve, which in June raised the indicator by 75 bps. Recall that last month, following the RBA, the New Zealand and Canadian central banks raised rates by 50 bps, not wanting to stay behind. As the Fed continues to struggle with price pressures, other major central banks, faced with rapidly rising inflation, will follow its example. According to the latest data, more than 60 regulators have already joined the global monetary race. Their further aggressive policy may provoke a global recession. The probability of a slowdown in global economic growth is now estimated at 85%. At the same time, many leading American banks predict a "significant risk" of a recession by mid-2023. Growing concerns about the global downturn have already led to strong sell-offs on global stock markets. Moreover, the current fall in stocks is much more serious and deeper than the pullback observed at the beginning of 2020, when the world was gripped by a coronavirus panic. The US S&P 500 index fell by a staggering 8.39% in June. And most experts do not see any signs of a bearish trend reversal yet. Amid gloomy market sentiment, the Australian dollar, which is considered a pro-cyclical currency, will not only not benefit from the upcoming rate hike, but may also show significant weakness. The material has been provided by InstaForex Company - www.instaforex.com |


| You are subscribed to email updates from Forex analysis review. To stop receiving these emails, you may unsubscribe now. | Email delivery powered by Google |
| Google, 1600 Amphitheatre Parkway, Mountain View, CA 94043, United States | |


Comments