Forex analysis review
Forex analysis review |
- July 15, 2022 : EUR/USD daily technical review and trading opportunities.
- July 15, 2022 : EUR/USD Intraday technical analysis and trading plan.
- July 15, 2022 : GBP/USD Intraday technical analysis and significant key-levels.
- Ichimoku cloud indicator analysis on Gold for July 15th, 2022.
- EURUSD breaks out of bearish short-term channel.
- Bitcoin approaching upper range boundary.
- AUDUSD close to providing a bullish signal.
- Bank of America stock price can soon provide reversal signal.
- US premarket on July 15: US stocks close slightly higher
| July 15, 2022 : EUR/USD daily technical review and trading opportunities. Posted: 15 Jul 2022 03:23 PM PDT
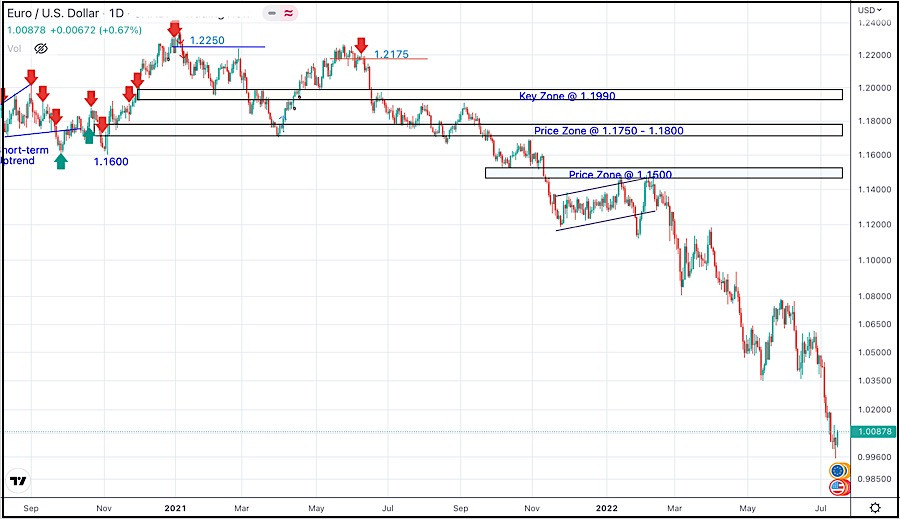
In late September, Re-closure below the price level of 1.1700 has initiated downside-movement towards 1.1500 where some recovery was witnessed. Shortly after, Price levels around 1.1700 managed to hold prices for a short period of time before another price decline took place towards 1.1200. Then the EURUSD has temporarily moved-up within the depicted movement channel until downside breakout occurred recently. Since then, the price zone around 1.1500 has applied significant SELLING pressure when a valid SELL Entry was offered upon the previous ascending movement towards it. Shortly after, the EURUSD looked oversold while approaching the price levels of 1.0800 few weeks ago. That's where the recent upside movement was previously initiated. However, the recent movement towards 1.1200 was considered for another SELL Trade which already reached its targets. Any ascending movement towards 1.0800 should be watched for selling pressure and a possible SELL entry. The material has been provided by InstaForex Company - www.instaforex.com |
| July 15, 2022 : EUR/USD Intraday technical analysis and trading plan. Posted: 15 Jul 2022 03:22 PM PDT
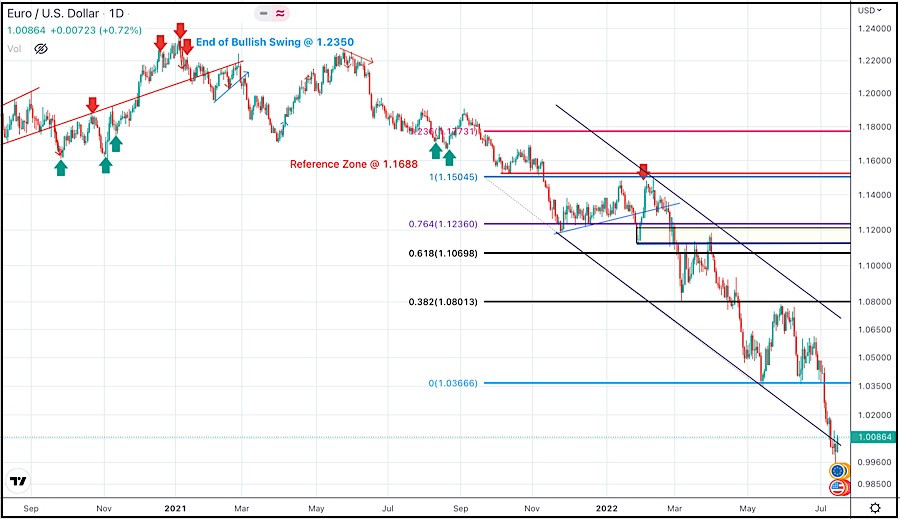
The EURUSD looked oversold while approaching the price levels of 1.0800. That's when a temporary upside movement was approaching the price levels around 1.1200. This recent movement towards 1.1200 was suggested for another SELL opportunity which already reached its targets beyond the price level of 1.0400. The previous ascending movement above 1.0600 enabled further advancement towards 1.0800 where evident bearish rejection arised again. The EURUSD pair had been trapped between 1.0350 (the newly recorded Low) and 1.0750 which corresponds to the nearest existing SUPPLY level until bearish breakout below 1.0350 was recently achieved. Currently, the EURUSD pair is approaching new price levels around 1.0000 that haven't been visited since 2002. That's where price action should be watched cautiously for significant bullish recovery especially around such an important psychological support. The material has been provided by InstaForex Company - www.instaforex.com |
| July 15, 2022 : GBP/USD Intraday technical analysis and significant key-levels. Posted: 15 Jul 2022 03:22 PM PDT
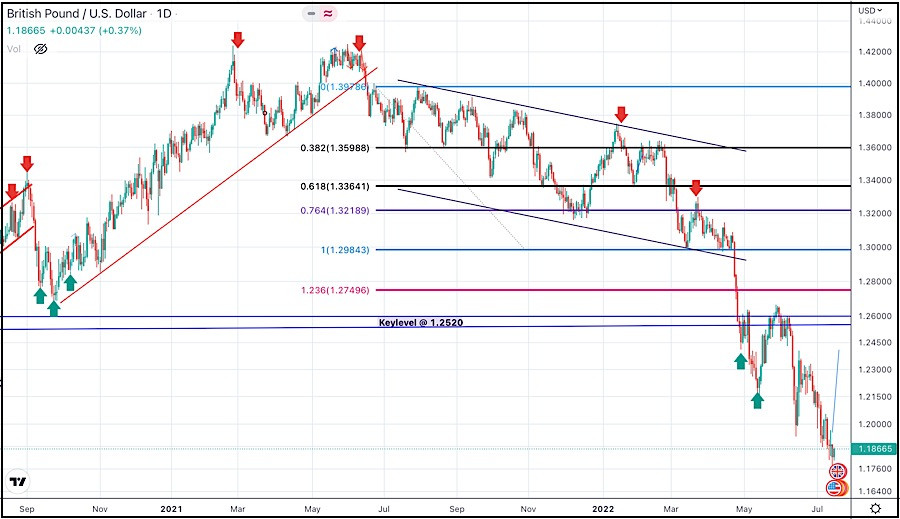
Recently, the GBP/USD pair remained under bearish pressure to challenge the new low around 1.2150 again which was temporarily bypassed few days go. Immediate bullish rejection was expressed around 1.1950 bringing the pair back above 1.2150 again towards higher price levels. Bullish persistence above 1.2300 (when achieved) will probably enable further bullish continuation towards 1.2550 and probably 1.2650 where further decisions can be taken. On the other hand, more bearish visits were expected to challenge the price level of 1.1950 when sufficient bearish momentum was expressed. Significant bullish recovery has been witnessed during the recent bearish dip that took place earlier two weeks ago. Currently the pair looks oversold while approaching these price levels. This favours the bullish scenario at least towards 1.2520 unless bearish persistence below 1.1900 is achieved towards 1.1650. The material has been provided by InstaForex Company - www.instaforex.com |
| Ichimoku cloud indicator analysis on Gold for July 15th, 2022. Posted: 15 Jul 2022 02:35 PM PDT
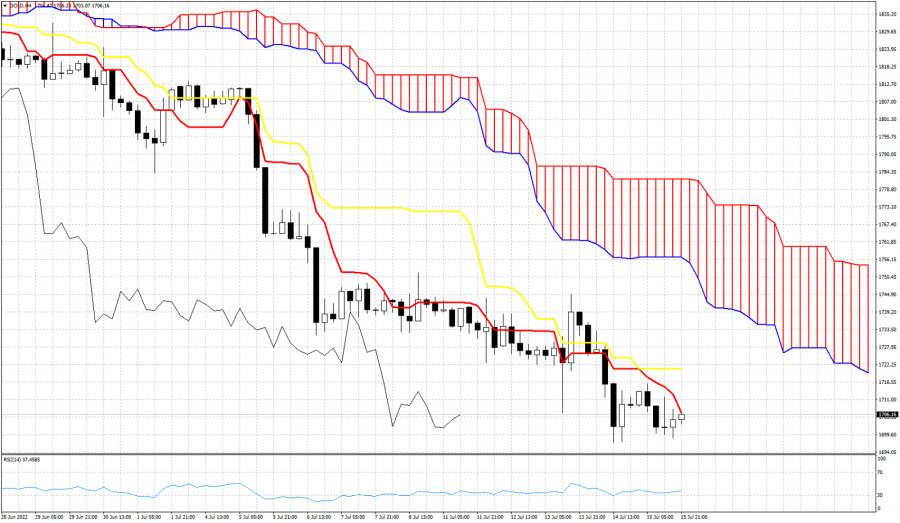
Gold price ended the week near its weekly lows. Trend remains bearish as price continues making lower lows and lower highs. In Ichimoku cloud terms trend remains bearish as price is below both the tenkan-sen and kijun-sen indicators. If bulls manage to push price above the tenkan-sen (red line indicator), then we will be expecting price to move higher towards $1,720 and $1,744. Current market conditions justify a reversal, but we have no confirmation yet. The material has been provided by InstaForex Company - www.instaforex.com |
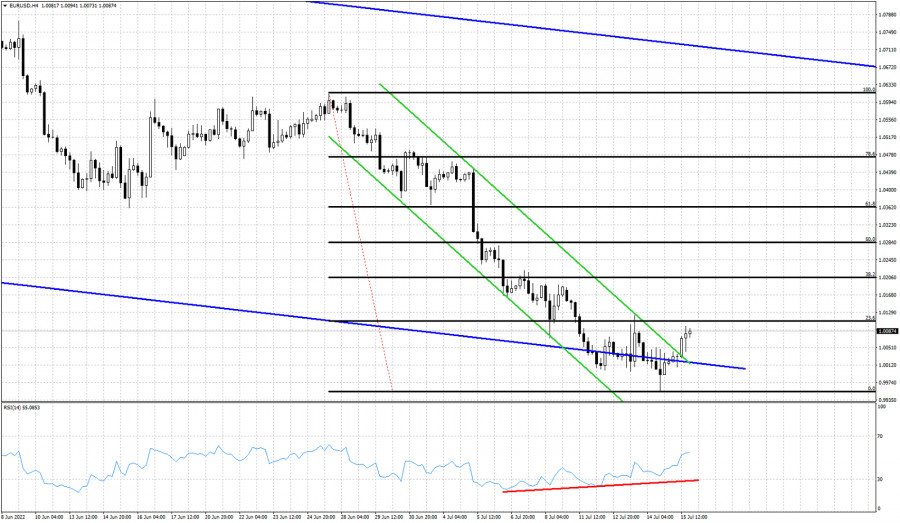
| EURUSD breaks out of bearish short-term channel. Posted: 15 Jul 2022 02:30 PM PDT
Red line- bullish RSI divergence Blue lines - medium-term bearish channl Green lines- short-term bullish EURUSD ended the week off its weekly highs. In the short-term price has broken above the downward sloping channel coming from 1.0615 and is bouncing off the weekly downward sloping channel as well. As we mentioned in previous posts, the bullish RSI divergence combined with a bounce off the lower boundary of the bearish channel were signs of a coming bullish reversal. Price is approaching the 23.6% Fibonacci retracement. If bulls manage to break above the first Fibonacci level, the second at 1.0205 should be reached soon after. The material has been provided by InstaForex Company - www.instaforex.com |
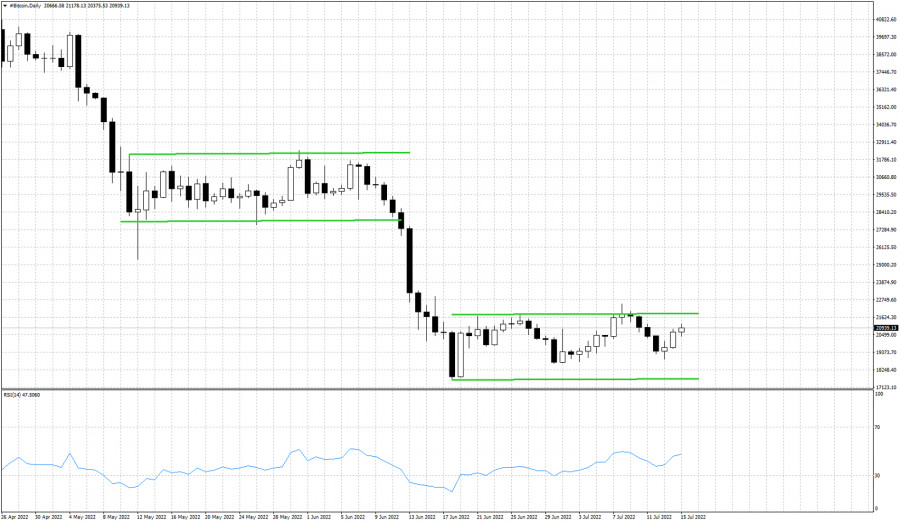
| Bitcoin approaching upper range boundary. Posted: 15 Jul 2022 02:24 PM PDT
Green lines- trading range Bitcoin is bouncing higher after making a low around $19,000. Price continues to trade inside the trading range its been for the last few weeks. As we said in a previous post, Bitcoin price formation is similar to the sideways action of May. Recent low at $18,900 is key short-term support. Failure to stay above this level will most probably lead price towards the lower range boundary at $17,635. A break below this boundary, will most probably push price to new lows for 2022. Resistance at $21,850 remains intact. So far we had two rejections. Bulls need to break above this level in order to change short-term trend. The material has been provided by InstaForex Company - www.instaforex.com |
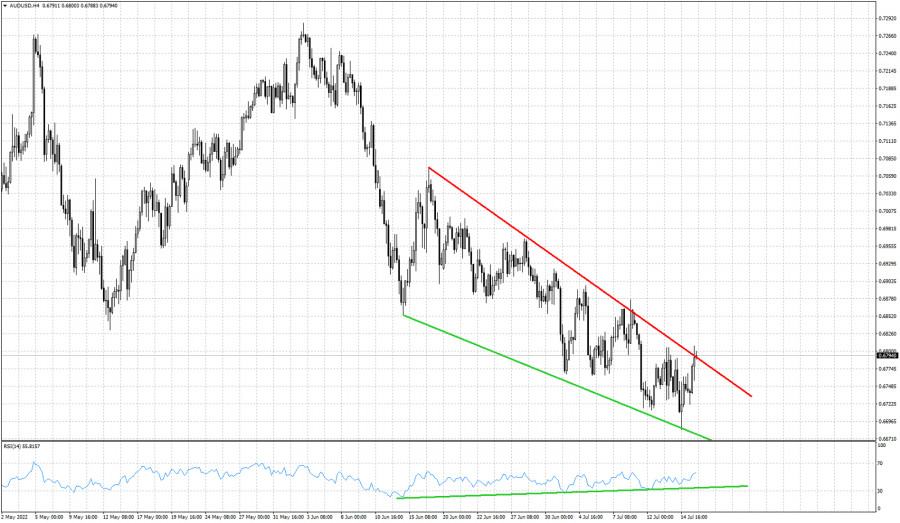
| AUDUSD close to providing a bullish signal. Posted: 15 Jul 2022 02:14 PM PDT
Green lines- bullish RSI divergence Red line- resistance trend line In previous posts we talked about the upside potential in AUDUSD and the possibility of a trend reversal given the warning from the RSI bullish divergence. Trend remains bearish as price continues to trade inside the downward sloping wedge pattern making lower lows and lower highs. AUDUSD ended the week right on top of the red resistance trend line. The first two sessions of next week will be very important. A rejection can bring AUDUSD towards 0.6620 but a break out above 0.6805 could lead to a bigger bounce towards 0.70 and higher. The material has been provided by InstaForex Company - www.instaforex.com |
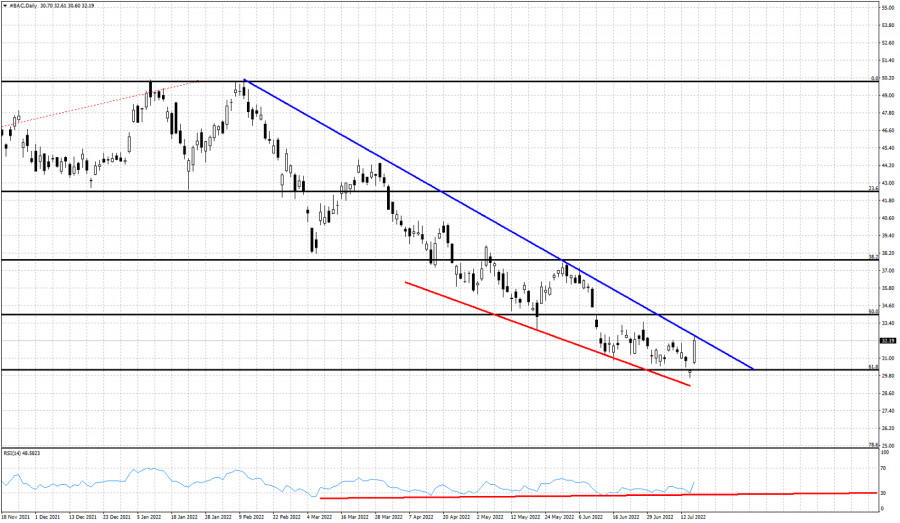
| Bank of America stock price can soon provide reversal signal. Posted: 15 Jul 2022 02:10 PM PDT
Red lines- bullish RSI divergence Blue line- resistance trend line Black lines- Fibonacci retracements BAC stock price ended the day on a very positive note +7% higher around $32.25. BAC is very close to providing a bullish reversal signal and start a move higher towards $37. Price is finding support at key Fibonacci level. Price has already retraced 61.8% of the rise from $18. The price technically remains in a bearish trend as price is making lower lows and lower highs. However the RSI has provided us with bullish divergence warnings. A reversal to the upside is very likely to be seen soon. The combination of the bullish RSI divergence and the bounce off the 61.8% Fibonacci retracement, increase the chances of a reversal to the upside. Price ended the week at $32.25 challenging the blue downward sloping resistance trend line. The material has been provided by InstaForex Company - www.instaforex.com |
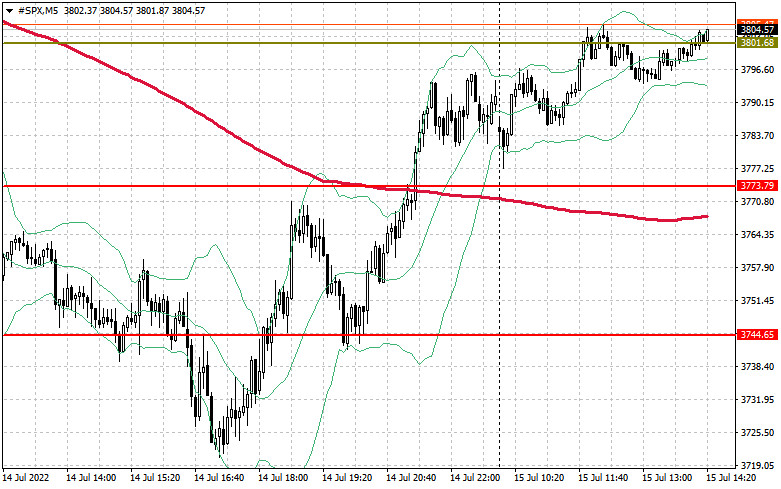
| US premarket on July 15: US stocks close slightly higher Posted: 15 Jul 2022 05:07 AM PDT US stock futures rose slightly on Friday as traders expect the release of strong corporate reports and key data that will outline the state of the US economy. Dow Jones Industrial Average futures added 79 points, or 0.24%. S&P 500 and Nasdaq 100 futures rose by 0.2% and 0.1% respectively.
Wells Fargo reported today that second-quarter earnings had dropped by 48% compared to 2021. Earnings per share were 74 cents and revenue was $17.03 billion below economists' estimates of $17.53 billion. The bank managers said that market conditions were the reason to record a $576 million loss related to its venture capital business. Last month, Wells Fargo executives announced that second-quarter mortgage revenues would drop by 50% from the first quarter as a sharp rise in interest rates curbed consumer purchasing power. Citigroup's report is due today. Yesterday, investors became disappointed after analyzing the data from JPMorgan Chase and Morgan Stanley. The large earnings of the banks did not favor the shares to hold their levels. Further US interest rate hike will lead to even larger bank profits. However, it may reinforce looming fears of economic recession. JPMorgan Chase stocks fell by 3.5% yesterday, while Morgan Stanley shares sank by 0.4% after traders reported weaker-than-expected investment banking earnings. The latest US inflation data confirmed the risk of the Fed's more aggressive rate hikes. Many Fed executives mentioned that the committee planned to fight further price pressures aggressively after it had been reported that US consumer prices had risen faster than forecasted, i.e. by 9.1% year-on-year. Investors are now betting that the Fed is likely to raise borrowing costs by 100 basis points at its July 26-27 meeting. It would be the biggest increase in history since the Fed began using interest rates to implement monetary policy in the early 1990s. A significant retail sales report for June as well as preliminary consumer sentiment data for July are due today. On the one hand, strong data will be favorable to US economy, but on the one hand they will hurt it as it will only increase inflationary pressures. Premarket Pinterest has already reported its results. Moreover, its stock added 14% on the premarket after it was reported that Elliott Management had bought more than 9% of the company's shares. Technical picture of S&P500 The situation stabilized after the major economic reports were released. This fact was the reason for reducing a rather strong drawdown. Currently, the buyers are mainly targeting the level of $3,801. Its break will end the current selling cycle, expecting a recovery to $3,835. The index will rise above this level to the area of $3,872, where major sellers will return to the market. However, some traders will probably try to lock in profit on long positions. The level of $3,975 will be considered a more distant target. In case of weak fundamental data and corporate reports, the buyers will have to defend the nearest support at 3,773. If they lose this level, the index will sink to the area of $3,773 and 3,774. A more stable level of $3,704 is lightly lower, where buyers will act more aggressively again. The material has been provided by InstaForex Company - www.instaforex.com |
| You are subscribed to email updates from Forex analysis review. To stop receiving these emails, you may unsubscribe now. | Email delivery powered by Google |
| Google, 1600 Amphitheatre Parkway, Mountain View, CA 94043, United States | |


Comments