Forex analysis review
Forex analysis review |
- Technical analysis of NZD/USD for March 03, 2022
- GBP/USD analysis. March 3. What did Powell say yesterday and what will he say today?
- EUR/USD analysis. March 3. Calm day, new falls
- Technical analysis of EUR/USD for March 03, 2022
- March 3, 2021 : EUR/USD daily technical review and trading opportunities.
- March 3, 2021 : EUR/USD Intraday technical analysis and trading plan.
- March 3, 2021 : GBP/USD Intraday technical analysis and significant key-levels.
- Bitcoin will now depend on the actions of the Fed
- GBP/USD Analysis for 3rd March, 2022
- EUR/USD Outlook for March 3, 2022
- Bitcoin has become protection against economic shocks for retail investors: how will this affect the cryptocurrency?
- The cryptocurrency market has moved to a decline
- Trading signals for GOLD (XAU/USD) on March 3-4, 2022: buy above $1,923 (symmetrical triangle - 21 SMA)
- Trading signals for Nasdaq-100 (#NDX) on March 3-4, 2022: sell in case of pullback at 14,544 (200 EMA)
- EUR/USD: US dollar and euro continue to fight while Fed and ECB choose between geopolitics and inflation
- Oil prices likely to skyrocket amid war in Ukraine, sanctions against Russia
- Cardano remains in a bearish trend.
- USDCAD still respects the long-term upward sloping trend line.
- Ichimoku cloud indicator analysis on EURUSD for March 3, 2022.
- Ichimoku cloud indicator analysis on Gold for March 3, 2022.
- Video market update for March 03,,2022
- BTC analysis for March 03,.2022 - Upside continuation in the play
- Analysis of Gold for March 03,.2022 - Key resistance at the price of $1.935 on the test
- European stock market declines sharply after strong gains on Wednesday
- GBP/USD update for March 03, 2022 - Buyers in control
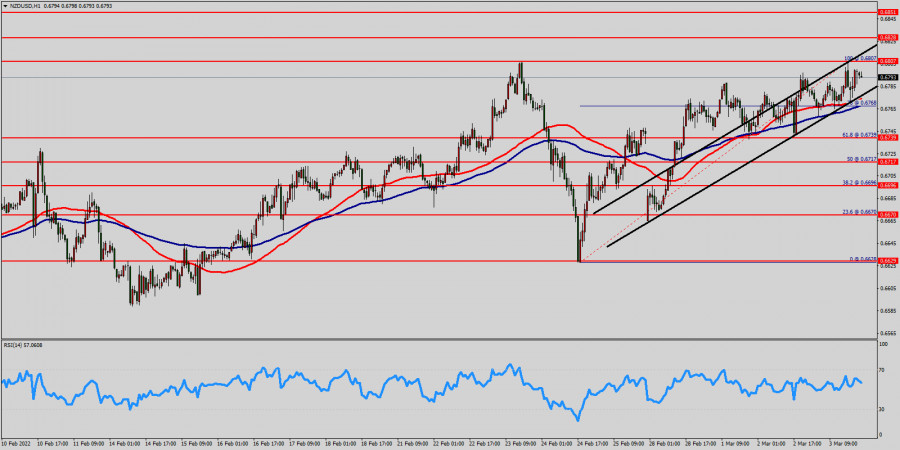
| Technical analysis of NZD/USD for March 03, 2022 Posted: 03 Mar 2022 02:03 PM PST
The NZD/USD pair faces resistance at 0.6807, while strong resistance is seen at 0.6851. Support is found at the levels of 0.6739 and 0.6717. Today, the NZD/USD pair continues to move downwards from 0.6807 level. The pair fell from 0.6807 level to the bottom around 0.6739 (first support). The 0.6807 level is expected to act as minor support. Hence, we expect the NZD/USD pair to continue moving in the bearish trend from 0.6807 level towards the target at 0.6717. In the long term, if the pair succeeds in passing through 0.6717level, the market will indicate the bearish opportunity below 0.6717 level in order to reach the second target at 0.6670 in the H1 time frame. However, the 0.6670 mark remains a significant support zone. Thus, the trend will probably rebound again from 0.6670 level as long as this level is not breached. Briefly; the market will indicate a bearish opportunity below the strong resistance level of 0.6807 (the level of 0.6807 coincides with the ratio of 100% Fibonacci retracement). Since there is nothing new in this market, it is not bullish yet. Sell deals are recommended below the level of 0.6807 with the first target at 0.6739 so as to test the double bottom. If the trend breaks the double bottom level of 0.6739, the pair is likely to move downwards continuing the development of a bearish trend to the level of 0.6670 in order to test the weekly support 3. The material has been provided by InstaForex Company - www.instaforex.com |
| GBP/USD analysis. March 3. What did Powell say yesterday and what will he say today? Posted: 03 Mar 2022 01:55 PM PST
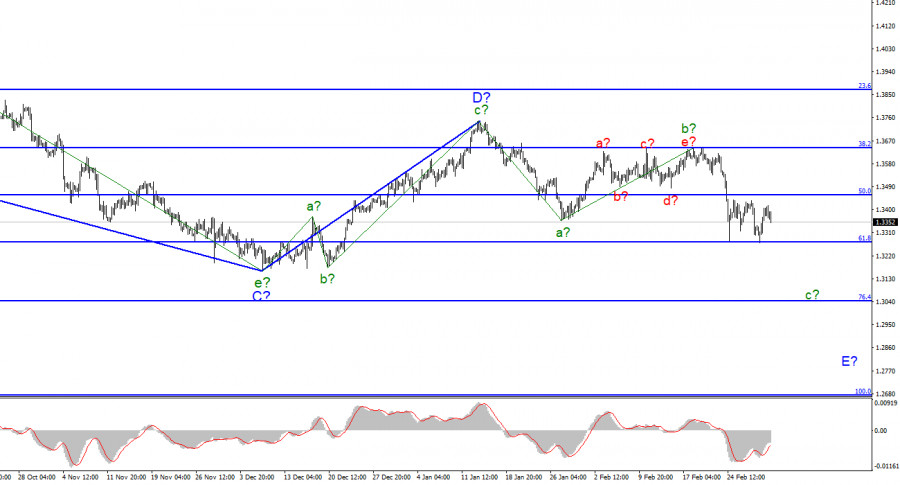
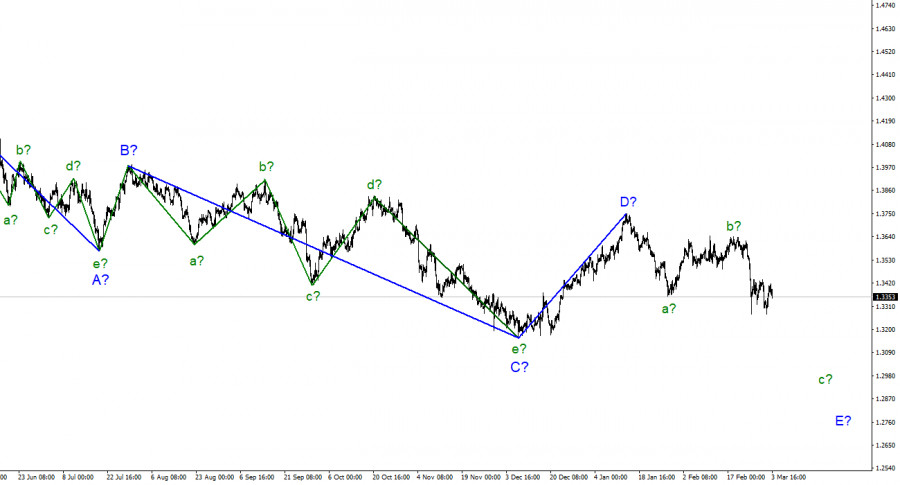
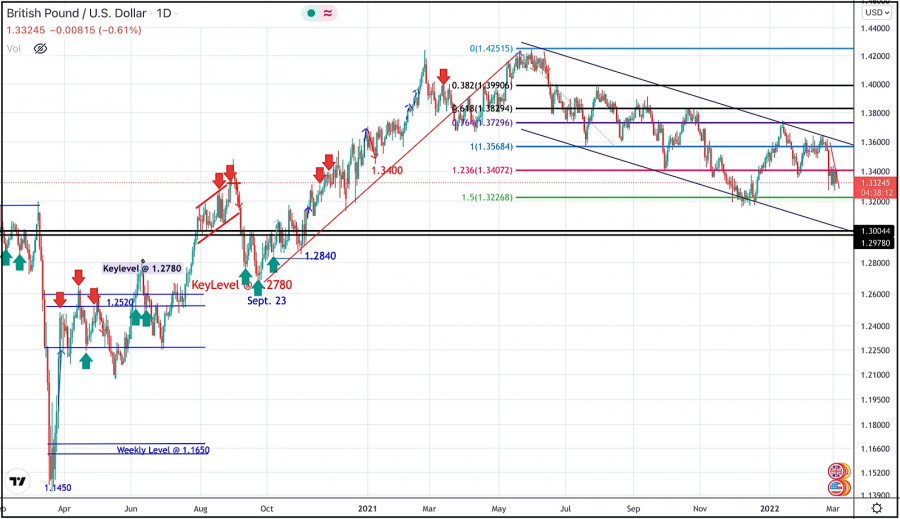
For the pound/dollar instrument, the wave counting continues to look very convincing, although rather complicated. Estimated wave b in E of the downward trend became much more complicated, but after several unsuccessful attempts to break through the level of 1.3642, it still ended. The decline in quotes over the past few days indicates a transition to the formation of wave c, which can also turn out to be quite extended. At the moment, the low of the expected wave a has been broken, so the construction of the downward trend section continues. And definitely within wave E. Thus, the entire downtrend has acquired a five-wave form, and its expected wave E should also acquire a five-wave form. Hence, adopt a rather lengthy structure. Two unsuccessful attempts to break through the 1.3272 mark led to a retreat from the lows reached, but it is unlikely that it will last long. Wave c in E does not look completed yet - it is too short, and the current news background may continue to increase demand for the dollar. Jerome Powell reported on a possible slowdown in the tightening of monetary policyThe rate of the pound/dollar instrument fell by 60 basis points on March 3. Over the past week, the pound managed to avoid serious losses, and yesterday it even rose by 80 points. But, as we all see, the UK currency is heading down again. Last night, Federal Reserve Chairman Jerome Powell made a speech, saying that because of the situation in Ukraine, geopolitical risks have seriously increased, and with them the risks for the US economy. He said that the Fed is starting a rate hike to fight high inflation, but he also warned markets that the hike could be smooth and unhurried. On the one hand, this is good. The US stock market can avoid a shock and a new collapse if the Fed acts cautiously. On the other hand, inflation is now the main problem of the United States. It is growing and will continue to rise, because at the moment nothing has been done to stop it from accelerating. The abandonment of the QE program is good, but it only means that billions of printed dollars will no longer flow into the American economy. But oil prices, on which a lot of things in our world still depend, continue to grow. Gas prices continue to rise. The isolation of Russia can lead to an even greater increase in energy prices, since it was from there that the lion's share of oil and gas was supplied to at least the EU countries. Thus, a smooth rate hike by the Fed is not exactly something that can quickly help to cope with high inflation. And "quickly" now means not even within a year, but at least for several years. Especially considering the "Ukrainian factor". After all, a month ago, no one even thought that a war would begin. And any war leaves an imprint on the economy and supply chains. Consequently, inflationary risks have increased even more. General conclusionsThe wave pattern of the pound/dollar instrument suggests the formation of wave E. The instrument made two unsuccessful attempts to break through the 1.3645 mark, which first led to the beginning of a new decline. Failed attempts to break through 1.3274 pushed the instrument back slightly up twice, but in general I advise selling with targets located near 1.3046, which corresponds to 76.4% Fibonacci, on MACD signals "down", as wave c in E doesn't look complete yet.
On the higher scale, wave D also looks complete, but the entire downward trend section does not. Therefore, in the coming weeks, I expect the instrument to continue to decline with targets below the low of wave C. Wave D turned out to be three waves, so I cannot interpret it as wave 1 of a new upward trend section. The material has been provided by InstaForex Company - www.instaforex.com |
| EUR/USD analysis. March 3. Calm day, new falls Posted: 03 Mar 2022 01:55 PM PST
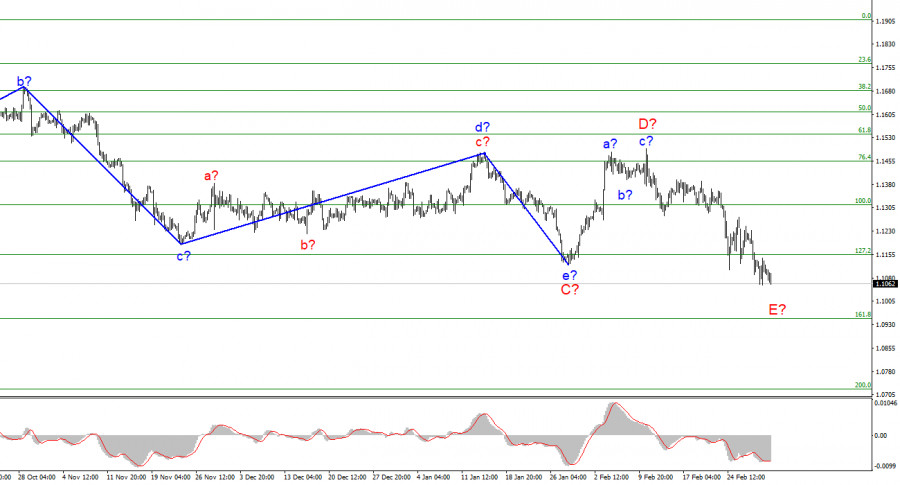
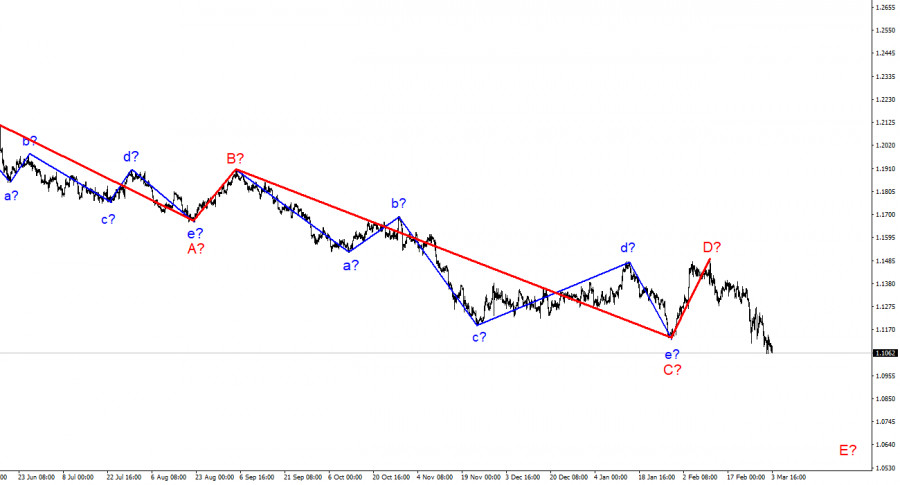
The wave marking of the 4-hour chart for the euro/dollar instrument has not changed lately and looks quite convincing. The European currency has been declining over the past few days, which is fully consistent with the current wave count. On Monday, it tried to stay afloat, but began to decline again on Tuesday. The current decline in quotes is interpreted as wave E, and this wave can turn out to be very long and strong. At the moment, I believe that wave D is over, and the news background frankly supports an increase in demand for the US currency. Based on this, I think that the probability that the instrument will continue building a downward wave is 80 percent. I give 20% of the probability that the entire wave counting will require additions and adjustments. However, now the mood of the market is affected only by the news background, which, unfortunately, is very sad. Therefore, I believe that the decline in the instrument will continue. Considering what is happening in Ukraine now, the whole wave counting can become very complicated. The markets did not pay attention to the statisticsThe euro/dollar instrument fell by 60 basis points on Thursday. Last night there was a slight recovery of the instrument, but it did not last very long. The market is still in a state of panic, no matter what anyone says. Now there is an opinion that European markets and US markets have already digested all geopolitics and are now ready to move in their usual mode. From my point of view, this is absolutely not true. Let me remind you that since the end of November 2021, the European currency has been diligently trying to complete the construction of the downward trend section, making it three waves. However, it was after the start of the military operation in Ukraine that the decline in quotes resumed, and at the moment the entire section of the trend should take on a five-wave form. Thus, the market simply lost faith in the fact that now it is possible to start building a new upward section of the trend and is fully tuned in to new short positions. The saddest thing is that the market practically does not react in any way to economic statistics, which nevertheless appear from time to time. Today in the European Union, the index of business activity in the service sector fell to 55.5 points, and the unemployment rate fell to 6.8%. In the near future, unemployment in the EU may continue to fall due to the influx of a huge number of refugees from Ukraine. However, this information did not help the euro. The markets didn't even pay attention to it. The same goes for the ISM Service PMI in the US. This index fell to 56.5 points in February, but the demand for the US currency still continues to grow. It does this at a leisurely pace, because the market has already gone through the "shock days". Now, at a slow pace, the demand for the dollar may continue to rise, and the entire wave E may take on a very long form. Federal Reserve Chairman Jerome Powell's speech, which pushed the euro to slightly rise yesterday, should also take place today. But it is unlikely that Powell will make dovish statements today, which will be enough to stop the new growth of the US currency. General conclusionsBased on the analysis, I conclude that the construction of wave D is completed. If so, now is a good time to sell the European currency with targets near 1.0949, which corresponds to 161.8% Fibonacci, on every MACD down signal. A successful attempt to break through 1.1154 indicates that the market is ready for new sales of the instrument.
On a larger scale, it can be seen that the construction of the alleged wave D has now begun. This wave may turn out to be a shortened or three-wave. Considering that all previous waves were not too large and approximately the same in size, the same can be expected from the current wave. There is every reason to believe that wave D has already been completed. Then the construction of wave E continues now. The material has been provided by InstaForex Company - www.instaforex.com |
| Technical analysis of EUR/USD for March 03, 2022 Posted: 03 Mar 2022 01:51 PM PST
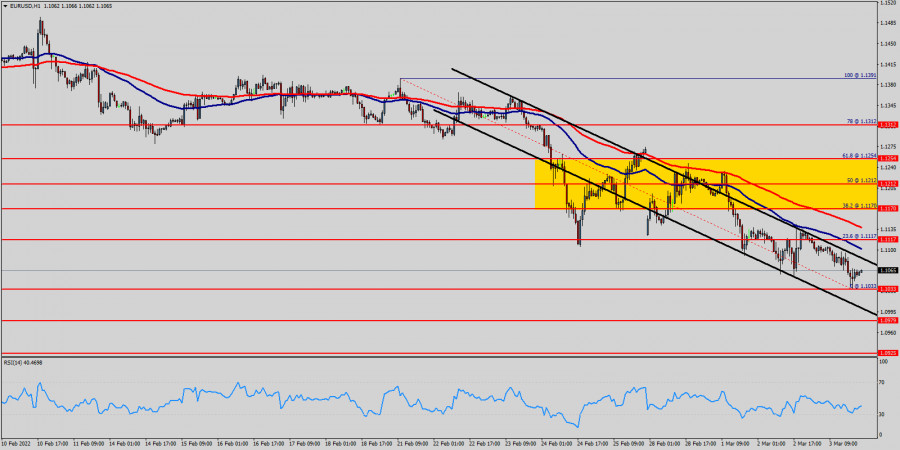
The EUR/USD pair continues moving downwards from the level of 1.1170 this morning. The bears must set below the area of 1.1170 so as to resume the up trend in coming hours. Today, the first resistance level is currently seen at 1.1170, the price is moving in a bearish channel now. According to the previous events, we expect the EUR/USD pair to trade between 1.1170 and 1.1030. So, the support stands at 1.1030, while daily resistance is found at 1.1170. Therefore, the market is likely to show signs of a bearish trend around the spot of 1.1170. In other words, sell orders are recommended below the spot of 1.1170 with the first target at the level of 1.1030 and continue towards 1.1003 in order to test the weekly support2on the H1 chart. On the other hand, if the EUR/USD pair fails to break through the weekly pivot point level of 1.1170 today, the market will move upwards continuing the development of the bullish trend to the level 1.1254 (double top). Trading recommendations :
Alternative scenario :
|
| March 3, 2021 : EUR/USD daily technical review and trading opportunities. Posted: 03 Mar 2022 09:32 AM PST
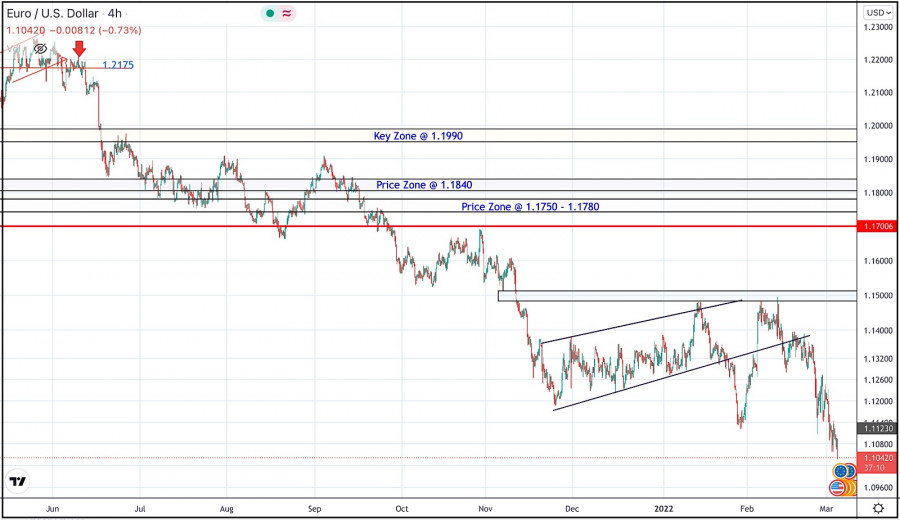
During the past few weeks, the EURUSD pair has been trapped within a consolidation range between the price levels of 1.1700 and 1.1900. In late September, Re-closure below the price level of 1.1700 has initiated another downside movement towards 1.1540. Price levels around 1.1700 managed to hold prices for a short period of time before another price decline towards 1.1200. Since then, the EURUSD has been moving-up within the depicted movement channel until bearish breakout occurred by the end of last week's consolidations. Few weeks ago, the price zone of 1.1350 failed to offer sufficient bearish rejection that's why it was bypassed until 1.1500 which applied significant bearish pressure on the pair. A possible SELL Entry was offered upon the previous ascending movement towards 1.1500. Any upside movement towards 1.1150 should be considered for another SELL trade. On the other hand, the EURUSD is currently oversold. Thus, any bearish trades should be discarded until considerable upside movement is demonstrated. The material has been provided by InstaForex Company - www.instaforex.com |
| March 3, 2021 : EUR/USD Intraday technical analysis and trading plan. Posted: 03 Mar 2022 09:29 AM PST
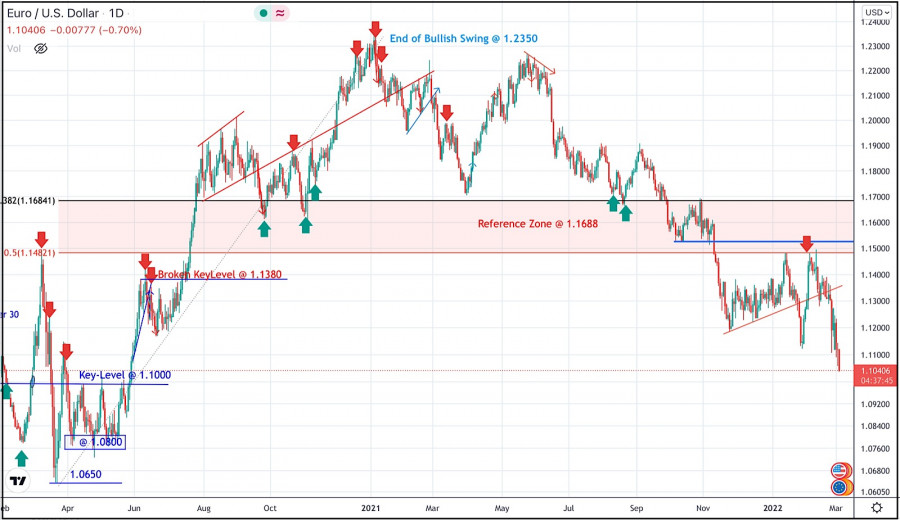
The bullish swing that originated around 1.1650 in August, failed to push higher than the price level of 1.1900. That's why, another bearish pullback towards 1.1650 was executed. However, extensive bearish decline has pushed the EURUSD pair towards 1.1600 and lower levels was reached. Shortly after, significant bullish recovery has originated upon testing the price level of 1.1570. The recent bullish pullback towards 1.1650-1.1680 was expected to offer bearish rejection and a valid SELL Entry. Significant bearish decline brought the EURUSD pair again towards 1.1550 levels which stood as an Intraday Support zone. Hence, sideway movement was demonstrated until quick bearish decline occurred towards 1.1200 where the current sideway channel was established. On the other hand, the price levels around 1.1520 stands as a reference zone that provides a valid SELL Entry when bullish momentum fades away. Bearish decline below 1.1300 should be considered as a bearish continuation sign. If so, downside movement should be expected to proceed towards 1.1000 then 1.0920 if sufficient bearish momentum is maintained The material has been provided by InstaForex Company - www.instaforex.com |
| March 3, 2021 : GBP/USD Intraday technical analysis and significant key-levels. Posted: 03 Mar 2022 09:27 AM PST
The GBPUSD pair has been moving within the depicted bearish channel since July. Bearish extension took place towards 1.3220 where the lower limit of the current movement channel came to meet with Fibonacci level. Conservative traders should have taken BUY trades around 1.3200 price levels as suggested in previous articles. Shortly after, BUYERS were watching the price levels of 1.3730 to have some profits off their trades as it stood as a key-resistance which offered significant bearish rejection recently. The short-term outlook turned bearish when the market went below 1.3600. This enhanced the bearish side of the market towards 1.3400 which brought the pair back towards 1.3600 for another re-test. Hence, the recent bullish pullback towards 1.3600 should have been considered for SELL trades as it corresponded to the upper limit of the ongoing bearish channel. It's already running in profits. Bearish persistence below 1.3400 is needed for further downside continuation while initial bearish target is located around 1.3200 then 1.3000 where the lower limit of the movement channel is located. On the other hand, please note that any bullish breakout above 1.3560 should be considered as exit signal. The material has been provided by InstaForex Company - www.instaforex.com |
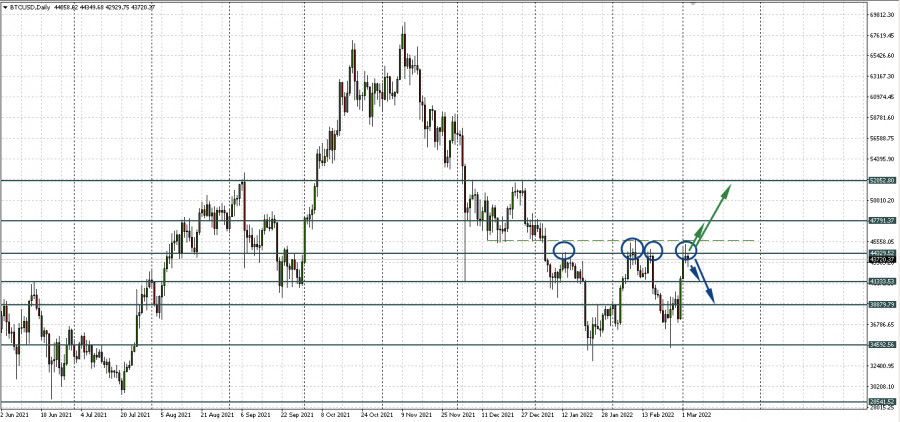
| Bitcoin will now depend on the actions of the Fed Posted: 03 Mar 2022 07:44 AM PST According to popular bitcoin analyst Bitcoin Jack, the main cryptocurrency could be a "good bet" for investors if the Fed does its best to keep the U.S. economy afloat from looming recession risks. The independent market analyst compared bitcoin, often referred to by enthusiasts as "digital gold," with the prospects for further quantitative easing by the U.S. Federal Reserve. He noted that the ongoing military standoff between Ukraine and Russia has strangled the supply chain for essential commodities such as oil and wheat, which could lead to higher global inflation. Where does the demand for Bitcoin come fromThe appetite for safe-haven assets was also the reason for the increase in demand for bitcoin earlier this week. On February 28, the price of BTC rose by just over 14.50% on the day, recording the biggest one-day gain in a year. The Arcane Research report claims that Ukrainians looking for "powerful fundraising tools" and Russians trying to bypass "the strictest capital controls in decades" were behind the BTC price spike. "This speculation may have contributed to the 15% increase in the bitcoin price over the past seven days," Arcane Research wrote on March 1, adding that BTCUSD could rise to $47,000 next time. Likewise, investment vehicles based on the main cryptocurrency saw $195 million in capital inflows from the beginning of the month to February 25, according to the latest report from CoinShares. The other side of the coin: the risk of a recessionHowever, recession risks continued to overshadow Bitcoin's upside potential. For example, Brian Coulton, chief economist at Fitch Ratings, predicted that core inflation would remain high throughout 2022, especially as the Ukrainian-Russian crisis exacerbated the risks of global price shocks. "If core inflation remains high and inflation expectations rise the Fed, and the BOE could be left with no choice but to quickly move rates to neutral or restrictive levels," he wrote, adding that the Fed rate could reach 3% by end of 2022. Bet on resistanceNow the horizontal 44,329.52 remains a strong resistance level for BTCUSD. On the daily chart, we see several bounces down from it. It is worth noting that the double bottom reversal pattern, which was mentioned in yesterday's review, has the other side of the coin. A third bottom can be drawn from it. A triple bottom, by the way, is also a reversal signal. An upward price impulse is possible after a clear breakdown of the resistance level of 44,329.52 and consolidation above it.
|
| GBP/USD Analysis for 3rd March, 2022 Posted: 03 Mar 2022 07:33 AM PST
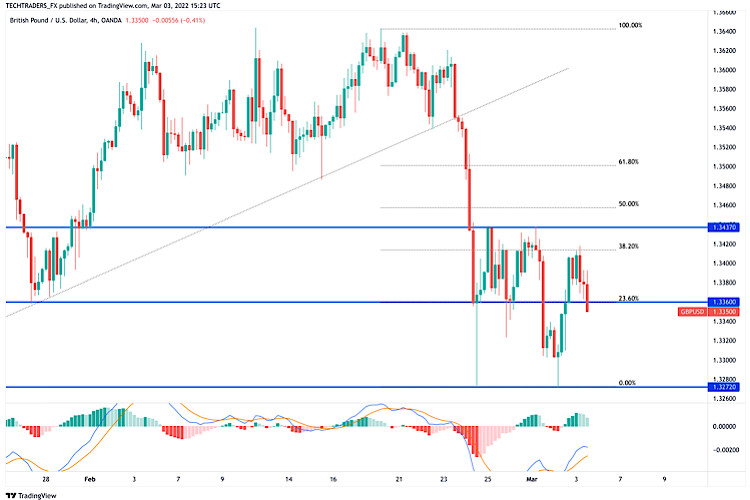
GBP/USD lost its traction during the European trading hours following a recovery attempt above 1.3400 earlier in the day. Ahead of Russia-Ukraine talks and FOMC Chairman Powell's testimony, the souring market mood is helping the dollar gather strength against its rivals. The static resistance that seems to have formed at 1.3430 stays intact and buyers are unlikely to show interest in the pair unless it manages to flip that level into support. On the downside, interim support is located at 1.3350 ahead of 1.3300 (psychological level) and 1.3270 (static level). A daily close below the latter could be taken as a strong bearish sign and open the door for an extended slide toward 1.3200 (psychological level). On the flip side, 1.3450 (50-period SMA on the four-hour chart) and 1.3500 (psychological level, 100-period SMA, 200-period SMA) align as next hurdles above 1.3430. The material has been provided by InstaForex Company - www.instaforex.com |
| EUR/USD Outlook for March 3, 2022 Posted: 03 Mar 2022 07:31 AM PST
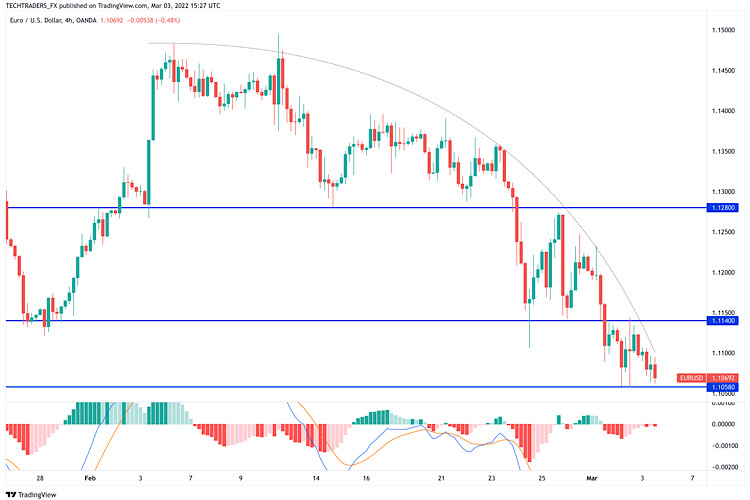
EUR/USD is trading around 1.1070, undermined by the persistent demand for the safe-haven US dollar. US Treasury yields stabilize at higher levels, as investors turn anxious amid the Russia-Ukraine war and ahead of round 2 of peace talks. The EUR/USD pair trades in the 1.1070 price zone and still looks bearish in its daily chart. It keeps developing far below its moving averages, which head firmly lower, reflecting prevalent selling interest. The Momentum indicator lost its bearish strength and consolidates near oversold readings, while the RSI indicator keeps heading south at around 32. The 4-hour chart shows that the pair remains below a firmly bearish 20 SMA, while technical indicators head lower within negative levels, lacking strength but still skewing the risk to the downside. The pair will likely pierce the 1.1000 threshold on a break below 1.1055, the immediate support level. Support levels: 1.1055 1.1010 1.0965 Resistance levels: 1.1135 1.1180 1.1220 The material has been provided by InstaForex Company - www.instaforex.com |
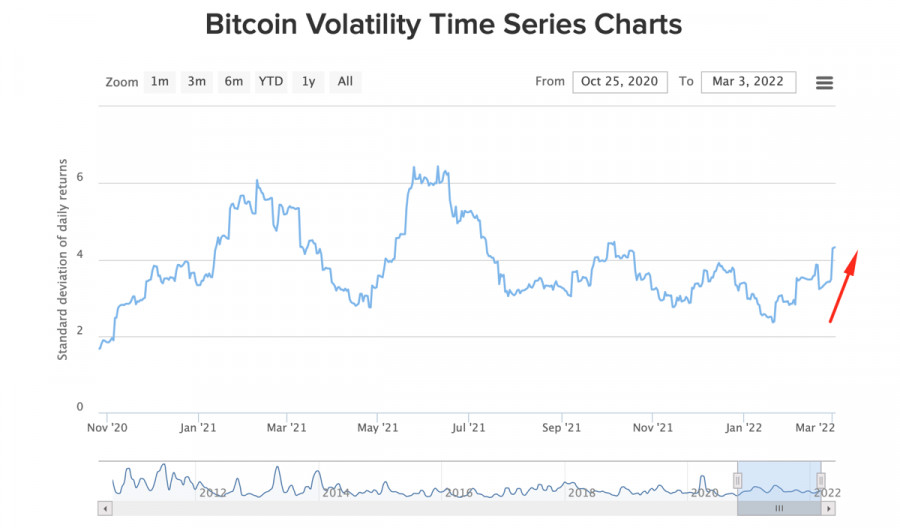
| Posted: 03 Mar 2022 07:25 AM PST Bitcoin has become a safe-haven for the capital of citizens of Ukraine and Russia, after the outbreak of the war of the latter. In an attempt to save their funds, investors of the two countries allowed Bitcoin to make a powerful bullish impulse, the analogs of which have not been observed for more than a year. Subsequently, the asset continued to grow and reached a local maximum of around $ 45k. But there is every reason to believe that as political tensions persist. Bitcoin has managed to make a significant step forward in terms of global recognition. First of all, the asset was used as an effective alternative to gold. The increased volumes of investments in cryptocurrencies on the territory of Ukraine and Russia are a clear confirmation of this. It is important to highlight here that retail investors, not institutional investors, have become the main audience of BTC. This gives a few facts to think about. First of all, the formed local upward trend is not supported by institutional activity, and therefore, as of March 3, it cannot be considered reliable. But at the same time, the influx of investments in Bitcoin from individuals leveled the achievements of the three-month correction. In mid-January, the number of "weak hands" and retail investors held no more than 10% of the total turnover. Thanks to this, it was possible to minimize the volatility of the cryptocurrency. Taking into account the influx of "retail refugees", the volatility of BTC and its sensitivity to macroeconomic events will increase significantly.
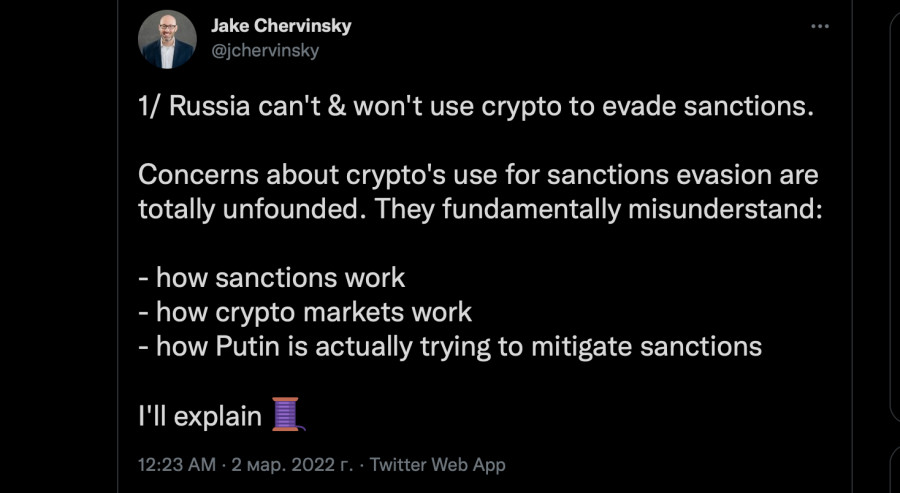
It is also important to note that, according to lawyer Jake Chervinsky, the trend of increasing bitcoin trading volumes will not continue. The expert attributes this to the lack of necessary infrastructure and disastrous sanctions for the Russian economy. In addition, Chervinsky is sure that the purpose of European and US sanctions is to prohibit any transactions with Russian counterparties. Many cryptocurrency exchanges already prohibit Russian citizens from using bank cards that have been sanctioned. Thus, the excitement of the first days will not turn into a long-term trend of converting all available funds into crypto assets.
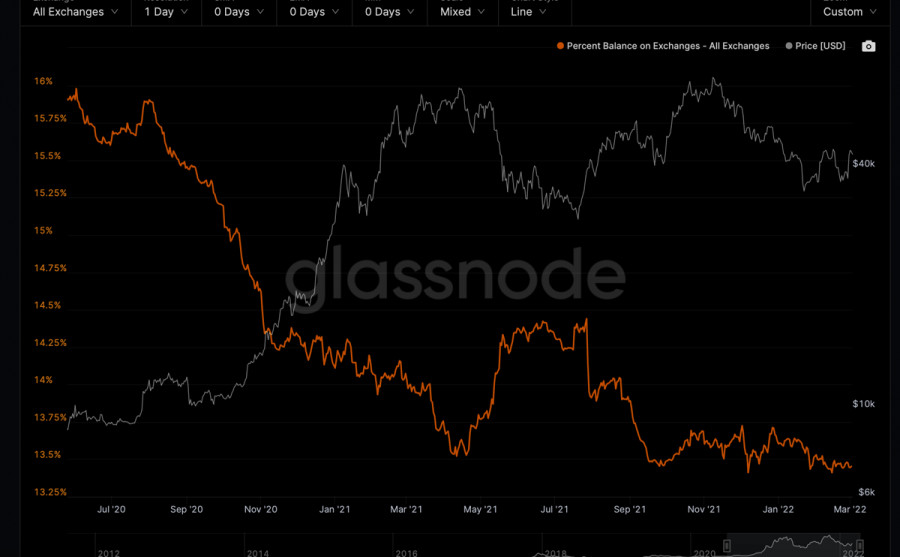
The combination of these factors makes it possible to assume that the current investment activity around Bitcoin is not capable of becoming the basis for a protracted bullish trend. I assume that the asset is waiting for a big "purge" as we approach the Fed meeting on March 16. Market makers need to collect liquidity by knocking out "weak hands" prone to panic transactions. At the same time, the situation around Bitcoin remains fundamentally positive. This is mainly confirmed by the preservation of the downward dynamics in the volume of coins on the exchange. The percentage of "weak hands" also could not reach a critical level, since on February 24, when the Russian Federation invaded the territory of Ukraine, Glassnode analysts did not record panic sales of Bitcoin. With this in mind, we can assume a slight decline in trading activity in mid-March, but this will not fundamentally affect the dynamics of the BTC movement.
In the medium term, there is no reason to believe that Bitcoin will update or approach the absolute maximum. A positive result for the cryptocurrency will be going beyond the range of $32k-$45k, and moving into the area of $46k-$57k. On the charts of the cryptocurrency, the formation of an inverted "head and shoulders" figure with a potential of $54k is already underway. But the pattern has been created by 60%, and therefore it is too early to talk about the real prospect of working it out. In the coming days, the asset will remain within the range of $42.8k-$45.2k. The material has been provided by InstaForex Company - www.instaforex.com |
| The cryptocurrency market has moved to a decline Posted: 03 Mar 2022 07:20 AM PST At the auction on Thursday, the value of the BTC is falling after an active growth at the beginning of the week. So, at the time of writing, the price of the first cryptocurrency has rolled back to around $ 43,700, having lost about 2% in a day. Leading altcoins willingly adopted the trend of the main virtual asset and began to decline spectacularly. So, over the past 24 hours, the Avalanche coin has lost 5% of its value, Ethereum - 3.3%, and the price of Terra and XRP tokens has decreased by 1%. According to the world's largest aggregator of data on virtual assets CoinGecko, over the past day, the total capitalization of the crypto market has decreased by 2.5%. At the same time, the Bitcoin dominance index is near the level of 43.2%. The indicator of fear and greed decreased by 13 points to 29.
Digital gold began to show a turn to negative dynamics on the approach to the key resistance mark of mid-February - $ 45,000. In the past month, the main virtual asset could not cross this important level and began to roll back down. Despite the decline in the global cryptocurrency market on Thursday, Bitcoin trading volumes have grown significantly over the past week amid the military conflict between Ukraine and Russia. Thus, institutional investors and large asset holders (crypto-whales) are actively buying digital gold and looking for alternative instruments in the face of increasing geopolitical tensions in eastern Europe. According to CoinShares, over the past week, cryptocurrency funds recorded net inflows of private investment by $ 36 million, and since the end of January - by $ 239 million. On the last day of February, the value of the military-technical complex increased by more than 15% against the background of the announcement by the US Treasury Department of the imposition of sanctions against the Central Bank of the Russian Federation and the freezing of some assets of the country. Many European states have made similar decisions regarding Russia. Frightened by the harsh sanctions, the Russians began to withdraw ruble assets that were losing value and invest them in digital currencies. Thus, compared to the turbulence in the world's leading markets, the crypto market has not yet experienced serious losses and is becoming an attractive investment for individuals, businesses, and government agencies around the world. The advantageous position of the digital coin market allows experts to make the boldest predictions about its future. On the eve, the founder of the financial consulting and asset management company Devere Group, Nigel Green, said that every day the BTC is becoming more attractive for investments. This, in turn, strengthens Bitcoin futures ETFs and exchange-traded funds tied to digital assets. Green is confident that in the near future, the price of digital gold will permanently increase and by the end of March will reach $ 50,000. At the same time, the crypto expert emphasizes that the main secret of bitcoin's stability in the current crisis is its decentralization and protection from unauthorized access to the network. Institutional investors are increasingly acquiring cryptocurrencies, their trust in the BTC is permanently increasing, while the volatility of bitcoin, on the contrary, is constantly decreasing. The material has been provided by InstaForex Company - www.instaforex.com |
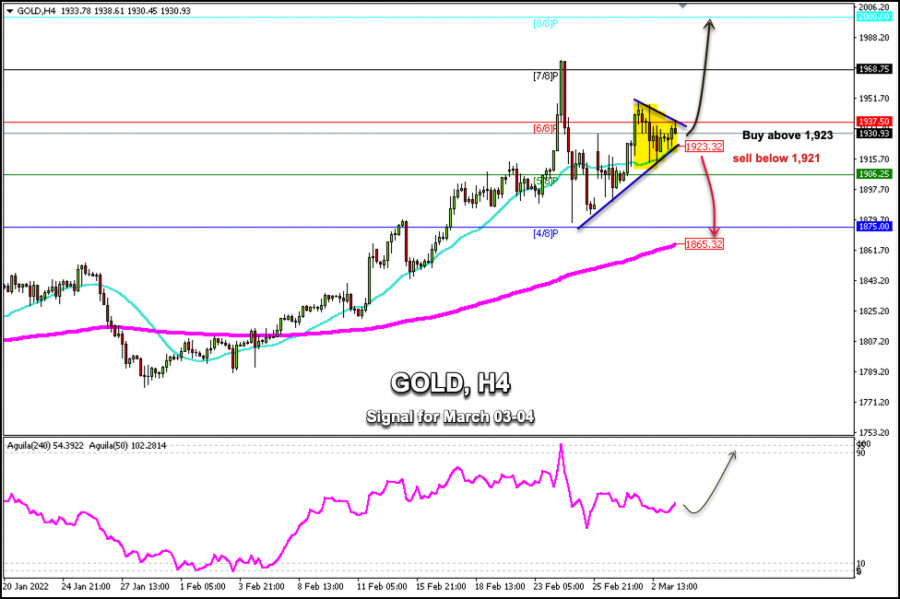
| Posted: 03 Mar 2022 06:59 AM PST
Gold price is trading above an uptrend channel formed from the low at 1,877 on February 24. Currently, we can see the formation of a symmetrical triangle. This means that a break above the upper line around 1,937 could cause a strong bullish movement for gold and the price could reach the zone of 7/8 Murray located at 1,964 and eventually reach the psychological level of $2,000. Conversely, a sharp break below the symmetrical triangle around the 21 SMA located at 1,923 could accelerate gold's strong bearish move and it will fall towards the 5/8 Murray at 1,906 and towards the 200 EMA around 1,865. In his presentation to Congress, Jerome Powell, the Chairman of the Federal Reserve, expressed his support for a 25-basis point hike in the interest rate at the March meeting, and gave no indication of a stronger rate of adjustment. The market reacted to this news and for now we see the increase in risk appetite. However, gold will continue to be the final winner and will be the one that will benfit the most in the Russia - Ukraine crisis because investors, in the face of any fear, will continue to return to refuge. So, gold is likely to conquer new highs. As long as gold continues to trade above 1,923, it is likely to reach the area from 1,937 to 1,964. Conversely, a close on the 4-hour chart below 1,923 could trigger a move down towards the psychological level of 1,900. Support and Resistance Levels for March 03- 04, 2022 Resistance (3) 1,964 Resistance (2) 1,937 Resistance (1) 1,929 ---------------------------- Support (1) 1,913 Support (2) 1,895 Support (3) 1,877 *********************************************************** Scenario Timeframe H4 Recommendation: buy above Entry Point 1,923 Take Profit 1,937; 1,968 Stop Loss 1,917 Murray Levels 2,000(8/8), 1,968(7/8) 1,937(6/8), 1,906(5/8) *************************************************************************** The material has been provided by InstaForex Company - www.instaforex.com |
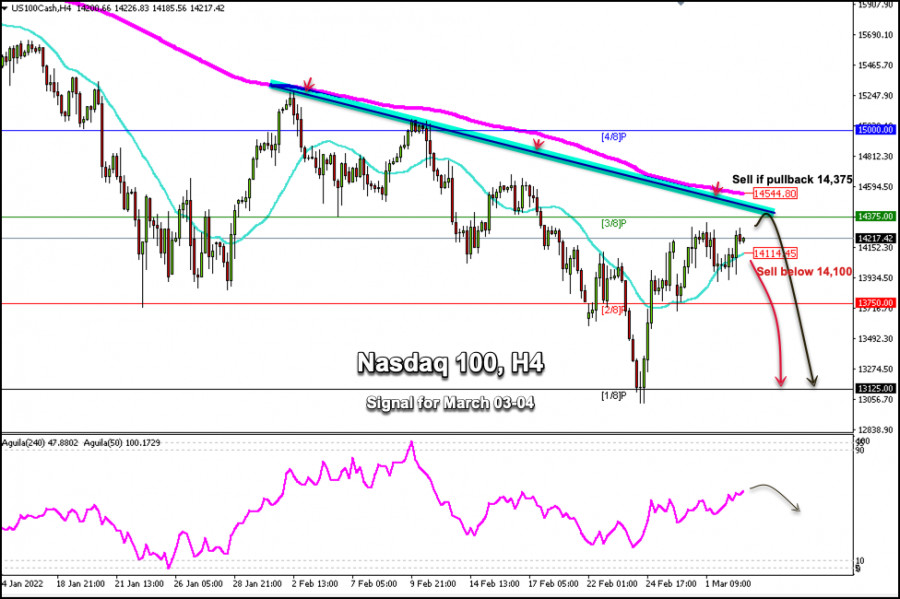
| Posted: 03 Mar 2022 06:13 AM PST
The high-tech index Nasdaq-100 (#NDX) picked up strength throughout the American session after Federal Reserve Chair Jerome Powell signaled the central bank would likely raise interest rates less than some investors had feared. Investors remained on edge as reports Wednesday indicated that Russian forces penetrated Kherson and have surrounded Mariupol, two key cities in the southern part of the country. Despite the geopolitical events, the NASDAQ-100 is showing resilience and is approaching the resistance zones of 14,375 and heading towards the 200 EMA at 14,544. The overall trend is bearish according to the 4-hour chart. However, momentum has been trending higher since February 24. The low reached around the level 13,031 on February 24 is giving the Nasdaq-100 strength and we saw a rally of over 1200 points so far. A technical correction below SMA 21 at 14,100 is likely in the coming days. A trade through 13,031 (1/8 Murray) will signal a resumption of the main downtrend. A move through 14,544 (200 EMA) will change the main trend to bullish. As long as the NASDAQ trades below the 200 EMA (14,544) and below the 4/8 Murray, it is likely that only the move higher will be considered a technical correction to resume the downtrend. Our trading plan is to wait for a pullback towards the resistance area at 14,370 (3/8), or towards the top of the downtrend channel to sell. On the other hand, a close on the 4-hour chart below the 21 SMA will be considered an opportunity to sell with targets at 13,750 (2/8) and 13,125 (1/8). Support and Resistance Levels for March 03- 04, 2022 Resistance (3) 14,734 Resistance (2) 14,513 Resistance (1) 14,357 ---------------------------- Support (1) 14,137 Support (2) 13,981 Support (3) 13,750 *********************************************************** Scenario Timeframe H4 Recommendation: sell if pullback Entry Point 14,375 Take Profit 13,750; 13,125 Stop Loss 14, 550 Murray Levels 15,000(4/8), 14,375(3/8) 13,750(2/8), 13,125(1/8) *************************************************************************** The material has been provided by InstaForex Company - www.instaforex.com |
| Posted: 03 Mar 2022 06:04 AM PST
The situation in global markets remains turbulent. Investors keep trying to assess the consequences of both the Russian military special operation in Ukraine and the harsh economic sanctions of the West against Russia. Stock and bond prices are fluctuating because of conflicting stimuli, and there is no indication of what might prevail: war, which threatens to undermine a fragile global economic recovery, or inflation, caused by a spike in oil prices that central banks cannot ignore. The yield on 10-year US Treasuries rose to 1.862% yesterday, posting its biggest one-day gain since March 18, 2020. Yesterday, the indicator fell by 12.8 b.p., reaching 1.708%. On Wednesday, the S&P 500 climbed by more than 1% for the sixth time during the previous seven trading sessions. At the end of yesterday's trading, the index increased by 1.86% after having declined by 1.55% on Tuesday. Experts say such strong fluctuations reflect the fragility of the market. Another similar pattern can be seen in the foreign exchange market, where volatility this week jumped to its highest level in 14 months, according to the corresponding Deutsche Bank index. On Wednesday, the EUR/USD pair fell to its lowest level since May 2020 at 1.1060, then rebounded to 1.1130 and finished the session almost at the same level where it started near 1.1125. The US currency continues to be in demand as a safe haven asset due to the tense situation around Ukraine. The day before, the USD index rose for the third straight day and marked new yearly peaks in the range of 97.80-97.85. Investors are still avoiding the euro, fearing that it is the eurozone that will suffer the most economic damage among developed countries because of the situation in Ukraine.
"In the current crisis, we view the euro's status as vulnerable," Rabobank experts said. "On a corporate level, there is a web of complex relationships between the European Union and Russian firms, particularly in the energy sector," they added. Jefferies experts say that many expect the euro to fall below $1.10 against the US dollar. They said that the market could get to that point if the situation continues to deteriorate, and it could continue to deteriorate, but if we see a resolution to the conflict, the euro could jump against the US dollar. So far it is difficult to predict further developments in the geopolitical situation, but if we assume that eventually, the geopolitical premium will leave the euro exchange rate and the market will return to the normal state, the EUR/USD pair will be able to recoup its losses. However, until a solution to the crisis is found, the pair is likely to remain under pressure. According to Westpac economists, the EUR/USD is still at risk of breaking through the 1,000. "Continued Ukrainian conflict will weigh on EUR and regional rates, countering higher and persistent inflation," they said. "EUR/USD is unlikely to sustain rebounds. Resistance is likely in front of 1.1300 with mounting pressure to test 1.1000 or even force a flush towards 1.0775-00," the economists added. The continuing divergence of the Fed's monetary policy compared to the ECB's policy is another factor driving the EUR/USD pair, contributing to further US dollar strength and putting pressure on the euro. "Eurozone CPI surprised to the upside at 5.8% YoY, but unlike the Fed, the ECB has more cause to mark this down as supply-driven inflation," ING economists said. "We had been preferring a broad 1.10-1.15 range in EUR/USD this year - after the hawkish turn from the ECB – but the FX options market is warning that the risks to a big break below 1.10 are building," they added.
The euro area consumer price index is projected to rise above 6% in March. At the same time, ECB officials disagreed on how the regulator should respond to the price surge. According to economic theory, an increase in the key rate is necessary to cool the economy and reduce inflation. In this case, credit would become more expensive, money circulation would slow down, and price increases would stop. However, the problem is that in the current environment, an increase in the key rate threatens to reduce GDP growth, recession, and even stagflation. The euro area Services PMI and PMI Composite indexes for February were revised to the downside. According to Markit Economics, last month, the first indicator was 58.2 points and the second reached 55.5 points, respectively. Analysts had predicted that the indicators would remain at the preliminary estimate of 58.4 points and 55.8 points, respectively. The potential impact of the Russian-Ukrainian conflict on economic growth in the Eurozone is currently estimated in the range of 0.3-1.0%. ECB Governing Council member and Bundesbank President Joachim Nagel said on Wednesday that the ECB's monetary policy should take into account high inflation. "If price stability requires it, the ECB Governing Council must adjust its monetary policy course," Nagel said. At the same time, he noted that it was impossible to assess the economic consequences of the war in Ukraine. Several ECB officials believe that increased risks are forcing the regulator to act more cautiously.
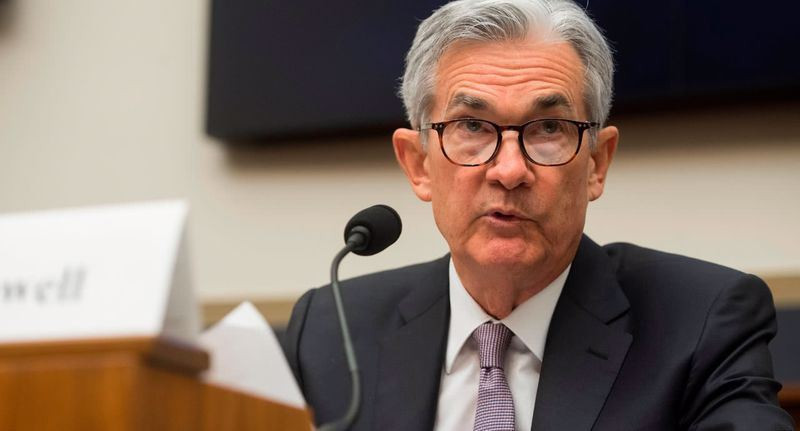
"The dramatic conflict in Ukraine is now weighing negatively on both supply and demand conditions, making uncertainty more acute and exacerbating risks to the medium-term inflation outlook on both sides. In this environment, it would be unwise to pre-commit on future policy steps until the fallout from the current crisis becomes clearer," Fabio Panetta, a member of the ECB's executive board, said. "We should adjust policy carefully and recalibrate it as we see the effects of our decisions, so as to avoid suffocating the recovery and cement progress towards price stability," he added. The futures market expects just under two steps from the ECB to raise rates by 10 basis points in 2022, up from 50 basis points shortly after the ECB's February 3 meeting. BlackRock experts believe that the Russian-Ukrainian conflict will force the ECB to keep interest rates at zero level until next year. Unlike its European counterpart, the US Central Bank has already confirmed its intention to raise its key rate by 0.25% later this month. The Fed's key interest rate hike at its March meeting would be appropriate because of high inflation, substantial demand in the economy and exceptional tightness in the labor market, US Central Bank Chairman Jerome Powell said on Wednesday. As part of his speech to the U.S. House Committee on Financial Services, he said he would support a quarter-point rate hike when the FOMC meets March 15-16, effectively ending the debate about starting a round of rate hikes after the pandemic with a larger-than-usual 0.5% hike. At the same time, the head of the Fed stressed that the regulator would be prepared, if necessary, to use larger or more rapid changes in rates, if inflation does not slow down. This shows the Fed's focus on inflation as a key issue that could undermine confidence in the central bank if things deteriorate, undermining the purchasing power of households and beginning to distort the investment and decisions of businesses and families. The labor market, as Powell noted in prepared statements, was "extremely tight," and FOMC officials said their goal of maximum employment was effectively met.
According to the head of the Fed, the impact of the pandemic on the US economy appears to be waning, hiring remains strong, and inflation has become a major risk. Consumer prices in the United States jumped to an annualized 7.5% in January. According to the report of ADP published yesterday, the employment in the US private sector in February increased by 475,000 against expectations of 350,000. This release is a leading indicator of the key report on the US labor market, which will be issued on Friday and is expected to reflect the growth of employment by 450,000. Powell acknowledged that the Fed faces new challenges due to recent events in Europe, which could not only increase price pressures but also potentially undermine growth. "The near-term effects on the US economy of the invasion of Ukraine, the ongoing war, the sanctions, and of events to come, remain highly uncertain," Powell said. He added that the Fed would act to get inflation under control and return prices to the normal state. After Powell's speech, the futures market began to price in six quarter-point increases in the federal funds rate this year, up from five as of Tuesday. By the end of the year, analysts expect to see the rate in the range of 1.5-2.5%. It is assumed that the hawkish policy of the Fed with the inaction of the ECB may lead to a decrease in the EUR/USD pair in the medium term. As the US dollar slowed its strengthening against the euro on Wednesday, the single currency is still struggling to attract demand as investors refrain from buying risky assets amid ongoing tensions between Russia and Ukraine. If sellers manage to push the EUR/USD pair below 1.1060, additional losses may be seen while declining towards 1.1000. The Relative Strength Index (RSI) remains below 50, confirming the bear market. Alternatively, there might be a recovery beyond the weekly resistance at 1.1190, a breakthrough of which may allow bulls to reach 1.1230 and 1.1270. The material has been provided by InstaForex Company - www.instaforex.com |
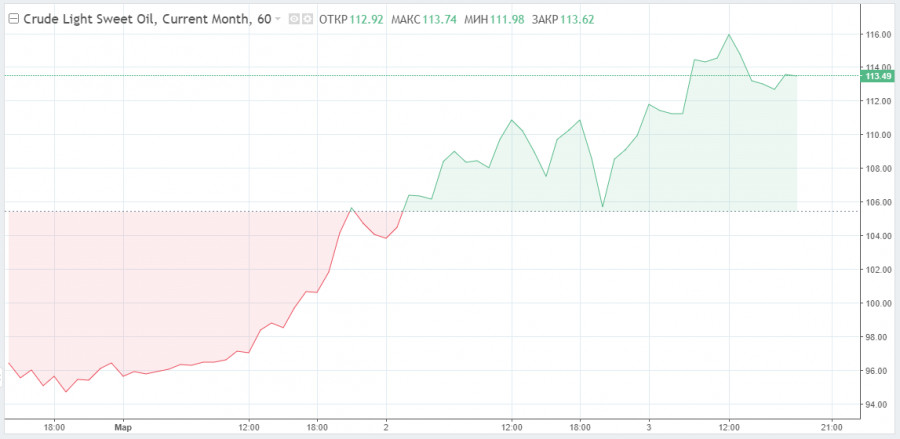
| Oil prices likely to skyrocket amid war in Ukraine, sanctions against Russia Posted: 03 Mar 2022 06:04 AM PST
Oil prices continue to rise amid the ongoing Russian invasion of Ukraine. The commodity has gained 2.5% on Thursday after reaching new highs earlier. The price of Brent futures with delivery in May reached $115.22 at the time of writing. On Wednesday, Brent futures closed at $112.93 – the highest level since June 2014. WTI futures with delivery in April were trading at $113.62 at the time of writing. Earlier, WTI futures reached the high of May 2011 - $110.6 per barrel. The situation in Ukraine is directly influencing the price of oil. If situation in the country deteriorates, the price will go up rapidly. Another factor pushing up crude oil is tensions between Russia and Western European nations. Major oil consumers are now refusing to buy oil from Russian producers. As a result, buyers have to seek other suppliers that would provide oil on similar terms. There is a possible factor that could relieve Western supply woes – Iranian oil hitting the market. Supply from Iran would allow Western countries to reduce dependence on Russia. However, at this point, Iran is still under Western sanctions. US president Biden intends to strike a deal with the Iranian government, but it remains unclear when (or if) it would happen. At this point, 70% of exported Russian oil cannot find any buyers. According to Energy Aspects, Russian oil producers have troubles with selling their commodity amid the current situation in Eastern Europe. Bloomberg reported that Russia's Surgutneftegaz hasn't been able to sell its commodity for the past 3 days. Obviously, the threat of oil deficit is determining trader sentiment and price movements in the market. The International Energy Agency decided to release 60 million barrels of oil from strategic reserves, but it failed to calm down anxious traders. Furthermore, there are reports that OPEC+ countries are planning not to increase oil production. On Wednesday, the group's member states agreed on leaving its April production quotas unchanged at 400,000 barrels a day. "Current oil market fundamentals and the consensus on its outlook pointed to a well-balanced market, and that current volatility is not caused by changes in market fundamentals but by current geopolitical developments," the OPEC+ statement said. With Russia's war against Ukraine in full swing, and Western sanctions against Moscow and the Russian oil sector only picking up, crude oil could reach $150 per barrel.
|
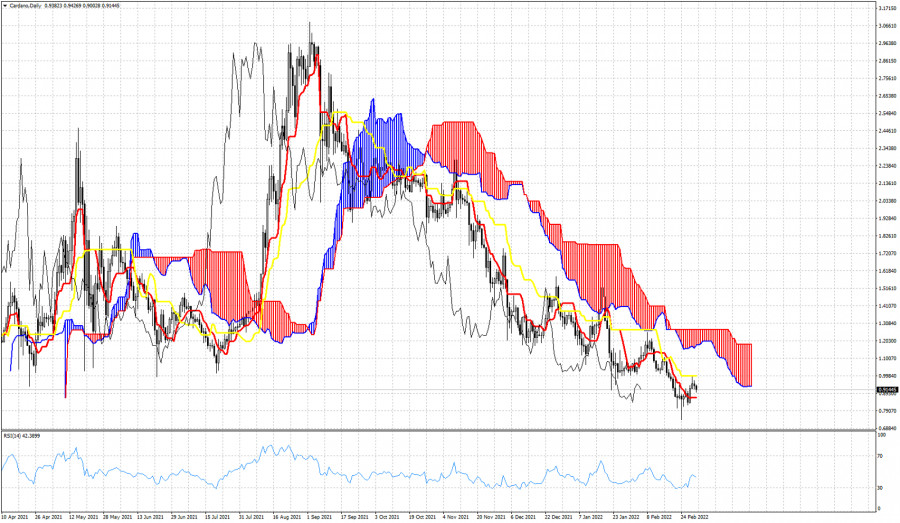
| Cardano remains in a bearish trend. Posted: 03 Mar 2022 05:38 AM PST Cardano remains in a bearish trend since September of 2021 when it peaked at $3.08. Since then price is making lower lows and lower highs. Price is under the Ichimoku cloud with bulls unable to break above the cloud resistance.
|
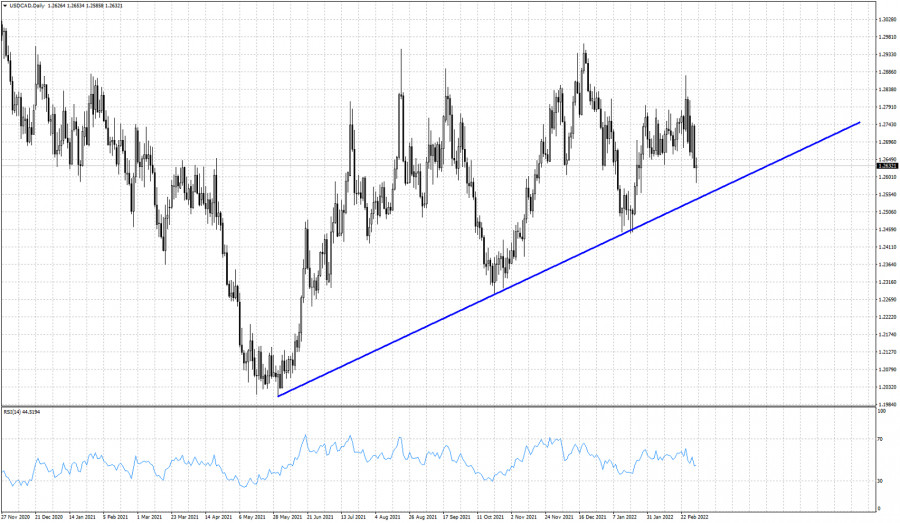
| USDCAD still respects the long-term upward sloping trend line. Posted: 03 Mar 2022 05:32 AM PST USDCAD is trading around 1.2638 having made a low around 1.2585. A few days ago price was making a high at 1.2786. In our zoomed out view price continues to trade above the key upward sloping support trend line coming from June 2021 1.20 lows.
Each time price approached the blue trend line, it was a chance for traders to join the bullish side. As long as price continues to respect the blue trend line, we should continue favoring buying the pull backs as close to the blue trend line as possible. The support trend line is now at 1.2540, so as long as we trade above this level, we remain optimistic for new higher highs. The material has been provided by InstaForex Company - www.instaforex.com |
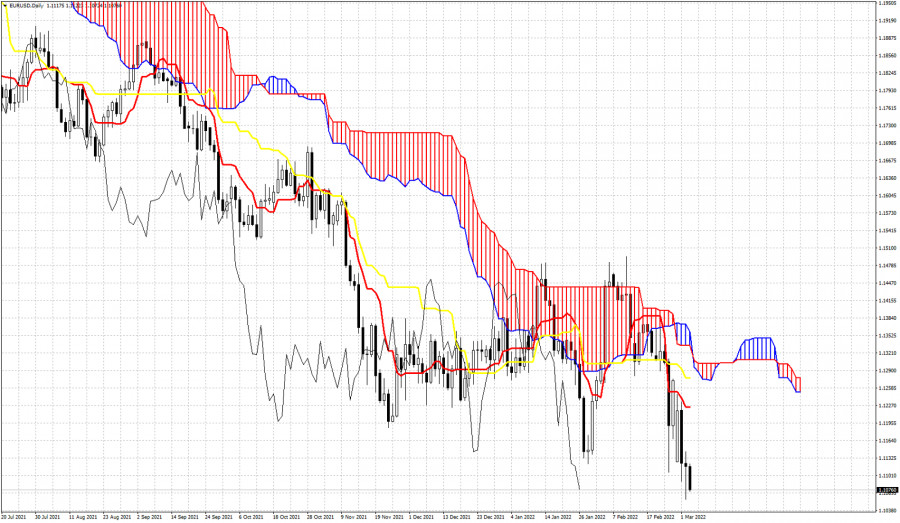
| Ichimoku cloud indicator analysis on EURUSD for March 3, 2022. Posted: 03 Mar 2022 05:22 AM PST EURUSD is making new lower lows. Trend remains bearish according to the Ichimoku cloud indicator. We use this indicator in the Daily chart in order to identify key resistance levels that bulls need to break in order to provide reversal signals.
|
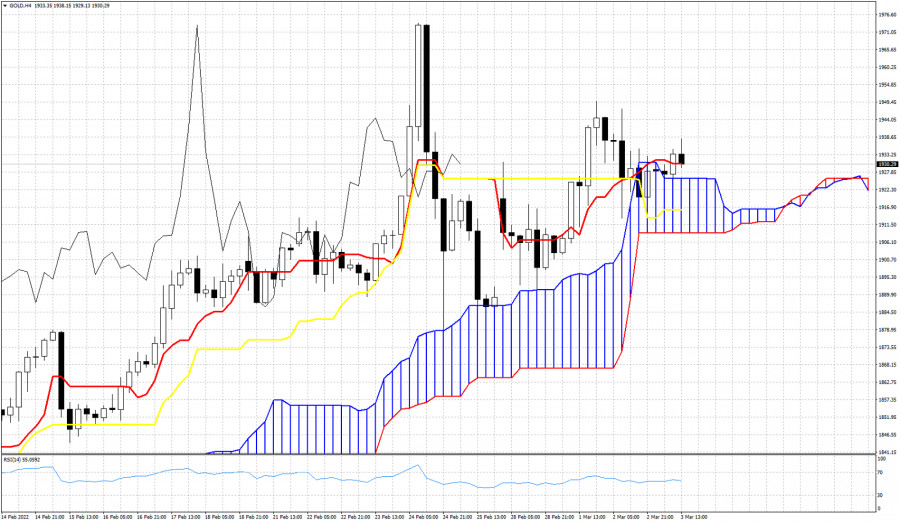
| Ichimoku cloud indicator analysis on Gold for March 3, 2022. Posted: 03 Mar 2022 05:18 AM PST Gold price continues to trade above the Ichimoku cloud in the 4 hour chart. Short-term trend remains bullish. So far price has tested the cloud support several times and bulls have managed to keep price above it.
Gold price is also above both the tenkan-sen (red line indicator) and the kijun-sen (yellow line indicator). This is another sign confirming bullish trend. Support by the cloud is at $1,925-$1,908. As long as price is above this area, bulls continue to hope for a move to new highs. The Chikou span (black line indicator)is above the candlestick supporting the bullish trend. No sign of weakness according to the Ichimoku cloud indicator. The material has been provided by InstaForex Company - www.instaforex.com |
| Video market update for March 03,,2022 Posted: 03 Mar 2022 05:14 AM PST Divergence on the Crude oil and potential for the downside movement towards the mean.... The material has been provided by InstaForex Company - www.instaforex.com |
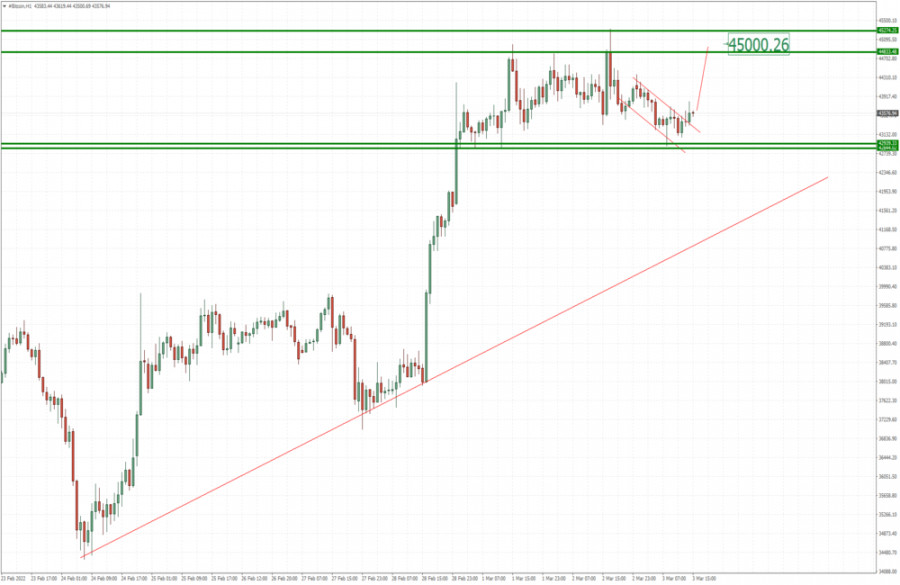
| BTC analysis for March 03,.2022 - Upside continuation in the play Posted: 03 Mar 2022 05:12 AM PST Technical analysis:
BTC/USD has been trading upside this morning and I see potential for the further higher price. Potential for revisiting $45,000. Trading recommendation: Due to the breakout of the mini downside channel in the background and the upside trend in the backgammon I see potential for further upside movement. Watch for buying opportunities on teh dips with the upside objective at $45,000 Key support level is set at the price of $43,000 The material has been provided by InstaForex Company - www.instaforex.com |
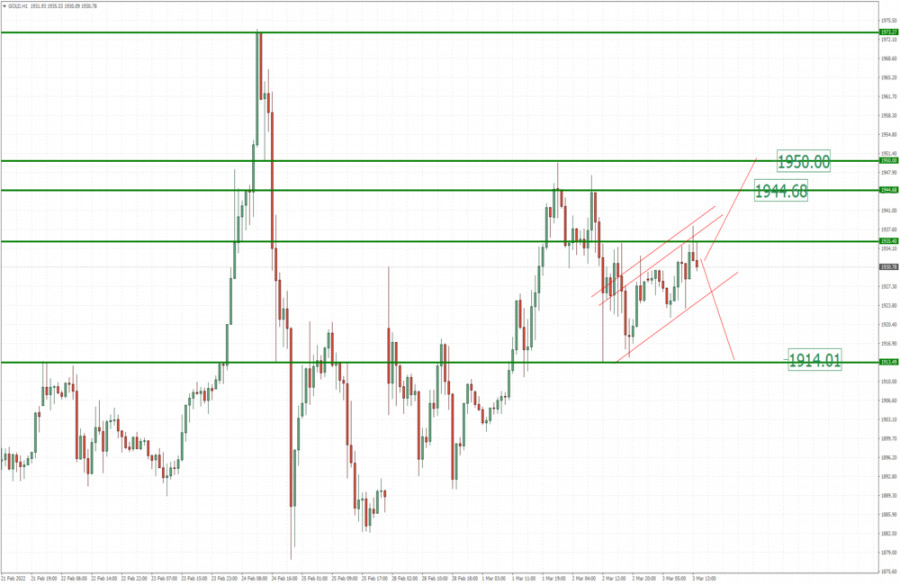
| Analysis of Gold for March 03,.2022 - Key resistance at the price of $1.935 on the test Posted: 03 Mar 2022 05:03 AM PST Technical analysis:
GBP/USD has been trading sideways at the price of $1,930. Watch carefully for price action around pivot at the price of $1,935 to confirm further direction. Trading recommendation: Rejection of the pivot at the price of $1,935 can lead price lower towards the $1,914. In case of rejection, downside opportunities are preferable. Breakout of the key resistance at the price of $1,935 can confirm further upside movement and potential test of $1,944 and $1,950. Buying opportunities on the dips will be preferable strategy under breakout condition. The material has been provided by InstaForex Company - www.instaforex.com |
| European stock market declines sharply after strong gains on Wednesday Posted: 03 Mar 2022 04:51 AM PST On Thursday, major European indices showed a significant decline after rising the day before. Market participants are concerned about the prospects of tougher sanctions against Russia. At the time of writing, the STOXX Europe 600 index lost 0.22%, dropping to 445.16. The FTSE 100 index plummeted by 0.33%, the CAC 40 index declined by 0.11%, the DAX index slumped by 0.73%, the Spanish IBEX 35 index slid down by 0.85%. The Italian FTSE MIB index showed a slight increase of 0.06%.
The UK stock exchange London Stock Exchange Group's securities soared by 9.8% amid the company's announcement that new sanctions against Russia would have little effect on its operations. In addition, the LSE management reported a more than two-fold increase in pre-tax profits in the past year yesterday. Deutsche Lufthansa AG lost 5.3% following the management's statement about the impossibility to provide a forecast for the current year due to the military conflict in Eastern Europe and the COVID-19 pandemic. Even the strong financial report of the company failed to support the quotations. Thus, in Q4 2021 Lufthansa reduced its net loss by almost 4 times on a yearly basis. The capitalization of the Italian telecommunications company Telecom Italia SpA crashed by 14%. In the reporting quarter, the company's net loss amounted to €8.64 billion. The quotations of the German pharmaceutical manufacturer Merck KGaA rose by 0.4%. According to the company's statement for 2021, it increased its net profit by 54%. In addition, the management of Merck KGaA announced the payment of record-high dividends in 2022 yesterday. Securities of the German logistics company Kion Group AG increased by 9% after the company published a forecast for the current year that exceeded experts' expectations considerably. Market participants are focused today on the military conflict between Russia and Ukraine. On Thursday, Russian-Ukrainian negotiations to resolve the crisis are scheduled to take place in the Brest region of Belarus. In addition, traders continue to assess the consequences of Western sanctions against Russia. Investors also paid attention to the statements of the head of the US Federal Reserve Jerome Powell, made the day before in the US Congress. According to Powell, the US Federal Reserve is planning to raise the key interest rate by 25 basis points during the meeting scheduled for March 15-16. In case of accelerating inflation, the regulator will act more aggressively by raising the benchmark rate by more than 25 basis points. As for the trading results on Wednesday, European stock indices had reported growth the day before amid oil companies' shares climbed. By the end of the day, the index of leading companies in the euro area STOXX Europe 600 jumped by 0.9% to 446.33 points. The German DAX gained 0.7%, the French CAC 40 jumped by 1.6%, the FTSE 100 index increased by 1.4%, the Italian FTSE MIB slightly climbed by 0.7%, and the Spanish IBEX 35 was up by 1.6%. The persistently rising world oil prices are further boosting inflation in Europe. According to preliminary forecasts by Eurostat, last month's inflation accelerated to a record 5.8% year-on-year against 5.1% in January. On Wednesday, securities of British-Dutch oil and gas company Shell rose by 5.1%, French TotalEnergies climbed by 8.2%, and the multinational corporation British Petroleum soared by 4.8%. The cost of Brent futures with delivery in May reached nearly $114 per barrel yesterday. Major foreign buyers began to boycott Russian oil and look for alternative sources of raw materials against the background of the armed conflict between Russia and Ukraine. The negative consequences of the Ukrainian conflict were also felt by many carmakers, which faced problems with the supply of components. On Wednesday, the securities of the German manufacturer Porsche dropped by 3.3%, and the Swedish Volvo declined by 0.8%. Yesterday, the Swedish telecommunications equipment manufacturer Ericsson lost 10.3%. The reason for the sharp collapse of the securities were claims from the US Department of Justice in connection with the company's possible cooperation with the Islamic State, which is banned in Russia. The material has been provided by InstaForex Company - www.instaforex.com |
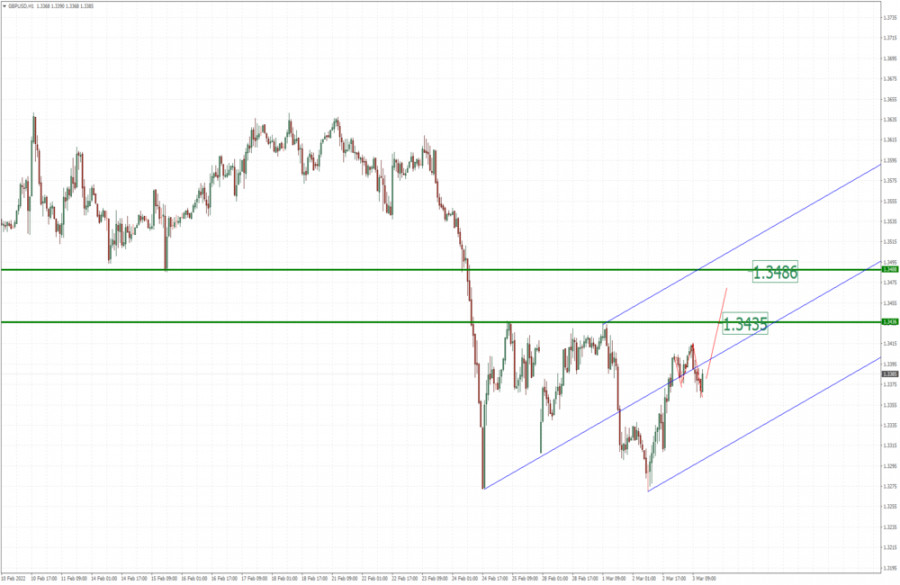
| GBP/USD update for March 03, 2022 - Buyers in control Posted: 03 Mar 2022 04:51 AM PST Technical analysis:
GBP/USD has been trading sideways at the price of 1,3385. Anyway, I see potential for the upside continuation due to yesterday's rally at the end of the day. Trading recommendation: Due to impulsive upside movement yesterday at the end of the day, I see potential for the upside continuation. Watch for buying opportunities on the pullbacks with the upside objectives at 1,3435 and 1,3485. Additionally, there is the breakout of the Pitchfork mean, which is another sign that buyers are in control. Support is set at the price of 1,3362 The material has been provided by InstaForex Company - www.instaforex.com |

| You are subscribed to email updates from Forex analysis review. To stop receiving these emails, you may unsubscribe now. | Email delivery powered by Google |
| Google, 1600 Amphitheatre Parkway, Mountain View, CA 94043, United States | |
Comments