Forex analysis review
Forex analysis review |
- March 18, 2021 : EUR/USD daily technical review and trading opportunities.
- March 18, 2021 : EUR/USD Intraday technical analysis and trading plan.
- March 18, 2021 : GBP/USD Intraday technical analysis and significant key-levels.
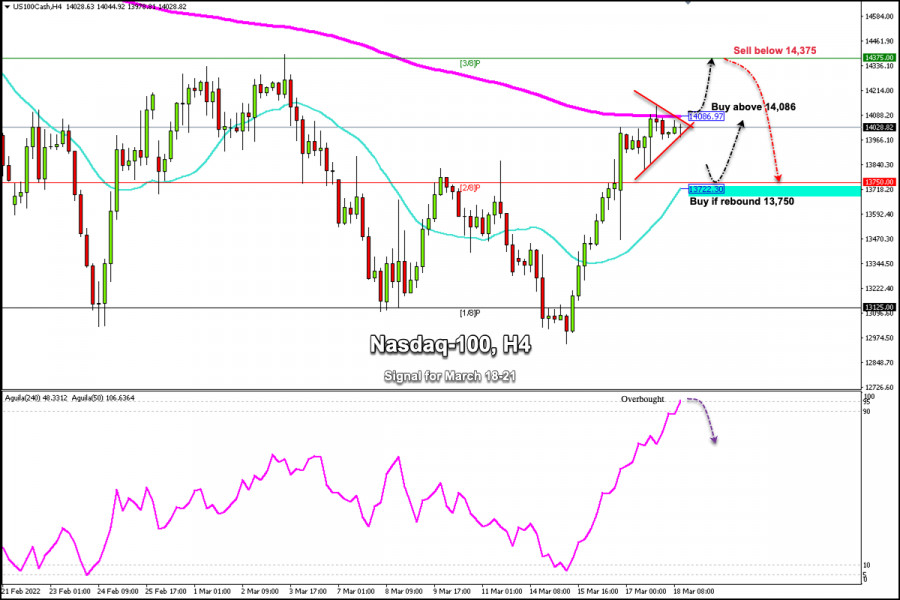
- Trading signals for Nasdaq-100 (#NDX) on March 18-21, 2022: sell in case of pullback at 14,375 (3/8 Murray)
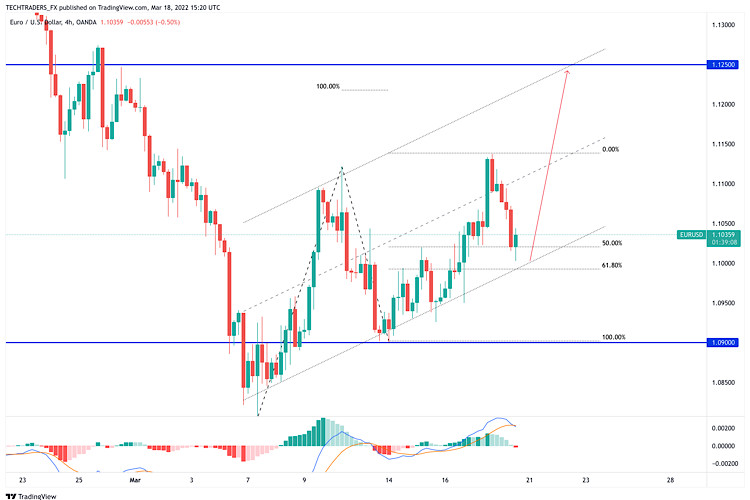
- EUR/USD Hot Forecast on 18 March
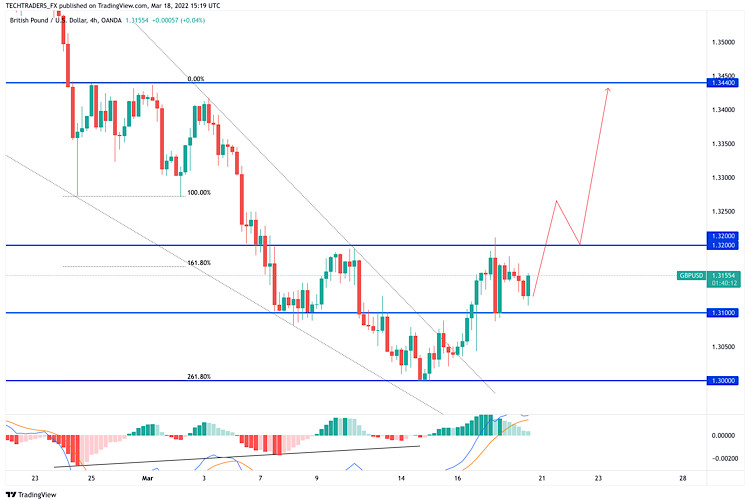
- GBP/USD Hot Forecast on 18 March
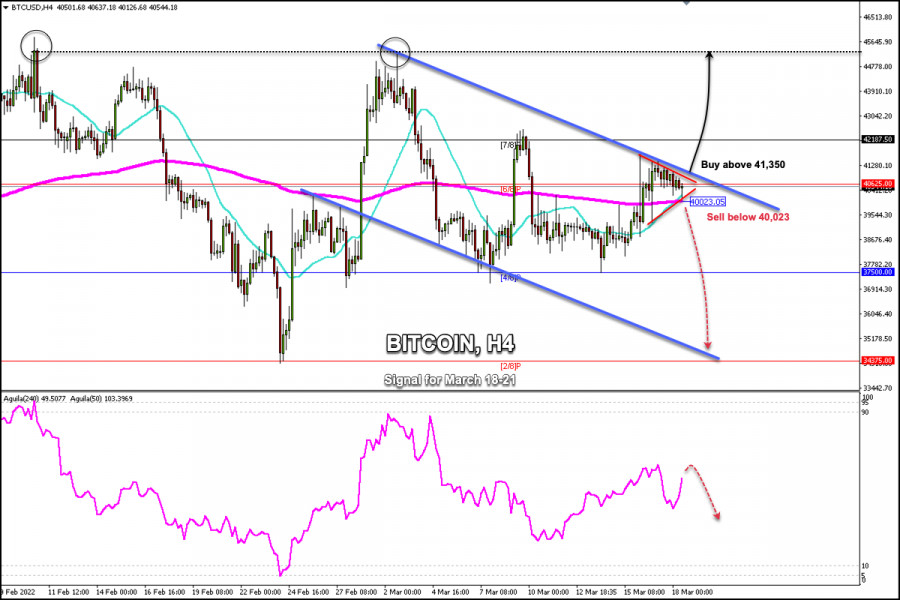
- Trading signals for Bitcoin (BTC/USD) on March 18-21, 2022: sell below $40,023 (200 EMA - symmetrical triangle)
- Asian markets mixed on Friday as optimism fades
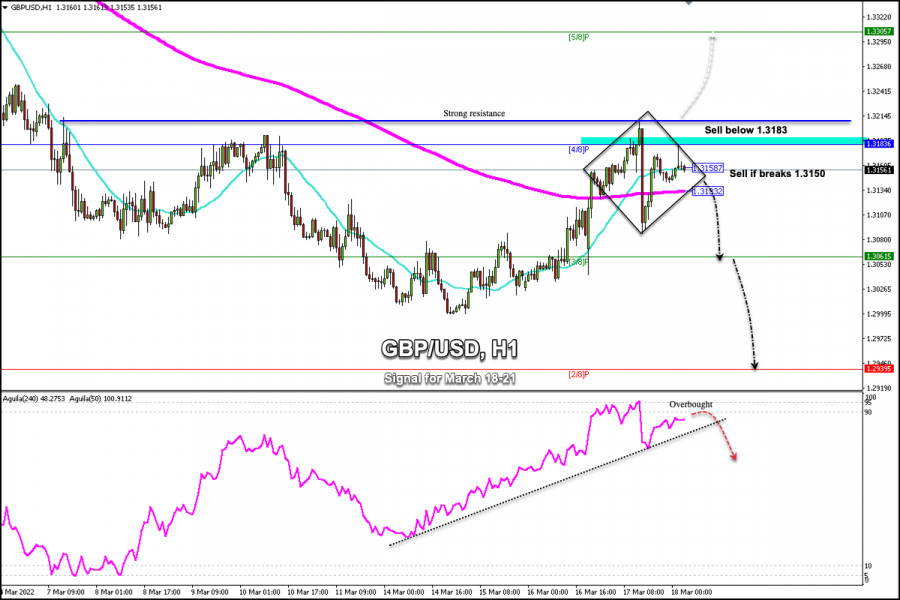
- Trading signals for GBP/USD on March 18-21, 2022: sell below 1.3150 (21 SMA - diamond pattern)
- US premarket on March 18, 2022
- BTC update for March 18,.2022 - Potential for the drop towards $37.500
- GBP/USD update for March 18, 2022 - Rejection of key resistance at 1.3200
- GBPUSD short-term view
- Bitcoin: five fundamental and one technical argument for long-term growth
- Short-term analysis on Gold for March 18, 2022.
- EURUSD rejected at short-term resistance.
- GBP/USD: the plan for the American session on March 18 (analysis of morning deals). The pound sank in the first half of the
- Analysis of Gold for March 18,.2022 - Potential for another downside wave
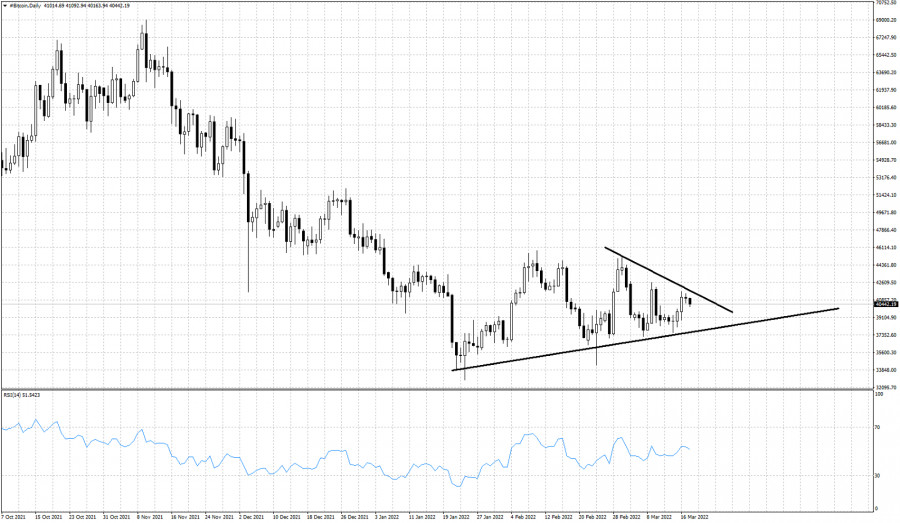
- Bitcoin forms triangle pattern
- EUR/USD: trading plan for US session on March 18 (morning trades analysis). Euro depreciates against US dollar amid lack
- Is it time to sell the dollar?
- Video market update for March 18,,2022
- Daily Video Analysis: NZDUSD, H4 Bearish Reversal Opportunity
- Trading tips for CHF/JPY
- European stock market gains on decisions by the world's central banks
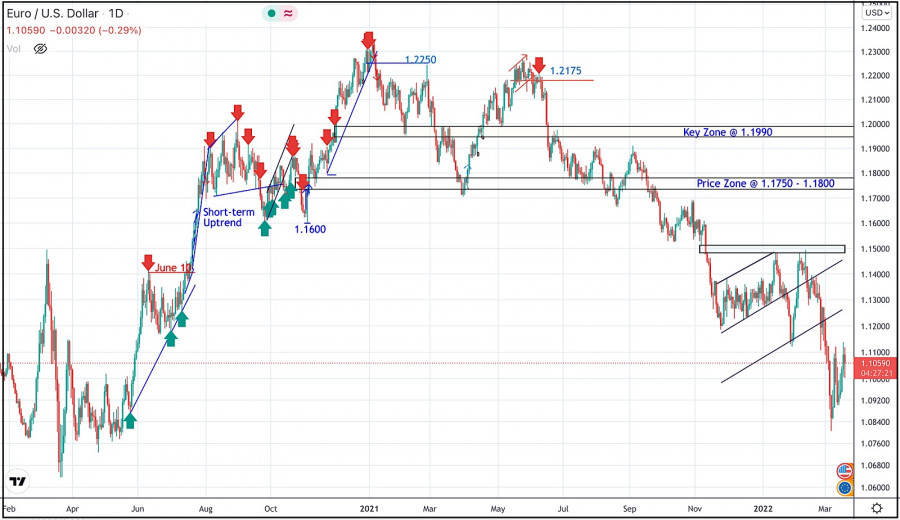
| March 18, 2021 : EUR/USD daily technical review and trading opportunities. Posted: 18 Mar 2022 09:37 AM PDT
During the past few weeks, the EURUSD pair has been trapped within a consolidation range between the price levels of 1.1700 and 1.1900. In late September, Re-closure below the price level of 1.1700 has initiated another downside movement towards 1.1540. Price levels around 1.1700 managed to hold prices for a short period of time before another price decline towards 1.1200. Since then, the EURUSD has been moving-up within the depicted movement channel until bearish breakout occurred by the end of last week's consolidations. Few weeks ago, the price zone of 1.1350 failed to offer sufficient bearish rejection that's why it was bypassed until 1.1500 which applied significant bearish pressure on the pair. A possible SELL Entry was offered upon the previous ascending movement towards 1.1500 which provided significant bearish pressure. Shortly after, the EURUSD looked oversold while approaching the price levels of 1.0850. That's where the current upside movement was initiated. Any movement towards 1.1200 should be considered for another SELL trade as long as sufficient SELLING pressure is demonstrated. The material has been provided by InstaForex Company - www.instaforex.com |
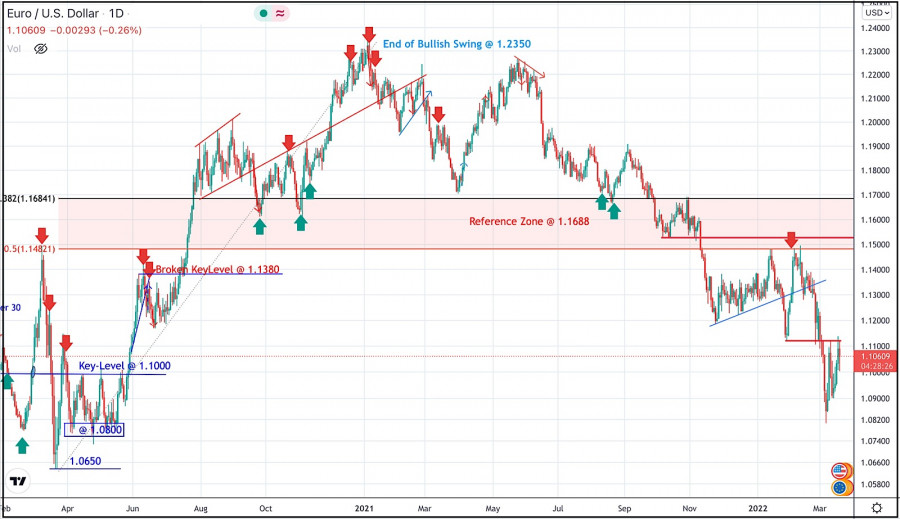
| March 18, 2021 : EUR/USD Intraday technical analysis and trading plan. Posted: 18 Mar 2022 09:37 AM PDT
Recent bullish pullback towards 1.1650-1.1680 (upper limit of the previous consolidation range) was expected to offer bearish rejection and a valid SELL Entry. Significant bearish decline brought the EURUSD pair again towards 1.1550 levels which failed to provide sufficient BUYERS for too long period. Hence, only a short- term sideway movement was demonstrated around 1.1550 before quick bearish decline could occur towards 1.1200. On the other hand, the price levels around 1.1520 stood as a reference zone that applied significant bearish pressure upon two successive bullish visits. Recent Bearish decline below 1.1100 was considered as a bearish continuation sign. That's why, downside movement was expected to proceed towards 1.1000 then 1.0920 where the current bullish pullback was initiated. The price levels around 1.1100 should be watched upon any upcoming bullish move for bearish rejection and a possible SELL Entry. However, failure to do so will probably enable more bullish advancement towards 1.1320. The material has been provided by InstaForex Company - www.instaforex.com |
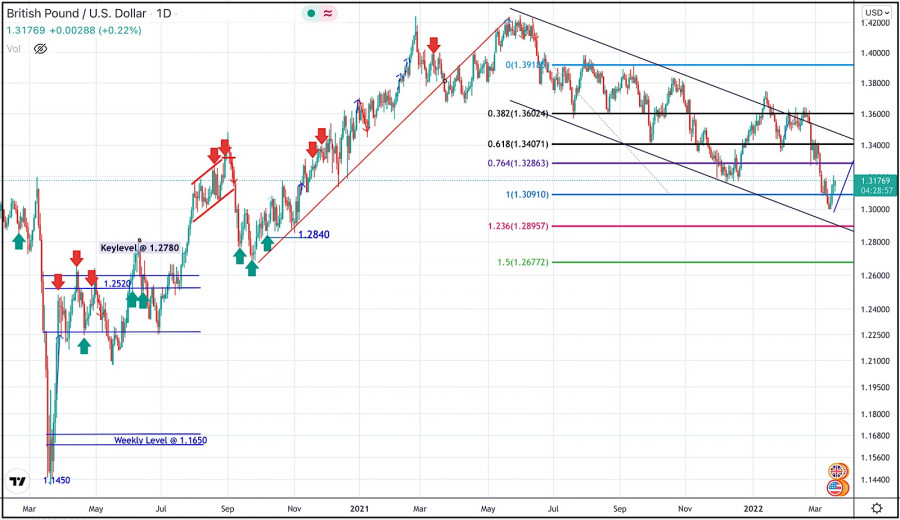
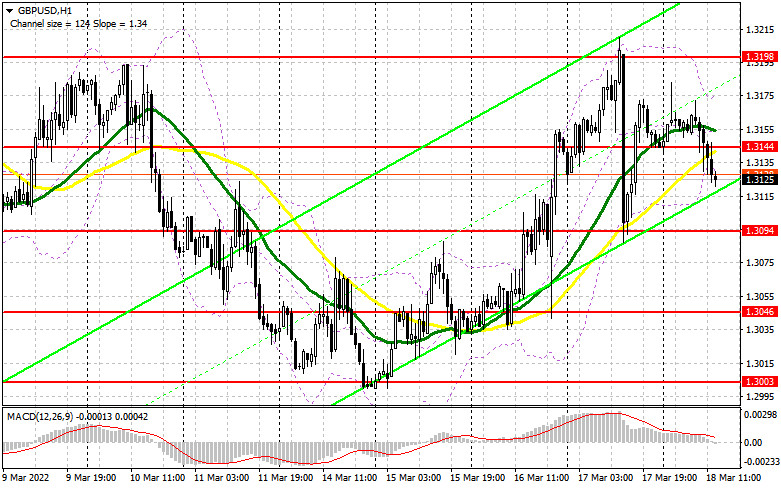
| March 18, 2021 : GBP/USD Intraday technical analysis and significant key-levels. Posted: 18 Mar 2022 09:36 AM PDT
The GBPUSD pair has been moving within the depicted bearish channel since July. Bearish extension took place towards 1.3220 where the lower limit of the current movement channel came to meet with Fibonacci level. Shortly after, BUYERS were watching the price levels of 1.3730 to have some profits off their trades as it stood as a key-resistance which offered significant bearish rejection recently. The short-term outlook turned bearish when the market went below 1.3600. This enhanced the bearish side of the market towards 1.3400 which brought the pair back towards 1.3600 for another re-test. Hence, the recent bullish pullback towards 1.3600 should have been considered for SELL trades as it corresponded to the upper limit of the ongoing bearish channel. It's already running in profits. Bearish persistence below 1.3220 may enable further downside continuation towards 1.2960 (the lower limit of the movement channel). Bullish rejection was anticipated around 1.3000, please note that bullish breakout above 1.3250 enables quick bullish advancement towards 1.3400. The material has been provided by InstaForex Company - www.instaforex.com |
| Posted: 18 Mar 2022 09:20 AM PDT
Nasdaq-100 (#NDX) reached the resistance zone of the 200 EMA on the 4-hour chart located around 14,086. On the 4-hour chart, we can see the formation of a symmetrical triangle below the 200 EMA. A sharp break above 14,086 could accelerate the bullish momentum and reach the zone of 3/8 Murray at 14,375. Conversely, a sharp break below the symmetrical triangle and trading below the 200 EMA could trigger a correction to the 21 SMA located at 13,722. The Nasdaq-100 had a strong rebound from the low of 12,942 and has been accumulating strenght for four days straight. The index has gained 1,300 points, this represents more than 10%. The trigger for this strong upward movement is as a result of investors turning to risky assets caused by the rate hike of 0.25% by the FED, which was not only anticipated by market participants, but was also taken into account in current prices. Investors knew the actions of the FED and what it would do, they did not expect a drastic change in the direction of the economic future, so the fear dissipated. This encouraged investors to stop taking refuge in gold and invest in risky assets such as Nasdaq-100. In the next few hours, the Nasdaq-100 is expected to continue rising, giving us an opportunity to buy above the 200 EMA located at 14,086 with targets at 14,375. The eagle indicator has reached the extremely overbought zone and it is likely that in the next few hours there will be an imminent correction. So, we can wait for the Nasdaq-100 to hit 3/8 at 14,375 to sell or wait for a correction at 2/8 Murray and the 21 SMA around 13,722 to buy. The eagle indicator is showing signs of extreme exhaustion. The material has been provided by InstaForex Company - www.instaforex.com |
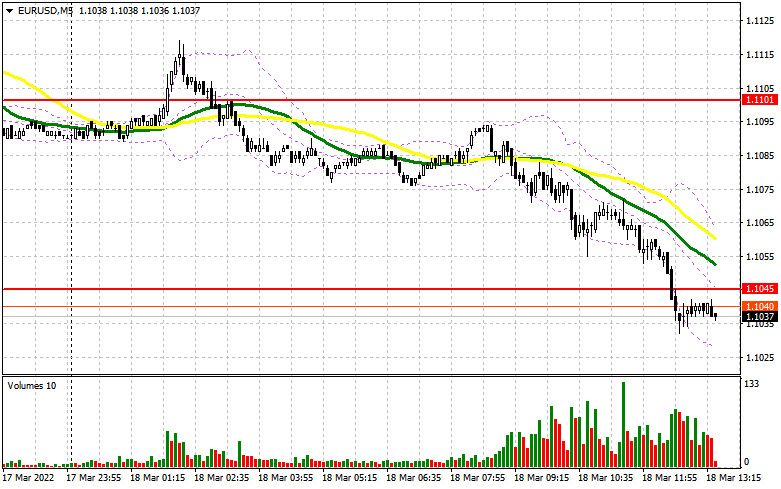
| EUR/USD Hot Forecast on 18 March Posted: 18 Mar 2022 08:27 AM PDT
EUR/USD continues to push lower toward 1.1000 on Friday as the risk-averse market environment helps the greenback outperform its rivals. The latest headlines surrounding the Russia-Ukraine conflict suggests that there is little to no progress toward a peace agreement. The Relative Strength Index (RSI) indicator on the four-hour charts holds comfortably above 50 despite edging slightly lower during the Asian trading hours. 1.1040 (100-period SMA, Fibonacci 50% retracement of the latest downtrend) forms critical support for the pair. In case sellers manage to drag the pair back below that level and hold it there, additional losses toward 1.1000 (psychological level, Fibonacci 38.2% retracement, 50-period SMA9 could be witnessed. On the upside, if EUR/USD steadies above 1.1080 (Fibonacci 61.8% retracement), it could target 1.1140 (Thursday high, static level) before turning its attention to 1.1200 (psychological level, 200-period SMA). The material has been provided by InstaForex Company - www.instaforex.com |
| GBP/USD Hot Forecast on 18 March Posted: 18 Mar 2022 08:26 AM PDT
GBP/USD stays on the back foot on Friday and declines toward 1.3100 with the dollar continuing to gather strength. Supported by safe-haven flows, the US Dollar Index is up more than 0.5% on a daily basis above 98.50. GBP/USD was last seen trading below 1.3150 (Fibonacci 38.2% retracement of the latest downtrend). If this level turns into resistance, the next bearish targets are located at 1.3100 (Fibonacci 23.6% retracement, 50-period SMA on the four-hour chart) and 1.3050 (static level). On the flip side, the pair could rise toward 1.3200 (psychological level, Fibonacci 50% retracement) if it manages to reclaim 1.3150 on the back of risk flows. Meanwhile, the Relative Strength Index (RSI) indicator is edging lower toward 50, confirming the loss of bullish momentum. The material has been provided by InstaForex Company - www.instaforex.com |
| Posted: 18 Mar 2022 08:18 AM PDT
The consolidation of the Bitoin price is respecting the downward trend channel that was formed since the beginning of March. In the last few hours, we can see that Bitcoin is forming a symmetrical triangle pattern. A breakout of this pattern could be the key to further move higher. Only a sharp break of the downtrend channel and a confirmation of the symmetrical triangle above 41,350 could be the signal to buy Bitcoin with targets at the top of the resistance at 45,500. Conversely, a close on the 4-hour chart below the 200 EMA and below the psychological level of $40,000 could cause a downtrend move and the price could reach 4/8 Murray again at 37,500 and towards the bottom of the downtrend channel at 34,325. The eagle indicator is in a neutral zone. Having generated a bullish signal, it started a correction. In the next few hours, Bitcoin is likely to break the psychological level of 40,000. The negative signal could be activated again and we could have an opportunity to sell. Our trading plan is to wait for a break of the symmetrical triangle above 41,350 to buy with targets at 45,500 or a break below $40,000 to sell with targets at 37,500 (4/8 Murray) and 34,375 (2/8Murray). The material has been provided by InstaForex Company - www.instaforex.com |
| Asian markets mixed on Friday as optimism fades Posted: 18 Mar 2022 07:24 AM PDT
Asian stock markets were mixed on Friday after demonstrating strong gains over the past 2 days. The Shanghai Composite and the Shenzhen Composite lost 0.22% and 0.52% respectively, while the Hang Seng Index decreased by 2.17% after rising throughout the day. In Australia, the S&P/ASX 200 gained 0.36%. The Nikkei 225 and KOSPI added 0.34% and 0.1% respectively. Optimism in the market faded as several new outbreaks of COVID-19 were reported. Investors are wary of new quarantine measures that could severely affect economic growth in March and April. Furthermore, the ongoing war between Russia and Ukraine remains in focus of the international community. Today, US president Joe Biden spoke with Chinese president Xi Jinping, with the situation in Ukraine being on the agenda. The central bank of Japan has left the interest rate unchanged at -0.1%, with the yield of 10-year bonds remaining at zero. Furthermore, the bond-buying program will continue. According to the regulator, the decline of the COVID-19 pandemic and the easing of related restrictions, as well as rising exports are expected to improve the economic situation. Thanks to the central bank's policy, the state of the Japanese economy is somewhat stronger compared to other countries in the Asia-Pacific region. Japan's consumer prices rose by 0.9% over the year in February, up from 0.5% in January. The CPI reached the highest level over the past 3 years. On the Nikkei 225, the best performing stocks were Pacific Metals Co., Ltd. and Toho Zinc Co., Ltd., which gained 8%, as well as SoftBank Group Corp., which added 3%. Chinese indexes rose significantly after the government signaled it would enact measures to help markets run smoothly and ensure financial and economic stability. Investors also welcomed talks between US and Chinese governments on accounting oversight of US-listed Chinese companies. Today, major Chinese online commerce companies, such as Meituan, JD.com Inc., NetEase Inc., and Alibaba Group Holding, Ltd. lost 6-8%. Shares of CNOOC, Ltd. gained 3%, while PetroChina Co., Ltd. added 2% thanks to rising oil prices. On the KOSPI, LG Corp. led the upside, gaining 1.5%. Hyundai Motor Co., Ltd. increased by 1%, while Kia Corp. fell by 0.1%. On the S&P/ASX 200, the best performing stocks were Fortescue Metals Group, Ltd. (+2.2%), Rio Tinto, Ltd. (+1.6%), and BHP Group, Ltd. (+1.3%). Shares of Megaport, Ltd. lost 8% after its founder sold 1.9% of his 5.1% stake in the company. The material has been provided by InstaForex Company - www.instaforex.com |
| Trading signals for GBP/USD on March 18-21, 2022: sell below 1.3150 (21 SMA - diamond pattern) Posted: 18 Mar 2022 07:20 AM PDT
Yesterday, early in the American session GBP/USD fell to the SMA of 21 on the 4-hour chart at 1.3086. This happened after the Bank of England announced the increase in interest rates. Today at the beginning of the Asian Session, GBP/USD reached the level of 1.3186 zone of 4/8 Murray. the price could not break it and made a drop. Now it is located around the SAM 21 at 1.3158. A break below the 200 EMA could accelerate the drop to 3/8 Murray at 1.3061. If bearish pressure prevails, the pair could drop to 1.2939 (2/8Murray). On the 1-hour chart, we can see the formation of a diamond pattern. If this technical attern is broken below 1.3133, it could confirm a bearish move towards the area 1.3060 and the price could reach the level 1.2940. On the contrary, strong resistance is observed in the area of 1.3211 that coincides with the highs of March 7 and March 10. If GBP/USD consolidates above this level in the next few hours, it is likely to reach the resistance zone of 5/8 Murray located at 1.3305. Since March 16, the Eagle indicator is oscillating in the overbought zone. It is likely that a correction may occur in the British pound in the next few hour and this could be a signal to sell as long as GBP/USD trades below the 21 SMA located at 1.3158. Our trading plan is to sell at current price levels around 1.3158 or break the 21 SMA at 1.315. We could sell with targets at 1.3061 (3/8 Murray). The break of the 200 EMA located at 1.3133 could confirm the downward movement which will help us sustain our selling. The Eagle indicator supports our bearish strategy. The material has been provided by InstaForex Company - www.instaforex.com |
| US premarket on March 18, 2022 Posted: 18 Mar 2022 07:16 AM PDT US stock market futures fell early on Monday after three straight days of gains. Dow Jones futures decreased by 215 points, while S&P 500 and Nasdaq 100 futures lost 0.7%. Yesterday, US indexes closed in positive territory despite losing ground during the premarket. Investors are cautious about buying risky assets at their current highs amid Russia's ongoing war against Ukraine. Today, Russia's president Putin had a phone call with German chancellor Scholz. Putin has accused Ukraine of stalling peace talks with Moscow by "putting forward more and more unrealistic proposals", while Moscow remained committed to "continue searching for a solution in line with its well-known principled approaches," the Kremlin said in a readout of the call.
Yesterday, the Bank of Russia paid a $117 million interest payment on government bonds in US dollars, avoiding a default. Earlier, the regulator stated it would make its bond payments in Russian rubles and not US dollars. Premarket movers Shares of FedEx lost 3.1% after the company reported adjusted earnings of $4.59 a share, below projected $4.65 in per-share earnings. The delivery service's sales exceeded expectations, but the company's profits were constrained by a lack of workers due to the Omicron strain of COVID-19. US video game retailer GameStop reported a surprise loss in the fourth quarter of, despite net sales being ahead of expectations. CEO Matt Furlong said the company's operations during the holiday season were disrupted by the Omicron strain and supply chain disruptions. Shares of GameStop lost 7.6% during the premarket.
US Steel stock fell by 3.6% on a weaker than expected earnings outlook for the next quarter. In the pharmaceutical sector, shares of Moderna added 1% during the premarket. The company is seeking FDA approval for a second booster shot of its Covid-19 vaccine for adults aged 18 and older. Earlier, Pfizer and BioNTech sent a request for approval of their own second booster shot as well. On the technical side, yesterday the S&P 500 rose to $4,383, suggesting the index could perform well today. Bullish traders are expected to steer the S&P 500 towards testing $4,433. A breakout above this level would open the way towards the highs at $4,488 and $4,539. If there's low demand for opening long positions near $4,383, the index could break through it downwards and plunge towards the lows at $4,319 and $4,265, nullifying the efforts of bulls. The material has been provided by InstaForex Company - www.instaforex.com |
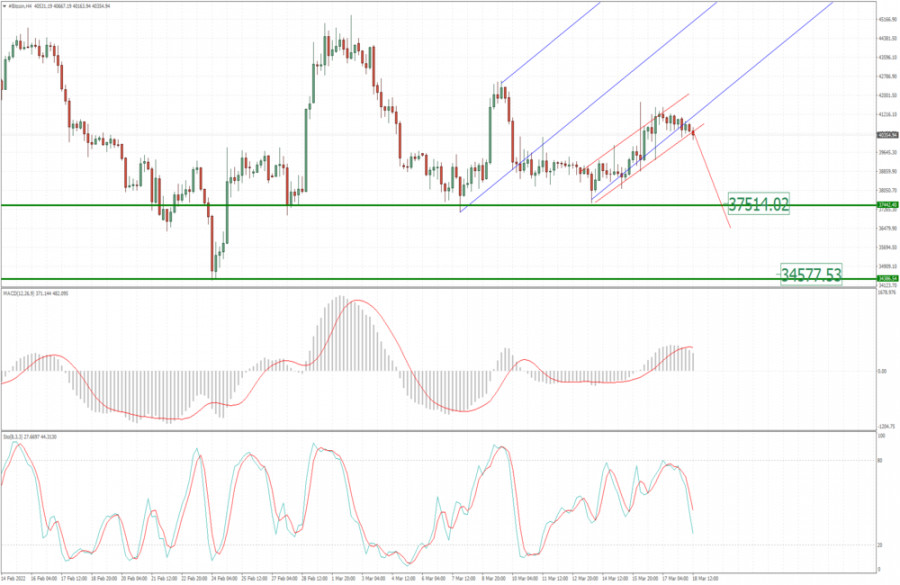
| BTC update for March 18,.2022 - Potential for the drop towards $37.500 Posted: 18 Mar 2022 06:39 AM PDT Technical analysis:
BTCUSD has been trading sideways at the price of $40.500 and I see potential for the downside movement due to lack of buying power. Trading recommendation: Due to failed test of the median Pitchfork trend-line, I see potential for the downside movement. Watch for selling opportunities with the downside objectives at $37.500 and $34.600. Stochastic oscillator is showing overbought condition and fresh bear cross, which is sign for the further downside movement. Short-term trend is neutral The material has been provided by InstaForex Company - www.instaforex.com |
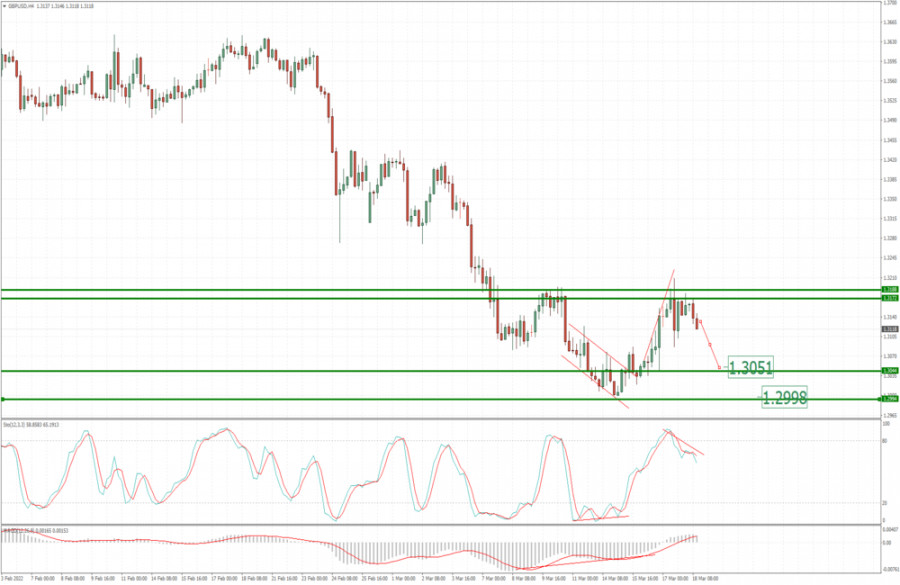
| GBP/USD update for March 18, 2022 - Rejection of key resistance at 1.3200 Posted: 18 Mar 2022 06:26 AM PDT Technical analysis:
GBP/USD has been trading downside and there is the rejection of key pivot resistance at the price of 1.3200. I see further downside movement. Trading recommendation: Watch for potential selling opportunities due to strong rejection of key resistance at 1.3200. Downside objectives are set at the price of 1.3050 and 1.3000 Stochastic oscillator is showing overbought condition and fresh bear cross, which is sign for the further downside movement. Short-term trend is still bearish. The material has been provided by InstaForex Company - www.instaforex.com |
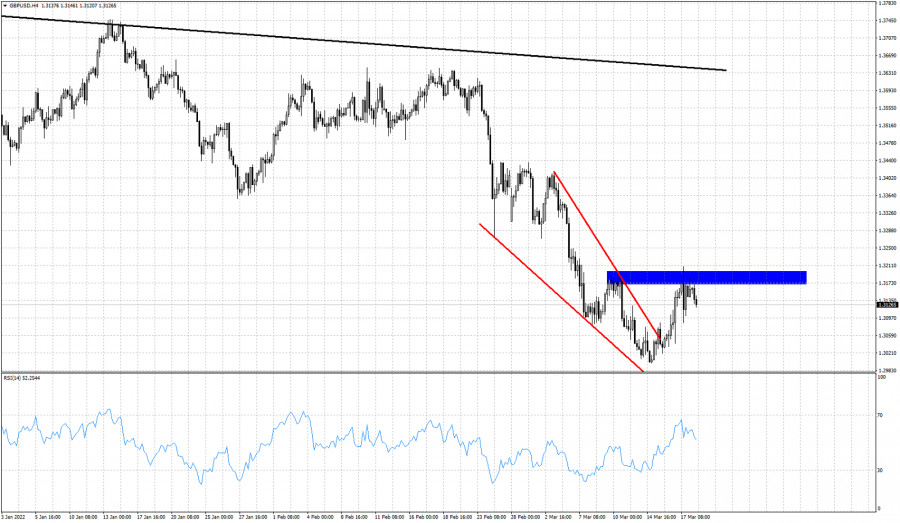
| Posted: 18 Mar 2022 06:19 AM PDT GBPUSD broke out of the wedge pattern providing the first bullish sign after some time. Price reached 1.32 and the horizontal resistance of the previous high. Price got rejected and is pulling back. Bulls need to form a higher low in order to gather momentum for their next attack. Bulls target 1.32 for a breakout.
Blue rectangle- horizontal short-term resistance Red lines- wedge pattern GBPUSD stopped the advance after the break out right below the horizontal resistance area around 1.32. Bulls need to recapture 1.32 and stay above it in order for the pair to continue higher towards 1.3360-1.3390. Forming a higher low in the current pull back would be the ideal scenario for bulls. GBPUSD is vulnerable to a pull back towards 1.3080 so traders better be patient with buying and should only consider if price reaches 1.3080 or breaks above resistance. The material has been provided by InstaForex Company - www.instaforex.com |
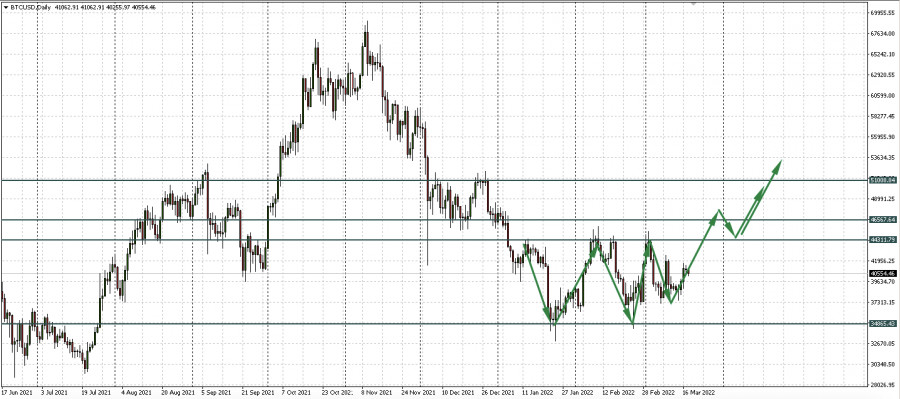
| Bitcoin: five fundamental and one technical argument for long-term growth Posted: 18 Mar 2022 06:09 AM PDT After we looked at why bitcoin looks more attractive locally than gold in the previous review, another confirmation of this forecast appeared today. Well-known crypto influencer Mike McGlone, senior commodities strategist at Bloomberg Intelligence, explained in a tweeter post that BTC could outperform gold in the next few months and even years. Bitcoin: risk aversion vs. stock market correlationBitcoin has been relatively stable since the end of February, while other assets have actively embraced the geopolitical turmoil. In a March 17 tweet, McGlone talked about the Fed, Bitcoin, gold, and the stock market. He stated that inflation and the geopolitical crisis could be another milestone in the development of the main cryptocurrency. In addition, McGlone said that BTC is unlikely to stop outperforming gold and the stock market. The Fed's expected six rounds of interest rate hikes could lead to lower asset prices and a stronger U.S. dollar. However, not everything is clear here yet. Bitcoin has traded tight to traditional financial markets in recent months and has been correlated with the stock market. What will happen to this relationship against the backdrop of tightening the Fed's monetary policy remains to be seen. Bitcoin vs. Alternative payment methodsWhile Ukraine is still under attack, the use of Bitcoin as an alternative solution to traditional payment methods is growing. Nowadays, when it has become very difficult for Ukrainians to access financial solutions, Bitcoin is becoming an obvious alternative. People have donated over $50 million using digital currencies. These funds can be used to pay for new military materials and help local communities affected by the conflict. As McGlone says, Bitcoin may continue to outperform gold and other assets in the next few months. However, it may take some time for the main cryptocurrency to break through a new all-time high again. Distrust in the Government Generates Demand for BitcoinBitcoin is often touted as a hedge against the bad policies of centralized governments, and this narrative is not going away anytime soon. Mike Novogratz, CEO of Galaxy Digital, said that Bitcoin will become more widespread as long as governments continue to interfere with their economies. In an interview with CNBC, Novogratz noted that bitcoin is unlikely to succeed as a transactional currency. However, its strength can be used as a store of value (SOV) or "digital gold." The investor notes that the community of Bitcoin supporters has reached such a size that it could become the eighth country in the world in terms of the number of people. It attracts participants who have lost faith in their governments, and these sentiments continue to mount. Novogratz cited the U.S., Turkey, and Russia as examples of growing frustration with governments. He explained that if Fed Chairman Jerome Powell or Treasury Secretary Janet Yellen can bring the U.S. economy out of inflation, U.S. citizens may no longer need to buy Bitcoin. Similarly, Russian and Turkish citizens who own their wealth in Russian rubles or Turkish liras may be looking for ways to hedge against inflation at the moment, given the current economic situation in both countries. Novogratz argues that when economic mismanagement takes place, Bitcoin provides a great alternative to struggling fiat currencies. Bullish Forecast: Arguments for BTC GrowthNovogratz has remained a Bitcoin bull all this time, despite its fall. He previously stated his expectations that the "viral adoption" of the first cryptocurrency would be the catalyst needed for the asset's price to reach $500,000 in the next five years. Galaxy Digital's CEO wasn't the only bull reiterating his stance on Bitcoin. An equally well-known crypto advocate, Michael Saylor, CEO of MicroStrategy, recently called Bitcoin the "American Dream" for its ability to stay unaffected by political tensions. Does the technical picture confirm bullish optimism?Meanwhile, Bitcoin remains within the sideways range of $34,800 - $44,300 per coin. There continues to form either a triple bottom or an inverted head and shoulders. However, both of these reversal patterns are modifications of each other. The important thing is that the price continues to recover, which means approaching the key border at 44,300, which is the neckline for the figure. Its break and consolidation above the medium term will open the way for BTCUSD to the area of $51,000 - $53,000 per coin.
|
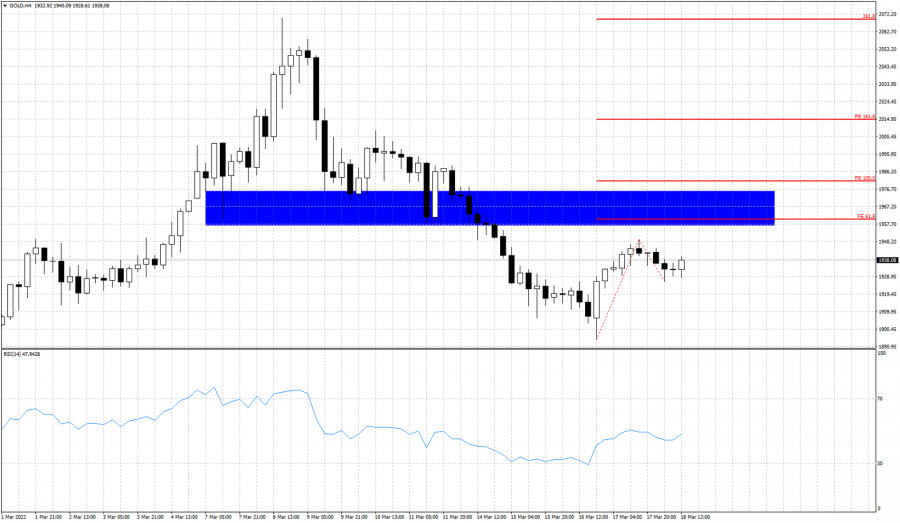
| Short-term analysis on Gold for March 18, 2022. Posted: 18 Mar 2022 06:08 AM PDT Gold price is trading around $1,935-40. Price is bouncing higher after the sharp decline from $2,070 to $1,894. Gold price is moving towards the resistance area of $1,960-77. Short-term support is found at $1,925. Bulls do not want to see price break below it.
Red lines - Fibonacci extensions If Gold price breaks above $1,950, then I will be expecting price to move towards the 100% extension higher towards $1,977-81 area. A rejection at the blue resistance area would be a bearish sign. If Gold bulls manage to form new higher highs and higher lows then we could see the start of a new upward move. Currently I prefer to be cautious as there are increased chances that Gold gets rejected at the resistance area. If bulls manage to overcome it, then I turn bullish. The material has been provided by InstaForex Company - www.instaforex.com |
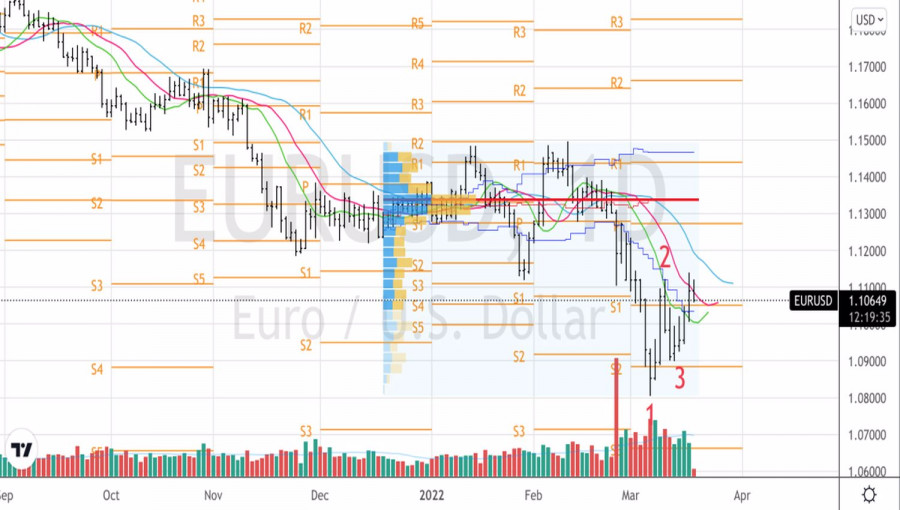
| EURUSD rejected at short-term resistance. Posted: 18 Mar 2022 06:03 AM PDT EURUSD is trading around 1.10 after getting rejected at the 1.11 resistance where a short-term downward sloping trend line is found. Nothing is lost for bulls yet. As long as price is above 1.09 they could still make a move higher towards 1.1250-1.13.
Red lines - bearish channel Black line -short-term resistance Today's and yesterday's price action confirms the importance of the 1.11 resistance level. Price is pulling back. Maybe for a higher low. One thing is for sure. In order to get a new bullish signal we need to see price break above 1.11. Until then price is vulnerable to a move lower. Bulls need to defend 1.09 and not let price fall below it. The material has been provided by InstaForex Company - www.instaforex.com |
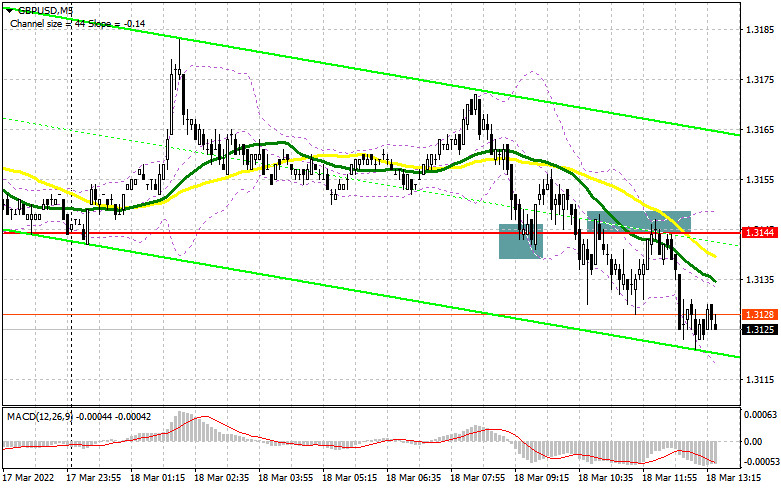
| Posted: 18 Mar 2022 06:03 AM PDT To open long positions on GBP/USD, you need: In my morning forecast, I paid attention to the level of 1.3144 and recommended deciding on entering the market. Let's look at the 5-minute chart and figure out what happened. The pound's decline to the area of 1.3144 and the formation of a false breakdown there led to the formation of an excellent entry point into long positions in the continuation of the pair's growth at the end of the week, but the obvious enthusiasm of speculative players was not supported by large market participants, so after moving up by 10 points, the bears achieved a breakdown of 1.3144, which led to fixing losses. Closer to the afternoon, the reverse test 1.3144 from the bottom up led to the formation of a signal to open short positions. But after moving down by 25 points, the pressure on the pound also decreased. And what were the entry points for the euro this morning?
Yesterday's decision by the Bank of England on monetary policy limits the upward potential of the pair, as the regulator did not say anything good, expressing some concerns due to excessively high inflation and an overheated labor market, which itself has overheated with stimulating measures. The lack of positivity in the geopolitical arena, which was visible at the beginning of the week, also repels those who want to buy the pound at the end of this week. News has already appeared that Putin discussed with German Chancellor Scholz the course of the Russian special operation in Ukraine, saying that Moscow is ready to continue the search for solutions in line with its principled approaches at the talks. Also tonight, the Russian president will hold a telephone conversation with Macron. In case of a decline in the pair in the afternoon, it is very important not to miss the level of 1.3094, in the area in which the market reversal took place yesterday. Long positions from it can be considered only after the formation of a false breakdown, as well as after weak fundamental statistics on the American economy. An equally important task for the bulls will be to return the resistance 1.3144 under control. Fixing above this range with an update of this area from top to bottom will allow buyers to get to the area of this week's maximum - 1.3198. It is unlikely that there will be those who want to buy higher, so I recommend fixing profits there. The 1.3244 area will remain a longer-range target. In the scenario of a decline in GBP/USD during the US session and the absence of bulls at 1.3094, it is best to postpone purchases against the trend until the next support - 1.3046, this is a more reliable level. But I also advise you to open long positions there only when a false breakdown is formed. You can buy GBP/USD immediately on a rebound from 1.3003, or even lower - from a minimum of 1.2966, counting on a correction of 30-35 points within a day. To open short positions on GBP/USD, you need: The bears coped with the task and dragged the pair below 1.3144, but it never came to a major drop. The priority goal of sellers for today remains the protection of 1.3144. In case of growth and a false breakdown at this level after the data on the volume of housing sales in the US secondary market and the index of leading indicators, I recommend opening short positions to reduce to the support of 1.3094. A breakout and a reverse test from the bottom up and this range will form an additional sell signal, which will give a direct path to the lows of 1.3046 and 1.3003, where I recommend fixing the profits. However, such a scenario is unlikely, as high volatility is not expected in the afternoon. In case of GBP/USD growth in the afternoon and lack of activity at 1.3144, and most likely it will be, it is best to postpone sales to a major resistance of 1.3198. I also advise you to open short positions there in case of a false breakdown. It is possible to sell GBP/USD immediately for a rebound from 1.3244 or even higher - from a maximum of 1.3275, counting on a correction of the pair down by 20-25 points within a day.
The COT reports (Commitment of Traders) for March 8 recorded a sharp increase in both long and short positions. Some took advantage of the panic in the market, others had attractive prices. However, there were more of those who increased short positions, which led to an increase in the negative delta. This week, we will have a meeting of the Federal Reserve System, and how the American regulator will behave in the conditions of the highest inflation in the last 40 years is a big question. A more active policy on interest rates will increase the demand for the US dollar, which is already trampling the British pound almost every day to the next annual lows. We also remember that although Russia and Ukraine have sat down at the negotiating table, so far these meetings do not give any special results. Against this background, I recommend continuing to buy the dollar, since the bearish trend for the GBP/USD pair has not gone away. The only thing that now saves the pound from a major sell-off is high inflation in the UK, which will force the Bank of England to act more actively as well. The very next day after the Fed meeting, the Bank of England will hold a meeting. This is where a reversal of the pound may occur in the opposite direction, so when selling at the lows of GBP/USD, think about tomorrow. The COT report for March 8 indicated that long non-commercial positions increased from the level of 47,679 to the level of 50,982, while short non-commercial positions increased from the level of 48,016 to the level of 63,508. This led to an increase in the negative value of the non-commercial net position from -337 to -12,526. The weekly closing price dropped to 1.3113 against 1.3422. Signals of indicators: Moving averages Trading is conducted around 30 and 50 daily moving averages, which indicates market uncertainty at the end of the week. Note. The period and prices of moving averages are considered by the author on the hourly chart H1 and differ from the general definition of the classic daily moving averages on the daily chart D1. Bollinger Bands A break of the lower limit of the indicator in the area of 1.3129 will increase the pressure on the pound. A break of the upper limit of the indicator in the area of 1.3170 will lead to the growth of the pair. Description of indicators
|
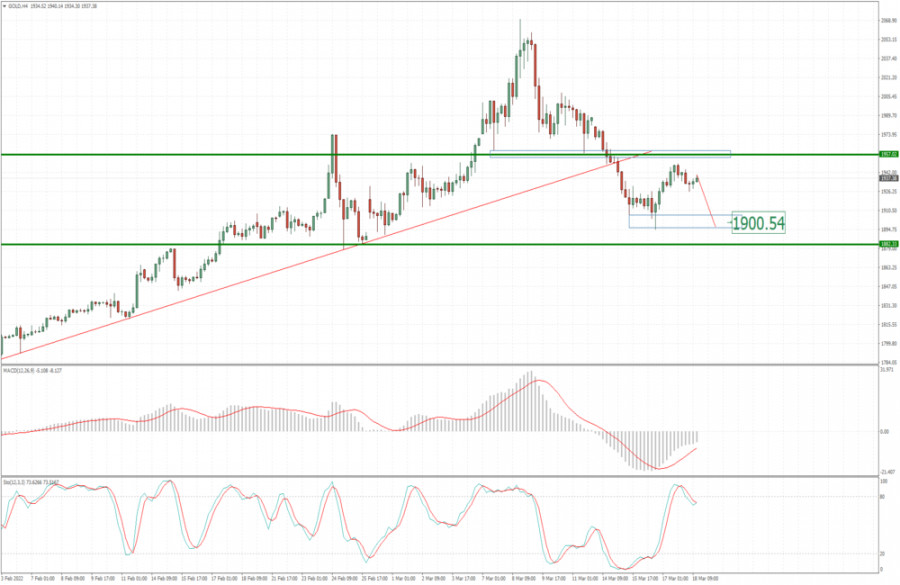
| Analysis of Gold for March 18,.2022 - Potential for another downside wave Posted: 18 Mar 2022 06:03 AM PDT Technical analysis:
Gold has been trading sideways at the price of $1.939. Key resistance is set at the price of $1.950-$1.960. Watch for potential rejection of the key resistance. Trading recommendation: Watch for potential selling opportunities due to broken upside trend-line and downside cycle in progress. Downside objectives are set at the price of $1.900 and $1.882 Stochastic oscillator is showing overbought condition and fresh bear cross, which is sign for the further downside movement. Key resistance is set at the price of $1.957 The material has been provided by InstaForex Company - www.instaforex.com |
| Bitcoin forms triangle pattern Posted: 18 Mar 2022 06:00 AM PDT Bitcoin is trading around $37,500-$41,000. Short-term trend is unclear as price mostly moves sideways. There seem to be a base already formed above $30,000 but bulls do not seem strong enough in order for price to break the $44,000 resistance.
Black lines- triangle pattern Bitcoin price is trading inside the triangle pattern as shown above. The space for moving is tightening and soon I expect to see a break out. If Bitcoin bulls manage to recapture $43,000 then we will have an upward break out that could push price towards $50,000 or higher. As long as price is below the upper triangle boundary, it is vulnerable to a move lower towards $37,700. Failure to hold above $37,700 will be a bearish sign that will make me expect to see a move lower towards $30,000 or even lower. The material has been provided by InstaForex Company - www.instaforex.com |
| Posted: 18 Mar 2022 05:28 AM PDT Long positions on EUR/USD: In my forecast this morning, I drew your attention to the level of 1.1045 and recommended entering the market from it. Let's have a look at the 5-minute chart and analyze what happened. In the first half of the day, bulls showed no activity at all. They did not manage to reach 1.1100 which led to the gradual withdrawal of the bulls from the market, who looked for a further rise in the pair, which brought the euro down to support at 1.1045. However, big players didn't show much interest in the market even at that level, as they ignored it and let the price consolidate below it. In the second half of the day, the technical picture had not changed, but the strategy had to be revised.
The lack of fundamental statistics and the fall of optimism among market participants regarding the reduction of geopolitical tensions led to a reduction in demand for risky assets, including the euro, which pushed the EUR/USD pair to the swing lows. In the afternoon today, a number of reports on the US economy were published, which may support the US dollar and lead to the market reversal in favor of the euro buyers. Bulls need to make some efforts to reach above 1.1045, which they failed to do in the first half of the day. Weak data on the US secondary market home sales and the index of leading indicators can help with that, and consolidation above 1.1045 with a reverse test top/bottom may give a signal to open long positions. The first target, in this case, will be resistance at 1.1101. In order to see a major upward move in the EUR/USD pair, it needs more activity and a breakthrough of this level. A top/bottom test at 1.1101 is likely to create a buy signal and open the way to 1.1165, which is a strong resistance that can change the balance of forces in the market in favor of bulls. The next target is a high of 1.1227, where traders may lock in profits. A breakthrough of this level is likely to cancel the bearish trend and trigger sellers' stop-loss orders, opening a direct way to the highs of 1.1271 and 1.1310. However, this scenario can be considered if there is good news about progress in the negotiations between Russia and Ukraine, which, unfortunately, are not scheduled for the near future. Therefore, it is useless to wait for the euro to advance. In the case of a further decline of the pair, it is better not to rush and postpone opening long positions until the nearest support at 1.0996 is tested. A false breakout of this range would be an optimal buy scenario, but to open long positions in the euro on the rebound would be possible only from 1.0953, allowing an upward intraday correction of 30-35 pips. Short positions on EUR/USD: Bears succeeded this morning dropping the pair below 1.1045. Unfortunately, I did not manage to get a sell signal, as I did not see a proper retest of this level. I think I will wait for it in the second half of the day. As long as the pair is trading below 1.1045, we can expect a further decline in the pair. Bears should hold a price below 1.1045 during the US session. A false breakout of this level, after the release of the US economic data, may create an excellent entry point, which will lead to a larger downside movement of the pair. The target is located at 1.0996. A breakthrough of this level may occur only in case of a more aggressive long position profit taking by the end of the week, as well as in case of a worsening of the geopolitical situation. It is reported that Putin discussed with German Chancellor Scholz the progress of the Russian special operation in Ukraine, stating that Moscow is ready to continue to seek solutions in line with its principled approaches in the talks. Also tonight, the Russian president will have a telephone conversation with Macron. An upward reversal test of 1.0996 would open short positions with the prospect of falling to 1.0953 and 1.0903. The new target is at a new low of 1.0855. If the euro grows and bears show a lack of activity at 1.1045, bulls are likely to open more long positions. In this case, it is better not to postpone selling the pair. The optimal scenario would be to go short if a false breakout occurs around 1.1101. Selling the EUR/USD on the rebound is possible from 1.1165 or higher near 1.1227, allowing a downward correction of 15-20 pips.
Signals of indicators: Moving Averages Trading is conducted near the 30- and 50-day moving averages, which indicates some market uncertainty with the trend. Note: The period and prices of moving averages are considered by the author on the one-hour chart that differs from the general definition of the classic daily moving averages on the daily chart. Bollinger Bands In the case of growth, the resistance will be the middle boundary of the indicator around 1.1100. Description of indicators
|
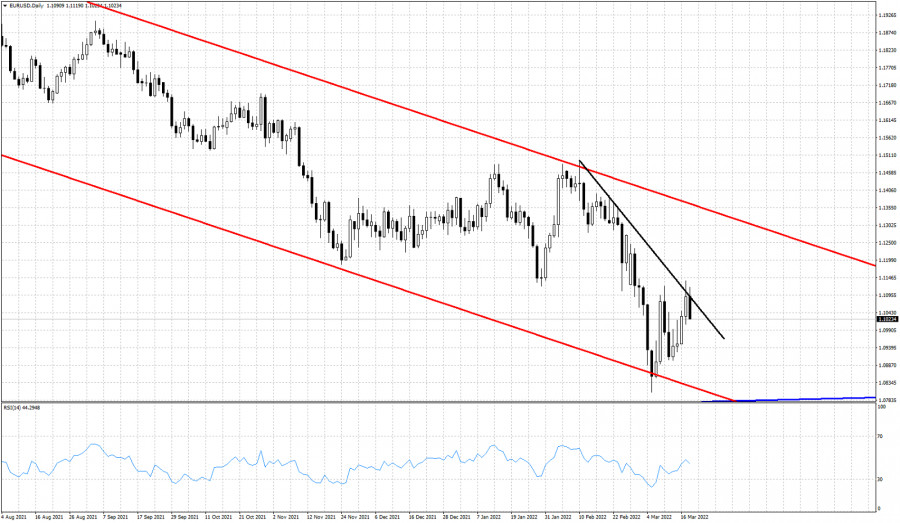
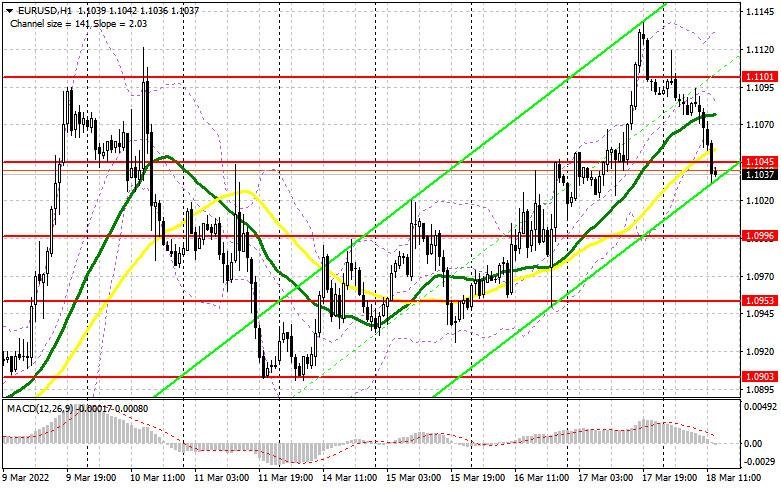
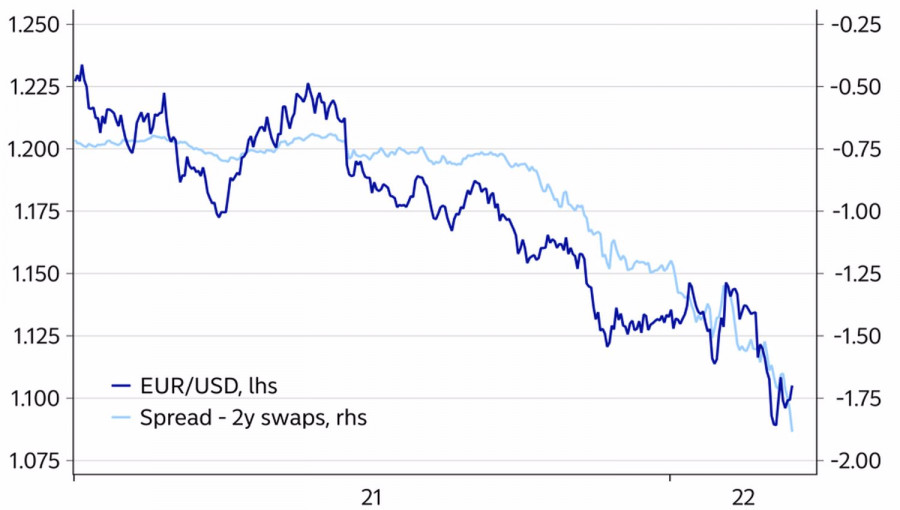
| Is it time to sell the dollar? Posted: 18 Mar 2022 05:01 AM PDT Everyone knows that markets rise on expectations and fall on facts. History shows that over the last four cycles of the Fed's monetary tightening, the U.S. dollar has fallen 4% on average, while steadily strengthening in the 9 months before the first increase in the federal funds rate. In the case of the cycle that the Fed started on March 16, the USD index rose by 7%. Is it time to fall? At the last meeting, the FOMC raised its forecast for the federal funds rate to almost 1.8% in 2022 and 2.8% in 2023. The central bank is ready to tighten monetary policy at every meeting this year and intends to exceed the neutral level of 2.4% to bring inflation to its knees. However, even such an aggressive monetary restriction did not impress the financial markets. U.S. stock indices rose, the dollar weakened. It seems that the divergence in monetary policy is fully taken into account in the EURUSD quotes, which allows us to say that the story of the weakening of the U.S. currency during the Fed's rate hike may repeat itself. Indeed, U.S. Treasury yields and interest rate swap rates have risen so rapidly of late that they would do well to halt and hand the pitch over to their European counterparts. The ECB pretty much surprised the financial markets in March by deciding to end QE ahead of time and hinting at a rate hike. Why shouldn't investors start buying euros? Dynamics of EURUSD and interest rate swap differential
It cannot be said that the divergence in monetary policy is the only driver of the EURUSD peak, which allowed the pair to reach 1.08. In fact, events in Ukraine had a hand in its fall. Europe is much closer to the epicenter of armed conflict than the U.S.; it is more dependent on Russia than the U.S. and is a net importer of energy products. The eurozone economy will obviously suffer more in the first half of the year than the U.S. economy, but in the second half, the cooling of the latter and the recovery in the eurozone may open the door for the euro to rise against the U.S. dollar. Let's not forget about geopolitics. The demand for safe-haven assets associated with it has become one of the key trump cards of the "bears" in EURUSD. The U.S. dollar strengthened due to uncertainty, it has not disappeared, however, the risks are gradually shifting from military operations to diplomacy, and only a new escalation of the armed conflict can return the quotes of the main currency pair to 1.08. Otherwise, we expect medium-term consolidation in the range of 1.09-1.13, followed by a breakout and a hike to 1.15 before the end of this year. Technically, the formation of the 1-2-3 reversal pattern is a wake-up call for the "bears" in EURUSD. If the pair does not fall below 1.1 in the next couple of days, the likelihood of a correction to a long-term downward trend will increase. The reason for buying the euro against the U.S. dollar in the direction of 1.125 and 1.13 will be a break of resistance at 1.113. On the contrary, a successful assault on support at 1.1 is a signal for the formation of short positions on EURUSD with a target at 1.095 and 1.088 as part of the implementation of Linda Raschke's "Holy Grail" strategy. EURUSD, Daily chart
|
| Video market update for March 18,,2022 Posted: 18 Mar 2022 04:48 AM PDT Watch for the bull pattern on USD/CAD.... The material has been provided by InstaForex Company - www.instaforex.com |
| Daily Video Analysis: NZDUSD, H4 Bearish Reversal Opportunity Posted: 18 Mar 2022 04:41 AM PDT Today we take a look at NZDUSD. Combining advanced technical analysis methods such as Fibonacci confluence, correlation, market structure, oscillators and demand/supply zones, we identify high probability trading setups. The material has been provided by InstaForex Company - www.instaforex.com |
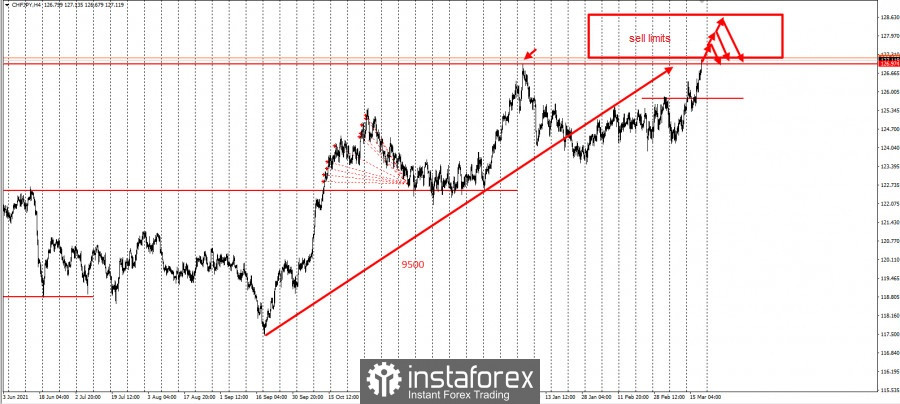
| Posted: 18 Mar 2022 04:41 AM PDT
CHF/JPY has been increasing since September last year. It gained as much as 9,500 pips, and broke through the yearly high today. This happened after the Bank of Japan left interest rates unchanged at its monetary policy meeting.
This scenario calls for a new set of sell limits, which can be placed starting from current prices and above. The increment should be 30-50 pips. Then, take profit on a breakout (127), either at 1 pip above the first order or after a 100 pip rise. This strategy is called grid trading, which is usually used on cross rates. It involves holding positions that are significant in time and distance. For this reason, we recommend using swap-free accounts, not increasing the volumes in the grid (0.01 standard lot for every $ 1,000 of the deposit) and monitor price movements. Good luck and have a nice day! The material has been provided by InstaForex Company - www.instaforex.com |
| European stock market gains on decisions by the world's central banks Posted: 18 Mar 2022 04:39 AM PDT At the close of trading on Thursday, key stock market indicators reported gains on the back of the results of the Bank of England meeting. The STOXX Europe 600 composite index of Europe's leading companies rose 0.45% to 450.49 points. Britain's FTSE 100 stock index gained 1.28% to close at 7385.34 points, France's CAC 40 rose by 0.36% to 6612.52 points and Germany's DAX sank 0.36% to 14388.06 points.
Shares in French diversified company Veolia Environnement SA rose by 2.8% on corporate news of strong financial results for 2021. In addition, the company's management reported an increase in dividend payout to €1 from €0.7 in the year-earlier period. Deliveroo, the UK's online food delivery provider, soared by 6.4% the day before. The company reported a 57% increase in revenue and a 67% increase in gross transaction volume in 2021. The UK grocery-licensing company Ocado Group PLC slipped by 8.2% after reporting weak financial results for the first quarter of the year. The company's shares of German industrial concern Thyssenkrupp AG (-9.4%) posted the biggest losses on Thursday. The day before, the media reported that the company may change the volume of its costs and is considering a spin-off of its steel division due to the geopolitical tension in Eastern Europe. Following its March meeting, the British central bank decided to increase its key interest rate to 0.75% from 0.5%. The current rate hike is thus the third consecutive increase since December of last year and since the start of the COVID-19 pandemic. The Bank of England's decision to raise the base rate was taken against the backdrop of persistently high inflation. The British regulator expects inflation to rise even faster in the coming months and reach 8% in the second quarter of this year. Against the backdrop of a disappointing outlook, the Bank of England is allowing a further moderate tightening of monetary policy. According to preliminary scenarios by market analysts, the British central bank will raise the base rate to 1% at its May meeting. The day before, European stock market participants continued to evaluate the US Federal Reserve's decision to increase its key rate by 25 basis points for the first time in four years. According to the results of the Fed's March meeting, the rate range now stands at 0.25-0.5% per annum. In the meantime, Federal Reserve Chairman Jerome Powell said that the US central bank is prepared to accelerate the pace of monetary policy tightening if necessary. Further decisions to increase the base rate will be made taking into account the latest statistical data at each individual meeting, Powell said. In Thursday's trading, an 8% rise in oil prices added to the upside for European equities. As a result, the European Energy Index instantly soared by 2.2%, while British Petroleum, Shell and TotalEnergies gained 2.1%, 2.7% and 1%, respectively. Consumer prices in the eurozone soared by 5.9% year-on-year last month, the highest level in the history of the indicator's calculation, according to Eurostat. The material has been provided by InstaForex Company - www.instaforex.com |


| You are subscribed to email updates from Forex analysis review. To stop receiving these emails, you may unsubscribe now. | Email delivery powered by Google |
| Google, 1600 Amphitheatre Parkway, Mountain View, CA 94043, United States | |


Comments