Forex analysis review
Forex analysis review |
- Analysis of GBP/USD on March 19. The pound uses the decisions of the Bank of England and tries to lengthen the correction
- EUR/USD analysis on March 19. The euro ended the week on a positive note, but the prospects are not important.
- NFLX downside potential limited.
- Analysis of the trading week of March 14-18 for the GBP/USD pair. COT report. The pound sterling did not understand how to
- Analysis of the trading week of March 14-18 for the EUR/USD pair. COT report. The Fed meeting and the rate hike did not help
- Bitcoin Upside Continuation To Be Confirmed!
- USD/JPY ignores 119.00 psychological level
- USD/CAD aims at 1.2586 lower low
- EUR/USD: imminent breakout and new direction
| Posted: 19 Mar 2022 07:13 AM PDT
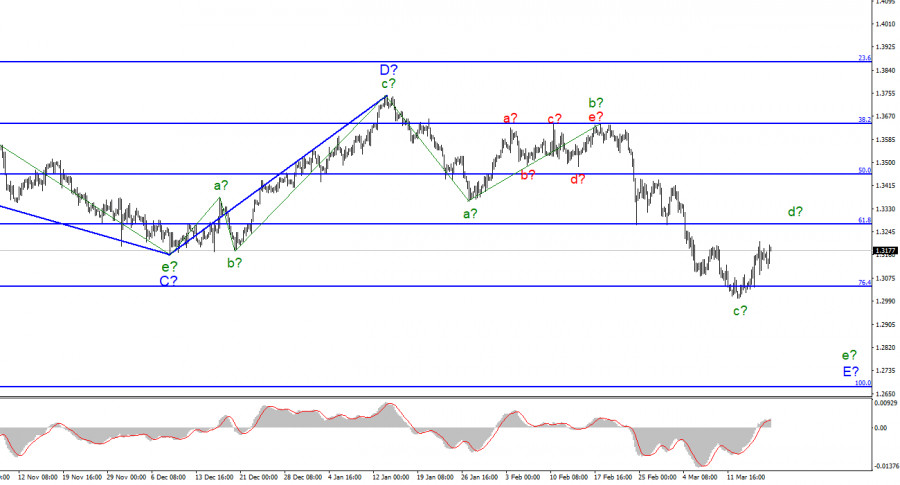
For the pound/dollar instrument, the wave markup continues to look very convincing and does not require any additions. The increase in the quotes of the British dollar in recent days may be a corrective wave d-E and it may be nearing its completion. In total, there should be five waves inside the wave E, respectively, as in the case of the euro/dollar instrument, the downward trend section can continue its construction. At the moment, the quotes of the British are only slightly below the low of wave C. This indirectly suggests that the decline has not yet been completed, and the last descending wave E may turn out to be more extended. A successful attempt to break through the mark of 1.3041, which equates to 76.4% by Fibonacci, may lead to an increase in demand for the US currency. However, most likely, this option should be counted on already with the beginning of the construction of the wave e-E. I don't see any alternative options for wave marking yet. Everything is quite unambiguous. Geopolitical information has a devastating effect on the British, but this influence fully corresponds to the current wave markup. The Bank of England supported the pound, but the support is weak. The exchange rate of the pound/dollar instrument increased by 30 basis points during March 18. Thus, presumably, the construction of a corrective upward wave continues. There was practically no news background on Friday, but the market had enough of the news it received earlier this week. Let me remind you that the Bank of England and the Fed held their second meetings this year and both raised interest rates by 25 basis points. Since in the case of the Fed, this not only did not come as a surprise, but the market itself expected an increase of 50 basis points, the British received support. Since in the case of the Bank of England, the market was not completely sure that it would go for a third rate hike in a row, this decision also increased demand for the British. But this is only if we talk about everything that happened at the end of all the weeks. After the Bank of England raised the rate, the British collapsed by 110 points. Everything was very ambiguous. It is because of this ambiguous reaction that I believe that the construction of an upward wave will be short-lived. The market had a great opportunity to take the Briton as high as possible, but it took advantage of it by 20 percent. On Friday, the instrument failed to break through its previous peak, so perhaps the construction of a new downward wave e-E has already begun. Thus, next week, the demand for Americans should grow to preserve the integrity of the wave marking. The euro currency is also ready to build a new downward wave, so both instruments can begin to perform this task. General conclusions. The wave pattern of the pound/dollar instrument assumes the construction of a wave E. I continue to advise selling the instrument with targets located near the 1.2676 mark, which corresponds to 100.0% Fibonacci, according to the MACD signals "down", since wave E does not look completed yet. The proposed wave d-E may already be completed, or it may take a three-wave form. But we are still only interested in selling signals since there are no grounds for making adjustments to the markup yet.
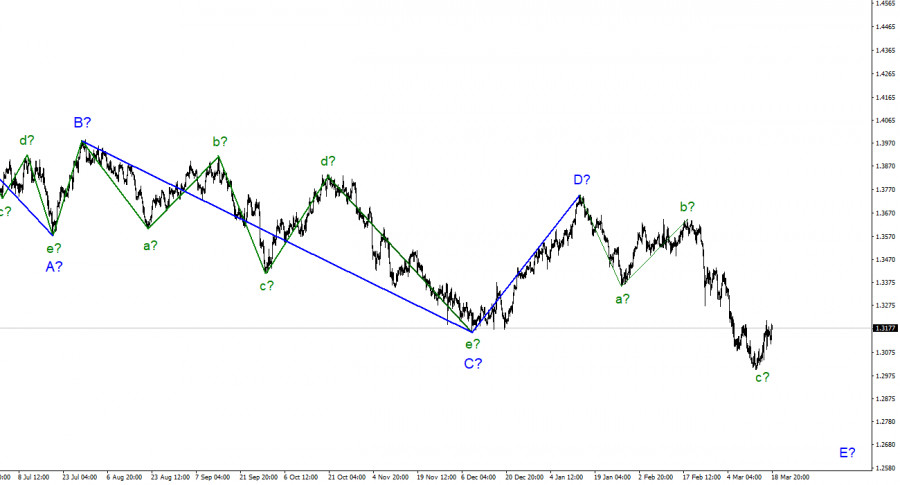
At the higher scale, wave D looks complete, but the entire downward section of the trend does not. Therefore, in the coming weeks, I expect the decline of the instrument to continue with targets well below the low of wave C. Wave E should take a five-wave form, so I expect to see the British quotes around the 27th figure. The material has been provided by InstaForex Company - www.instaforex.com |
| Posted: 19 Mar 2022 06:06 AM PDT
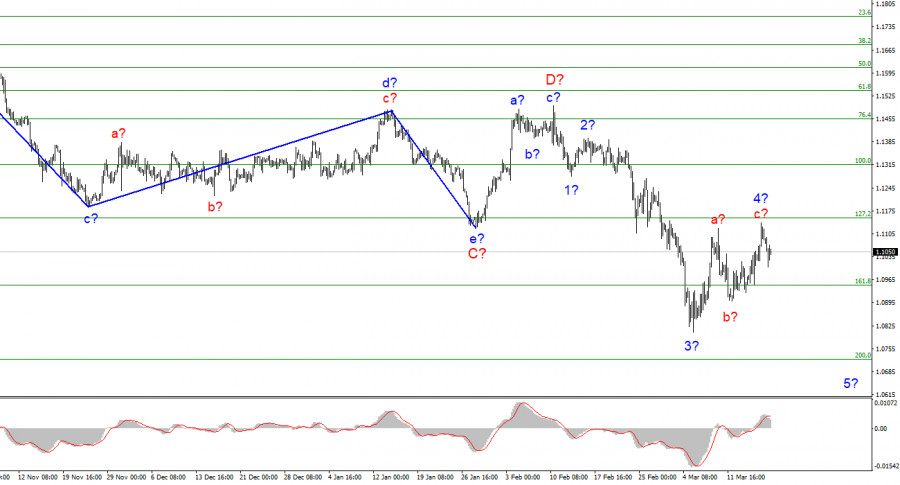
The wave marking of the 4-hour chart for the euro/dollar instrument still does not change and looks quite convincing. At this time, the construction of the proposed wave E is continuing, which should take a five-wave form. The low of the previous wave was broken, thus building a downward trend section. Since wave E has already taken on a sufficiently extended form, a scenario appears in which the construction of this wave will soon be completed. However, so far, the internal wave marking of wave E indicates that wave 4 has now been completed, and the construction of wave 5 has begun. Wave 4 has taken a clear three-wave form and is much more massive than the corrective wave 2. However, if it becomes even more complicated, it may cast doubt on the further decline in the quotes of the instrument. This wave can also take the five-wave form a-b-c-d-e, but in this case, it will be knocked out of the general wave pattern. Therefore, I expect that the decline in quotes will resume next week with targets located near the 7th figure. I am not considering alternative options yet, since there are no serious violations in the current wave marking. The euro currency took advantage of a temporary respite. The euro/dollar instrument fell by 50 basis points on Friday. The decline was weak enough, however, it is still enough to suggest a transition to the construction of a descending wave 5. If this is true, then the decline will continue in the coming weeks. From my point of view, the decline should have started much earlier, but the Fed meeting this week led to a rather contradictory market reaction. I expected to see an increase in the dollar, not the euro, given that the rate was raised by 25 basis points, and Jerome Powell announced six more interest rate hikes this year. But, perhaps, the market was originally programmed to build a three-wave wave 4. If so, now this plan has been implemented and now it is possible to start new sales. Separately, I would like to note that there has been little geopolitical news in recent days. I mean those that could lead to a de-escalation of the conflict in Ukraine. Several important speeches have taken place, several important telephone conversations have taken place, but it seems that world leaders are voicing a maximum of 5% of what they discuss with other world leaders. The most important news now is the refusal to close the skies over Ukraine by NATO, Macron's statement about the need to prepare for World War III, Washington's statement that he does not see Moscow's real efforts to reach a peace agreement, London's statement that Moscow is preparing a second wave of offensive, as well as Xi Jinping's statement that Peace should be restored in Ukraine. But all this news, as you understand, does little to restore peace in Ukraine. Thus, the market still has all the necessary grounds to buy the US currency again, in accordance with the current wave markup. General conclusions. Based on the analysis, I conclude that at this time the construction of wave E continues. If so, now is still a good time to sell the European currency with targets located around the 1.0723 mark, which corresponds to 200.0% Fibonacci, for each MACD signal "down". The current wave layout still allows for the construction of a wave 5-E.
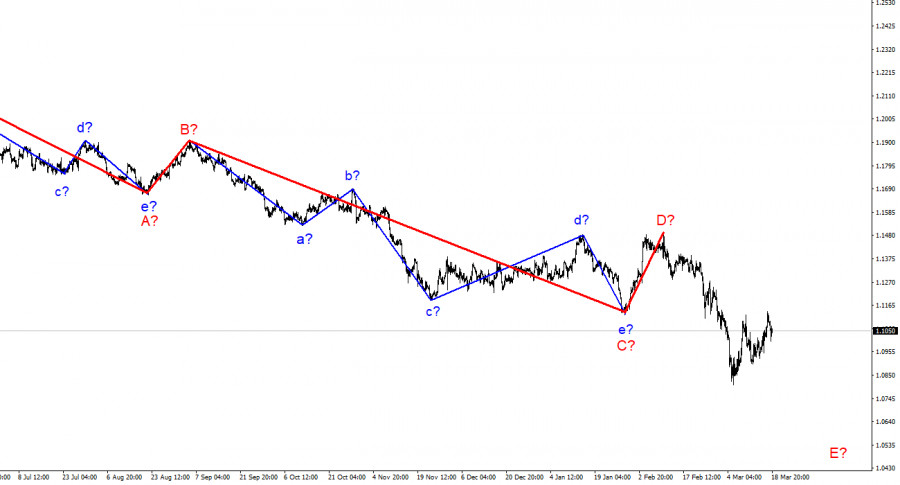
On a larger scale, it can be seen that the construction of the proposed wave D has been completed, and the instrument has already updated its low. Thus, the fifth wave of a non-pulse downward trend section is being built, which may turn out to be as long as wave C. If this assumption is correct, then the European currency will still decline. The material has been provided by InstaForex Company - www.instaforex.com |
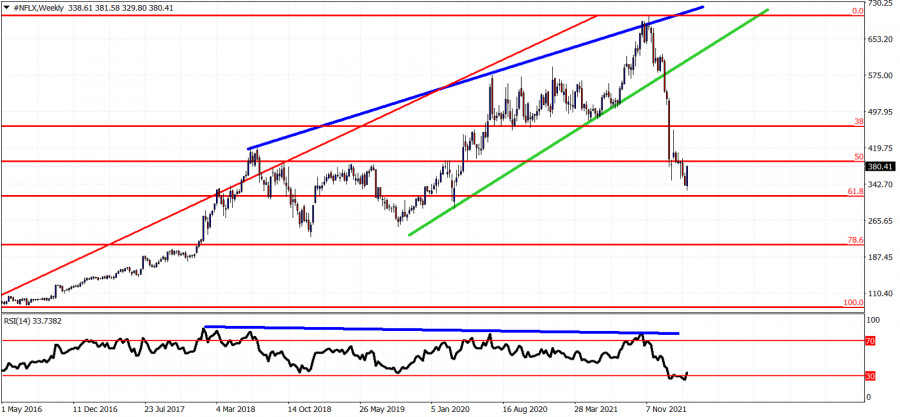
| NFLX downside potential limited. Posted: 19 Mar 2022 03:50 AM PDT NFLX has reached oversold levels on a weekly basis. At current levels I believe the downside potential is limited. I prefer to be neutral as a strong bounce higher could be imminent.
Green line - support (broken) Red lines Fibonacci retracement On our January 8th 2022 analysis we warned traders for the first time that NFLX was providing a bearish signal and we were bearish. Price has now reached the 61.8% Fibonacci retracement of the rise from the $80 price range and the RSI is turning upwards from oversold levels. At current levels I prefer to be neutral as I believe the downside potential is limited. Yes price could make a new lower low towards $320 but after such a big decline I believe bears should not be greedy. I expect a bounce to follow soon. The $450-$460 area is a possible bounce target area. The material has been provided by InstaForex Company - www.instaforex.com |
| Posted: 19 Mar 2022 02:57 AM PDT Long-term perspective.
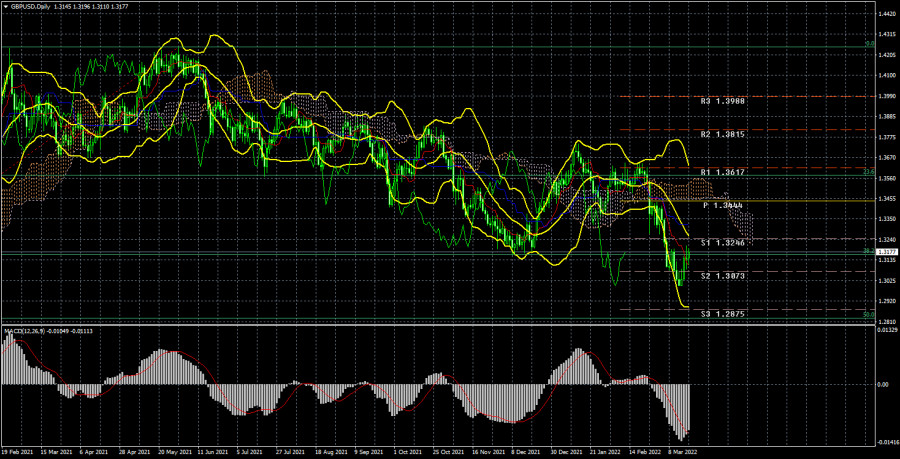
The GBP/USD currency pair has increased by 150 points during the current week. Thus, a new upward correction has begun. We have already said that the pound sterling is adjusted quite often and at the same time becomes cheaper against the dollar much less willingly than the euro currency. At the moment, the pound has adjusted against the dollar by only 42-43% of the upward trend of 2020. At the same time, the euro currency adjusted by more than 90%. Thus, no matter how the pound has fallen in recent weeks, it still shows twice as high resistance to the dollar compared to the euro. The current correction can also be quite deep, like all the previous ones. This week, there were two important events at once that the pound could not ignore. The meetings of the central banks of the United Kingdom and the United States were almost identical in their results. Both banks raised the key rate by 0.25%, both banks expressed serious concern about high inflation, both banks assumed that inflation would continue to rise and showed readiness to continue tightening monetary policy. Thus, it cannot be concluded that following the results of this week, the pound or the dollar should have risen in price. In the euro/dollar review, we said that "technology" could have crossed out the "foundation" this week. Most likely, this statement is also true for the pound/dollar pair. Geopolitics has begun to ease its pressure on risky currencies and instruments a little, thanks to which bitcoin has grown a little, and the US stock market, and the euro and the pound. However, so far we are talking only about another correction, and not about an upward trend. COT analysis. The latest COT report on the British pound showed an increase in the "bearish" mood among professional traders. However, in general, the mood of the major players has changed too often in recent months, which is seen by the two indicators in the illustration above: they are constantly changing the direction of their movement. At the moment, the number of open purchase contracts is less than the number of sale contracts by almost 30 thousand. Although two weeks ago their number was almost the same. Earlier, we concluded that the major players could not make a decision regarding the British pound, but we also drew attention to the fact that with the complication of the geopolitical situation, the demand for the US currency grew very much, which could "cross out" the data of the COT reports. However, the current picture of what is happening in the foreign exchange market is already beginning to correspond to the COT reports. Thus, the pound may now be at the beginning of a new round of decline. But, since in recent weeks it has only been falling, now another upward correction may follow, and then everything will depend on the geopolitical background. Like the mood of traders, the market situation can change rapidly. A month ago, few people believed that an armed conflict could break out in the center of Europe on a huge territory. Therefore, you need to be prepared for everything, and use COT reports only as an additional factor of assessment and forecasting. Analysis of fundamental events. The fundamental background in the UK and the US was very strong this week. A meeting of the Bank of England, a meeting of the Fed, reports on unemployment and wages in Britain, and a few more secondary reports in the United States. Of course, all the attention of traders was focused on the meetings of the two Central Banks. However, we cannot say that the reaction to these meetings and their results was unambiguous and logical. Most likely, the market has already developed a certain trading strategy and does not intend to change it due to isolated events. In principle, the pound began to adjust at the beginning of the week, so it was busy with this all week. Plus, both central banks made similar decisions, so it was difficult to give the advantage to the dollar or the pound. Thus, we believe that at this time "technology" and geopolitics play a greater role. Unfortunately, geopolitics is very difficult to predict, so you will have to rely more on "technology". Trading plan for the week of March 21-25: 1) The pound/dollar pair has started to adjust, but so far the correction is quite weak. Now the key level for the pair is 1.2829 (50.0% Fibonacci), on overcoming or overcoming which the prospects of the pound depend. However, it still needs to be reached. So far, the pair has targeted the critical Kijun-sen line. If it is not overcome, then the fall of the British currency will resume with the goal indicated above. 2) But the prospects for an upward movement have deteriorated significantly and so far there is not a single reason to buy the pound. This is indicated by the technique since even during the last round of growth, the price failed to update its previous local peak. That is, it was just a strong round of correction, after which the main movement resumed. And the departure of quotes below the previous local minimum indicates just the preservation of the downward trend. Therefore, purchases are not relevant now. Explanations to the illustrations: Price levels of support and resistance (resistance /support), Fibonacci levels - target levels when opening purchases or sales. Take Profit levels can be placed near them. Ichimoku indicators (standard settings), Bollinger Bands (standard settings), MACD (5, 34, 5). Indicator 1 on the COT charts - the net position size of each category of traders. Indicator 2 on the COT charts - the net position size for the "Non-commercial" group. The material has been provided by InstaForex Company - www.instaforex.com |
| Posted: 19 Mar 2022 02:30 AM PDT Long-term perspective.
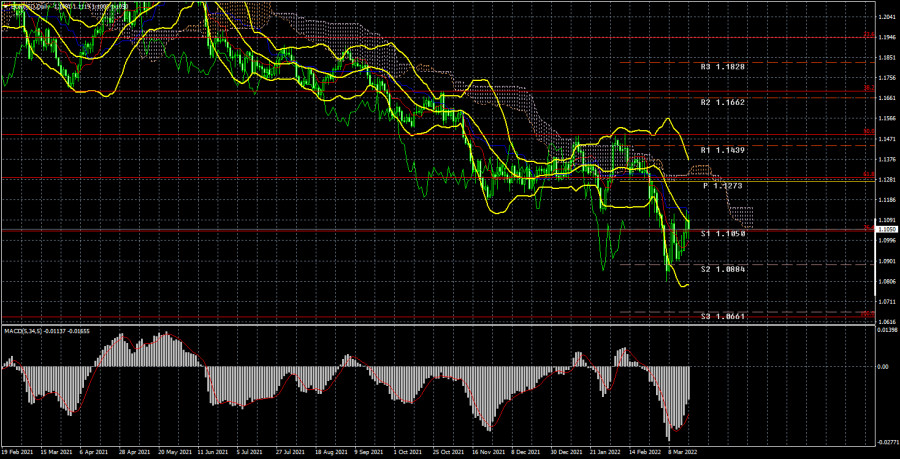
The EUR/USD currency pair has made another attempt to start an upward correction during the current week. But, as a week earlier, it could not overcome the critical Kijun-sen line, so the downward movement of the pair may resume. The key event this week was the Fed meeting. However, it did not lead at all to the movement that most traders could count on. Although the key rate was raised for the first time in three years, traders at that time were quite actively selling the US currency. That is, the reaction was exactly the opposite. However, if we try to look at the picture more globally, it turns out that the European currency has declined very much even before the Fed meeting. Of course, then there were their reasons, namely geopolitics. Recall that on February 24, a military conflict began in Ukraine, which has not yet been completed. However, if the European currency were falling on absolutely every important news or topic, it would already be below price parity with the US dollar. Simply put, whatever the fundamental background, the pair should be adjusted from time to time. And this week, it happened that the "technique" turned out to be stronger than the strong "foundation". However, if we take a medium-term perspective, absolutely nothing has changed for the European currency. The ECB not only did not raise the rate but also did not give a single signal of readiness for tightening this year. The Fed, on the contrary, made it clear that it is ready to raise the rate 6 more times this year alone. In addition, the geopolitical conflict in Eastern Europe puts pressure on the euro currency, not on the dollar. In addition, the European economy is in a much weaker state than the American one. From our point of view, all these factors will continue to harm the euro/dollar pair. COT analysis. In the last two months, COT reports have signaled such changes in the mood of traders, which did not correspond to what was happening in the foreign exchange market. Simply put, the European currency continued to fall, while large professional traders increased purchases. We said that such divergence could arise since the demand for the US currency increased sharply, which was simply higher than for the euro. However, the latest COT report showed that the big players are also starting to change their preferences. During the last reporting week, the Non-commercial group reduced the number of buy contracts by 40 thousand. That's a lot. The general mood of non-commercial traders remains "bullish", as the number of buy contracts exceeds the number of sell contracts by 19 thousand. However, trends are important to us. And now the trend is such that even major players can start selling the European currency again. This is on top of the fact that the demand for the US dollar also remains high. Thus, the net position of the "Non-commercial" group decreased significantly last week and now almost all factors speak in favor of a further fall in the euro currency. Therefore, the European currency can now show growth from time to time only based on the technical necessity to adjust. Analysis of fundamental events. There have been quite a lot of interesting events in the European Union during the current week. In particular, the report on industrial production showed zero growth in January, and the consumer price index managed to grow even stronger in the second assessment for February and amounted to 5.9%. ECB President Christine Lagarde spoke twice this week and both times spoke about the need to stabilize prices, but she never said how this stabilization would be achieved. The European economy is weak, so rates cannot be raised. Inflation is rising and will continue to rise due to high prices for energy and raw materials, the geopolitical conflict in Eastern Europe, the deterioration of supply chains (many of which are tied to Ukraine for the European Union). Thus, the ECB is going to just wait for prices to settle by themselves. Lagarde said that in the medium term, inflation will return to 2%, but that in her concept of "medium-term perspective" is unknown. In general, there is nothing to fight inflation in the EU. Trading plan for the week of March 21-25: 1) In the 24-hour timeframe, the pair began to adjust and managed to grow to the critical line. However, at any moment, the fall of the euro currency may resume, since almost all factors speak in favor of further growth of the dollar, and not vice versa. Therefore, if it is not possible to gain a foothold above the Kijun-sen line, then the fall will resume with targets of 1.0884 and 1.0661. So far, sales remain the most relevant. 2) As for purchases of the euro/dollar pair, they are not relevant now. First, there is not a single technical signal or sign that an upward trend may begin. Second, the "macroeconomics" that could theoretically support the euro is simply ignored. Third, geopolitics may continue to put pressure on traders and investors who still believe that in any unclear situation it is necessary to buy the dollar. And even if the price overcomes the critical line, it does not guarantee its further growth. Over the past 8 months, the price has failed to overcome the Senkou Span B line several times on the 24-hour TF. Explanations to the illustrations: Price levels of support and resistance (resistance /support), Fibonacci levels - targets levels when opening purchases or sales. Take Profit levels can be placed near them. Ichimoku indicators (standard settings), Bollinger Bands (standard settings), MACD (5, 34, 5). Indicator 1 on the COT charts - the net position size of each category of traders. Indicator 2 on the COT charts - the net position size for the "Non-commercial" group. The material has been provided by InstaForex Company - www.instaforex.com |
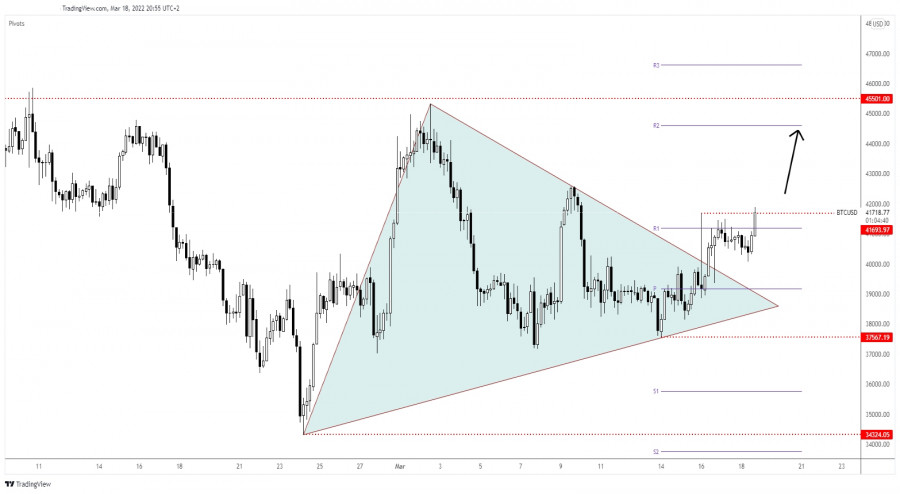
| Bitcoin Upside Continuation To Be Confirmed! Posted: 18 Mar 2022 01:26 PM PDT The price of Bitcoin rallied in the second part of the day. It has climbed as much as 41,900. Now, it's trading at 41,722 at the time of writing and is fighting hard to take out the resistance represented by the 41,693. BTC/USD increased by 4.57% from 40,068 today's low to 41,900 today's high. Technically, the price of bitcoin signaled that the downside seems over and that the buyers could push it higher again. BTC/USD Breakout Attempt!
As you can see on the h4 chart, the BTC/USD escaped from the symmetrical triangle and now it seems determined to resume its growth. 41,693 former high stands as an upside obstacle. A valid breakout above this static resistance could activate further growth. Technically, the upside pressure is high after failing to retest the 40,000 psychological level. BTC/USD Prediction!Confirming its breakout above 41,693 could activate a potential further growth towards the weekly R2 (44,604). In my opinion, only failing to stay above the weekly R1 of 41,198 could invalidate an upside continuation. The material has been provided by InstaForex Company - www.instaforex.com |
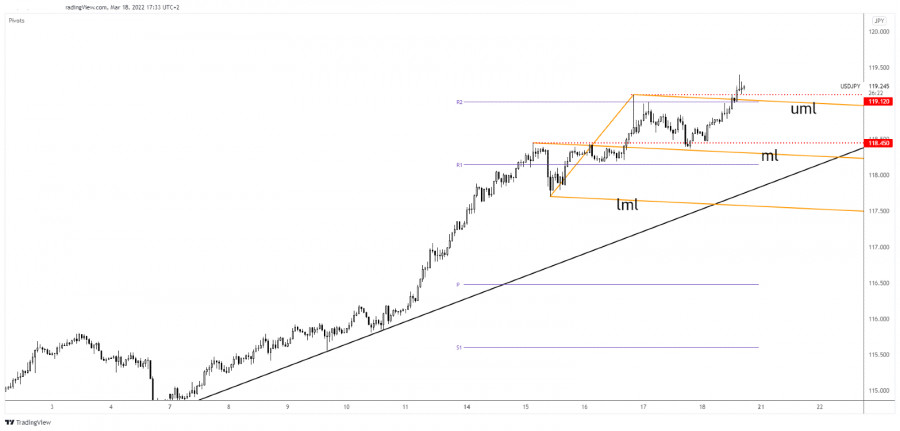
| USD/JPY ignores 119.00 psychological level Posted: 18 Mar 2022 10:20 AM PDT The USD/JPY pair climbed as much as 119.39 level after ignoring the near-term resistance levels. It's traded at 119.21 at the time of writing. After its strong rally, we cannot exclude a minor drop. The rate could come back to test and retest the broken levels before extending its growth. The pair edged higher as the DXY's rally boosted the USD, while the Japanese Yen Futures sell-off weakened the Yen. Also, the BOJ maintained its monetary policy unchanged, sustaining that more stimulus measures could be added if necessary. The BOJ Policy Rate remains at -0.10%. In addition, the Tertiary Industry Activity came in better than expected, while the National Core CPI came in line with expectations. On the other hand, the US Existing Home Sales was reported at 6.02M below 6.10M expected, while the CB Leading Index rose by 0.3% matching expectations. USD/JPY Validates Its Breakout!
In the short term, after registering only a false breakout above the weekly R2 (119.02), the price retreated a little. It has retested the 118.45 former high which stands as static support. Now, it has passed above the R2, 119.12 former high, and above the descending pitchfork's upper median line (uml) signaling potential upside continuation. After its rally, a temporary decline is natural. It could test and retest the mentioned levels before resuming its growth. USD/JPY Outlook!Stabilizing above the R2 (119.02), consolidation above the broken resistance levels could confirm further growth and could bring new long opportunities. An upside continuation could be invalidated if the rate fails to stay above the R2. The material has been provided by InstaForex Company - www.instaforex.com |
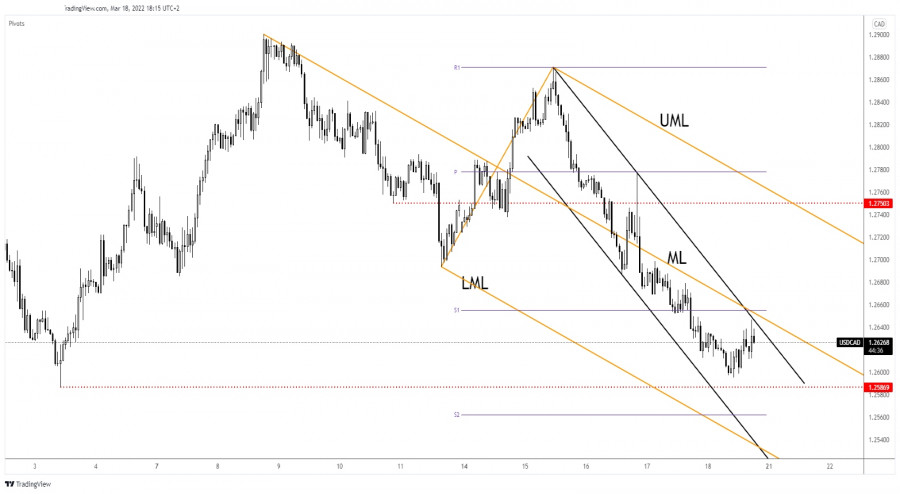
| USD/CAD aims at 1.2586 lower low Posted: 18 Mar 2022 10:19 AM PDT The USD/CAD pair drops at the time of writing. It's trading at 1.2623 level and it seems very heavy despite the temporary rebound. The price turned to the upside and it has managed to recover only because the Dollar Index rebounded after reaching 97.73 key level. The bias is still bearish as CAD received a helping hand from the Canadian retail sales data. The Retail Sales indicator rose by 3.2% in January versus 2.4% expected and after a 2.0% drop in December. Furthermore, Core Retail Sales surged by 2.5% exceeding the 2.3% forecasts. Fundamentally, the USD received a hit from the US Existing Home Sales which dropped from 6.49M to 6.02M below 6.10M estimates. USD/CAD Down Channel!
As you can see on the h4 chart, USD/CAD drops within a down-channel pattern. As long as it stays below the downtrend line and under the median line (ML). In the short term, it has tried to recover after its amazing sell-off. 1.2586 lower low is seen as a potential downside target. Only a major and strong bullish reversal signal around this level could announce that the sell-off is over. Actually, the down channel could represent a bullish pattern. USD/CAD Outlook!The currency pair could announce a new leg higher and could bring fresh long opportunities if it stays above the 1.2586 and if it makes a valid breakout above the downtrend line and through the median line (ML). A valid breakdown below the 1.2586 could activate a larger downside movement. The material has been provided by InstaForex Company - www.instaforex.com |
| EUR/USD: imminent breakout and new direction Posted: 18 Mar 2022 10:18 AM PDT
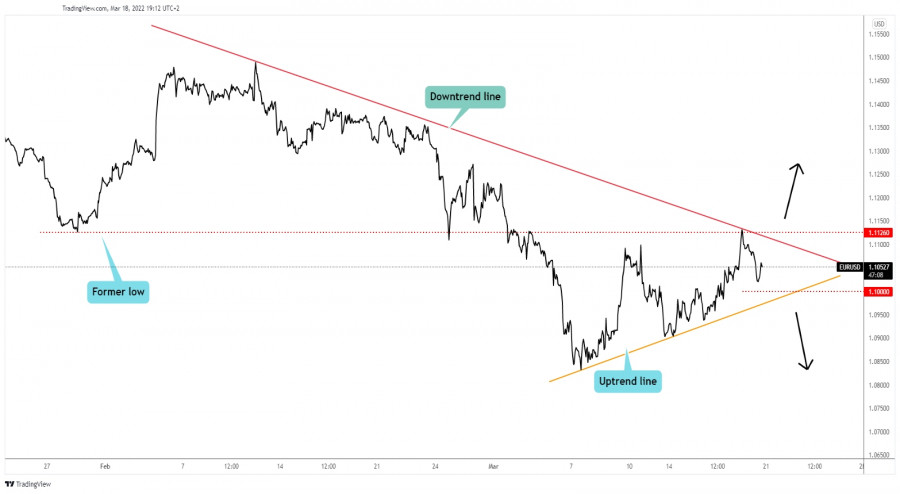
EUR/USD At Crossroads!The EUR/USD pair is moving somehow sideways in the short term. It's trapped between the downtrend and the uptrend lines. A breakout through one of these lines could bring new trading opportunities and could offer us a clear direction. The pair is trading at 1.1059 at the time of writing and a further trajectory seems undecided. It's trapped also between 1.1126 and 1.1000 levels. In the short term, it could continue to move sideways before registering a valid breakout. EUR/USD Trading Conclusion!Dropping and stabilizing below the 1.1000 and below the uptrend line could announce a downside movement. Jumping and stabilizing above the 1.1126 and above the downtrend line may announce a larger growth. The material has been provided by InstaForex Company - www.instaforex.com |
| You are subscribed to email updates from Forex analysis review. To stop receiving these emails, you may unsubscribe now. | Email delivery powered by Google |
| Google, 1600 Amphitheatre Parkway, Mountain View, CA 94043, United States | |


Comments