Forex analysis review
Forex analysis review |
- Technical Analysis of ETH/USD for March 24, 2022
- Indicator analysis of GBP/USD for March 24, 2022
- Technical Analysis of BTC/USD for March 24, 2022
- Technical Analysis of GBP/USD for March 24, 2022
- Technical Analysis of EUR/USD for March 24, 2022
- Indicator analysis of EUR/USD for March 24, 2022
- Hot forecast for EUR/USD on 24/03/2022
- GBPNZD Potential For Bearish Reversal | 24th March
- Elliott wave analysis of AUD/USD for March 24, 2022
- GBPUSD Bullish Continuation | 24th Mar 2022
- Elliott wave analysis of Crude Oil for Match 24, 2022
- ETHUSD, Bullish Pressure | 24th March 2022
- Trading plan for Bitcoin for March 24, 2022
- GBP/USD: trading plan for European session on March 24. Overview of yesterday trading. GBP nosedives following UK inflation
- Trading plan for EUR/USD for March 24, 2022
- How to trade GBP/USD on March 24, 2022. Tips and trades analysis for beginners
- Trading signal for EUR/JPY for March 24 - 25, 2022: sell below 132.53 (5/8 Murray - 21 SMA)
- Forecast for EUR/USD on March 24, 2022
- Forecast for GBP/USD on March 24, 2022
- Forecast for AUD/USD on March 24, 2022
- Forecast for USD/JPY on March 24, 2022
- Forecast and trading signals for GBP/USD for March 24. Detailed analysis of the pair's movement and trade deals. The pound
- Forecast and trading signals for EUR/USD for March 24. Detailed analysis of the pair's movement and trade deals. Perfect
- Gold and silver - prospects of the precious metals market
- How to trade EUR/USD on February 24? Simple tips for beginners.
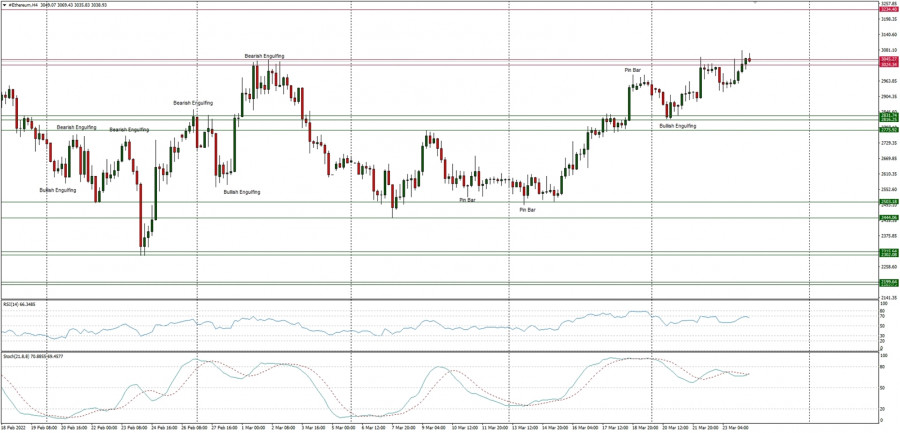
| Technical Analysis of ETH/USD for March 24, 2022 Posted: 24 Mar 2022 12:53 AM PDT Crypto Industry News: The Central Bank of Russia (CBR) has advised domestic commercial banks to step up their monitoring of user transactions, which may be aimed at circumventing "CBR's special economic measures to counter the outflow of foreign currency," local media reported. The recommendation includes stricter supervision of cryptocurrency trading, which is mentioned among the tools for withdrawing capital from Russia. A letter sent to banking organizations by CBR vice president Yuri Isaev on Wednesday instructs them to pay more attention to cases of "unusual behavior" of their clients. This includes "irregular" trading activity and unusual spending patterns. As the letter shows, any withdrawals via digital currencies should also attract more attention. If necessary, suspicious transactions should be blocked and reported to the Federal Service for Financial Monitoring (Rosfinmonitoring). In the first days of the war and the resulting economic sanctions, special measures were adopted to limit the outflow of foreign currencies. These include the limitation of foreign currency transactions of Russian citizens to $ 5,000, as well as $ 10,000 for those traveling abroad. Government approval is required to purchase real estate, securities and other assets from residents of "hostile" jurisdictions. The vice-president of the Union of Russian Banks, Alexei Vojlukov, explained to journalists that the CBR's recommendations are aimed at preventing the spread of circumvention schemes, especially through cryptocurrency exchanges. Technical Market Outlook: The ETH/USD pair had broken above the technical resistance located at the level of $3,045 and a new high was made at the level of $3,080 (at the time of writing the article). In a case of a further breakout higher, the next target for bulls is the supply zone located between the levels of $3,244 - $3,287. As long as the price stays above the technical support seen at $2,831 - $2,778 the outlook is bullish. The strong and positive momentum supports the bullish outlook. Weekly Pivot Points: WR3 - $3,607 WR2 - $3,304 WR1 - $3,113 Weekly Pivot - $2,810 WS1 - $2,610 WS2 - $2,316 WS3 - $2,211 Trading Outlook: The market keeps trying to bounce higher after over the 50% retracement made since the ATH at the level of $4,868 was made. The level of $3,192 is the next key Fibonacci retracement for bulls, but the bulls had failed to break through three times already. On the other hand, the next long-term technical support is located at $1,721 (61% Fibonacci retracement of the last big impulsive wave up) is still the key long-term.
|
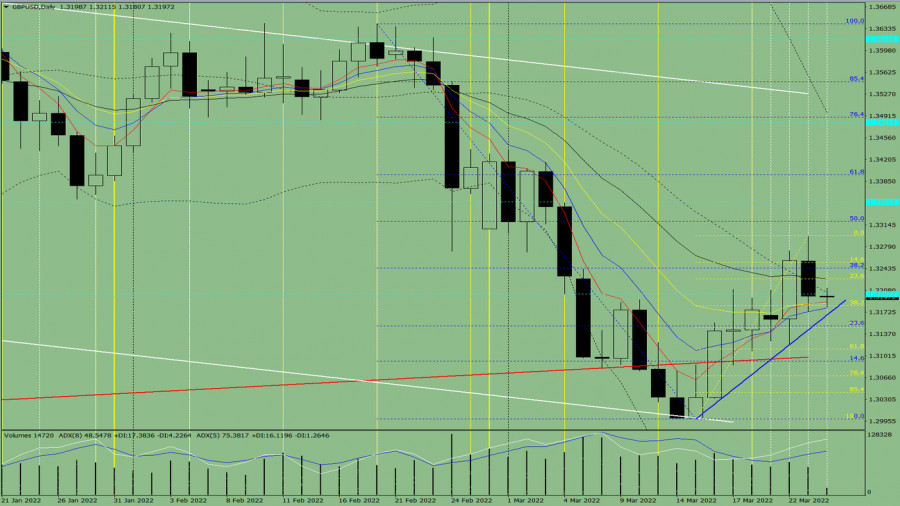
| Indicator analysis of GBP/USD for March 24, 2022 Posted: 24 Mar 2022 12:47 AM PDT Trend analysis (Fig. 1). The market may move down from the level of 1.3199 (close of yesterday's daily candle) to the target level of 1.3169, the support line (thick blue line). In case of testing this level, the price may move upward the target level of 1.3244, the 38.2% retracement level (blue dotted line). In case of testing this level, the upward movement may continue.
Fig. 1 (daily chart). Comprehensive analysis:
General conclusion: The price may move down from the level of 1.3199 (close of yesterday's daily candle) to the target level of 1.3169, the support line (thick blue line). In case of testing this level, the price may move upward the target level of 1.3244, the 38.2% retracement level (blue dotted line). In case of testing this level, the upward movement may continue. Alternative scenario: from the level of 1.3199 (close of yesterday's daily candle), the price may move down to the target level of 1.3169, the support line (thick blue line). In case of testing this level, the price may continue to move down to the target level of 1.3112, the 61.8% retracement level (yellow dotted line). In case of testing this level, the price may move up. The material has been provided by InstaForex Company - www.instaforex.com |
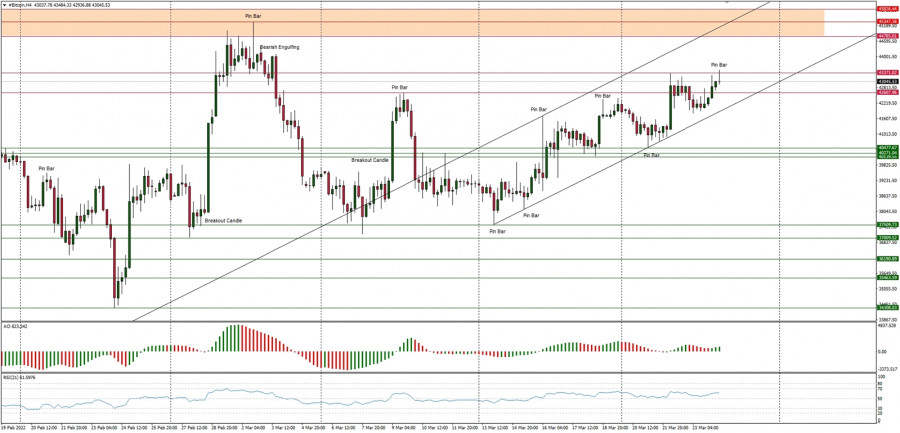
| Technical Analysis of BTC/USD for March 24, 2022 Posted: 24 Mar 2022 12:43 AM PDT Crypto Industry News: The Thai Securities and Exchange Commission has decided to block cryptocurrency payments. As an argument, the risk of an adverse impact on the stability of the financial system was given. Companies operating in Thailand should stop accepting such payments in early April. In late November last year, Governor Yuthasak Supasorn, who is responsible for tourism there, announced that the country needs to attract people using cryptocurrencies. He considered it crucial to introduce solutions that would allow crypto enthusiasts to pay with cryptocurrencies without the need to exchange them for fiats and worry about taxes. It is therefore difficult to understand why the Securities and Exchange Commission has announced a ban on accepting such payments. The necessity to disclose information about the use of solutions and assess the quality of services offered by companies related to cryptocurrencies (mainly exchanges and brokers) was introduced. The decision to block crypto payments announced by the Thai Securities and Exchange Commission was consulted with the Bank of Thailand (BOT). It has been established that they can affect the stability of the financial system and the general economic system, which poses a risk to individuals and companies. "(...) may affect the stability of the financial system and overall economic system including risks to people and businesses". It is mainly about high price volatility, the risk of money laundering and theft of funds. Companies that will not comply with the new ban must take into account an order to suspend or close their operations. Fortunately, both the Securities and Exchange Commission and the Bank of Thailand are aware of the benefits of blockchain technology and declare to continue to support the development of innovation. Technical Market Outlook: The BTC/USD pair continues to move higher inside the ascending channel and the technical resistance located at the level of $43,771 had been violated. The next target for bulls is the big supply zone located between the levels of $44,785 - $45,823. The market is trading inside the ascending channel and as long as the price stay inside the channel and above the technical support seen at $41,803 the outlook remains bullish. The strong and positive momentum supports the view. Weekly Pivot Points: WR3 - $48,672 WR2 - $45,530 WR1 - $43,812 Weekly Pivot - $40,165 WS1 - $38,913 WS2 - $35,770 WS3 - $33,971 Trading Outlook: The market still keeps trying to bounce after over the 60% retracement made since the ATH at the level of $68,998 was made. The level of $45,427 is the key technical resistance for bulls, but the game changing technical supply zone is seen between the levels of $52,033 - $52,899. When this zone is clearly broken, the BTC is back to the up trend, otherwise the bearish pressure might push down the BTC towards the level of $29,254.
|
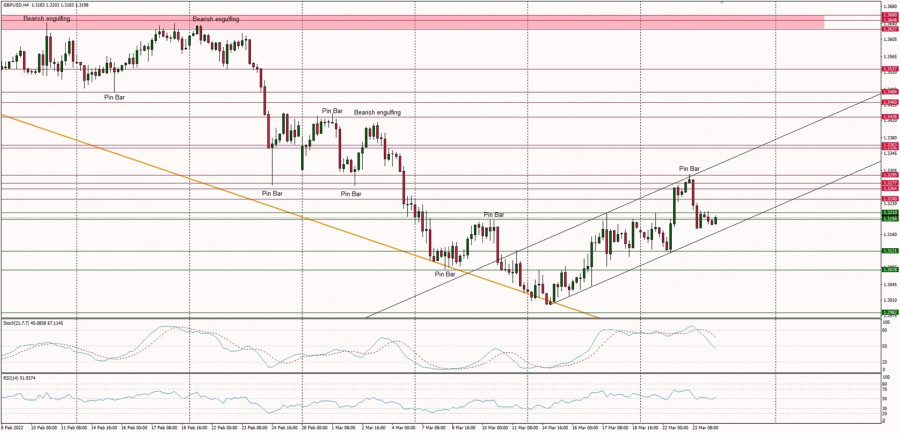
| Technical Analysis of GBP/USD for March 24, 2022 Posted: 24 Mar 2022 12:37 AM PDT Technical Market Outlook As anticipated, the GBP/USD pair has made the local high at the level of 1.3297, but due to the overbought market conditions price pulled back towards the level of 1.3194 (technical support). Any sustained violation of the level of 1.3194 will indicate a possibility of a deeper correction, so please keep an eye on this level and on the whole demand zone located between the levels of 1.3121 - 1.3110. The nearest technical resistance is seen at the level of 1.3210 and 1.3240. Weekly Pivot Points: WR3 - 1.3487 WR2 - 1.3345 WR1 - 1.3272 Weekly Pivot - 1.3138 WS1 - 1.3067 WS2 - 1.2918 WS3 - 1.2816 Trading Outlook: If the market will break below the level of 1.3169, the up trend on the weekly time frame is terminated and the bears enforce and confirm their control over the market in the long term. The Cable is below 100 and 200 WMA already, so the bearish domination is clear. The next long term target for bears is seen at the level of 1.2751 and 1.2663. Please remember: trend is your friend.
|
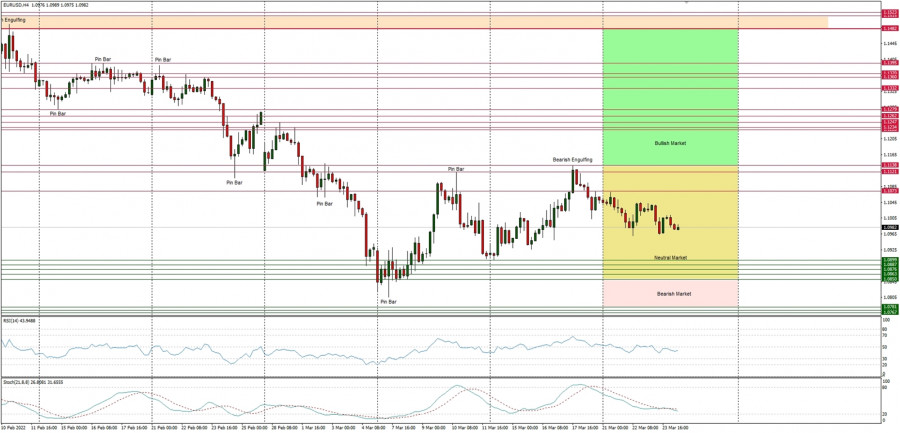
| Technical Analysis of EUR/USD for March 24, 2022 Posted: 24 Mar 2022 12:33 AM PDT Technical Market Outlook The EUR/USD pair has broken above the short-term trend line resistance, but after a local high was made at the level of 1.1045 the bounce was capped and the price moved lower again. The outlook remains bullish, however, the market is getting closer to this week lows located at the level of 1.0959. The market conditions are still neutral, however any violation of the level of 1.0899 will indicate a bearish market, so please keep an eye on this level and on the whole demand zone located between the levels of 1.0899 - 1.0850. The nearest technical resistance is seen at the level of 1.1013 and 1.1047. Weekly Pivot Points: WR3 - 1.1463 WR2 - 1.1271 WR1 - 1.1169 Weekly Pivot - 1.1030 WS1 - 1.0932 WS2 - 1.0797 WS3 - 1.0418 Trading Outlook: The market is still in control by bears that pushed the price way below the level of 1.1245, so a breakout above this level is a must for bulls for a trend reversal. The next long-term technical support is located at 1.0639. The up trend can be continued towards the next long-term target located at the level of 1.1494 (high from 06.02.2022) only if bullish cycle scenario is confirmed by breakout above the level of 1.1186 and 1.1245, otherwise the bears will push the price lower towards the next long-term target at the level of 1.0639 or below.
|
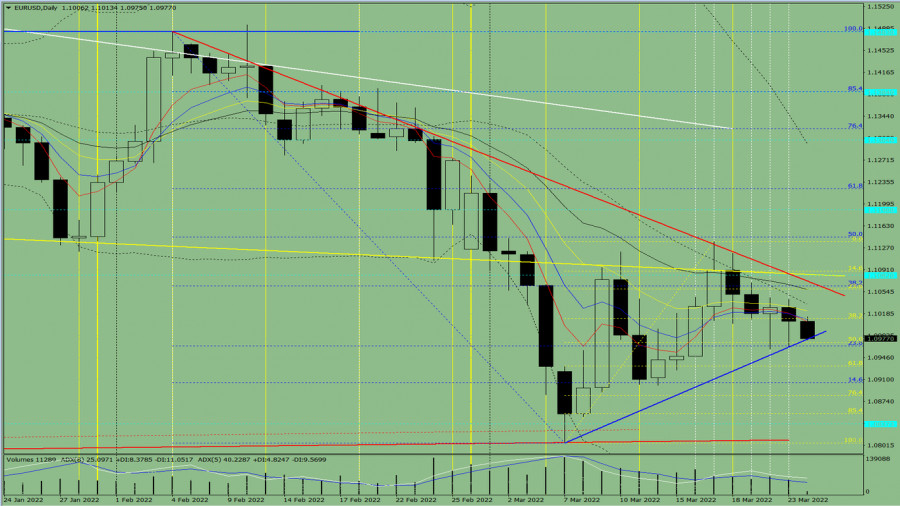
| Indicator analysis of EUR/USD for March 24, 2022 Posted: 24 Mar 2022 12:30 AM PDT Trend analysis (Fig. 1). The market may move down from the level of 1.1006 (close of yesterday's daily candle) to the target level of 1.0971, the 50.0% retracement level (yellow dotted line). In case of testing this level, the price may move upward to test the resistance level 1.1071 (thick red line). From here, the price may roll back down to the target level of 1.1010, the 38.2% retracement level (yellow dotted line).
Fig. 1 (daily chart). Comprehensive analysis:
General conclusion: The market may move down from the level of 1.1006 (close of yesterday's daily candle) to the target level of 1.0971, the 50.0% retracement level (yellow dotted line). In case of testing this level, the price may move upward to test the resistance level 1.1071 (thick red line). From here, the price may roll back down to the target level of 1.1010, the 38.2% retracement level (yellow dotted line). Alternative scenario: from the level of 1.1006 (close of yesterday's daily candle), the price may move downward to the target level of 1.0971, the 50.0% retracement level (yellow dotted line). In case of testing this level, the price may move upward to test the resistance level 1.1071 (thick red line). From here, the price may continue to move up to the target level of 1.1145, the 50.0% retracement level (blue dotted line). The material has been provided by InstaForex Company - www.instaforex.com |
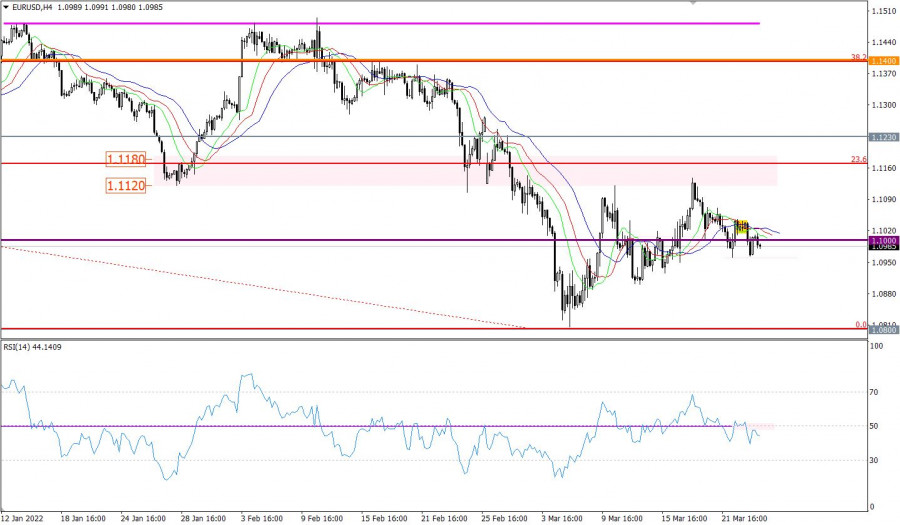
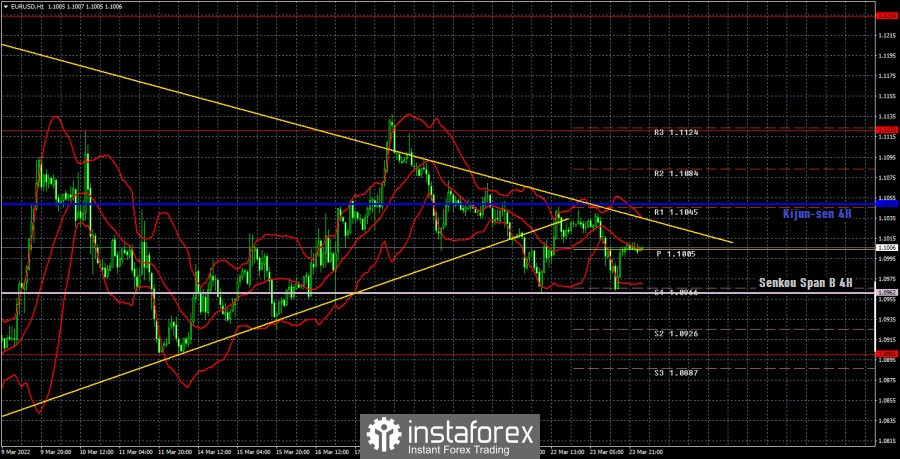
| Hot forecast for EUR/USD on 24/03/2022 Posted: 24 Mar 2022 12:00 AM PDT The single European currency is losing its position again. Although the scale of yesterday's decline turned out to be quite modest. But today this process has continued. And it is sustainable. The reason lies solely in the plane of energy carriers. First, US President Joe Biden once again stated that during his visit to Europe he would seek from the EU the imposition of an embargo on oil and gas supplies from Russia. But Europe is extremely dependent on Russian energy supplies, and it is not at all clear what to replace them with. The United States itself can export only insignificant volumes, which will not be enough to replace Russian supplies. And this is not counting the fact that fuel prices in the United States, if lower than in Europe, then quite a bit. Whereas in Russia they are five or even six times lower. So if the United States manages to bend Europe, it will inevitably face both a real shortage of energy resources and an even greater increase in fuel prices. This is akin to the destruction of the European economy as such. Secondly, Russia decided yesterday to sell gas for rubles. The truth is only for unfriendly countries, to which the whole of Western Europe belongs. Of course, this caused a shock, since for the entire post-war history, the prices of raw materials in the world were denominated exclusively in dollars. Roughly speaking, there was a unified pricing and settlement system. This is extremely convenient, and allows you to bring prices to a certain uniform standard, which reduces the cost. If prices are formed in different currencies, it will lead to chaos. The world is used to a single pricing system. And inevitably, this will lead to an increase in raw material prices. However, there is really no talk of any paradigm shift. It's all about the reservation regarding unfriendly countries. It contains an opportunity to bypass this solution. It's just that the buyers will not be the countries of the European Union, but some others. For example, from North Africa or the Middle East. But the gas itself will still be supplied to Europe. Only at slightly higher prices. So as a result, the cost of energy carriers for Europe will still grow, which will have an extremely negative impact on the European economy. So it is not surprising that the European currencies are losing ground. And oddly enough, Russia's decision allows the European Union to even go for an embargo, since it will still buy gas through intermediaries, and not directly. But Europe will still have to pay dearly. That is the main factor in the weakening of the single European currency. The EURUSD currency pair completed the consolidation move in the range of 1.1010/1.1045 by breaking the lower border. This move led to speculative activity, which enabled traders to stay below the psychological 1.1000 level. The RSI technical instrument in the four-hour period confirmed the completion of the consolidation by the rebound of the indicator from the 50 line. The Alligator H4 indicator has left the phase of intertwining MA moving lines, indicating a downward trend. Alligator D1 still indicates a downward trend in the medium term. There are no intersections between the moving MA lines. Expectations and prospects: In this situation, the primary signal to sell the euro was received in the course of holding the price below the level of 1.1000. Strengthening of the existing signal will occur when the price stays below 1.0960 in a four-hour period. This move may well restart dollar positions in the direction of 1.0900-1.0800. Otherwise, we are in for a turbulence within the boundaries of 1.0960/1.1150. A complex indicator analysis gives a sell signal in the short-term and intraday periods due to the price rebound from the resistance level. Indicators in the medium term give a sell signal due to a downward trend.
|
| GBPNZD Potential For Bearish Reversal | 24th March Posted: 23 Mar 2022 11:35 PM PDT
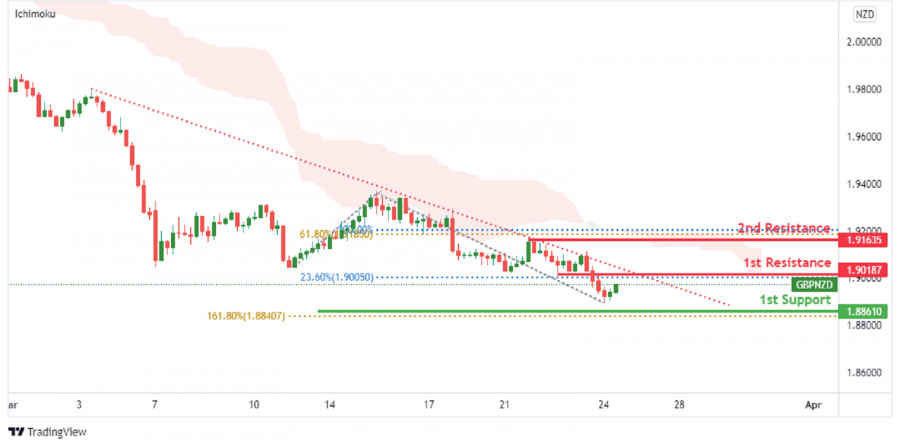
On the H4, price is abiding by the descending trendline. Price is near 1st resistance level of 1.90187 in line with 23.6% Fibonacci retracement. Price can reversal towards the 1st support level of 1.88610 which is in line with 161.8% Fibonacci extension. Our bearish bias is supported by price trading below the Ichimoku cloud indicator. Alternatively, price might move towards the 2nd resistance level at 1.91635 which is in line with 100% Fibonacci projection and 61.8% Fibonacci retracement. Trading Recommendation Entry: 1.90187 Reason for Entry: 23.6% Fibonacci retracement. Take Profit: : 1.88610 Reason for Take Profit: 161.8% Fibonacci extension. Stop Loss: 1.91635 Reason for Stop Loss: 100% Fibonacci projection and 61.8% Fibonacci retracement. The material has been provided by InstaForex Company - www.instaforex.com |
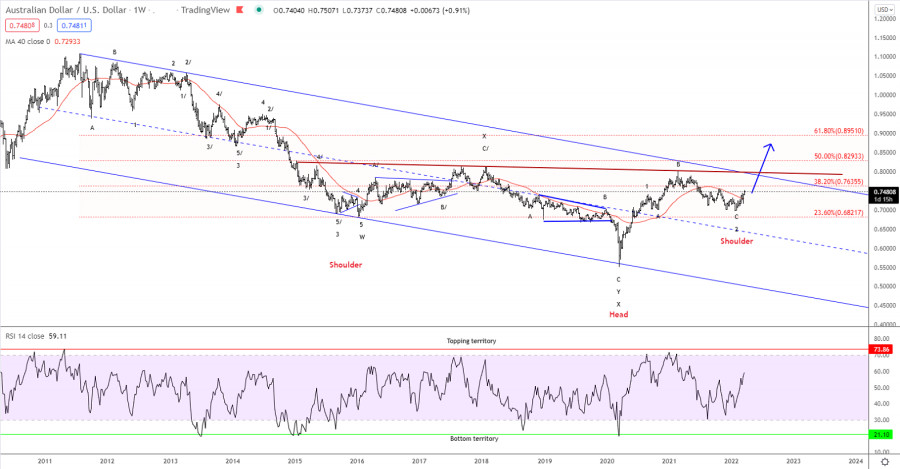
| Elliott wave analysis of AUD/USD for March 24, 2022 Posted: 23 Mar 2022 11:34 PM PDT
The Aussie dollar is forming a large Shoulder/Head/Shoulder bottom and is currently headed towards the neckline resistance near 0.7970 and a break above here will call for a continuation higher towards the S/H/S target at 1.0255 with strong resistance at 0.9400 underway higher, but first we need to see how the Aussie dollar handles itself near the neck-line resistance at 0.7970 that is going to be tested soon. Support is now seen at 0.7321. The material has been provided by InstaForex Company - www.instaforex.com |
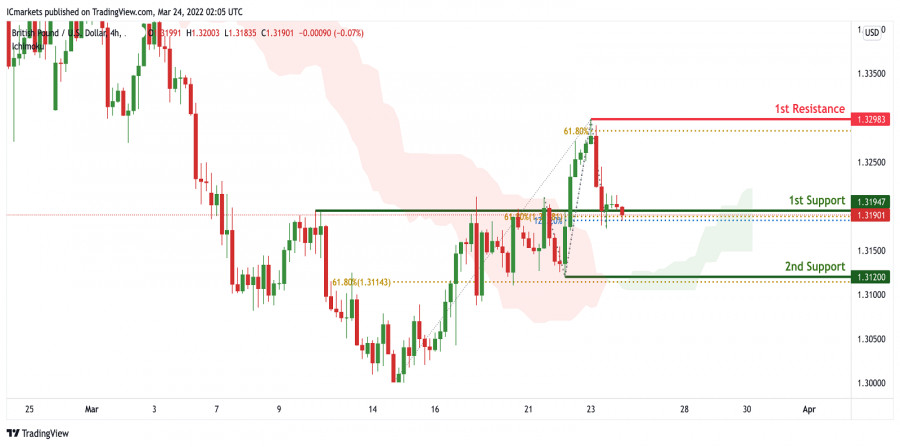
| GBPUSD Bullish Continuation | 24th Mar 2022 Posted: 23 Mar 2022 11:30 PM PDT
On the H4, prices are at a key pivot level. We see the potential for a bounce from our 1st support at 1.31947 which is a graphical overlap and an area of Fibonacci confluence towards our 1st support at 1.31947 towards our 1st resistance at 1.32983 in line with 61.8% Fibonacci projection. Prices are trading above our ichimoku clouds, further supporting our bullish bias. Alternatively, breaking the key graphical overlap will call for a bearish dip towards our 2nd support at 1.312 which was a graphical swing low and in line with 61.8% Fibonacci Retracement. Trading Recommendation Entry: 1.31947 Reason for Entry: Graphical overlap and an area of Fibonacci confluenceTake Profit: 1.32983 Reason for Take Profit: 61.8% Fibonacci projectionStop Loss: 1.312 Reason for Stop Loss: Graphical swing low and in line with 61.8% Fibonacci Retracement The material has been provided by InstaForex Company - www.instaforex.com |
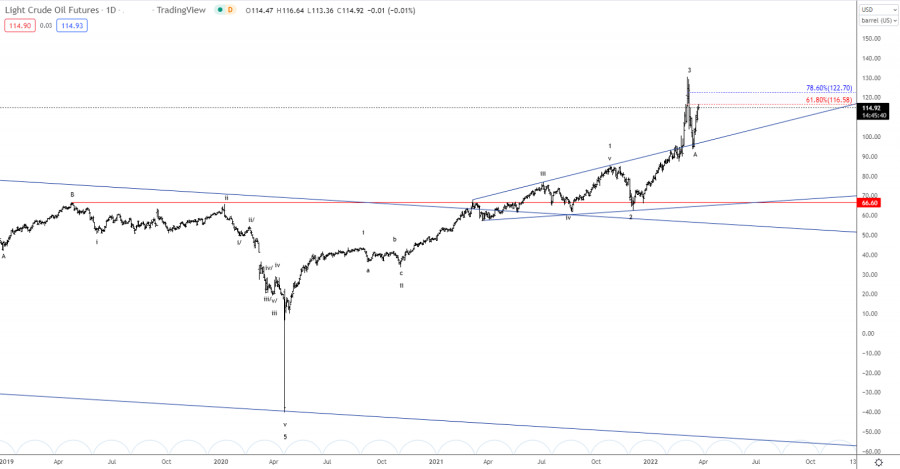
| Elliott wave analysis of Crude Oil for Match 24, 2022 Posted: 23 Mar 2022 11:30 PM PDT
Crude oil has rallied nicely since the 93.53 low and has now entered the resistance-band between 116.58 - 122.70, which we expect will turn oil lower again towards support in the 99.80 - 106.50 area. It's still to early to tell whether a triangle is building or something more complex, but we are looking for clues and our first assumption is that a triangle could be building, then let's see what's going on as time goes. But for now look for a possible top near 122.70 for a decline towards support near 99.80. The material has been provided by InstaForex Company - www.instaforex.com |
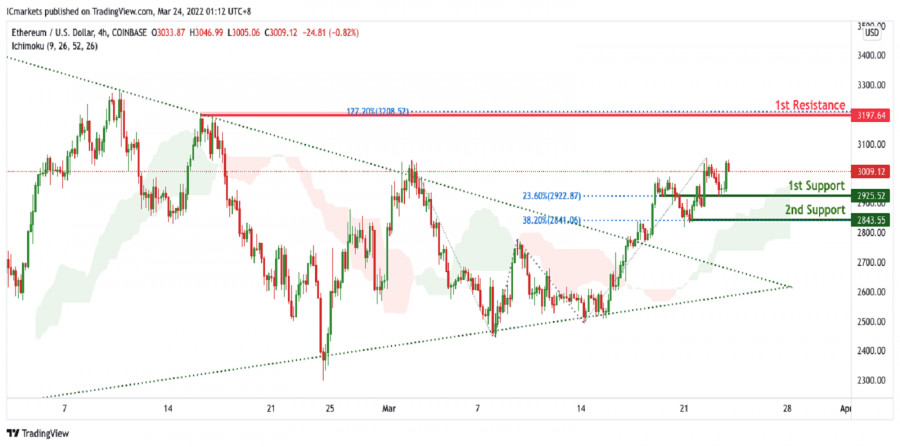
| ETHUSD, Bullish Pressure | 24th March 2022 Posted: 23 Mar 2022 11:26 PM PDT
On the H4, with price moving above the Ichimoku cloud, we have a bullish bias that price will rise to our 1st resistance at 3197 in line with the horizontal swing high resistance and 127.2% Fibonacci extension level from our 1st support of 2925 in line with the horizontal pullback support and 23.6% Fibonacci retracement. Alternatively, price may break 1st support structure and head for 2nd support at 2843 in line with the horizontal pullback support and 38.2% Fibonacci retracement Trading Recommendation Entry: 2925 Reason for Entry: Horizontal pullback support and 23.6% Fibonacci retracement Take Profit: 3197 Reason for Take Profit:Horizontal swing high resistance and 127.2% Fibonacci extension Stop Loss: 2843 Reason for Stop Loss:Horizontal pullback support and 38.2% Fibonacci retracement The material has been provided by InstaForex Company - www.instaforex.com |
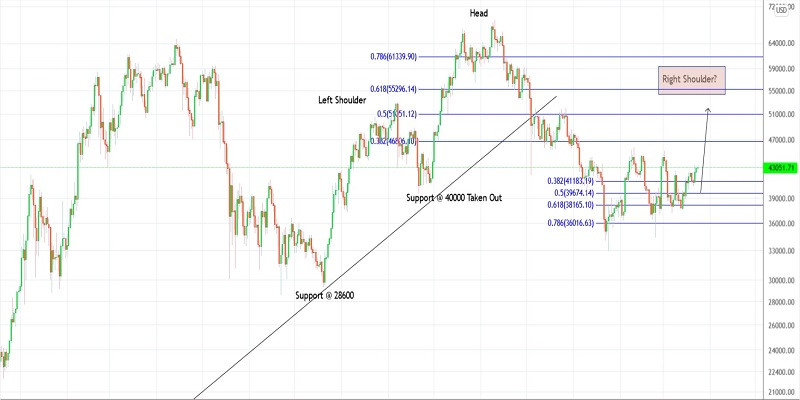
| Trading plan for Bitcoin for March 24, 2022 Posted: 23 Mar 2022 11:22 PM PDT
Technical outlook:Bitcoin has push above $43000 mark but is expected to face mild short term resistance here. The crypto could drop through $40000 mark for intraday support before turning higher again. The range still continues to be between $45000 and $37000 respectively and pricesneed to break out either way to decide its further direction. Bitcoin has been in a triangle consolidation range since $46000 highs in February. The consolidation might be complete at $37000 mark and if correct, we could see prices braking above $46000 and push through $50000 going forward. On the flip side, prices may drop through $40000 first and turn bullish thereafter. Bitcoin might drag lower towards $27700 mark if prices break below the $34000 level. In that case, the entire bearish boundary is still not complete and needs to print one more low before producing a meaningful retracement. Either from here, or after breaking below $27700, bulls will remain inclined to produce a counter trend rally. Trading plan:Potential rally through $50000 mark against $33000 Good luck! The material has been provided by InstaForex Company - www.instaforex.com |
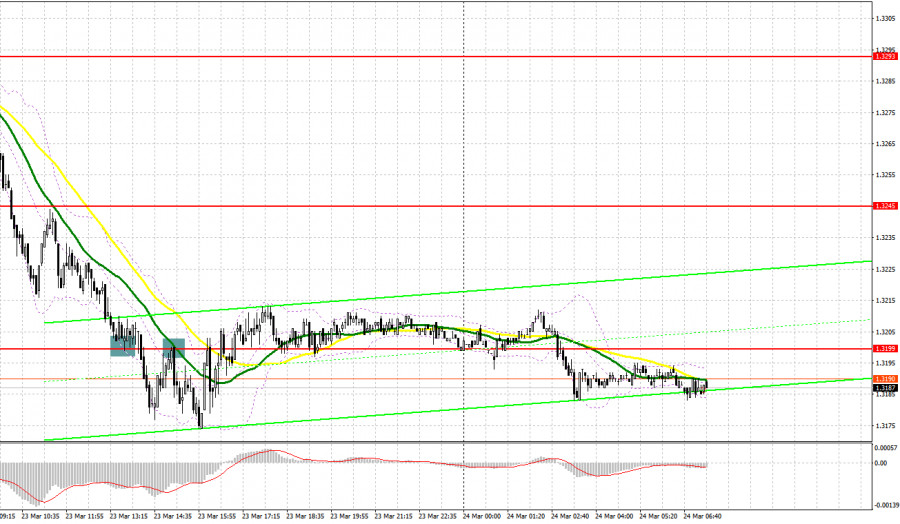
| Posted: 23 Mar 2022 11:09 PM PDT What is needed to open long positions on GBP/USD: Yesterday, it was quite difficult to trade the pound sterling ahead of the US inflation and annual budget reports. Now, let's look at the 5-minute chart and try to figure out what actually happened. In the morning article, I highlighted the level of 1.3249 and recommended taking decisions with this level in focus. The breakout of 1.3249 occurred quite quickly. The British currency slid down due to discoursing inflation data. The figure exceeded economists' forecasts. Although there was a breakout of this level, it lacked only several pips for an upward test. For this reason, there was no good entry point into short positions. In the afternoon, the pound sterling dropped to the level of 1.3199, making a false breakout. As a result, a buy signal was formed. Traders had to close short positions as an upward reversal did not take place. A breakout of 1.3199 and a reverse test from the bottom up gave a sell signal, intensifying the downtrend. After that, the pair fell by 25 pips. This was yesterday's gains.
Surging inflation is now weighing on not only the government but also on household incomes. The standard of living is rapidly falling, which has a negative impact on the foreign exchange market. Chancellor Rishi Sunak said he would consider raising benefits and pensions to keep pace with inflation and help lower earners. Notably, the pound sterling still maintains a bullish trend stat has originated on March 14. Nevertheless, traders should act carefully. To cement the upward movement, the bulls need to defend the support level of 1.3160 during the European session today will be to protect the support of 1.3160. The pound sterling is also likely to break through this level in the near future. After that, it will become clear whether traders remained in the market after Tuesday's growth. If not, the British currency could decline even lower. Only after the formation of a false breakout at 1.3160, the pound/dollar pair may recover. If this scenario comes true, the bulls will quickly push GBP/USD to the resistance level of 1.3210. Slightly above this level, one can see the moving averages that are passing in the negative zone. Given that the economic calendar is empty today, there could be a large upward correction. A breakout and a test of this level from top to bottom will lead to a decrease in the volume of sellers' stop orders. As a result, the price is likely to rise to the highs of1.3242 and 1.3286. The 1.3340 level will be a more distant target. The pair may approach it provided that there will be positive news on the talks between Russia and Ukraine. I recommend profit-taking at this level. If the GBP/USD pair tumbles during the European session and bulls show no activity at 1.3160, it is best to postpone long positions until the next support level of 1.3121. This is a more reliable level, acting as the lower limit of the new upward channel. I would also advise you to open long positions there only when a false breakout occurs. You can buy GBP/USD immediately on a rebound from 1.3089 or even a lower low of 1.3046, keeping in mind an intraday correction of 30-35 pips. What is needed to open short positions on GBP/USD: The bears pushed the pound sterling to the level of 1.3210, which limited the upward potential. It may also undermine the bull market that began on March 14. Given that there are no fundamental statistics today, the bulls will try to regain ground in the morning. For this reason, the primary task of the bears is to protect the resistance level of 1.3210, where the moving averages are passing in the negative zone. The formation of a false breakout there will push the pair to the nearest support level of 1.3160. A breakout and an upward test of this level will give an additional sell signal. As a result, the pair may drop to the lows of 1.3121 and 1.3089 where I recommend profit-taking. A more distant target will be 1.3046. If GBP/USD rises in the first half of the day and bears show no activity at 1.3210, it is best to postpone short positions until the next major resistance level at 1.3242. I would also advise you to open short positions there in case of a false breakout. It is possible to sell GBP/USD immediately for a rebound from 1.3286 or even a higher high of 1.3340, keeping in mind an intraday downward correction of 20-25 pips.
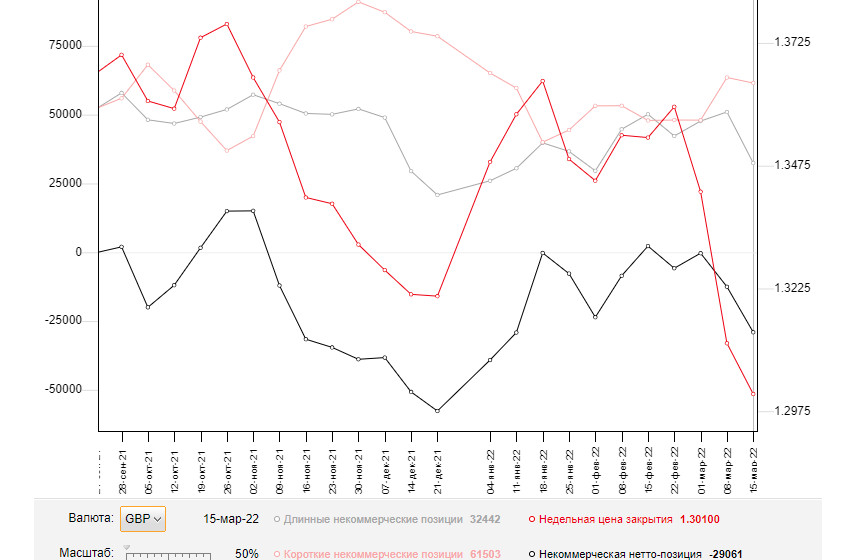
COT report The COT report (Commitment of Traders) for March 15 logged a sharp drop in long positions and only small changes in short ones. The results of the BoE meeting avidly affected the British currency. Despite an expected increase in the interest rate, the regulator did not hint at a further tightening of monetary policy. It decided to stick to more dovish rhetoric despite soaring inflation. It had already reached all-time highs. Falling household income and the worsening standard of living are weighing on the regulator. The regulator is hesitant to take more aggressive measures because of the current geopolitical situation. A more aggressive tightening may harm the economy rather than help it. The regulator needs to find measures to cap rising inflation, avoiding potentially dangerous decisions. Many analysts believe that inflation may climb higher in spring. Therefore, traders are in no hurry to buy the pound sterling. Besides, it is losing momentum against the US dollar. The FOMC meeting was in the limelight last week. The watchdog raised the interest rate by 0.25%. This decision did not stir up volatility as many traders had already priced it in. To this end, it is recommended to open long positions on the US dollar as the bearish trend for the GBP/USD pair persists. The only thing that may halt a sell-off of the pound sterling is high inflation. It will eventually force the Bank of England to take a hawkish stance. The COT report for March 15 revealed that the number of long non-profit positions declined to 32,442 from 50,982, while the number of short non-profit positions dropped to 61,503 from 63,508. It increased in the negative delta of the non-commercial net position to -29,061 from -12,526. The weekly closing price dropped to 1.3010 against 1.3113.
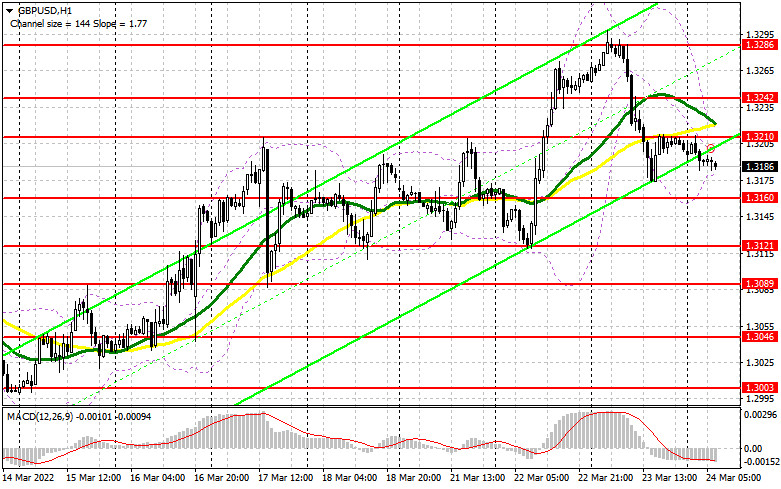
Signals of technical indicators Moving averages GBP/USD is trading below 30- and 50-period moving averages. It means that the bears don't give up attempts to undermine the bullish trend. Remark. The author is analyzing a period and prices of moving averages on the 1-hour chart. So, it differs from the common definition of classic daily moving averages on the daily chart. Bollinger Bands In case of a decline in the pair, 1.3185 will act as support. If the pair grows, 1.3230 will act as resistance. Definitions of technical indicators
|
| Trading plan for EUR/USD for March 24, 2022 Posted: 23 Mar 2022 10:49 PM PDT
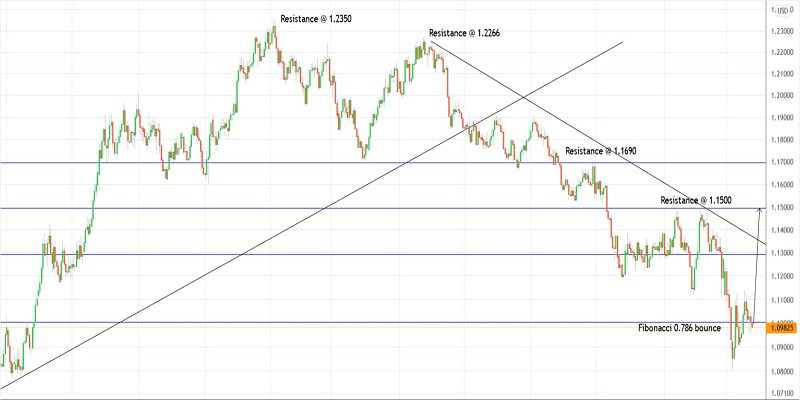
Technical outlook:EUR/USD slipped below the 1.1000 handle. It is likely to test 1.0970. The daily chart has produced a tweezer bottom candlestick pattern indicating a potential bullish reversal. Bulls need to hold prices above 1.0900 and 1.0800. A push above 1.1140 will accelerate the proposed rally. EUR/USD bounced off the Fibonacci 0.618 retracement of its recent upswing between the 1.0900 and 1.1137 levels on Wednesday. Prices are currently testing its support zone and we can expect a bullish bounce soon. The possibility also remains for a test below the 1.0900 mark before the rally could resume. EUR/USD larger degree wave structure also continues to remain bullish as the single currency pair has bounced off the Fibonacci 0.786 retracement of the entire rally between 1.0636 and 1.2350, seen around the 1.0800 mark. Only a consistent break below 1.0800 will undermine bullish bias. Trading plan:Potential rally through 1.1500 against 1.0700 Good luck! The material has been provided by InstaForex Company - www.instaforex.com |
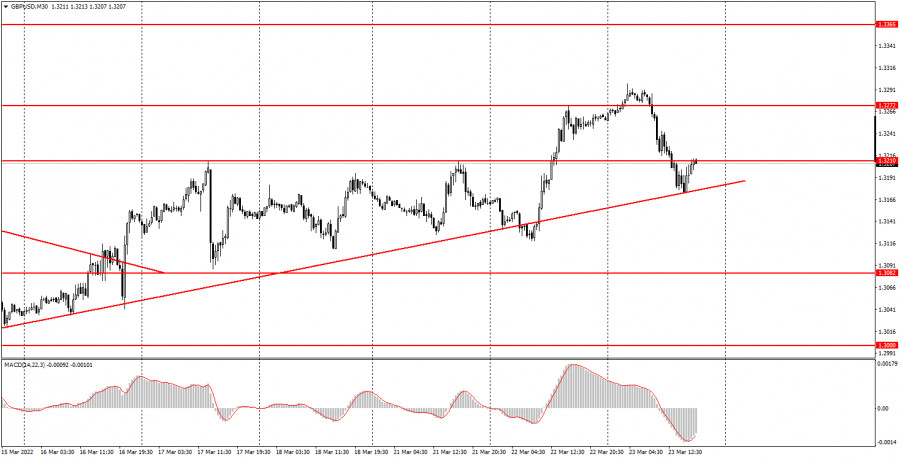
| How to trade GBP/USD on March 24, 2022. Tips and trades analysis for beginners Posted: 23 Mar 2022 10:11 PM PDT Analysis of Wednesday's trades:30M chart of GBP/USD
On Wednesday, GBP/USD retraced up to the ascending trend line, tested it, and rebounded from it. The price broke through the trend line a day earlier. However, it became clear in a couple of hours that it had been a false breakout. Therefore, it should have been ignored. As it turned out, it was the right approach because the trend line was able to withstand pressure on Wednesday, thus maintaining bullish bias. Overall, the pound fell by 120 pips. As a reminder, the sterling showed unexpected growth by 160 pips a day earlier, surprising market participants. On Wednesday, when the United Kingdom presented a fresh inflation report, the pair plunged. Moreover, the fall came exactly at the time when the report was published, meaning it was a clear reaction. Although inflation rose to 6.2% in February, it was more of a positive factor for the British economy than a negative one because the higher the inflation, the greater is the chance of monetary policy tightening. Anyway, either the market had decided otherwise or a rise in inflation had already been priced in, but the pound tumbled on Wednesday. M5 chart of GBP/USD
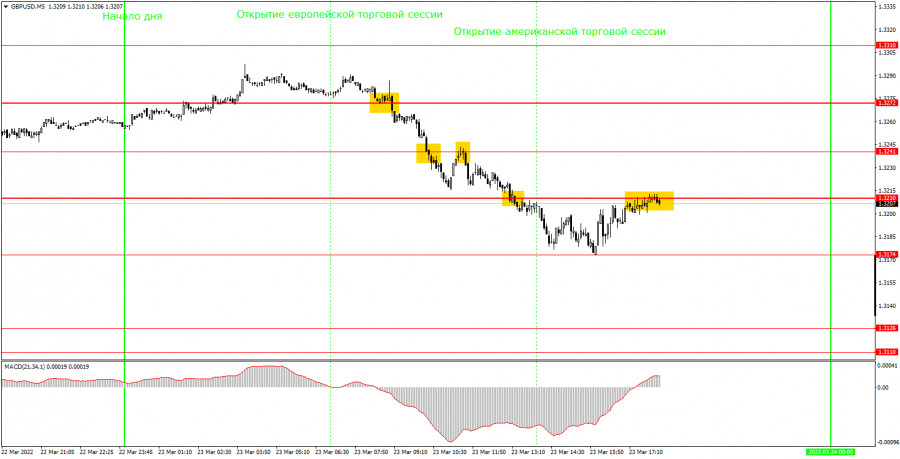
In the M5 time frame, the technical picture looked very nice on Wednesday. The price successfully tested all the key levels on its way, and strong trading signals were produced near them. So, the new key level formed at 1.3174. The first sell signal was made when the price broke through 1.3272. The quote then broke through 1.3241 and rebounded from it. Later, it also broke through 1.3210 and rebounded from it. All that time, a single sell trade should have been opened at around 1.3272. That trade could have been closed just manually because not a single buy signal was made during the day. It could have been done by the close of the trading day. In such a case, the sell trade would have brought traders some 60 pips of profit. Volatility on Wednesday totaled 124 pips. As you can see, high volatility + trend movement = profit. Trading plan for Thursday:In the 30M time frame, the pair continues its bull run. It tried to break through the trend line one more time but failed. Consolidation of the price below the trend line may trigger a fall of the pound. In spite of being bullish recently, the quote is still struggling to show steady and strong growth. The US dollar now has more reasons for being bullish. On Thursday, the target levels in the 5M time frame are seen at 1.3082, 1.3110-1.3126, 1.3174, 1.3210, 1.3241, 1.3272, and 1.3310. A stop-loss order should be set at the breakeven point as soon as the price passes 20 pips in the right direction after a trade has been opened. No important macro events are to unfold in the US and the UK on Thursday. So, beginner traders will have nothing to focus on during the day. However, volatility is likely to remain high, some 80-100 pips. All in all, a flat market is the last thing traders want to see on Thursday. Basic principles of the trading system:1) The strength of the signal depends on the time period during which the signal was formed (a rebound or a break). The shorter this period, the stronger the signal. 2) If two or more trades were opened at some level following false signals, i.e. those signals that did not lead the price to Take Profit level or the nearest target levels, then any consequent signals near this level should be ignored. 3) During the flat trend, any currency pair may form a lot of false signals or do not produce any signals at all. In any case, the flat trend is not the best condition for trading. 4) Trades are opened in the time period between the beginning of the European session and until the middle of the American one when all deals should be closed manually. 5) We can pay attention to the MACD signals in the 30M time frame only if there is good volatility and a definite trend confirmed by a trend line or a trend channel. 6) If two key levels are too close to each other (about 5-15 pips), then this is a support or resistance area. How to interpret charts:Support and resistance levels can serve as targets when buying or selling. You can place Take Profit near them. Red lines are channels or trend lines that display the current trend and show which direction is better to trade. MACD indicator (14,22,3) is a histogram and a signal line showing when it is better to enter the market when they cross. This indicator is better to be used in combination with trend channels or trend lines. Important speeches and reports that are always reflected in the economic calendars can greatly influence the movement of a currency pair. Therefore, during such events, it is recommended to trade as carefully as possible or exit the market in order to avoid a sharp price reversal against the previous movement. Beginner traders should remember that every trade cannot be profitable. The development of a reliable strategy and money management is the key to success in long-term trading. The material has been provided by InstaForex Company - www.instaforex.com |
| Trading signal for EUR/JPY for March 24 - 25, 2022: sell below 132.53 (5/8 Murray - 21 SMA) Posted: 23 Mar 2022 09:30 PM PDT
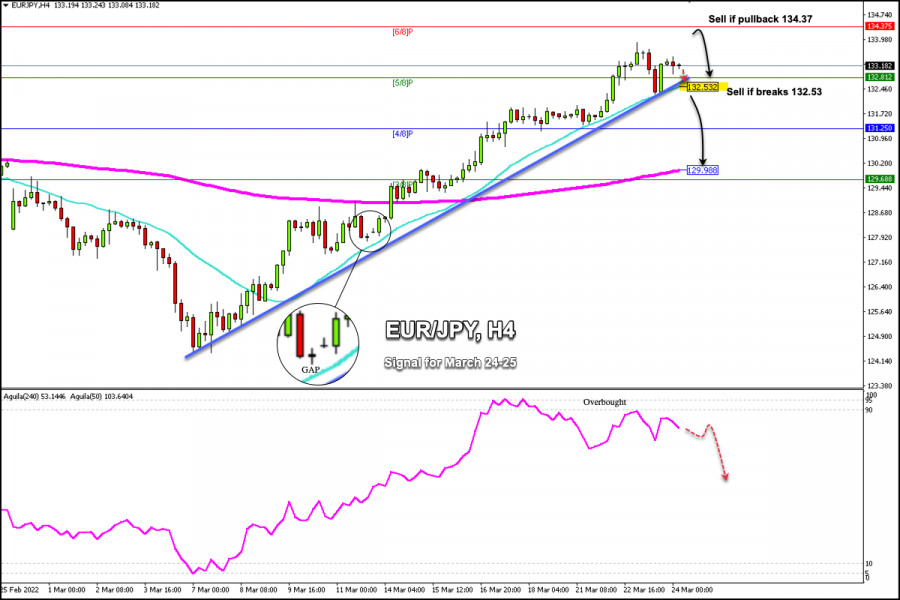
On March 23, EUR/JPY reached a high of 133.88, the level last seen on June 03, 2021. The latest candles formed on the 4-hour chart below 133.88 confirm that the market could enter a correction phase. However, the cross should sharply break the uptrend channel and consolidate below the 21 SMA located at 132.53. The area 134.00 has become a barrier for EURJPY causing a corrective drop below this level. If this level of 134.00 is broken, the next potential target would be 134.37 (6/8 Murray). This level is strong resistance, hence a failure to consolidate above will give us an opportunity to sell. Conversely, with a bearish reversal below the 21 SMA at 132.53 we could see a decline towards support of 3/8 Murray and the 200 EMA at 129.98 and 129.68. A daily close below 129.50 could accelerate the decline to cover the GAP at 125.98. According to the 4-hour chart, we can see that since the beginning of March EUR/JPY started a rally. We can see that the price has been moving above the uptrend channel which indicates that the bias is still bullish and the pair could reach the resistance area of 134.37. The dovish policy of the Bank of Japan has helped EUR/JPY to gain most of the ground lost in February. The Bank of Japan confirmed its ultra-expansive monetary policy at its last meeting in March. The bank pledged to maintain its massive stimulus program despite rising inflation trends. As long as the currency pair remains above the 200 EMA, today at 129.98, the outlook for EUR/JPY is expected to remain bullis, but it should first make a correction towards the psychological level of 130.00. The material has been provided by InstaForex Company - www.instaforex.com |
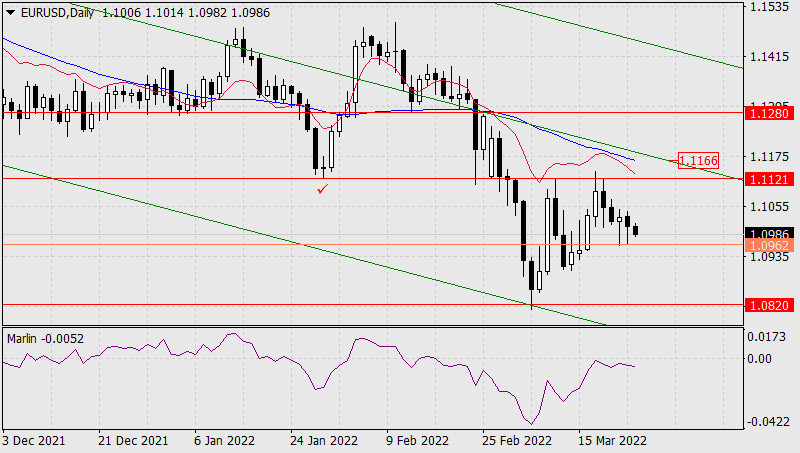
| Forecast for EUR/USD on March 24, 2022 Posted: 23 Mar 2022 09:05 PM PDT Over the past two days, that is, for Wednesday and Tuesday, the euro has formed the support of 1.0962 with the lower pronounced shadows of daily candles. And since the daily trend remained downward, the signal line of the Marlin Oscillator did not dare to go into the positive area. Overcoming the freshly baked support will be a fresh impetus to continue the decline, towards the target of 1.0820.
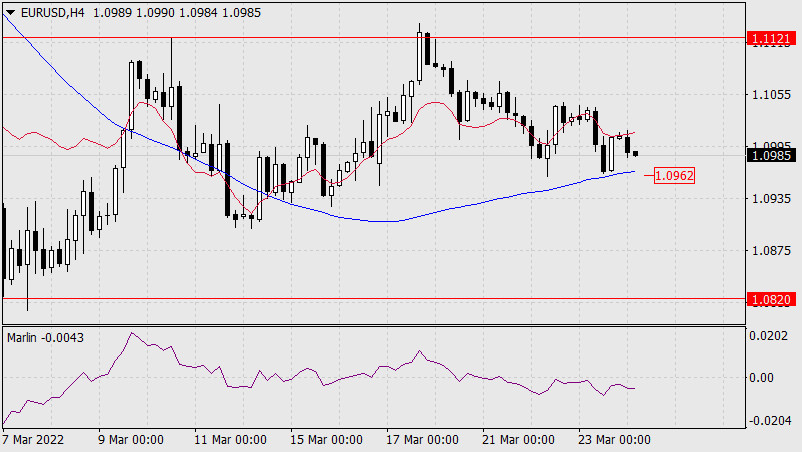
The 1.0962 level coincides with the support of the MACD line on the four-hour chart. This circumstance further increases the value of this level, so we are now waiting for a confident price movement with overcoming this line.
|
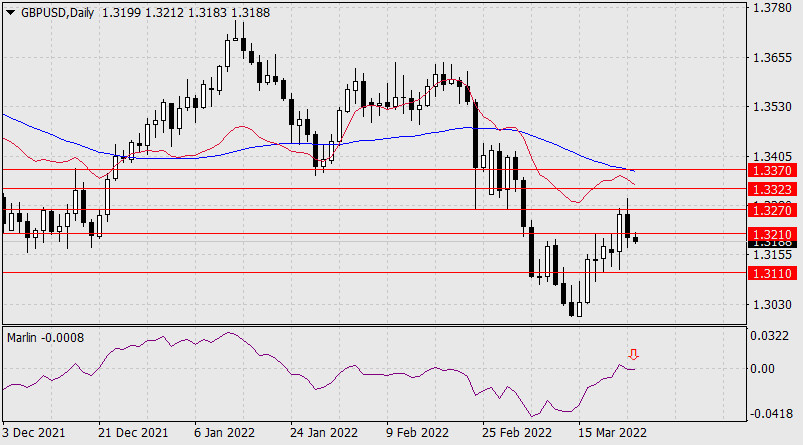
| Forecast for GBP/USD on March 24, 2022 Posted: 23 Mar 2022 09:02 PM PDT Yesterday, the pound showed a double sign of a downward trend reversal (that is, the completion of an upward correction from the 15th): a false exit above the level of 1.3270 (the level was pierced by the upper shadow of the daily candle), a decline under the target level of 1.3210, opening a new target level of 1.3110 . The false exit of the signal line of the Marlin Oscillator into the growth zone (marked with an arrow) formed an independent signal of a downward trend shift. Now Marlin is in the negative area - this is a promising (leading) condition for a price decrease.
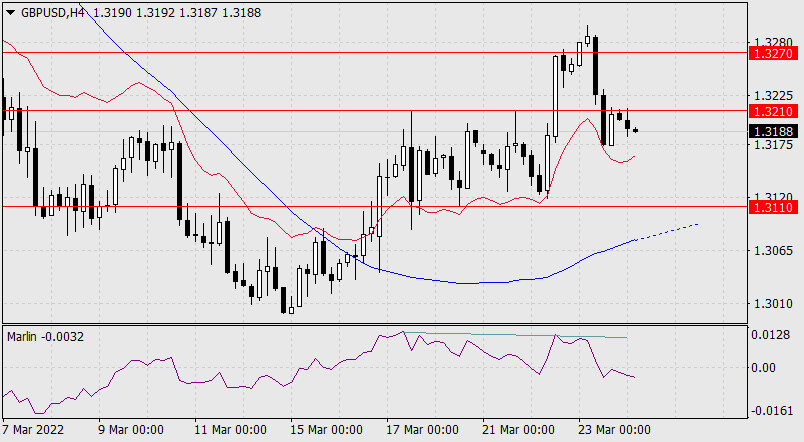
On the working chart of H4, the divergence that was planned yesterday worked out in full force - the price showed a pronounced fall, the Marlin Oscillator settled in the bears' territory. We are waiting for the price at the target level of 1.3110. Since the MACD line is approaching this level, there is likely to be a strong struggle to establish a medium-term trend.
|
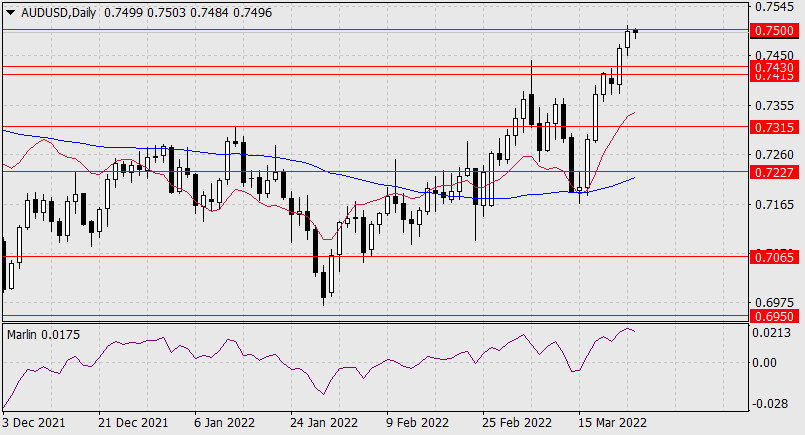
| Forecast for AUD/USD on March 24, 2022 Posted: 23 Mar 2022 08:59 PM PDT Yesterday, the Australian dollar gained another 32 points and reached the target level of 0.7500. This is not only a round number, but also the December 2017 low. The daily Marlin Oscillator is turning down, now we are waiting for the price to return to the 0.7415/30 range. The price's departure below the range opens the way for further decline to the target level of 0.7315 – this is the high of January 2022, the high of September 24, 2021 and the line of other historical extremes.
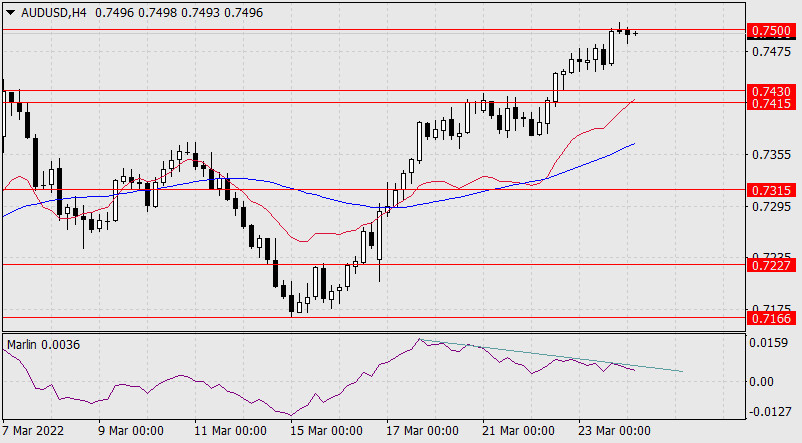
On a four-hour scale, as we expected in yesterday's review, the price with the Marlin Oscillator completed a double divergence. This increases the probability of the aussie working out the target range of 0.7415/30.
|
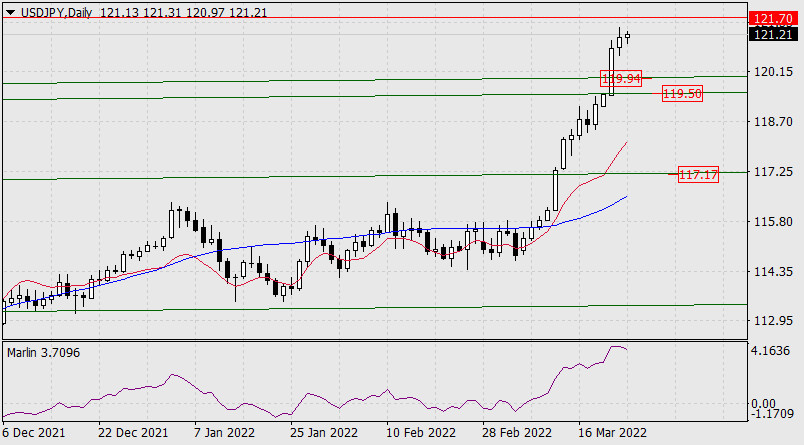
| Forecast for USD/JPY on March 24, 2022 Posted: 23 Mar 2022 08:54 PM PDT Yesterday's doubts about the dollar's weakness in reaching the target level of 121.70 were confirmed. Under the pressure of external forces (the US stock index S&P 500 fell by 1.23%), the USD/JPY fell short of the designated target by about 30 points. Will the dollar be strong enough to reach the target today? It is possible, but the Marlin Oscillator turning down from the overbought zone suggests that this will be the last price jerk before it returns to the range of trend lines of the price channel at 119.50/94.
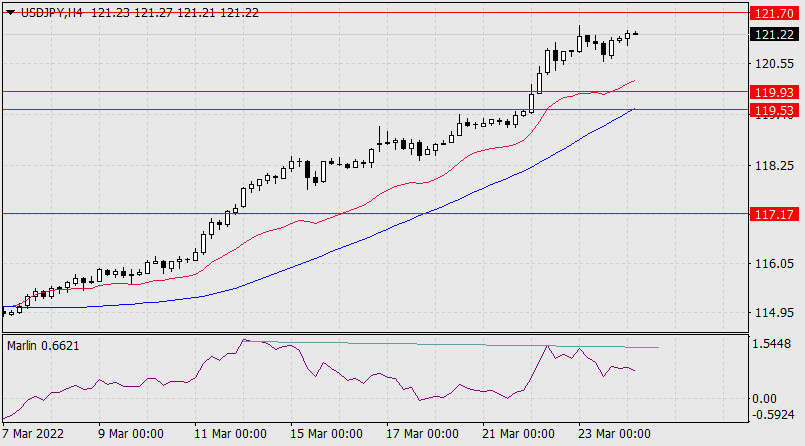
On the four-hour chart, a price divergence with an oscillator has formed. The price may already turn down from the current levels. But along with the divergence, a nuance appeared - even a successful attempt by the price to reach the target level of 121.70 will not break the formed divergence, it will only intensify with a double formation. It is also seen on H4 that the MACD indicator line enters the target area. The range increases its value in the current situation - overcoming it opens the way to a confident advance to the next price channel line (on the daily) in the area of 117.17. And the daytime MACD line is already approaching this area.
|
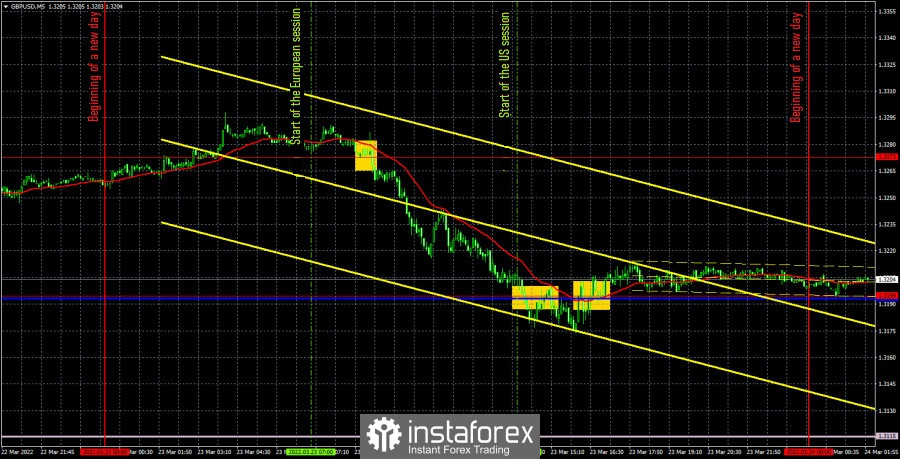
| Posted: 23 Mar 2022 07:50 PM PDT GBP/USD 5M
The GBP/USD currency pair on Wednesday also showed a movement close to ideal. Two important performances took place during the day, Bank of England Governor Andrew Bailey and Federal Reserve Chairman Jerome Powell, but they had virtually no impact on the pair. But the inflation report had an impact. However, not what most traders could count on. The inflation rate in the UK rose to 6.2%, which exceeded the already not very optimistic forecasts. However, instead of growth, the British currency showed a fall, which was not logical. However, we recall that a day earlier, the pound also showed an absolutely illogical growth. Therefore, we can assume that the debt has been repaid. Despite the fact that the pound/dollar pair has been growing in recent weeks, we still believe that a new fall is more likely. As for trading signals, they were very good. The first sell signal, which was formed at the beginning of the European session, when the price broke the level of 1.3273, turned out to be the strongest and most profitable. The price went down about 85 points after its formation and initially overcame the critical line. However, a little later, it still settled above the Kijun-sen, so the sell signal was canceled and short positions should be closed. As a result, it was possible to earn about 50-60 points and it was necessary to open long positions. However, the longs no longer brought traders any profit, as the pair was no longer able to show another strong movement. This transaction was closed manually at zero. COT report:
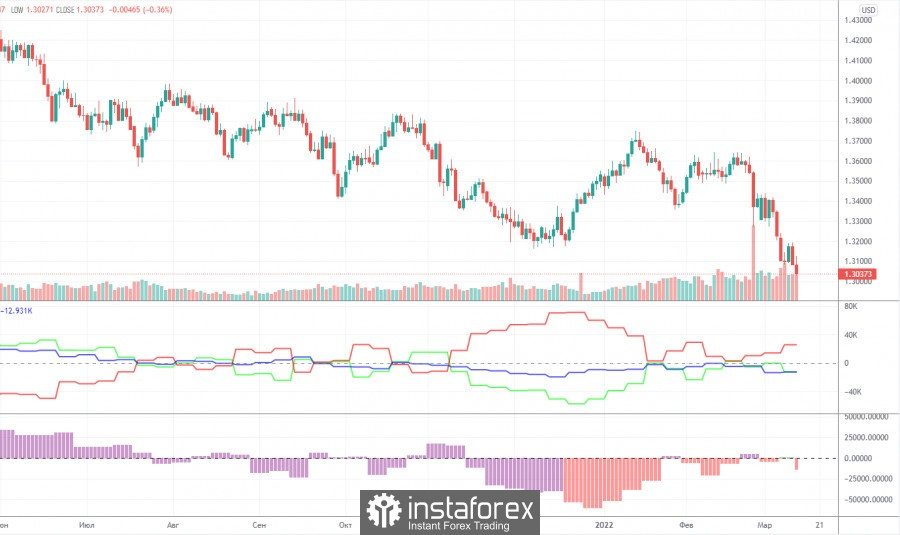
The latest Commitment of Traders (COT) report showed an increase in the bearish mood among commercial traders. However, in general, the mood of the major players has changed too often in recent months, which is clearly seen by the two indicators in the chart above: they are constantly changing the direction of their movement. At the moment, the number of open long positions is less than the number of short positions by almost 30,000. Although two weeks ago their number was almost the same. Earlier, we concluded that major players could not make a decision regarding the British pound, but we also drew attention to the fact that with the complication of the geopolitical situation, the demand for the US currency grew very much, which could "cross out" the data of COT reports. However, now the current picture of what is happening in the foreign exchange market is already beginning to correspond to the COT reports. Thus, the pound may now be at the beginning of a new round of decline. But, since in recent weeks it has only been falling, now another upward correction may follow, and then everything will depend on the geopolitical background. Like the mood of traders, the market situation can change rapidly. A month ago, few people believed that an armed conflict could break out in the center of Europe on a huge territory. Therefore, you need to be prepared for everything, and use COT reports only as an additional factor of assessment and forecasting. We recommend to familiarize yourself with:Overview of the EUR/USD pair. March 24. The European currency still has nothing to cover. Overview of the GBP/USD pair. March 24. Impressive somersaults of the British pound and two traps for traders at once. Forecast and trading signals for EUR/USD on March 24. Detailed analysis of the movement of the pair and trading transactions. GBP/USD 1H
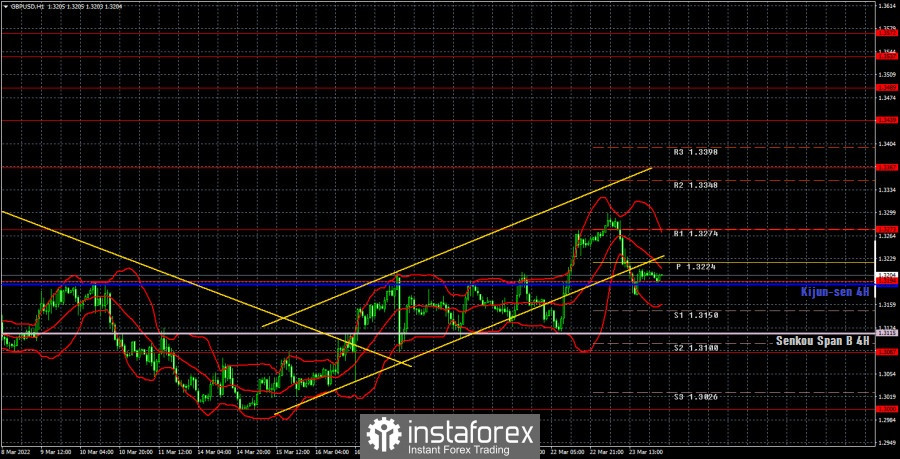
The technical picture looks very strange on the hourly timeframe. The pair has already settled below the ascending channel twice, so it is unlikely that both breakouts can be considered false. Consequently, we can expect a new fall in the British pound, but so far the price has not managed to confidently overcome the critical line, so maybe we will see a new round of growth. The pound is rising quite hard, a lot now depends on the critical line on the 24-hour TF. On March 24, we highlight the following important levels: 1.3087, 1.3194, 1.3273, 1.3367. The Senkou Span B (1.3115) and Kijun-sen (1.3190) lines can also be signal sources. Signals can be "bounces" and "breakthroughs" of these levels and lines. It is recommended to set the Stop Loss level to breakeven when the price passes in the right direction by 20 points. The lines of the Ichimoku indicator can move during the day, which should be taken into account when determining trading signals. There are also support and resistance levels on the chart that can be used to take profits on transactions. No important events are scheduled for Thursday in the UK and the United States, so it will be even more difficult for the pair to decide on the direction of movement. There may be a drop in volatility and not quite clear movements during the day. You need to be ready for this. Explanations for the chart:Support and Resistance Levels are the levels that serve as targets when buying or selling the pair. You can place Take Profit near these levels. Kijun-sen and Senkou Span B lines are lines of the Ichimoku indicator transferred to the hourly timeframe from the 4-hour one. Support and resistance areas are areas from which the price has repeatedly rebounded off. Yellow lines are trend lines, trend channels and any other technical patterns. Indicator 1 on the COT charts is the size of the net position of each category of traders. Indicator 2 on the COT charts is the size of the net position for the non-commercial group. The material has been provided by InstaForex Company - www.instaforex.com |
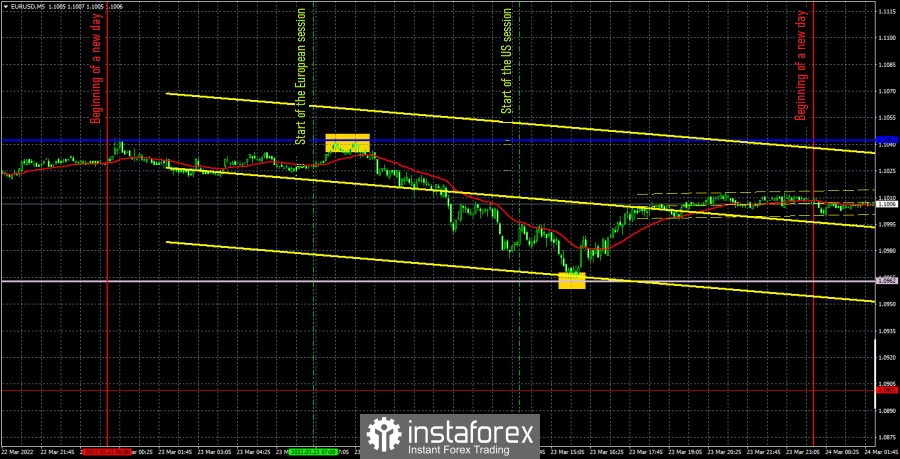
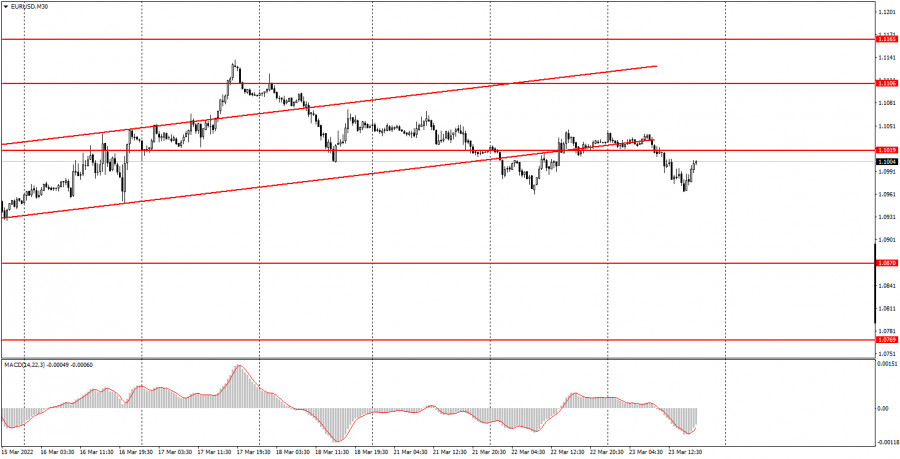
| Posted: 23 Mar 2022 07:50 PM PDT EUR/USD 5M
The EUR/USD pair again showed almost perfect movement on Wednesday. This is exclusively thanks to the Ichimoku indicator and its lines Kijun-sen and Senkou Span B. Yesterday the pair went down about 80 points, while it began its downward movement exactly from Kijun-sen, and finished exactly near Senkou Span B. Despite the fact that these lines may change their location today, let's leave them here for now, because the euro/dollar pair is approaching the flat, and the Ichimoku indicator forms false signals in the flat. Therefore, let these lines play the role of extreme levels for the time being. Among the important events for today, we can single out only Federal Reserve Chairman Jerome Powell's speech, which did not give fundamentally new information. Powell and his colleagues have already answered the question of which way the Fed will look during 2022-2023. They can't provide any more important information at this time. There were only two trading signals during Wednesday. But what! The pair bounced at the very beginning of the European trading session from the critical line (with an error of 1 point), forming a sell signal. This signal was canceled only at the beginning of the US session, when the price bounced off the Senkou Span B line (with an error of 2 points). Thus, a short position could bring a profit of about 60 points. But even at the signal of a rebound from Senkou Span B, it was necessary to open positions, this time a long one. They made it possible to earn about 30 more points, since the deal had to be closed manually near the end of the working day. As a result, 90 points of profit with the total volatility of the pair slightly more than 80. COT report:
In the last two months, Commitment of Traders (COT) reports have signaled such changes in the mood of traders that absolutely did not correspond to what was actually happening in the foreign exchange market. Simply put, the euro continued to fall, while big commercial traders raised long positions. We said that such a divergence could arise due to the fact that the demand for the US currency increased sharply, which was simply higher than for the euro. However, the latest COT report showed that big players are also starting to change their preferences. During the last reporting week, the non-commercial group reduced the number of long positions by 40,000. That's a lot. The general mood of non-commercial traders still remains bullish, as the number of long positions exceeds the number of short positions by 19,000. However, trends are important to us. And now the trend is such that even major players can start selling the euro again. This is on top of the fact that the demand for the US dollar also remains high. Thus, the net position of the non-commercial group decreased significantly last week and now almost all factors speak in favor of a further fall in the euro currency. Therefore, the euro can now show growth from time to time only on the basis of technical necessity to adjust. We recommend to familiarize yourself with:Overview of the EUR/USD pair. March 24. The European currency still has nothing to cover. Overview of the GBP/USD pair. March 24. Impressive somersaults of the British pound and two traps for traders at once. Forecast and trading signals for GBP/USD on March 24. Detailed analysis of the movement of the pair and trading transactions. EUR/USD 1H
The descending trend line remains relevant on the hourly timeframe. At the moment, the price is stuck between the lines of the Ichimoku indicator, which may even mean the beginning of a flat. At least over the past two days, the pair has bounced off these lines four times perfectly in accuracy. Thus, it is necessary to focus now on these lines, which we will not move in the coming day. It should be remembered that the price has already overcome the downward trend line, but for now we consider that overcoming a false breakout. We allocate the following levels for trading on Thursday - 1.0806, 1.0901, 1.1122, 1.1234, as well as the Senkou Span B (1.0962) and Kijun-sen (1.1049) lines. There are also support and resistance levels, but no signals will be formed near them. The lines of the Ichimoku indicator may change their position during the day, which should be taken into account when searching for trading signals. Signals can be "bounces" and "breakthrough" levels - extremes and lines. Do not forget about placing a Stop Loss order at breakeven if the price went in the right direction of 15 points. This will protect you against possible losses if the signal turns out to be false. The calendars of macroeconomic events in the United States and the European Union are completely empty on March 24. Thus, traders will have nothing to react to, and the price may remain between the Kijun-sen and Senkou Span B lines during the day. Explanations for the chart:Support and Resistance Levels are the levels that serve as targets when buying or selling the pair. You can place Take Profit near these levels. Kijun-sen and Senkou Span B lines are lines of the Ichimoku indicator transferred to the hourly timeframe from the 4-hour one. Support and resistance areas are areas from which the price has repeatedly rebounded off. Yellow lines are trend lines, trend channels and any other technical patterns. Indicator 1 on the COT charts is the size of the net position of each category of traders. Indicator 2 on the COT charts is the size of the net position for the non-commercial group. The material has been provided by InstaForex Company - www.instaforex.com |
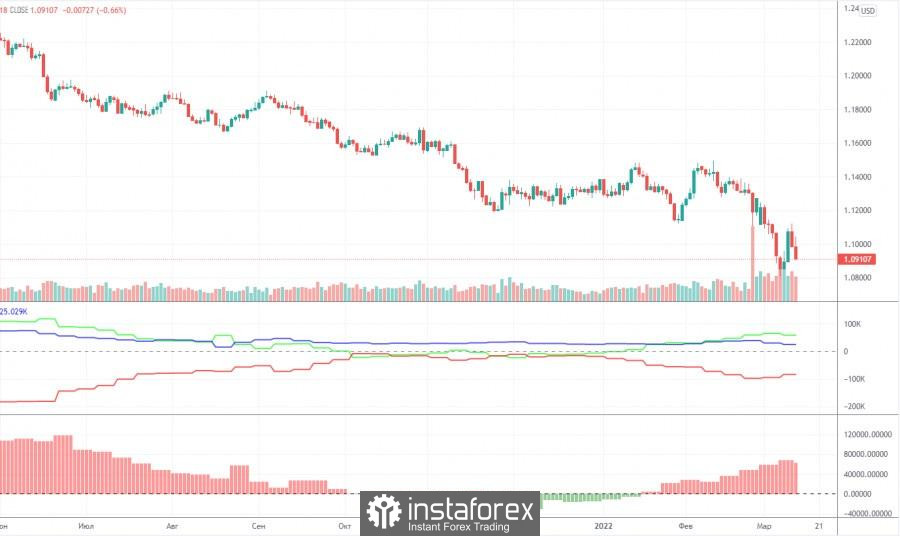
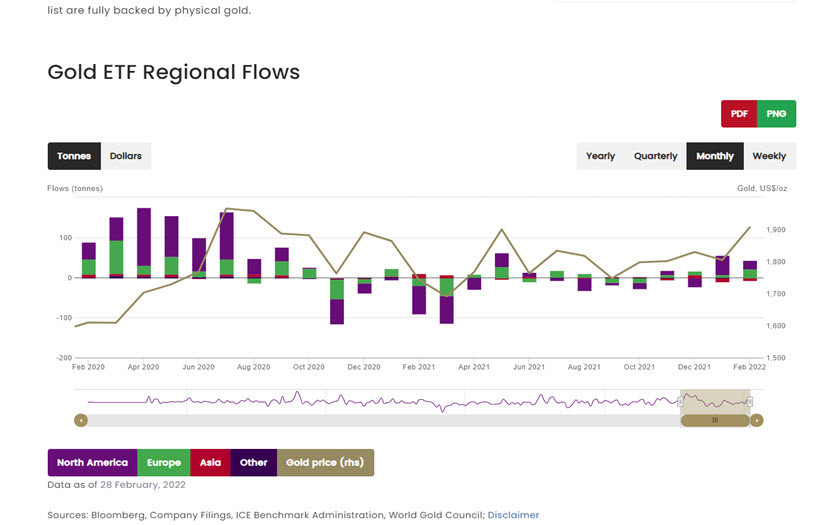
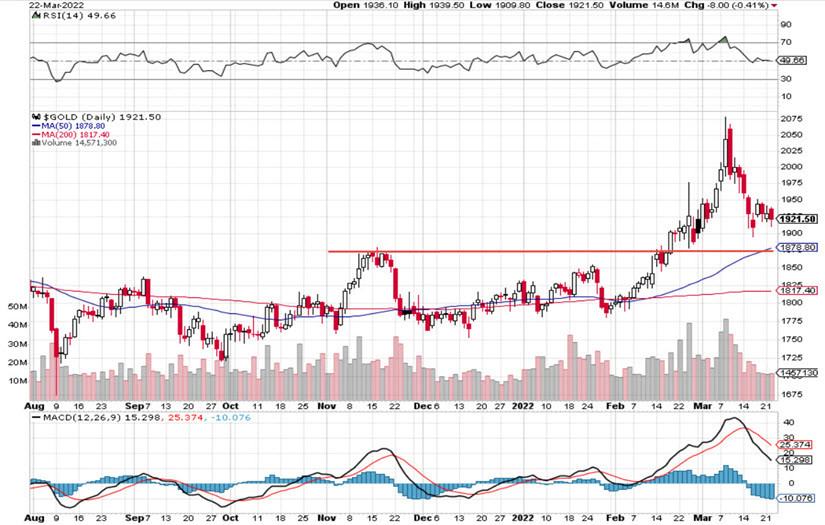
| Gold and silver - prospects of the precious metals market Posted: 23 Mar 2022 02:37 PM PDT Hello, dear colleagues! Three weeks have passed since the last review of the precious metals market, and who is still there. In fairness, it must be admitted that precious metals still attempted to grow, updated the local high located at 1976.50, reached a historical high at 2078, but, failing to overcome it, they returned to the level of $1,900 per troy ounce. This situation has become a disappointment for those investors who have already bought gold and assumed its further growth. However, traders were able to take the profit, because such a development of events was well calculated using technical methods, and in this article I will again try to analyze the prospects for the price of precious metals from the point of view of a multifactorial analysis of financial markets. To begin with, let's look at how the supply and demand in the gold market have changed in the context of investments in exchange-traded funds. After the rapid increase in demand from North American investors, which we saw in January, in February the activity of fans of "paper gold" decreased slightly. Investors from the United States purchased 21.3 tons, which is significantly less than they bought a month earlier. Demand in Europe amounted to 21.4 tons and was the highest since October 2020. Asian investors left the market for the second consecutive month and sold 7.4 tons of gold. According to the aggregate demand, international investors purchased 35.3 tons in exchange-traded funds focused on physical gold, which, although it pushed the price to a historical high, did not allow it to go further, since the volume of purchases was decreasing by January (Fig.1).
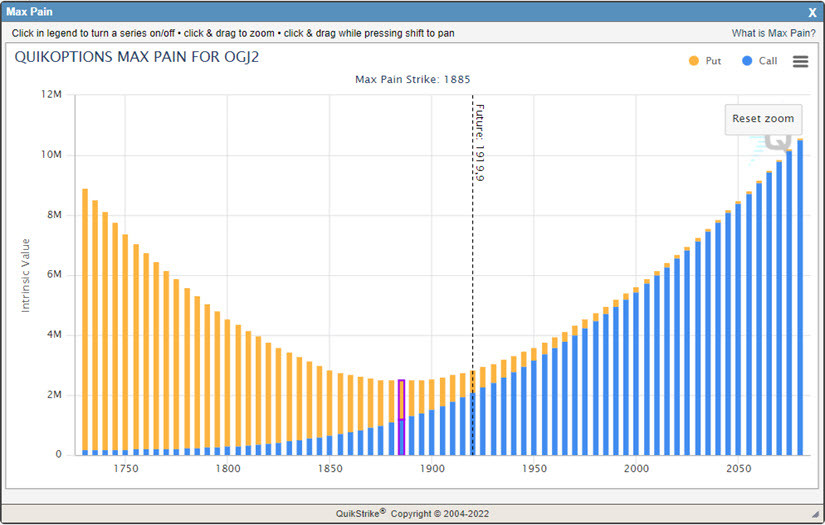
Fig.1: International investments in exchange-traded funds based on gold - Gold ETF At the same time, a small correction experienced by gold may well be a continuation of the trend, but for this, let's look at a number of other factors, in particular supply and demand in futures contracts of the CME-COMEX exchange. First of all, let's pay attention to the indicator of supply and demand, the so-called Open Interest, which increased by more than a third from February 1 to March 15 and amounted to 850,000 contracts, which was the highest value in a year and a half. The growth of OI indicators suggests that the demand for gold futures and options contracts is increasing, and this is the potential for further growth. In contrast, the opposite factor should be taken into account - the calendar closing of options and futures contracts. The nearest option contract in gold, traded on the CME-COMEX exchange, closes on March 28, while the point of highest pain for option buyers is located at $1,885 per troy ounce, which is close to the current gold futures price of 1920 (Fig.2). The point of maximum pain - Max Pain - is the level at which buyers of options will receive the greatest losses, and sellers of options, on the contrary, will receive the maximum profit from their transactions.
Fig: Distribution of strikes in the OGJ2 Gold option contract Thus, the analysis of traders' positions, conducted from the point of view of assessing supply and demand, shows us that at the current moment we have an ideal illustration of how the interest of long-term investors faces resistance from large speculators who do not want to incur losses from a rapid price increase. After the current April contract closes on the exchange, the June contract will be the next in terms of liquidity. In this connection, it can be assumed that the increase in the price of gold may soon resume. We saw a clear example of this approach last week in the price of oil. Then, just a few days before the closing of the April option contract, the price of oil fell by more than a third, but immediately resumed growth as soon as the settlement on options and futures was made. In this regard, traders trading on the oil, gold and other commodities market must take into account the closing date of options and futures in their transactions. The closing date of a particular contract can be found on the CME exchange by looking at the specification or calendar. After we have understood the general - fundamental direction of the price - let's look at the technical picture in gold with a perspective for one to three months (Fig.3).
Fig.3: Technical analysis of the gold price As follows from Chart 3, in February 2022, the price of gold broke the multi-year range and reached historical highs, after which a correction occurred. At the same time, it seems to me that in the next few weeks gold will form a reversal model from the range of 1880-1920, where traders and investors will be able to buy it with a target of 2070 and 2500, setting orders to fix losses below the value of 1800. This will allow traders to have profit and risk ratios of about 2 to 1, which is an acceptable level for any investment and trading system.
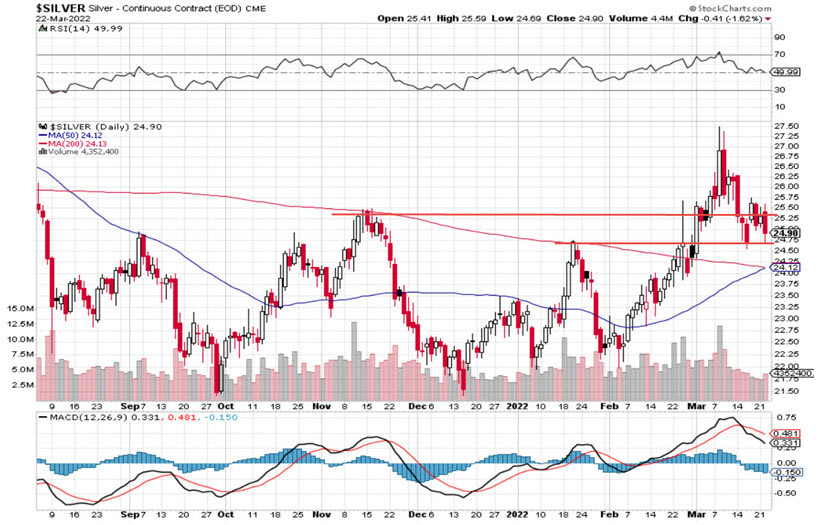
Fig.4: Technical picture of the silver price Silver, like gold, overcame strong resistance in February and reached the level of 27.50, after which it returned to the range of 24.75-25.25, where, in my opinion, it will form a reversal pattern with subsequent growth to the levels of 27.50 and 30.00. In the current situation, traders should not rush to make long positions and it is better to wait for a more distinct trading model that allows you to place a stop order with a profit and risk ratio of at least 2 to 1, based on the price movement to the first target, located at 27.50. As usual, the market does not set us easy tasks, so be careful, follow the rules of money management when opening your positions. The material has been provided by InstaForex Company - www.instaforex.com |
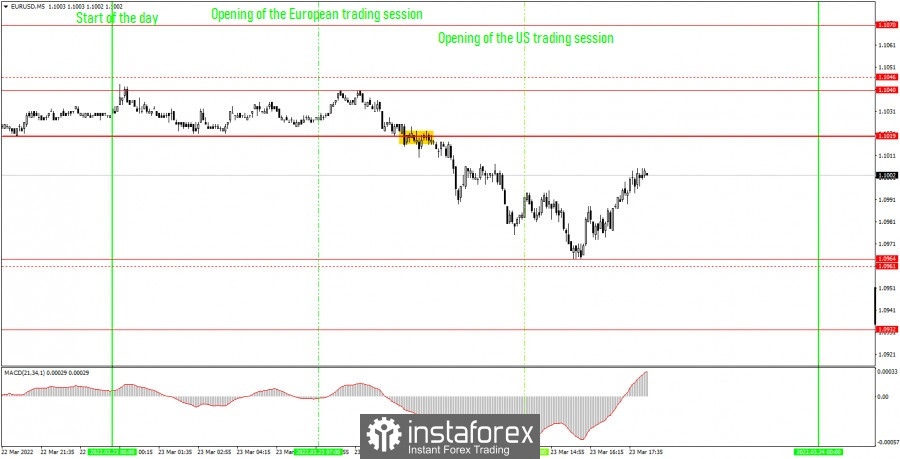
| How to trade EUR/USD on February 24? Simple tips for beginners. Posted: 23 Mar 2022 02:37 PM PDT Analysis of previous deals:30M chart of the EUR/USD pair
The EUR/USD currency pair was again moving very indistinctly on Wednesday. The pair settled below the rising channel a day earlier, so we concluded that now the downward movement will continue. In principle, this is what happened, but still, a rather strong rollback to the top began in the afternoon. The volatility was again quite high - about 80 points - so it cannot be said that now it is flat, and traders are resting in the Maldives. However, the bears have big problems with moving down. Like bulls moving up. Federal Reserve Chairman Jerome Powell gave another speech today, however, judging by the way the pair moved during the day, this time the head of the Fed did not say anything important. This is logical, since Powell, who speaks at least twice a week, cannot please the markets with new and important information every time. Even earlier this week, when he announced the Fed was ready to raise rates more quickly and strongly, the US dollar did not rise much. Simply because it is already clear to everyone: the Fed will raise rates throughout 2022. 5M chart of the EUR/USD pair
On the 5-minute timeframe, the movements were finally those that can be worked out and on which you can earn. There were few signals today, just one, but still the movement was trending most of the day, and it's nice. The levels of 1.1046 and 1.0961 were adjusted to the levels of 1.1040 and 1.0964 today. The only trading signal was formed after the price overcame the level of 1.1019, which we wanted to remove from the chart yesterday. After the formation of a sell signal, the price went down almost 50 points, but just barely failed to reach 1.0961. Therefore, the signal to close a short position was not received. Nevertheless, novice traders had plenty of time to close the deal in profit. And even if they waited until the evening, they still got 10-20 points of profit. Therefore, today can be considered positive. Now we can only hope that the pair will not start trading flat and will maintain the trend mood. How to trade on Thursday:The pair has consolidated below the ascending channel on the 30-minute timeframe, so we expect to see a continuation of the fall of the European currency. So far, there are obvious problems with this, despite the ultra-hawkish rhetoric of the Fed and the ultra-dovish rhetoric of the European Central Bank. However, there are more chances to see a downward movement now. It is recommended to trade by levels 1.0932, 1.0964, 1.1019, 1.1040, 1.1070, 1.1106 on the 5-minute TF tomorrow. When passing 15 points in the right direction, you should set the Stop Loss to breakeven. No important events or macroeconomic publications are scheduled for Thursday in either the European Union or the United States. The geopolitical topic is also already fading into the background, at least for market participants. There is no aggravation of the situation in Ukraine (although the probability of this remains). Negotiations between Kiev and Moscow are not progressing (although the likelihood of progress remains). Therefore, now the market has calmed down and is ready to trade in a more familiar mode for everyone. Basic rules of the trading system:1) The signal strength is calculated by the time it took to form the signal (bounce or overcome the level). The less time it took, the stronger the signal. 2) If two or more deals were opened near a certain level based on false signals (which did not trigger Take Profit or the nearest target level), then all subsequent signals from this level should be ignored. 3) In a flat, any pair can form a lot of false signals or not form them at all. But in any case, at the first signs of a flat, it is better to stop trading. 4) Trade deals are opened in the time period between the beginning of the European session and until the middle of the American one, when all deals must be closed manually. 5) On the 30-minute TF, using signals from the MACD indicator, you can trade only if there is good volatility and a trend, which is confirmed by a trend line or a trend channel. 6) If two levels are located too close to each other (from 5 to 15 points), then they should be considered as an area of support or resistance. On the chart:Support and Resistance Levels are the Levels that serve as targets when buying or selling the pair. You can place Take Profit near these levels. Red lines are the channels or trend lines that display the current trend and show in which direction it is better to trade now. The MACD indicator (14,22,3) consists of a histogram and a signal line. When they cross, this is a signal to enter the market. It is recommended to use this indicator in combination with trend lines (channels and trend lines). Important speeches and reports (always contained in the news calendar) can greatly influence the movement of a currency pair. Therefore, during their exit, it is recommended to trade as carefully as possible or exit the market in order to avoid a sharp price reversal against the previous movement. Beginners on Forex should remember that not every single trade has to be profitable. The development of a clear strategy and money management are the key to success in trading over a long period of time. The material has been provided by InstaForex Company - www.instaforex.com |
| You are subscribed to email updates from Forex analysis review. To stop receiving these emails, you may unsubscribe now. | Email delivery powered by Google |
| Google, 1600 Amphitheatre Parkway, Mountain View, CA 94043, United States | |


Comments