Forex analysis review
Forex analysis review |
- GBP/USD Hot Analysis on 15 March, 2022
- EUR/USD Analysis on 15 March, 2022
- Trading signals for EUR/USD on March 15-16, 2022: buy above 1.0970 (2/8 Murray - bullish pennant)
- Trading signals for Gold (XAU/USD) on March 15-16, 2022: buy in case of rebound at $1,910 (200 EMA)
- Gold larger drop activated
- Trading tips for USD/CHF
- ECB leaves interest rates unchanged
- BTC update for March 15,.2022 - Potential for the breakout mode
- Ethereum still under pressure.
- Analysis of Gold for March 15,.2022 - Downside objective reached but potential for next target at $1.886
- The proposal to ban bitcoin in the EU due to Proof-of-Stake is rejected
- Forecast for EUR/USD on March 15. The European currency feels uncomfortable on the eve of the Fed meeting
- Forecast for GBP/USD on March 15. UK: wages are rising, unemployment is falling, the pound is silent
- EURUSD could soon start new upward movement!
- Short-term analysis on Gold.
- GBPUSD close to breaking out of the wedge pattern.
- GBP/USD update for March 15, 2022 - Bull divergence and potential for bigger rally
- US premarket on March 15: falling oil prices can save US economy from recession
- Review of USD, NZD and AUD: Fed begins its two-day meeting. Demand for commodities dipped sharply.
- Oil: who flies high, falls painfully
- GBP/USD: the plan for the US session on March 15 (analysis of morning deals). The pound is stomping in one place. There are
- EUR/USD: plan for the US session on March 15 (analysis of morning deals). To break above 1.0990, we have broken through,
- Video market update for March 15,,2022
- USD/CAD Analysis and Trading Plan
- Gold stands to be primary beneficiary
| GBP/USD Hot Analysis on 15 March, 2022 Posted: 15 Mar 2022 08:56 AM PDT
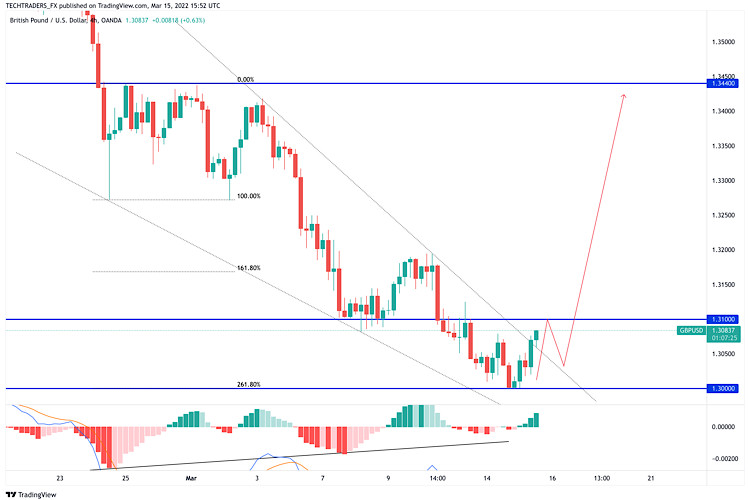
GBP/USD staled its early advance below the 1.3100 figure, now stable at around 1.3060. Upbeat UK employment figures maintain the British Pound afloat, despite increased demand for the greenback. The Relative Strength Index (RSI) indicator on the four-hour chart stays near 40 and GBP/USD continues to trade below the 20-period SMA, suggesting that buyers are yet to control the pair's action. Moreover, 4-hourly MACD has diverged in favor of the bulls. MACD histograms has produced higher lows , contradicting lower lows on the price chart. That bullish divergence indicates a potential for a corrective bounce which confirms the reversal chart pattern formation ( falling wedge) after the breakout of pattern. 1.3000 (psychological level, static level) aligns as significant support and additional losses toward 1.2920 (static level) could be witnessed in case this level turns into resistance. Resistances are located at 1.3050 (static level, 20-period SMA), 1.3100 (psychological level, static level) and 1.3150 (static level, 50-period SMA). The material has been provided by InstaForex Company - www.instaforex.com |
| EUR/USD Analysis on 15 March, 2022 Posted: 15 Mar 2022 08:55 AM PDT
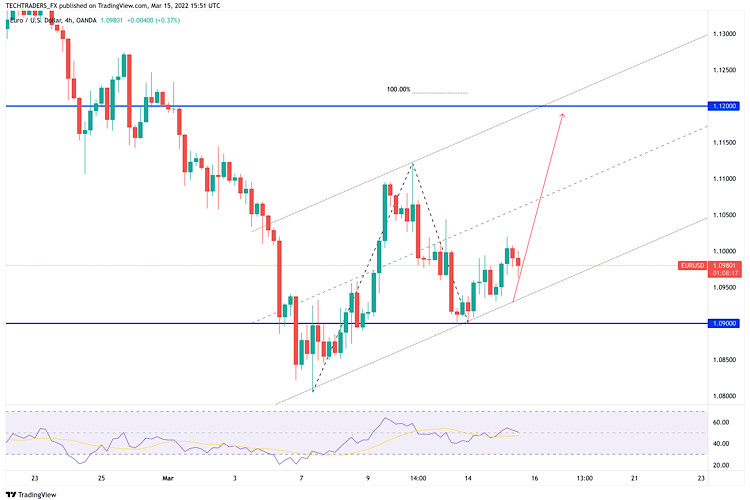
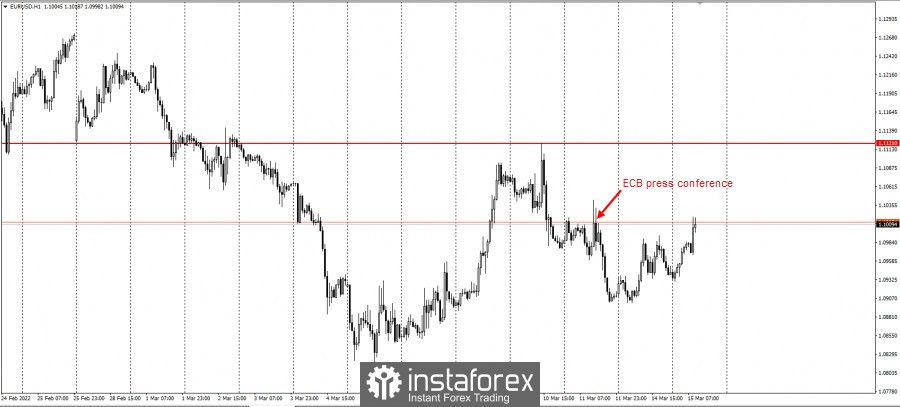
EUR/USD continues to trade in the positive territory near 1.1100 as the American session gets underway on Tuesday. With Wall Street's main indexes posting decisive gains after the opening bell, the greenback struggles to find demand. Meanwhile, the data from the US showed on Tuesday that the annual PPI jumped to 10% in February as expected. The EUR/USD pair trades a handful of pips above the 23.6% retracement of its latest daily slump in the 1.0960 price zone. The bullish potential remains limited, according to technical readings in the daily chart, as technical indicators are barely recovering within negative levels. Additionally, the 20 SMA heads firmly lower, above the current level and below the longer moving averages. In the near term, and according to the 4-hour chart, the pair is neutral. Technical indicators are hovering around their midlines without directional strength as the pair develops a few pips above a bearish 20 SMA. The next Fibonacci resistance level comes at around 1.1070, and a break above the level is required for a more sustainable advance in the upcoming sessions. Support levels: 1.0960 1.0900 1.0850 Resistance levels: 1.1020 1.1070 1.1115 The material has been provided by InstaForex Company - www.instaforex.com |
| Trading signals for EUR/USD on March 15-16, 2022: buy above 1.0970 (2/8 Murray - bullish pennant) Posted: 15 Mar 2022 08:51 AM PDT
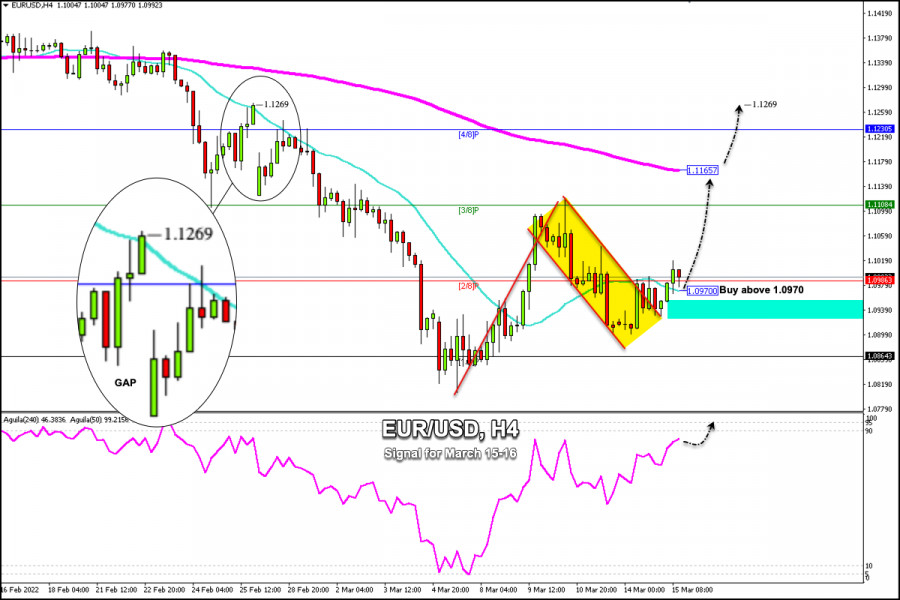
EUR/USD is trading above the 21 SMA and above the 2/8 Murray around 1.0986, having reached an intraday high of 1.1019 amid improving risk sentiment and a sharp drop in gold. Upside potential remains limited, based on technical readings on the daily chart. However, in the 4-hour chart, the picture changes as the formation of a bullish pennant pattern is underway. Confirmation of this pattern is given, but the Euro needs strength to push it to reach its target at 1.1165 and could cover the GAP at 1.1269. Today, the two-day meeting of the Federal Reserve will begin. The decision will be announced on Wednesday and a rise in the reference interest rate of 0.25 basis points is widely expected. An increase of 0.50 basis points could weaken the Euro and cause its fall towards the support of 1.08. On the other hand, if the decision is unveiled as the market expects, then the Euro could gain strength and rise towards 4/8 Murray at 1.1230 and even cover the GAP that it left on February 25 at 1.1270. Our trading plan for the next few hours is to buy the Euro as long as it remains trading above the 21 SMA located at 1.0970. Should there be a correction, as long as it remains above the low this week (1.0900), it is likely that the Euro is preparing for a bullish push in line with the technical pattern. The eagle indicator is giving a positive signal but approaching overbought levels. The material has been provided by InstaForex Company - www.instaforex.com |
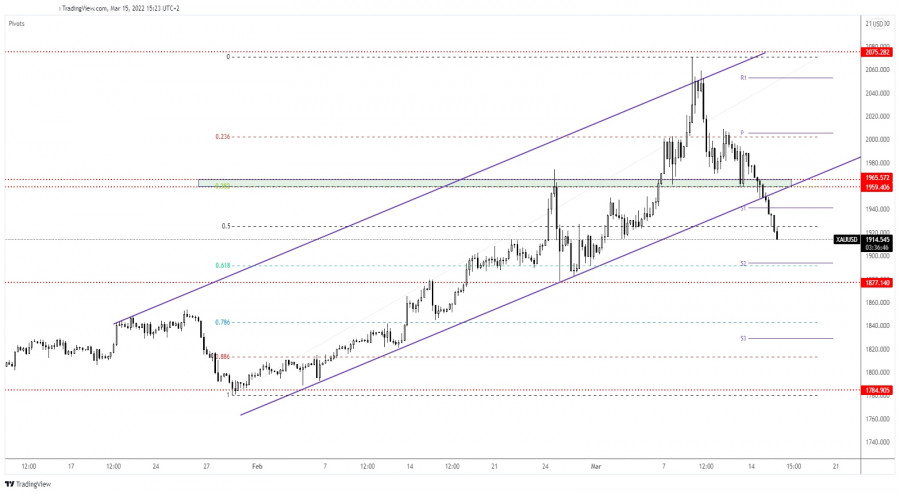
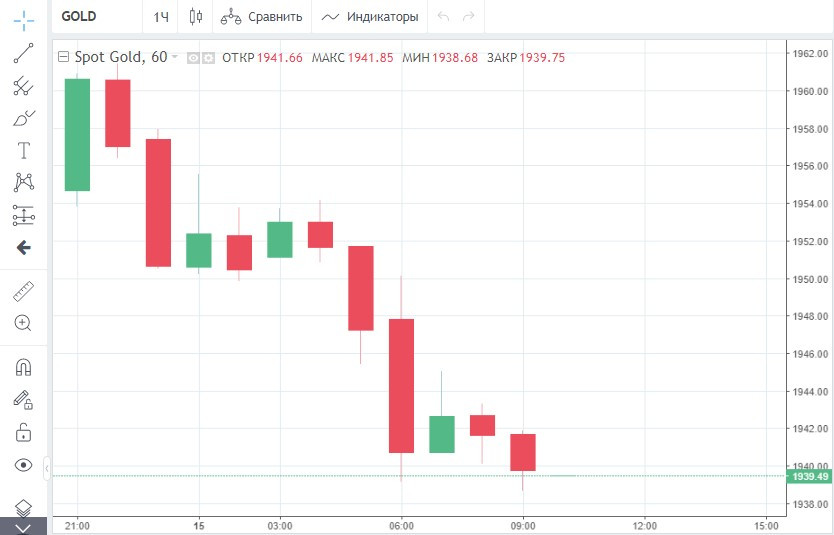
| Trading signals for Gold (XAU/USD) on March 15-16, 2022: buy in case of rebound at $1,910 (200 EMA) Posted: 15 Mar 2022 08:03 AM PDT
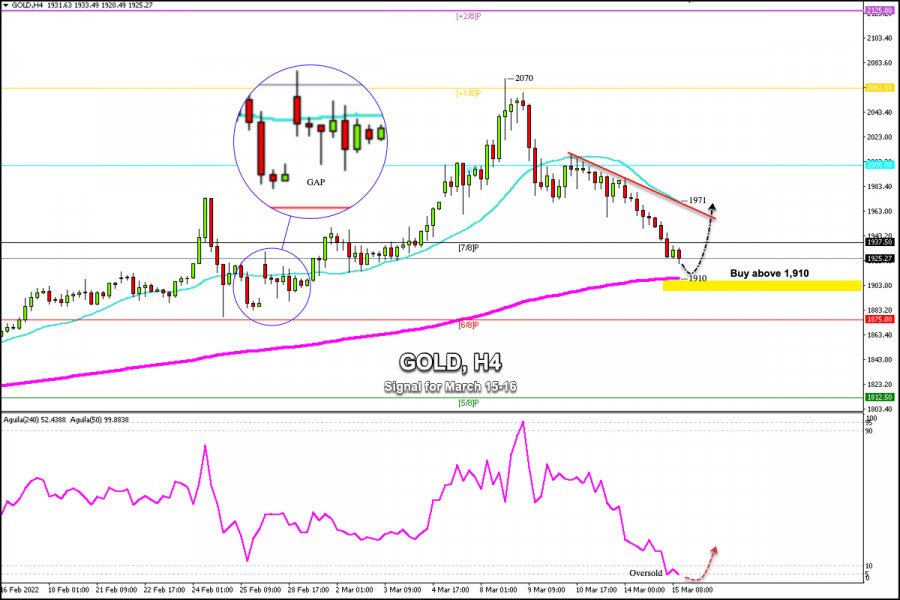
Since last week when gold reached the all-time high 2,070, the price has extended its recent sharp pullback, and has fallen sharply when it broke the 21 SMA on March 9 around the psychological level of 2,000. Today is the fourth day of the negative movement that has dragged prices to a low around the area of 1,920. Gold is expected to continue its fall in the next few hours, although it could find a strong bottom at the 200 EMA around 1,910. At the fundamental level, the hopes of progress in the talks on the ceasefire between Russia and Ukraine and a diplomatic solution to end the war was the determining factor for gold to fall sharply. The Russian and Ukrainian delegations held the fourth round of negotiations on Monday and the discussions are scheduled to resume on Tuesday. An optimistic deal could weaken gold further and the price could drop to 6/8 Murray at 1,875. On the other hand, the most important event this week will be policy decisions by the Federal Reserve. Investors seem convinced that the Fed will confirm an imminent start to tighten its monetary policy and will raise its interest rate by 25 basic points, but could surprise with an increase of 50 bp. A sharp break below the 200 EMA (1,910) could accelerate gold's decline and the price could test the psychological level at 1,900. Next, 6/8 Murray is located at 1,875, where gold is expected to make a strong technical rebound. However, if it breaks decisively, it will change the short-term bias and accelerate the fall to 1,812 (5/8 Murray) On the other hand, as long as gold keeps trading above the 200 EMA around 1,910, it could grasp a chance to recover and go back to the 1,971 level (SMA 21) and up to 8/8 of Murray at $2,000. Sustained strength above 1,937 (7/8 Murray) will have the potential to push gold towards the key psychological level of 2,000. Above 8/8 Murray, the way is clear for gold to resume its upward move and reach +1/8 Murray at 2,062. The material has been provided by InstaForex Company - www.instaforex.com |
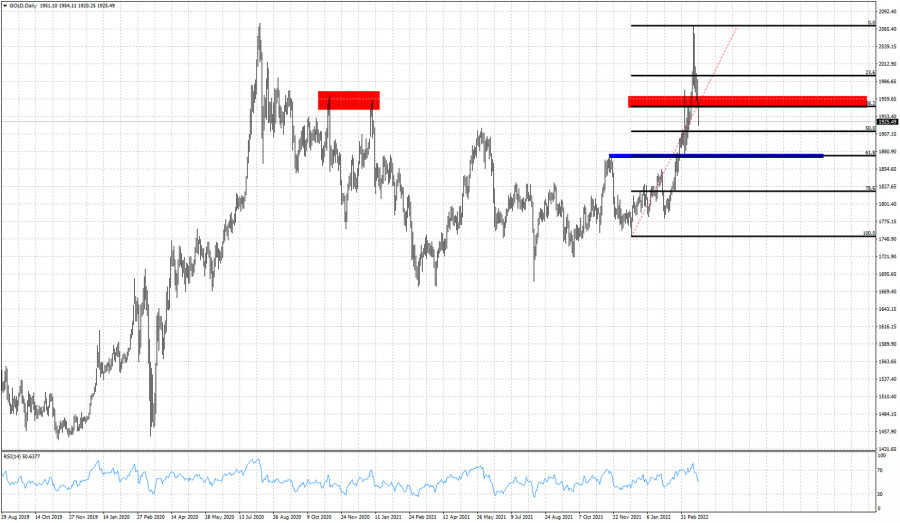
| Posted: 15 Mar 2022 07:44 AM PDT XAU/USD is dropping like a rock at the time of writing. It's trading at 1,918 and it seems very heavy. The bias is bearish, so a further drop is in cards. Technically, the yellow metal ignored the near-term downside obsatcles, activating more declines. As I've said in my previous analysis, XAU/USD drops ahead of the FOMC as the FED is expected to hike rates. The Federal Funds Rate is expected to be increased from 0.25% to 0.50% tomorrow. Today, the US PPI rose by 0.8% versus 1.0% expected, while the Core PPI increased by 0.2% versus 0.6% estimates. XAU/USD Massive Drop!
XAU/USD ignored the uptrend line which represented dynamic support. Now, it's located below the 50% (1,925) retracement level. After ignoring the 1,959 - 1,965, the uptrend line, and the weekly S1 (1,941) signaled that Gold could develop a larger drop. After its massive drop, we cannot exclude a temporary rebound. The price of gold could come back to test and retest the immediate resistance levels before dropping deeper. 1,900 psychological level stands as a potential downside target. XAU/USD Outlook!The price of gold could extend its sell-off after ignoring the near-term support levels. Taking out the uptrend line signaled more declines. 1,877 key level stands as a potential major downside obstacle and target. Only a temporary rebound could bring new and fresh short opportunities. The material has been provided by InstaForex Company - www.instaforex.com |
| Posted: 15 Mar 2022 05:57 AM PDT
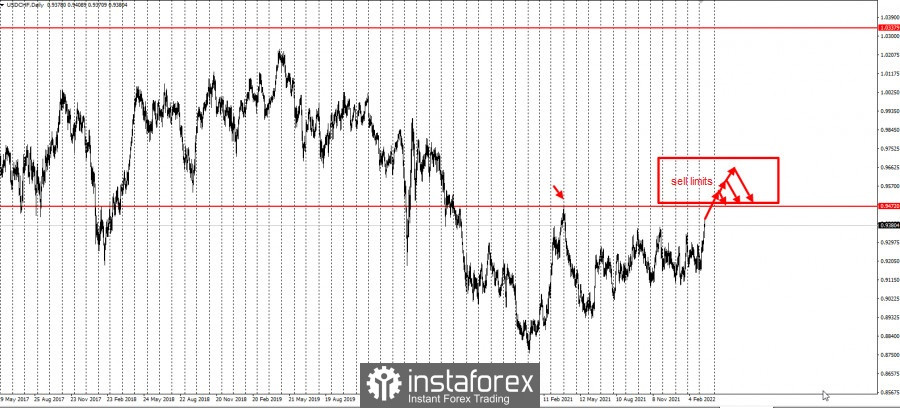
USD/CHF has been increasing since October 2020. It gained as much as 6,000 pips, and is currently approaching the 2021 high at 0.94700. This situation opens an opportunity for traders to place a grid of sell limits in the pair.
After the breakdown of 0.94700, place a grid of sell limits in an increment of 300-500 pips. Take profit on a breakout, either at 1 pip above the first order or after a 100 pip rise. This strategy is called grid trading, which is usually used on cross rates. It involves holding positions that are significant in time and distance. For this reason, we recommend using swap-free accounts, not increasing the volumes in the grid (0.01 standard lot for every $ 1000 of the deposit) and monitor price movements. Good luck and have a nice day! The material has been provided by InstaForex Company - www.instaforex.com |
| ECB leaves interest rates unchanged Posted: 15 Mar 2022 05:50 AM PDT
The ECB left its base interest rate unchanged at the lowest level. Since March 2016, it has been at zero. EU finance ministers have agreed to slightly tighten fiscal policy next year, after three years of injecting billions into the economy due to the coronavirus pandemic. They also said they will prepare more cash if the situation in Ukraine makes it necessary. EUR/USD reacted weakly to this news, but during the US session underwent a decline amid increased demand for dollar.
Although all EU ministers said the eurozone economy is in good shape, uncertainty has increased significantly. The economic implications of the conflict in Ukraine are yet to be determined, increasing the risks associated with continued problems in the supply chain, fairly high energy prices and inflation, which remains at a high level for much longer than expected. On March 2, the European Commission recommended that EU governments shift from a supportive stance to a neutral stance next year, as the economy is growing and EU countries have large debts as a result of the pandemic. But they also said governments should be ready to quickly return to supporting the economy with public money, depending on what problems the geopolitical situation in Ukraine will bring. The potential policy change will be facilitated by the fact that EU government borrowing restrictions are likely to remain suspended in 2023 due to the uncertainty caused by the situation in Ukraine. Ministers agreed that countries with high levels of debt, such as Italy or Greece, should focus on reducing it, while countries with low levels of debt should focus more on investment. In terms of inflation, the ECB projected that it will reach an average of 5.1%, despite the economy growing 0.5% slower due to geopolitical tensions. But in 2023, it will drop to 2.1%. The European Commission will publish its own updated economic forecasts in May. The material has been provided by InstaForex Company - www.instaforex.com |
| BTC update for March 15,.2022 - Potential for the breakout mode Posted: 15 Mar 2022 05:44 AM PDT Technical analysis:
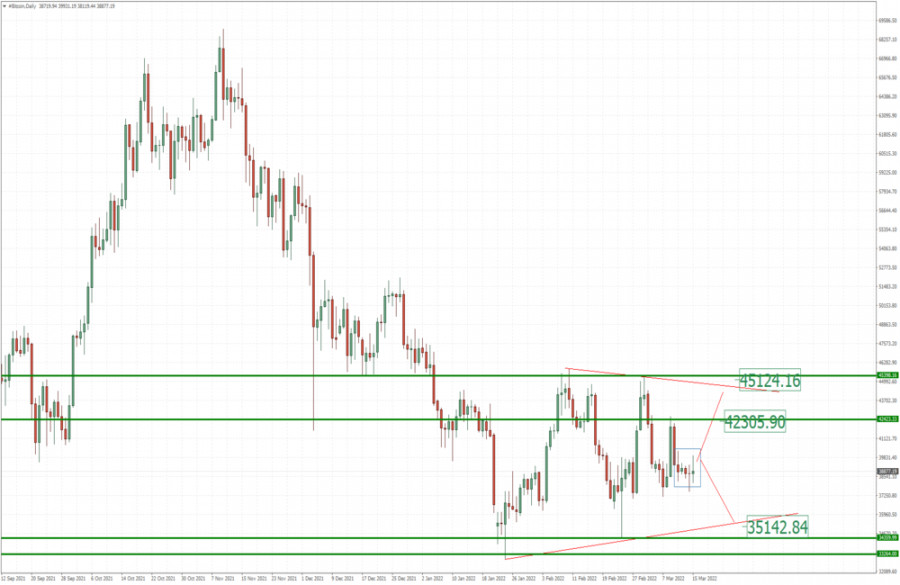
BTC/USD has been trading sideways at the price of $38.800 and the best strategy under current condition is to watch for breakouts. Trading recommendation: The breakout of important daily pivot resistance at $40.350 can lead BTC towards the upside objectives at $42.300 and $45.125 The breakout of daily pivot support at $37.500 can lead BTC towards the downside objectives $35.150 Watch for the breakout to confirm further direction Bigger picture: Triangle in creation The material has been provided by InstaForex Company - www.instaforex.com |
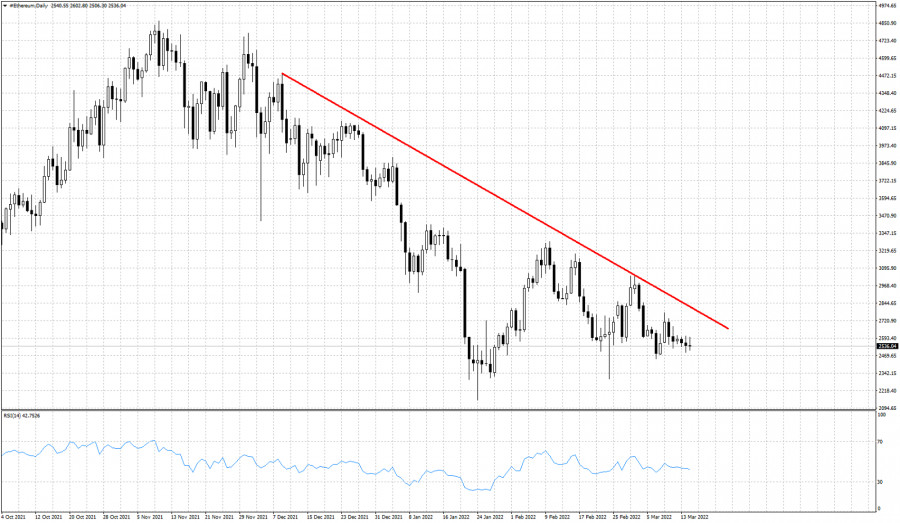
| Ethereum still under pressure. Posted: 15 Mar 2022 05:36 AM PDT Ethereum price is around $2,540. Technically trend remains bearish making lower lows and lower highs. Price remains below the key resistance trend line since November. So far there has been no sign of a reversal. Bears remain in control of the trend.
Resistance by the downward sloping trend line is found at $2,800. Ethereum bulls will need to break above this trend line in order to get the first bullish signal. So far price continues to respect the trend line and stays below it. Bears remain in control. This could end soon but we will be more sure about this if price breaks the resistance trend line. Support is found at $2,340. Failure to hold this level will open the way for a bigger decline towards $2,200-$2,000. The material has been provided by InstaForex Company - www.instaforex.com |
| Posted: 15 Mar 2022 05:32 AM PDT Technical analysis:
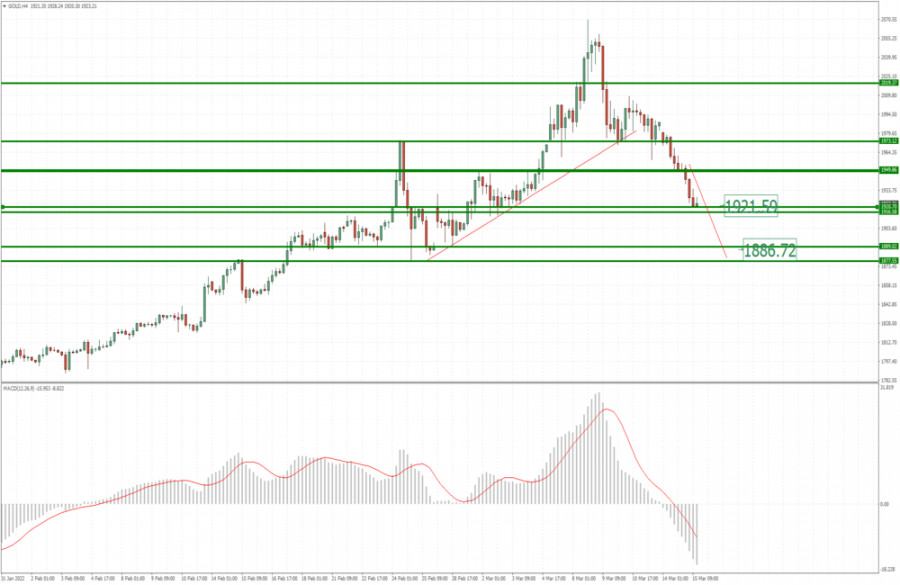
Gold has been trading downside as I expected. The price has been reached downside objective at $1,920 and is heading towards next downside objective. Trading recommendation: Due to strong downside pressure and no sign for the reversal yet, I see further downside continuation. Watch for selling opportunities on the rallies with the next downside objective at the price of $1.885 (cluster of lows). MACD oscillator is showing negative reading which is sign that selling pressure is still heavy. Resistance level is set at the price of $1.960 The material has been provided by InstaForex Company - www.instaforex.com |
| The proposal to ban bitcoin in the EU due to Proof-of-Stake is rejected Posted: 15 Mar 2022 05:32 AM PDT A new rule that could ban the popular bitcoin cryptocurrency in the European Union was rejected yesterday. On Monday, the European Parliament's Committee on Economic and Monetary Affairs voted by 30 votes to 23 to exclude this provision from the Markets in Crypto Assets (MiCA) project - a comprehensive EU regulation on digital asset management. Six members of the commission abstained from voting.
Let me remind you that the provision in question required that all crypto assets comply with the "minimum standards of EU environmental certification concerning their consensus mechanism used to verify transactions." For cryptocurrencies such as bitcoin and ether, whose turnover in the EU is quite high, the rule suggests a phase-out plan to transfer their consensus mechanism from Proof-of-work to other methods that consume less energy. Let me remind you that ether already has plans to switch to the Proof-of-Stake consensus mechanism, however, this option is unlikely to be acceptable for bitcoin since it changes its whole essence. The proposal was met with a rapid negative reaction from the crypto community around the world. A compromise was also reached during the vote, which called on the European Commission, responsible for new legislation in the field of digital assets, to propose alternative regulation. By January 1, 2025, the Commission must submit to the European Parliament a legislative proposal to amend Regulation (EU) 2020/852 following environmental requirements. However, some EU leaders were dissatisfied with this result, as they are seriously concerned that in the near future renewable energy may be aimed at supporting the work of cryptocurrencies instead of its national use. This will create an even greater load on standard networks and operating stations. The fact that bitcoin ignored yesterday's vote indicates that there is no panic among the leaders of the cryptocurrency community. However, if such a measure is adopted in the future, the collapse of the cryptocurrency will not happen. Mining of bitcoin and other altcoins, as well as support for the functioning of the network that miners are engaged in, is not so common in the EU. However, the parliament may go so far as to follow the path of China and impose a ban on the circulation of cryptocurrencies on the territory of the European Union - then this will become another test for decentralization and all the staples of the cryptocurrency world. But such drastic measures have not even been considered yet. As for the technical picture of bitcoin Bitcoin once again aimed at the $37,500 mark, but was rebuffed by buyers there. Active purchases in this range have been observed for quite a long time, and there is the highest interest in the first cryptocurrency. Now everything is tied to the levels of the greed of investors and their intimidation of what is happening on the world stage. In the event of another decline in the trading instrument, only a breakdown of $37,500 will fail the trading instrument below, to a minimum of $34,300, and there it is at hand to $32,900. It will be possible to talk about stopping the bear market in the current conditions only after BTC returns above $ 41,850. Only after that, you can expect to recover to the areas of $45,360 and $48,500. The fact that bitcoin feels pretty great in the current conditions proves the interest in it, keeping its bullish potential in the long run. As for the technical picture of the ether The focus remains on the resistance of $2,756. Only consolidation above will return the prospect of an upward correction to the market. In the meantime, the probability of a large bearish trend will be valid. The breakdown of $2,756 will serve as a new impulse to reach the levels of $2,942 and $3,190. If the pressure on ETH persists, purchases in the area of large support of $ 2,500, as it was this weekend, are not excluded. A break in this range will be a reason to go to the lows of $2,312 and $2,149, where the major players will again begin to actively act. The material has been provided by InstaForex Company - www.instaforex.com |
| Posted: 15 Mar 2022 05:32 AM PDT
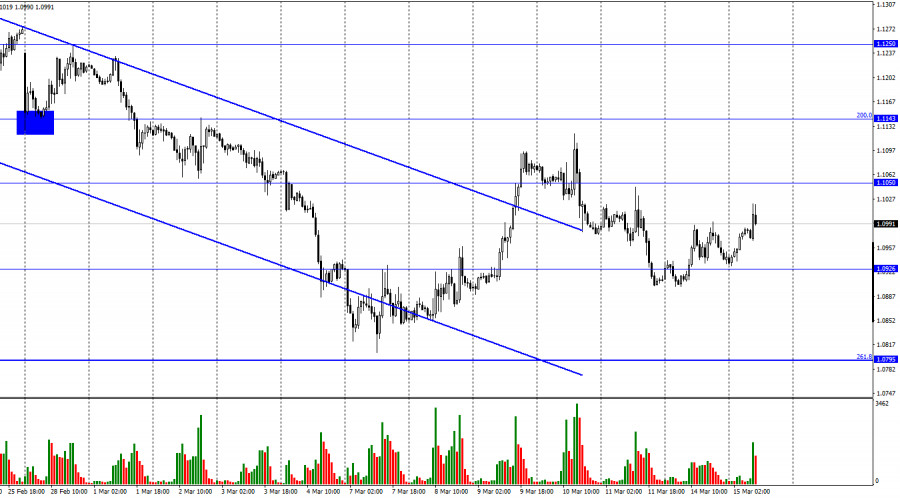
The EUR/USD pair performed a new reversal in favor of the EU currency on Monday and another one on Tuesday morning. Thus, the growth process continues in the direction of the 1.1050 level, and bear traders have finally retreated. Although I would not make hasty statements about this. The fact that the European currency is showing growth now cannot be a reason that it will show growth in the future. Last week, the ECB made its position clear. It lies in the fact that the interest rate will not be raised this year, which means that inflation is going to float freely. No one will have any influence on it and the ECB has very few ways to influence it. The European economy is going through hard times in its history. It managed to "move away" from the coronavirus pandemic with great difficulty, but even now the quantitative stimulus program continues to work in the European Union. That is, at this time, the ECB is still printing money to stimulate its economy. And if so, then raising the rate does not make any sense, and the economy needs to be stimulated, not tightened. But the Fed may announce an interest rate hike tomorrow. I believe that the only thing that can save the euro from a new fall is that there has been talk of a repeated increase in the Fed rate for six months, that is, traders could already take this increase into account in the current dollar rate. If so, the euro will be saved for a while. However, it will still not be possible to eliminate the geopolitical factor from the equation. A military operation conducted by the Kremlin continues in Ukraine. Although many international experts do not believe that this operation will be able to be implemented for a long time (Russia simply does not have the necessary resources for this), there are always various options. And Moscow itself understands perfectly well that it cannot take a step back. There are already reports that China may join this conflict as an ally of the Russian Federation. However, it does not want to do it publicly, so as not to fall under sanctions from the West and the European Union. Since in this case, the whole world will be split into two large blocks, and the probability of a Third World War will increase.
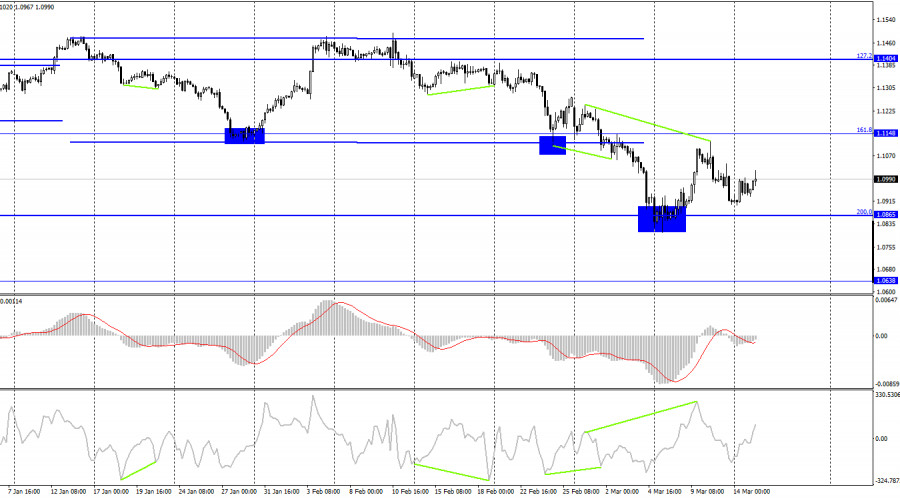
On the 4-hour chart, the pair performed a reversal in favor of the US dollar after the formation of a bearish divergence at the CCI indicator. Thus, the fall in quotes can be continued in the direction of the corrective level of 200.0% (1.0865). A rebound from this level will work in favor of the EU currency, but it is more likely to close below this level and a further drop in quotes in the direction of the 1.0638 level. Commitments of Traders (COT) Report:
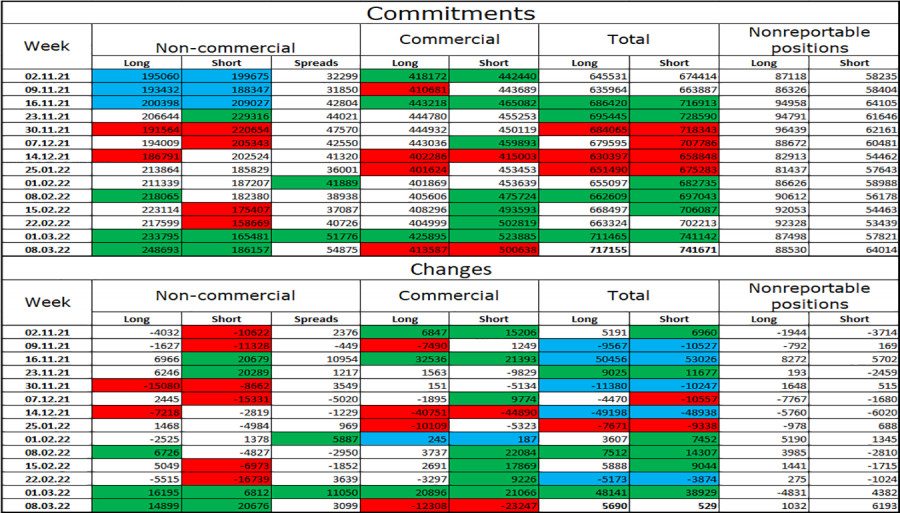
Last reporting week, speculators opened 14,899 long contracts and 20,676 short contracts. This means that the bullish mood of the major players has become weaker. The total number of long contracts concentrated on their hands now amounts to 248 thousand, and short contracts - 186 thousand. Thus, in general, the mood of the "Non-commercial" category of traders is still characterized as "bullish" and is strong. This would give an excellent opportunity for the European currency to count on growth, if not for the information background, which now supports only the American currency. We are now witnessing a paradoxical situation: the bullish mood of major players is increasing (if you look at it for several months), while the currency itself is falling. And it falls quite heavily. Thus, geopolitics is now a priority. News calendar for the USA and the European Union: EU - change in industrial production (10:00 UTC). US - producer price index (12:30 UTC). EU - ECB President Christine Lagarde will deliver a speech (15:15 UTC). On March 15, the calendar of economic events of the European Union and the United States does not contain really interesting entries. Traders can only be interested in Christine Lagarde's speech. I believe that today the information background will have a weak impact on the mood of traders. EUR/USD forecast and recommendations to traders: I recommend new sales of the pair if the pair performs a rebound from the 1.1050 level on the hourly chart, with targets of 1.0926 and 1.0865. I do not recommend buying a pair, since the probability of a new fall in the euro currency is too high. The material has been provided by InstaForex Company - www.instaforex.com |
| Forecast for GBP/USD on March 15. UK: wages are rising, unemployment is falling, the pound is silent Posted: 15 Mar 2022 05:32 AM PDT
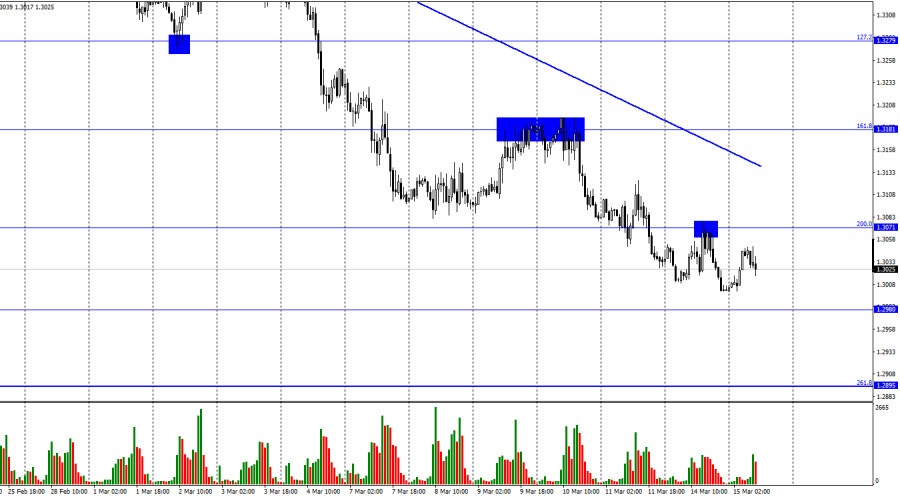
According to the hourly chart, the GBP/USD pair on Monday performed an increase to the corrective level of 200.0% (1.3071), a rebound from it, a reversal in favor of the US currency, and a new fall. On Tuesday, the pair's quotes attempted to start a new growth process, but it choked very quickly. Although it was today that the pound had a real chance to climb as high as possible. In the morning, several interesting reports were published in the UK that could support the pound. The unemployment rate in January decreased from 4.1% to 3.9%, average wages increased from 4.6% to 4.8%, and the number of applications for unemployment benefits decreased by 48 thousand. Thus, all three reports could support the pound sterling. But they didn't. I believe that traders have already fully focused on the three most important events of this week. The first is the Fed meeting, the second is the Bank of England meeting, and the third is geopolitics. I have spoken about geopolitics many times. This is a factor that can affect the mood of traders for a long time. But the first two events do not happen so often, and traders are waiting for them. The Bank of England has the most questions right now. It has already raised the interest rate twice, surpassing even the Fed in this indicator. Now we are talking about the third rate increase. At least most traders believe in it. However, from my point of view, everything may not go according to plan, because quite unexpectedly for many, the UK has become one of the most zealous opponents of Russia in recent weeks, has imposed many sanctions, and by the end of the year is going to completely abandon the import of oil and gas from the Russian Federation. Inflation in the UK is also growing, and growing rapidly, and high oil prices will only spur the growth of prices for everything else. Thus, the Bank of England also needs to fight high inflation. But will it want to do this in the face of new geopolitical and economic risks? It is quite possible that at the meeting on Thursday, it will be decided to put the rate hike cycle on pause. In this case, the pound may again be under pressure.
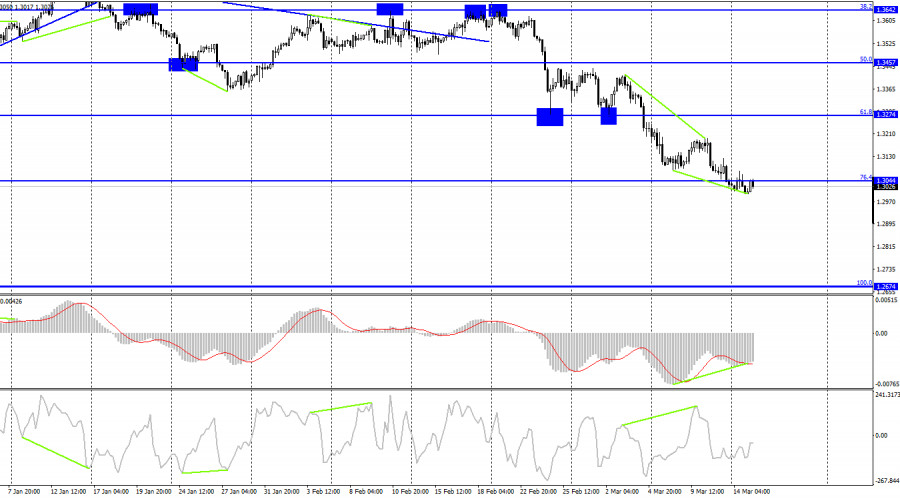
On the 4-hour chart, the pair secured under the corrective level of 76.4% (1.3044). However, the bullish divergence of the MACD indicator allows us to count on a reversal in favor of the British currency and some growth in the direction of the Fibo level of 61.8% (1.3274). The consolidation of quotes under the last low of divergence will increase the probability of a further fall in the direction of the corrective level of 100.0% (1.2674). Commitments of Traders (COT) Report:
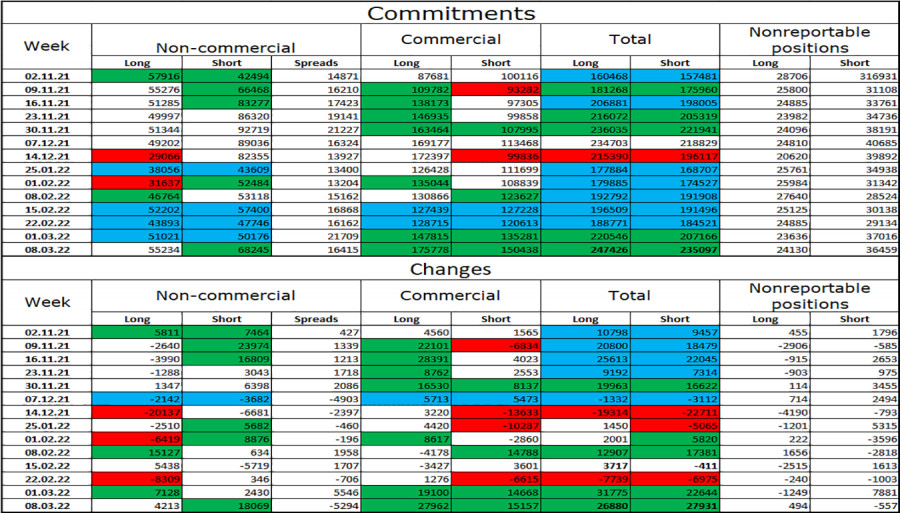
The mood of the "Non-commercial" category of traders has changed dramatically again over the last reporting week. The number of long contracts increased in the hands of speculators by 4,213, and the number of short contracts increased by 18,069. Thus, the general mood of the major players has become more "bearish", and the number of short contracts has increased significantly. Thus, everything is in order now, and the ratio between long and short contracts for speculators corresponds to the real state of things. The British dollar is falling, and the big players are selling the pound more than buying it. Nevertheless, I draw the attention of traders to the fact that the mood of major players changes too often and too sharply, and the British dollar has been falling for quite a long time. News calendar for the USA and the UK: UK - change in the number of applications for unemployment benefits (07:00 UTC). UK - unemployment rate (07:00 UTC). UK - change in the level of average earnings (07:00 UTC). US - producer price index (12:30 UTC). On Tuesday, the calendar of economic events in the UK contains three entries, but they are already known to traders. There are no interesting entries in the USA today, so for the rest of the day, I do not count on the influence of the information background on the mood of traders. GBP/USD forecast and recommendations to traders: I recommended new sales of the pound when closing below the level of 1.3044 with targets of 1.2980 and 1.2895, but now we also need to wait for the cancellation of the bullish divergence of the MACD indicator. I do not recommend buying a pound today, since all factors remain in favor of the dollar. The material has been provided by InstaForex Company - www.instaforex.com |
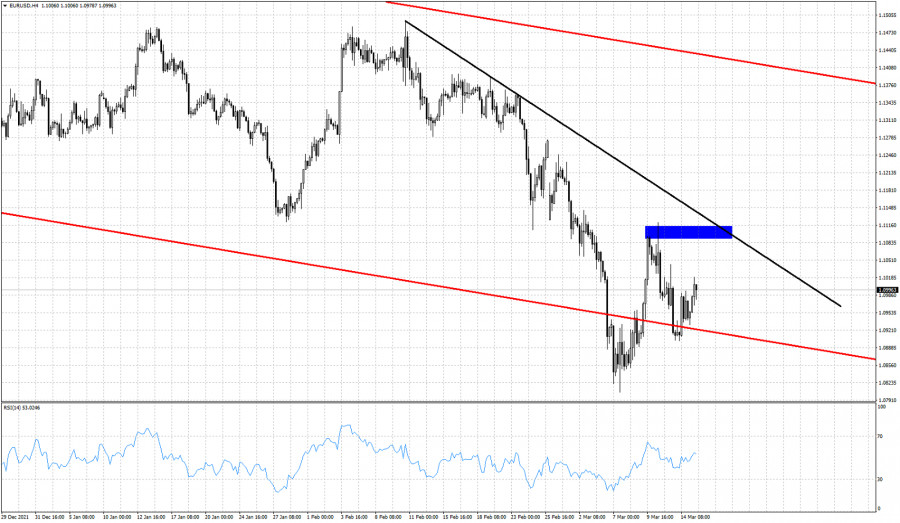
| EURUSD could soon start new upward movement! Posted: 15 Mar 2022 05:31 AM PDT EURUSD is trading at 1.10. Short-term trend is mixed as we have seen a stop to the lower lows and lower highs pattern. Prices are mostly moving sideways in an area of great support. Although technically trend remains bearish, there are some signs that tell us that the chances of a reversal are icnreasing.
Blue rectangle - horizontal resistance Black line- trend line resistance EURUSD has formed a higher low at 1.09. Bulls want to see price break above the black trend line resistance and above the blue rectangle. If this happens, I will be expecting EURUSD to continue higher towards the upper channel boundary around 1.14-1.1370. Failure to hold above 1.09, will push price most probably to new lows below 1.06. The material has been provided by InstaForex Company - www.instaforex.com |
| Posted: 15 Mar 2022 05:27 AM PDT In previous post we warned traders that Gold price justified a pull back towards $1,950 and maybe lower. In yesterday's analysis we also mentioned that if Gold price were to break below $1,950 and the 38% Fibonacci retracement, we should expect more selling pressure.
Blue rectangle- next major support Black lines - Fibonacci retracements Gold price broke below the 38% Fibonacci support and is moving towards our next Fibonacci level (50%) at $1,910. However we should not rule out a deeper correction towards the blue horizontal support and 61.8% Fibonacci retracement at $1,873. Major support remains at $1,750 and as long as price is above this level, we consider this pull back as a counter trend one. The material has been provided by InstaForex Company - www.instaforex.com |
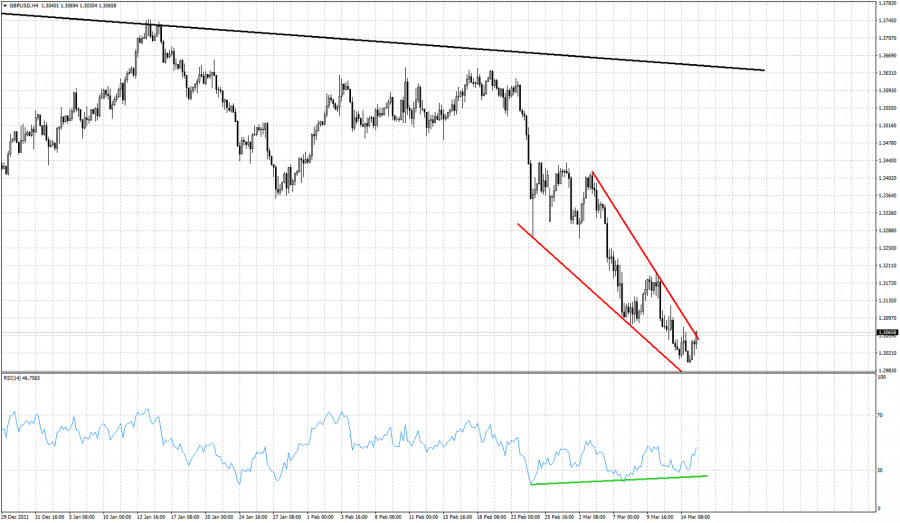
| GBPUSD close to breaking out of the wedge pattern. Posted: 15 Mar 2022 05:23 AM PDT GBPUSD is trading above 1.3050. Price has been trading over the last few days inside a wedge pattern making lower lows and lower highs. The RSI did not follow and has produced bullish divergence warning signals. In previous posts we warned traders that this combination increases the chances of a reversal specially if price breaks above the upper wedge pattern boundary.
Green line- bullish divergence Red lines- downward sloping wedge pattern GBPUSD is challenging today the upper wedge pattern boundary. Price for now is slightly above the upper boundary providing a bullish signal. It is important at the end of the day to see where the pair closes. Traders need to be patient. We might see a rejection at the wedge resistance. If the break out is confirmed, then bulls will need to push price even higher and hold above recent lows at 1.2999. If GBPUSD does produce a bullish signal, our first bounce target will be at 1.34. The material has been provided by InstaForex Company - www.instaforex.com |
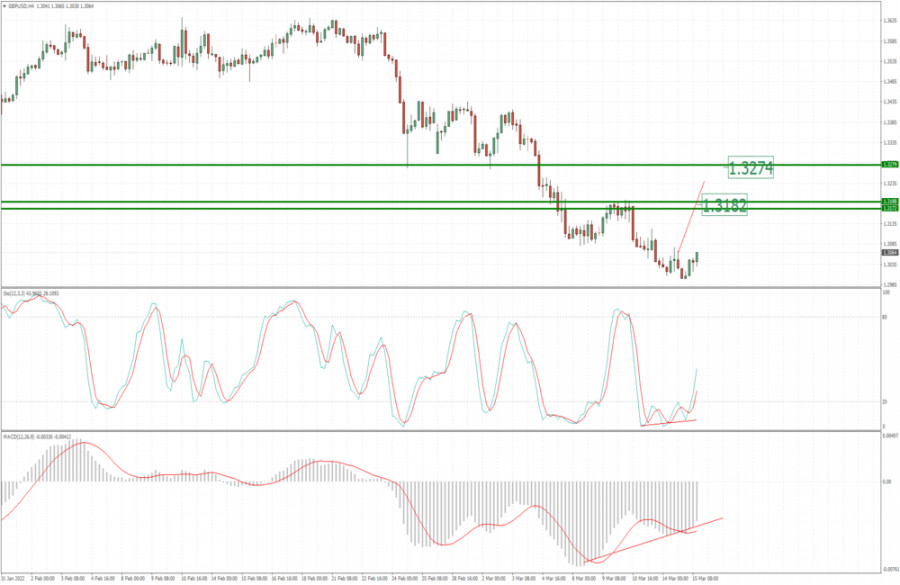
| GBP/USD update for March 15, 2022 - Bull divergence and potential for bigger rally Posted: 15 Mar 2022 05:22 AM PDT Technical analysis:
GBP/USD has been trading upside this morning as I expected. The price is heading towards upside objective and I stil expect bullish movement. Trading recommendation: Due to bullish divergences in the background, I see potential for further bigger rally towards upside references. Watch for buying opportunities on the pullbacks with the upside objectives at 1.3180 and 1.3275. Stochastic and MACD are showing bullish divergences, which is sign that selling power decreased in power and that rally is on the way. Support level is set at the price of 1.3000 The material has been provided by InstaForex Company - www.instaforex.com |
| US premarket on March 15: falling oil prices can save US economy from recession Posted: 15 Mar 2022 05:18 AM PDT US stock index futures are trading mixed but remain within yesterday's bearish correction. Falling oil prices dampen pessimism and allow investors to reduce their long positions in precious metals, including gold. A drop in oil prices adds to hopes that energy prices will not drag the US economy into recession. Market participants also continue to closely follow the cease-fire talks in Ukraine and the news on quarantine in China. Another coronavirus outbreak could cause serious damage to supply chains. Investors also prefer to refrain from entering the market ahead of the Federal Reserve's interest rate decision, which will be announced tomorrow. The Fed is expected to raise the rates for the first time since 2018.
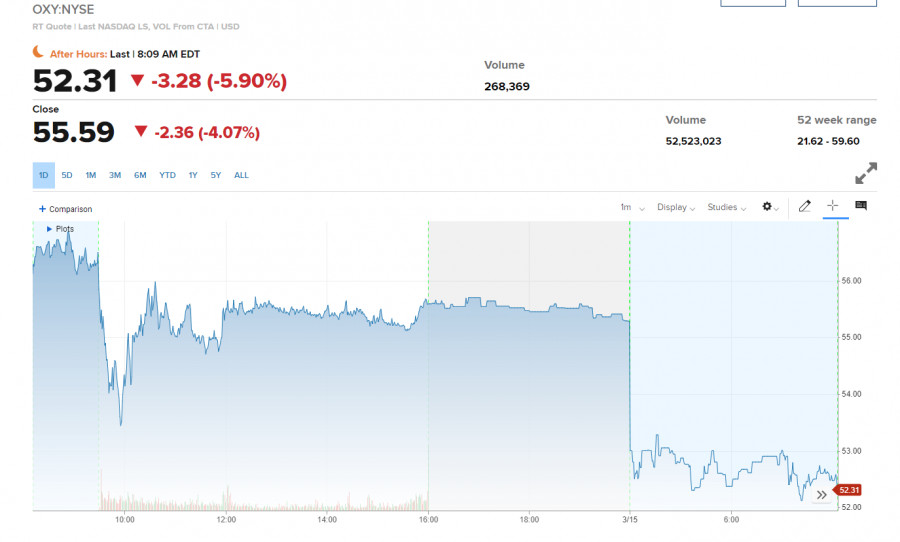
Dow Jones Industrial Average futures are trading near yesterday's closing levels. S&P 500 and Nasdaq 100 futures gained 0.1% and 0.3%, respectively. As mentioned above, oil prices continue to fall for the second day in a row, with WTI futures plummeting by about 8% to $94.55 a barrel after reaching above $130 a week ago. The Brent benchmark fell by more than 7% to $98.46 a barrel. The drop in oil prices has affected the shares of energy companies. Occidental Petroleum lost more than 5% at the premarket, while Schlumberger and Halliburton lost more than 4%.
China is facing its most serious coronavirus outbreak since the pandemic began, raising concerns about further global economic recovery. Representatives of China and the US are also planning to hold a meeting on Russia's military operation in Ukraine. However, investors are waiting for the Fed's two-day meeting. They are expecting a 0.25% rate hike to be announced on Wednesday. However, rising inflation concerns could lead to more aggressive measures, and the US stock market may drop as a result of this. As for premarket: Delta Air Lines, United Airlines, and Southwest Airlines securities rose at the premarket. These airlines raised their earnings forecasts, saying air traveling is recovering from the previous downturn caused by the spread of the Omicron strain.
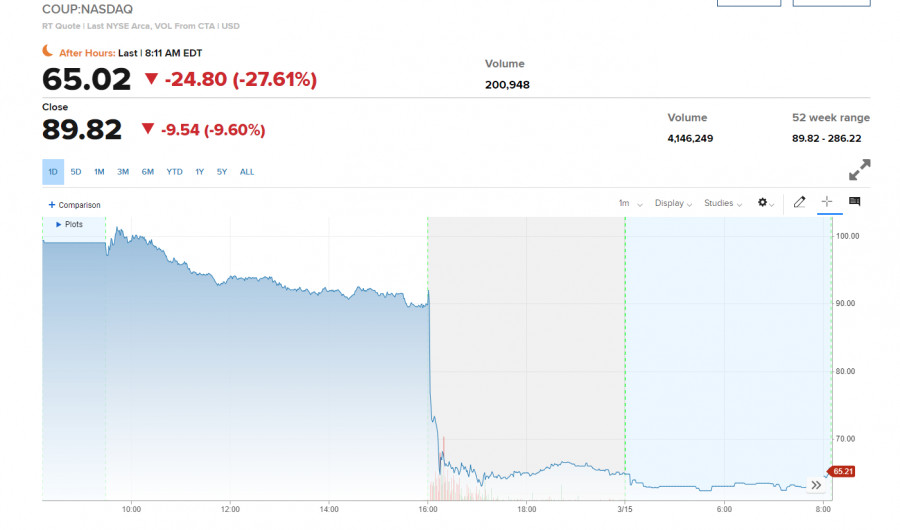
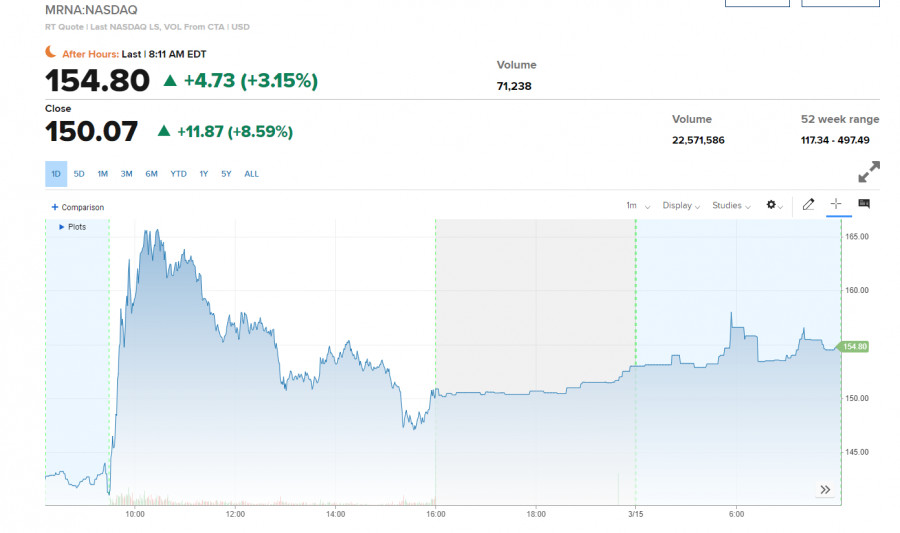
Coupa Software (COUP) fell by 29.5% at the premarket after the business software company reported a much weaker-than-expected yearly outlook. GitLab gained 8.9% at the premarket after the company reported strong results for Q4 2021. Toyota Motor announced additional cuts in its production due to semiconductor shortages. Nevertheless, Toyota added 2.8% at the premarket. News of another coronavirus outbreak in China pushed Moderna up by 4.3% during premarket trading after rising by 11.9% in Monday's trading session.
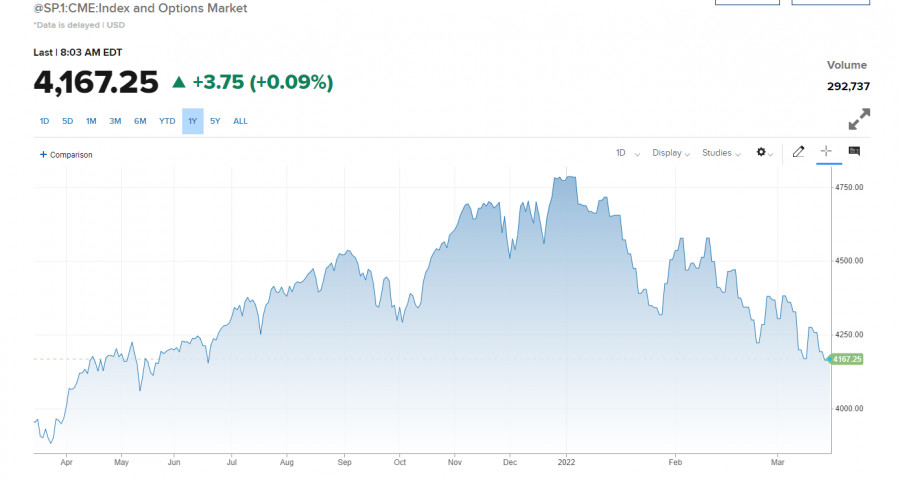
Alibaba dropped by 4.7% in premarket trading. The Chinese e-commerce giant is under pressure because of concerns about slowing economic growth in China, as well as the threat of delisting the company from the US market. As for S&P 500 technical indicators Bulls need to be more aggressive if they expect a rise earlier this week. Risk appetite will be constrained by the Federal Reserve meeting, the outcome of which will be released on Wednesday. Higher interest rates are not good news for the stock market. Bulls will probably try to reach above $4,206, which they failed to do yesterday. If so, the pressure on the trading instrument will increase, which may cause a decline to the area of $4,160. A breakthrough of this level depends on the outcome of the negotiations between Russia and Ukraine. A negative outcome would return the bear market with the prospect of retesting the lows at $4,113 and $4,085. If the index closes above $4,206, it is likely to cancel the market recovery. In the case of growth, it is possible to expect new sell-offs near $4,258 and $4,319. Much will depend on further developments in Ukraine. The material has been provided by InstaForex Company - www.instaforex.com |
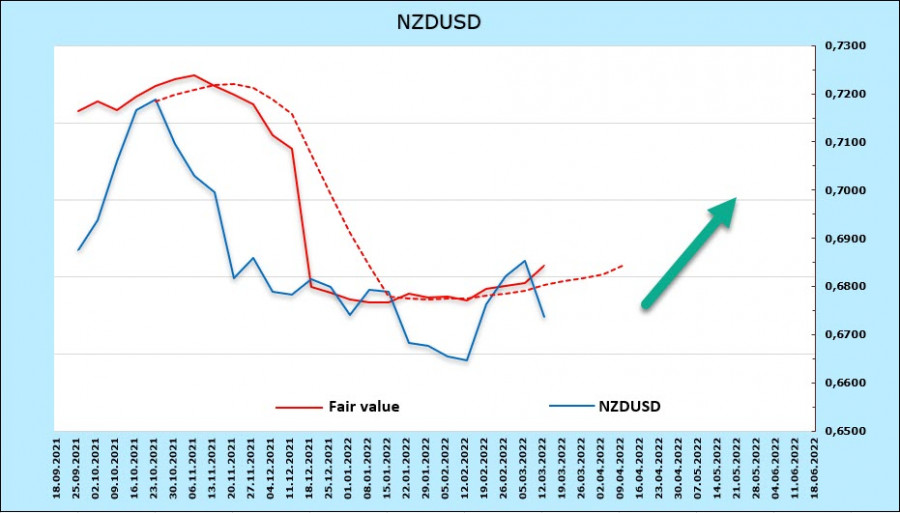
| Review of USD, NZD and AUD: Fed begins its two-day meeting. Demand for commodities dipped sharply. Posted: 15 Mar 2022 05:12 AM PDT The Fed began its two-day meeting today, and markets are again seeing 7 rate hikes this year. If that happens, interest rates will increase to 1.75-2.00%, which will help reduce inflationary pressures. At the moment, commodity markets are seeing an aggressive decline in quotes, primarily due to the situation in Ukraine. Brent fell to $100, while iron ore lost 7.7%. Copper also dipped by 2.5%, while aluminum decreased by 5.1%. The sharp drop in risk appetite also put pressure on commodities, but there is no need to draw a final conclusion yet, especially before the announcement of the results of the FOMC meeting. NZD/USD Three weeks have passed since the February meeting of the RBNZ. Back then, the central bank raised its rate by 0.25% and started quantitative tightening. The situation has become more hawkish now, and the growth of inflationary expectations has become stronger. If commodity prices continue to rise, the RBNZ may raise the rate by 0.5% in April and May. And if oil prices continue to increase, everything will turn up as well, since inflation is growing very quickly. To see a decline, the central bank has to act more aggressively than the Fed.
But that will widen the yield, in favor of New Zealand bonds. On the bright side, it will be a strong bullish factor for NZD/USD, which, at the moment, is bearishly overweight, but still showing signs of a reversal. Latest report indicates that NZD's net short position fell 115m to -843m. The estimated price is turning up, which means demand is growing.
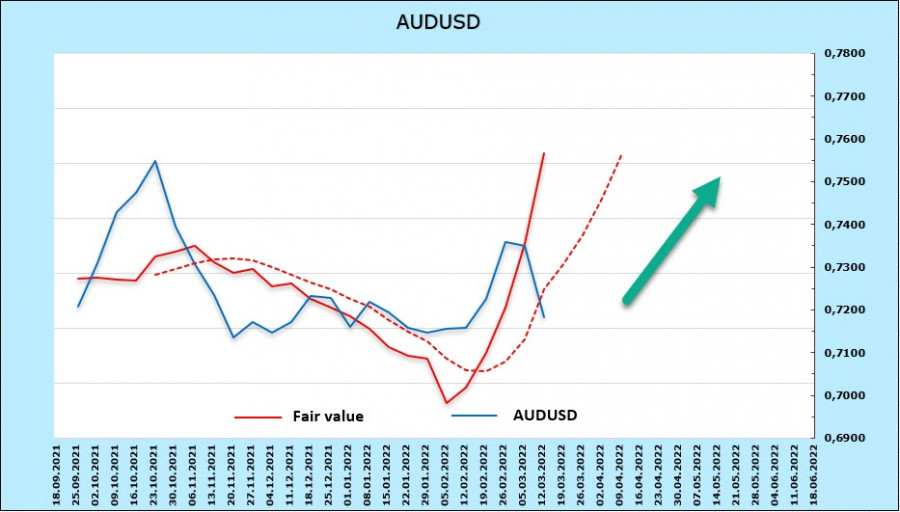
Presumably, NZD will find support at 0.6690/6710, with the nearest targets at 0.6890/6920 and 0.7030/50. AUD/USD Macroeconomic statistics in Australia are very positive. According to latest reports, consumption in Q4 rebounded strongly, consumer spending in Q1 remains strong and strong labor force points to a further decline in unemployment. The National Australia Bank even forecast that the unemployment rate will fall below 4% in March and to 3.5% by the middle of the year. That is likely to lead to higher wages, and thus to higher inflationary pressures. Rising inflation, in turn, reinforces hawkish sentiment in the RBA. Now, the forecasts for the rate are: +0.15% in August, then +0.25% in September and November. This is about 1% less than the Fed's planned rate, which, at first glance, is an argument in favor of the US dollar. But the important thing here is that the inflation gap persists, which means that the real yield of Australian bonds will be higher during the year. For AUD/USD to grow, geopolitical tensions must decrease and commodity prices must bounce up. If both of these happen, the pair will jump to 0.80. If only one occurs, the growth will not be rapid, but will be stable. For now, the CFTC report says the net short position remains at -5.6 billion, but the settlement price rushed up, reflecting the outstripping growth of Australian securities yields and capital inflow into the stock market.
Most likely, the quote will go up after a small correction. Support can be found at 0.7180/7200), with target at 0.7460/80. The material has been provided by InstaForex Company - www.instaforex.com |
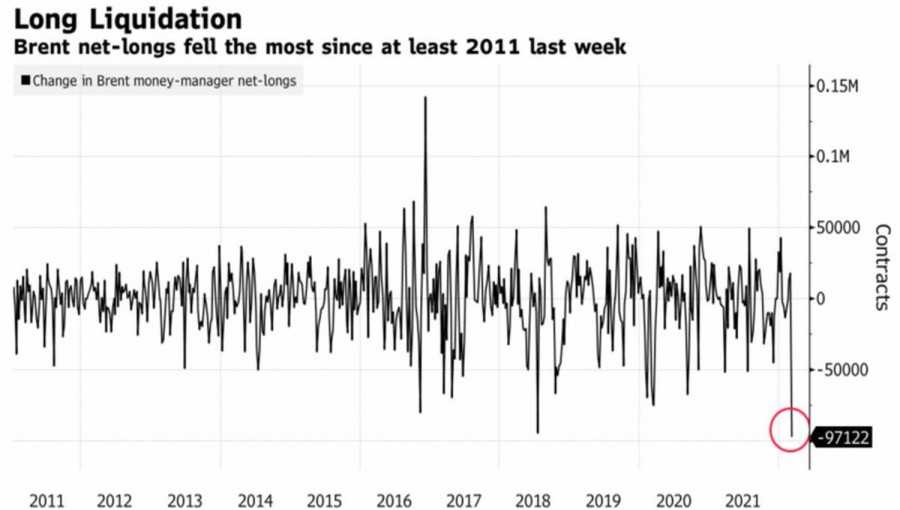
| Oil: who flies high, falls painfully Posted: 15 Mar 2022 05:11 AM PDT It seems that the times when oil prices depended on whether the Sheikh of Saudi Arabia sneezed or not are returning. While Russia is conducting a military operation, and the United States is imposing sanctions against it, the statement of the Minister of Energy from Riyadh that speculators should bet against black gold with the addition of an emotional "damn it" played a role. In the week of March 8, hedge funds reduced net longs for Brent at the fastest pace since 2018. At the same time, sales of the North Sea variety turned out to be the largest since 2016. So don't believe that Saudi Arabia decides everything on the oil market. Dynamics of speculators' net positions on oil
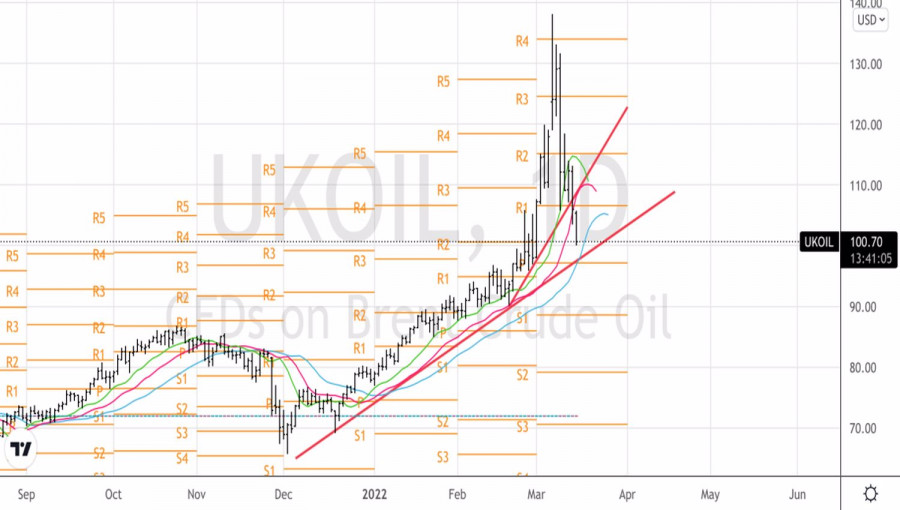
The activity of the "bears" triggered an avalanche of stop orders for long positions, against which Brent immediately collapsed by $25 per barrel at auction on March 9. Formally, the main drivers of its collapse were the progress in negotiations on a peaceful settlement of the conflict between Russia and Ukraine, which theoretically could lead to an increase in oil supply, as well as information about the largest outbreak of COVID-19 in China, which is sure to adversely affect global demand. Oil was added to the fire by the message from OPEC that there is currently no shortage in the market. The number of people infected with coronavirus in China is almost doubling every day, which forces Beijing to close entire cities. As a result, Morgan Stanley lowered the country's GDP forecast for the first quarter from +0.6% to zero, for 2022 - from 5.3% to 5.1%, which is below the official target of 5.5%. China is the largest consumer of oil in the world, so lockdowns can lead to a reduction in global demand, rumors about which contribute to a decline in Brent quotes. The same is true of the Fed. If it goes too far with the tightening of monetary policy, the US economy will approach the abyss of recession, which will also negatively affect the global consumption of black gold. The problems with the offer do not look as terrible as previously assumed. Not all buyers are ready to give up Russian oil. Producers in this country are developing flexible payment mechanisms. India, in order not to lose a key partner, is creating a payment mechanism using its currency, and the most likely outcome for black gold supplied from the Russian Federation is its storage on tankers near Singapore and Malaysia until better times. In addition, some progress is allegedly planned in the negotiations between Kyiv and Moscow, which is another argument in favor of sales of the North Sea variety. Of course, the geopolitical conflict in Eastern Europe has brought oil too high. And as you know, who flies high, falls painfully. Nevertheless, from a fundamental point of view, the market remains strong. Its increased attention to headlines from Ukraine leads to increased volatility. As a result, after a rapid roller coaster, Brent risks falling into consolidation in the range of $95-115 per barrel. Technically, there is a pattern of "surge and reversal with acceleration" on the daily oil chart. The rebound from the supports at $98 and $97 per barrel will be a signal for the opening of longs. Brent, the daily chart
|
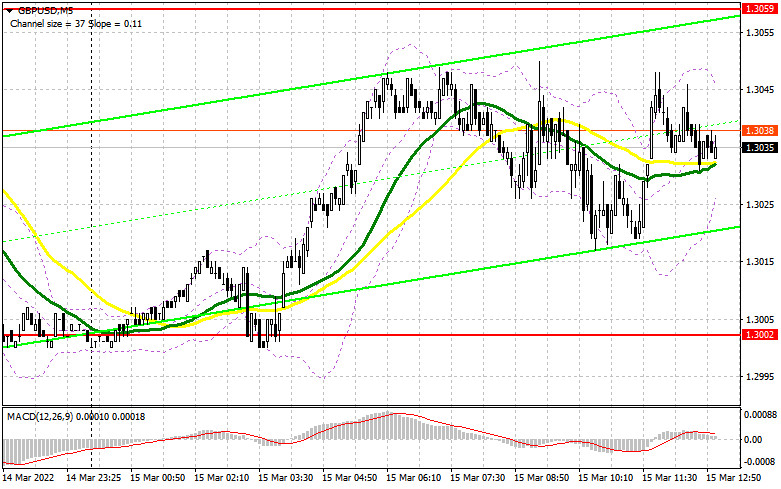
| Posted: 15 Mar 2022 05:10 AM PDT To open long positions on GBP/USD, you need: In my morning forecast, I paid attention to the level of 1.3059 and recommended making decisions on entering the market. Let's look at the 5-minute chart and figure out what happened. Too low volatility in the first half of the day, even against the background of very good data on the UK labor market, did not allow us to reach the levels indicated in the morning. Because of this, there were no signals to enter the market. The technical picture remained completely unchanged. And what were the entry points for the euro this morning?
The unemployment rate in the UK dropped to 3.9% in January this year, which is the best indicator in recent times. However, the market did not react to this in any way, since at the moment the situation has changed very much, and the deterioration of the geopolitical situation along with sanctions and a sharp rise in prices may negatively affect the British economy in the future. In the afternoon, several US data were released, which may further affect the market. Also, everyone is waiting for the results of the next meeting of representatives of Russia and Ukraine. Good news and positive results of negotiations can bring back demand for risky assets, including the British pound. The primary task of buyers for today remains the protection of the 1.3002 support formed by the results of yesterday. This level does not play an important role, since when the pound returns to this range, the bulls will prefer to remain on the sidelines. In case of a decline, only the formation of a false breakdown at 1.3002 and weak US data will give a signal to buy GBP/USD to build at least some upward correction. When implementing such a scenario, the bulls will aim at the resistance of 1.3059, which they failed to get above yesterday. A breakdown and a test of this level from top to bottom will form an additional entry point and strengthen the position of buyers with an increase to the maximum of 1.3121 and the prospect of updating a new resistance of 1.3190. A more distant target will be the 1.3244 area, where I recommend fixing the profits. However, we will be able to reach this level only with very positive news and a reduction in the conflict between Russia and Ukraine. Under the scenario of the pound falling during the US session and the lack of activity at 1.3002, and most likely it will be, it is best to postpone purchases to the next minimum, 1.2932, or larger support of 1.2856. Only the formation of a false breakdown at these levels can leave a bearish trend and give an entry point in the expectation of a short-term rebound of the pair up. You can buy GBP/USD immediately for a rebound from 1.2807 and only to correct 30-35 points within a day. To open short positions on GBP/USD, you need: The sellers of the pound are not particularly showing themselves yet, but the market was on their side - the trend is bearish. Most likely, this calm will remain until tomorrow's decisions of the Federal Reserve System. Even expectations of a small upward correction in the pound today do not cause serious concerns - the growth will be seen as a good opportunity to sell at higher prices. The deterioration of the geopolitical situation will also play into the hands of sellers, but if it improves, the bears will quickly leave the market, which will lead to the rapid growth of the pound - pay special attention to this. Trading is already in the area of moving averages, which indicates some short-term market uncertainty. The primary task of sellers for the second half of the day is to protect the 1.3059 range. The formation of a false breakdown at this level will give an entry point into short positions to continue the bear market and the subsequent decline of the pair to the area of 1.3002. You will have to fight for this level. A breakdown and a reverse test from the bottom up of 1.3002 will lead to the demolition of several stop orders, which will dump GBP/USD to the lows of 1.2932 and 1.2856. A more distant target will be the 1.2807 area, where I recommend fixing the profits. If the pair grows during the American session and sellers are weak at 1.3059, it is best to postpone sales to the resistance of 1.3121. I also advise you to open short positions there only in case of a false breakdown. You can sell GBP/USD immediately for a rebound from the maximum of 1.3190, or even higher - from 1.3244, counting on the pair's rebound down by 30-35 points within a day. The COT reports (Commitment of Traders) for March 8 recorded a sharp increase in both long and short positions. Some took advantage of the panic in the market, others had attractive prices. However, there were more of those who increased short positions, which led to an increase in the negative delta. This week, we will have a meeting of the Federal Reserve System, and how the American regulator will behave in the conditions of the highest inflation in the last 40 years is a big question. A more active policy on interest rates will increase the demand for the US dollar, which is already trampling the British pound almost every day to the next annual lows. We also remember that although Russia and Ukraine have sat down at the negotiating table, so far these meetings do not give any special results. Against this background, I recommend continuing to buy the dollar, since the bearish trend for the GBP/USD pair has not gone away. The only thing that now saves the pound from a major sell-off is high inflation in the UK, which will force the Bank of England to act more actively as well. The very next day after the Fed meeting, the Bank of England will hold a meeting. This is where a reversal of the pound may occur in the opposite direction, so when selling at the lows of GBP/USD, think about tomorrow. The COT report for March 8 indicated that long non-commercial positions increased from the level of 47,679 to the level of 50,982, while short non-commercial positions increased from the level of 48,016 to the level of 63,508. This led to an increase in the negative value of the non-commercial net position from -337 to -12,526. The weekly closing price dropped to 1.3113 against 1.3422. Signals of indicators: Moving averages Trading is conducted around 30 and 50 daily moving averages, which indicates an active confrontation between buyers and sellers. Note. The period and prices of moving averages are considered by the author on the hourly chart H1 and differ from the general definition of the classic daily moving averages on the daily chart D1. Bollinger Bands A break of the lower limit of the indicator in the 1.3000 area will increase the pressure on the pound. A break of the upper limit of the indicator in the area of 1.3060 will lead to the growth of the pair. Description of indicators
|
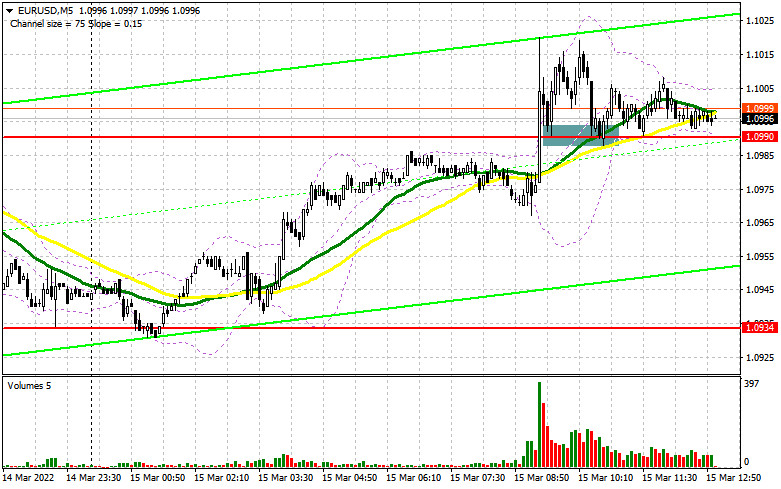
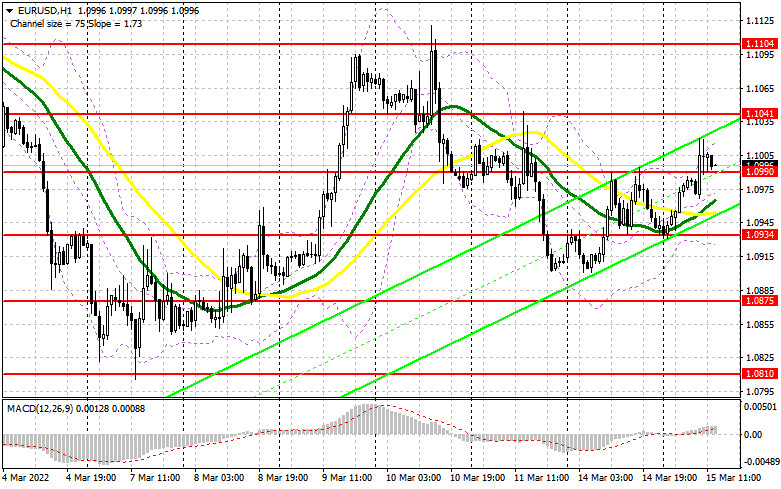
| Posted: 15 Mar 2022 05:10 AM PDT To open long positions on EURUSD, you need: In my morning forecast, I paid attention to the level of 1.0990 and recommended making decisions on entering the market. Let's look at the 5-minute chart and figure out what happened. Euro buyers tightened the pair above the 1.0990 level, and a reverse test of this range from top to bottom led to the formation of a buy signal. Unfortunately, there was no major growth of the pair at the time of writing the article. A maximum of 30 points could be seen moving. Until the moment when trading is conducted above 1.0990, we can expect the euro to continue to grow. For the second half of the day, the technical picture has not changed in any way. And what were the entry points for the pound this morning?
The data released at lunchtime on the index of business sentiment from the ZEW Institute of Germany and the eurozone, as well as on the index of the current situation from the ZEW Institute of Germany turned out to be much worse than economists' forecasts. Worse is not even to say anything. The fact that European business and the business environment are in a state of shock is now confirmed by figures that are scary to look at. This will not lead to anything good, respectively, and this is not very good news for the euro. Several US data is coming out this afternoon, which may further affect the market. Also, everyone is waiting for the results of the next meeting of representatives of Russia and Ukraine. Good news and positive results of negotiations can bring back the demand for risky assets, including the European currency. Do not forget about the more aggressive policy of the European Central Bank, which the bank's president Christine Lagarde can tell us about again today - her speech is scheduled for the evening. An important task of the bulls for the American session will be to protect the support of 1.0990, which acted as resistance in the morning. In the case of a decline in the pair, only a false breakdown at 1.0990 forms the first entry point into long positions in the expectation of continuing growth further to the next resistance of 1.1041. To see a larger upward movement in EUR/USD, active actions and a breakthrough of this range are needed, as well as rather weak data on the US producer price index and the Empire Manufacturing manufacturing index. A top-down test of 1.1041 will give a signal to buy the euro and open up the possibility of recovery to the areas of 1.1104 and 1.1165, where I recommend fixing the profits. If negotiations fail and the conflict worsens, the demand for the US dollar can quickly return. Considering that the recent meeting of the representatives of the two countries did not yield any results, it is not necessary to expect a serious breakthrough from these negotiations either. If there are no bulls at 1.0990, and, as we can see on the chart, there is no particular desire to increase long positions from this level - the optimal scenario for buying will be a false breakdown of the minimum in the area of 1.0934, just above which the moving averages playing on the side of the bulls pass. It is possible to open long positions on the euro immediately for a rebound only from 1.0875 with the aim of an upward correction of 30-35 points within a day. To open short positions on EURUSD, you need: The bears did not defend the morning resistance of 1.0990, and now their main goal will be to return this range under their control. As I noted, as long as trading is conducted above 1.0990, euro buyers will have a chance of growth, so a return of EUR/USD back is critically necessary. In case of a decline below 1.0990 and a reverse test from the bottom up, the bears will receive an excellent signal to enter the market, which will lead to a sell signal and the opening of new short positions to reduce to the morning support of 1.0934. The breakdown of this area against the background of strong US data can take place very quickly - this is an additional signal to open short positions already with the prospect of falling to the lows of 1.0875 and 1.0810. The downward movement will be fast since a large number of buyers' stop orders are concentrated at these levels. The farthest target will be the 1.0772 area, where I recommend fixing the profits. However, only news from the Fed, or aggravation of geopolitical tensions and failed negotiations will lead to such a large sell-off. In the case of a rising euro, it is best not to rush into sales. The bulls may start acting more aggressively in the expectation of continuing the correction. Therefore, the optimal scenario will be short positions when forming a false breakdown in the area of 1.1041. You can sell EUR/USD immediately for a rebound from 1.1104, or even higher - around 1.1165 with the aim of a downward correction of 25-30 points.
The COT report (Commitment of Traders) for March 8 recorded an increase in both long and short positions. It is not surprising that against the background of Russia's military special operation on the territory of Ukraine, there were more sellers, which led to a reduction in the positive delta. However, it is surprising that in the conditions of a major fall in the euro, buyers have not capitulated, but continue to actively increase long positions, taking advantage of attractive prices. Last week, a meeting of the European Central Bank was held, where the regulator's policy became clearer. It also adds confidence to buyers of risky assets in the current difficult geopolitical conditions. Let me remind you that Christine Lagarde announced plans to more aggressively curtail measures to support the economy and raise interest rates - a strong bullish medium-term signal for euro buyers. But do not forget that this week we will have a meeting of the Federal Reserve System and how the American regulator will behave in the conditions of the highest inflation in the last 40 years is a big question. We also remember that although Russia and Ukraine have sat down at the negotiating table, so far these meetings do not give any special results. Against this background, I recommend continuing to buy the dollar, since the bearish trend for the EUR/ USD pair has not gone away. The COT report indicates that long non-commercial positions increased from the level of 228,385 to the level of 242,683, while short non-commercial positions increased from the level of 163,446 to 183,839. At the end of the week, the total non-commercial net position decreased to 58,844 against 64,939. The weekly closing price fell from 1.1214 to 1.0866. Signals of indicators: Moving averages Trading is conducted above the 30 and 50 daily moving averages, which indicates active purchases of the euro in the short term. Note. The period and prices of moving averages are considered by the author on the hourly chart H1 and differ from the general definition of the classic daily moving averages on the daily chart D1. Bollinger Bands A breakthrough of the lower limit of the indicator in the area of 1.0934 will increase pressure on the euro. A breakthrough of the upper limit of the indicator in the area of 1.1010 will lead to a new wave of growth of the pair. Description of indicators
|
| Video market update for March 15,,2022 Posted: 15 Mar 2022 04:43 AM PDT Watch for buying opportunities on GBP.... The material has been provided by InstaForex Company - www.instaforex.com |
| USD/CAD Analysis and Trading Plan Posted: 15 Mar 2022 04:35 AM PDT American stock indices are falling, oil prices are falling, and with them the quotes of commodity currencies. Oil prices, in turn, are falling on reports that the U.S. may ease sanctions on Venezuelan oil supplies and on investors' hopes for a truce between Russia and Ukraine, which could help lift some of the West's sanctions against Russia. Oil quotes also came under pressure on reports from China, where authorities in Shenzhen province imposed a lockdown amid an increase in the number of new cases of coronavirus. This, in turn, raises investors' doubts about the sustainability of oil demand in this country with the largest economy in the world. Meanwhile, the expected beginning of the normalization of the Fed's monetary policy is causing the dollar to strengthen. According to data released last week, inflation in the United States reached a new high in 40 years: the consumer price index in February rose from 0.6% to 0.8%, and in annual terms - from 7.5% to 7.9%. Economists' forecasts suggest that at the meeting, which begins today, Fed officials will raise interest rates by 0.25%, which will begin a cycle of tightening monetary policy of the U.S. Central Bank. In recent comments, Fed Chairman Jerome Powell noted the possibility of multiple rate hikes this year, given rising inflation. At the same time, if back in February the markets were expecting 6 or 7 interest rate hikes in the U.S., now these expectations have dropped significantly. Many market participants and economists believe that the Fed is unlikely to signal its intention to raise rates by 50 basis points further, although it will not consider the possibility of not tightening the policy. They expect Fed officials to signal five rate hikes this year, while not fast enough real wage growth and falling incomes will force the central bank to pause after July. However, this is not yet reflected in the dollar, which continues to strengthen, especially, as we noted above, in relation to major commodity currencies such as the Australian, New Zealand, Canadian dollars. Regarding the latter, it is worth noting that tomorrow (at 12:30 GMT) fresh consumer price indices in Canada will be published. Core Consumer Price Index (Core CPI) from the Bank of Canada reflects the dynamics of retail prices of the corresponding basket of goods and services (excluding fruits, vegetables, gasoline, fuel oil, natural gas, mortgage interest, intercity transportation and tobacco products). The inflation target for the Bank of Canada is in the range of 1%-3%. The rising CPI is a harbinger of a rate hike and positive for the CAD. The core consumer price index rose in January 2022 by 0.8% (+4.3% in annual terms). Another increase in Core CPI is expected in February (by +0.6% and +4.8% in annual terms). Noticeable support for the Canadian dollar at the end of the last trading week was provided by the published report on the Canadian labor market for February. The number of employees rose sharply, by 336,600 after falling by 200,100 last month, although economists expected an increase of only 160,000. The unemployment rate fell by 1%, to 5.5%, while market forecasts suggested a decline to only 6.2%. The average hourly wage increased by 3.3% from the previous growth of 2.4%. The Bank of Canada may follow more aggressive rate hike tactics, based on the February inflation report, which will be released on Wednesday, after a strong report on the labor market. This is a strengthening factor for CAD. If the expected data on inflation in Canada turns out to be better than the forecast, then this is likely to provide additional support to the Canadian dollar and will contribute to the decline in USD/CAD. Although this decline will be short-lived, given the subsequent publication of the Fed's decision on rates at 18:00 GMT. The Fed's 0.25% rate hike is already largely priced in USD quotes. Of greatest interest will be the Fed's press conference, which will begin at 18:30 GMT. Market participants want to hear from Fed Chairman Powell his opinion on the future plans of the Central Bank. The Fed's report with forecasts for inflation and economic growth for the next two years and, equally important, the individual opinions of FOMC members on interest rates will also be of interest. A more hawkish stance on monetary policy is viewed as positive and strengthens the U.S. dollar, while a more cautious stance can be seen as indecision and will negatively affect the USD. Technical analysis and trading recommendations
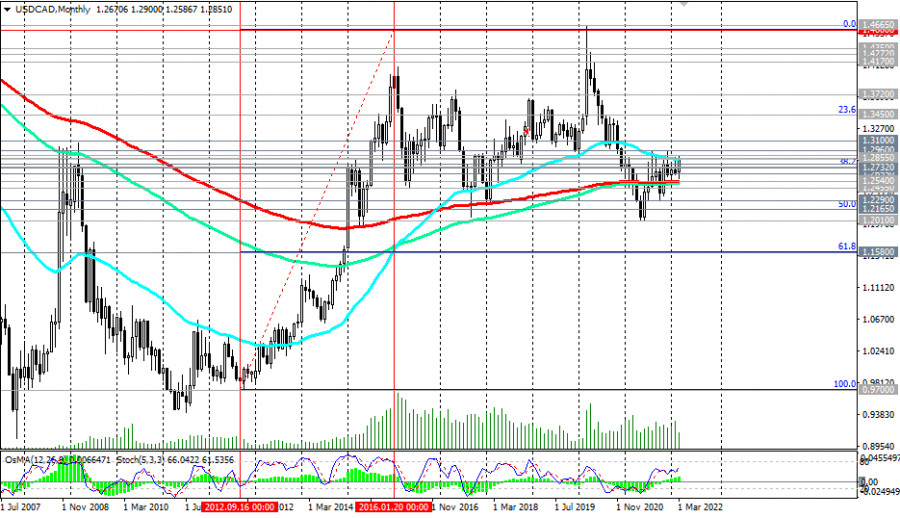
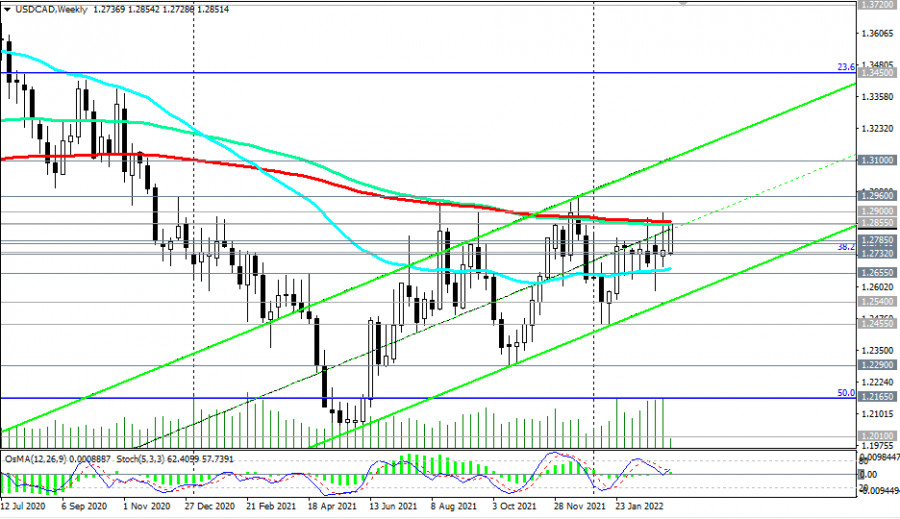
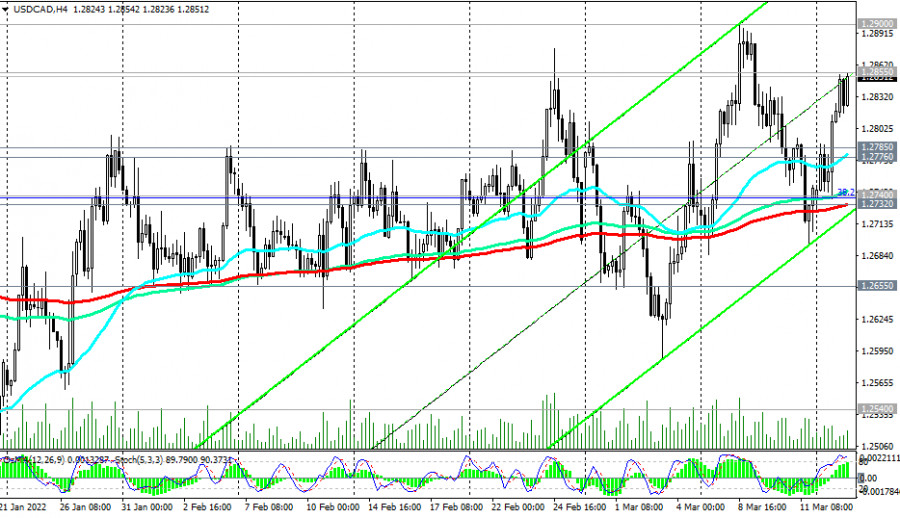
As for the USD/CAD pair, it is growing today for the second day in a row after a 3-day decline the day before. The fall of USD/CAD stopped last Friday in the zone of support levels 1.2732 (200 EMA on the 4-hour chart), 1.2740 (the 38.2% Fibonacci level retracement in the wave of USD/CAD growth from the level of 0.9700 to the level of 1.4600).
If we consider the current USD/CAD growth as corrective, then the pair has reached the maximum of corrective growth, having encountered strong resistance near the key level of 1.2855 (200 EMA on the weekly chart and 50 EMA on the monthly chart). Therefore, a reversal and resumption of decline is possible in the zone of this resistance level.
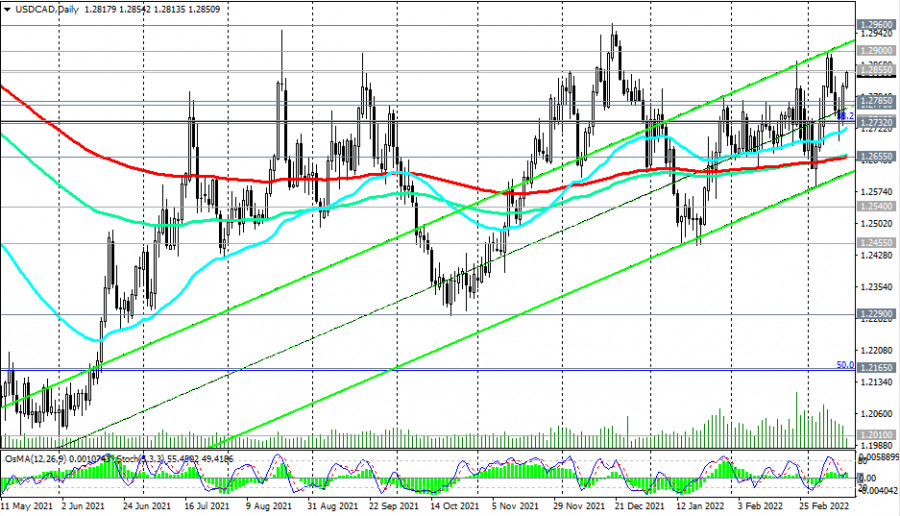
If you look at the daily and weekly charts of USD/CAD, you can see that the pair is developing upward dynamics, moving within the ascending channels. The upper limit of the channel on the weekly USD/CAD chart passes near the 1.3100 mark, which will become the nearest target for USD/CAD growth after the breakdown of the zone of strong resistance levels 1.2855, 1.2900, 1.2960.
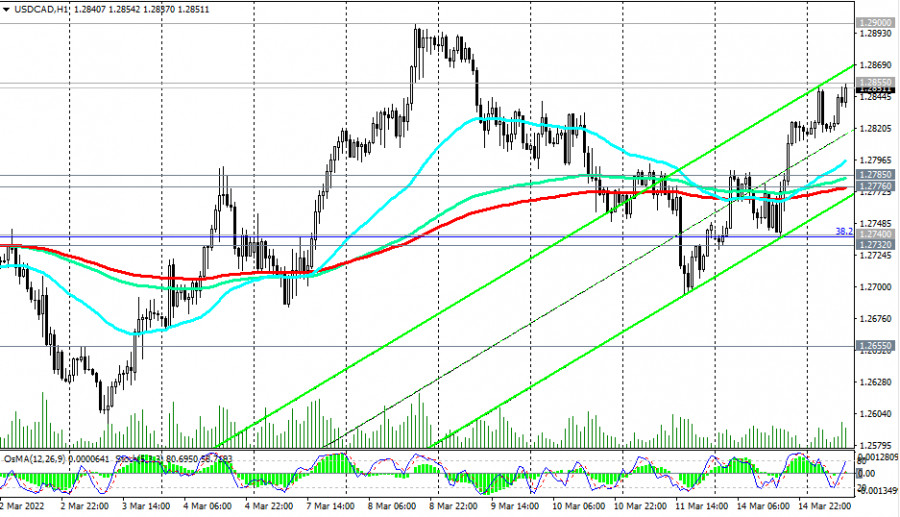
We stick to the USD/ CAD growth scenario towards a more distant target and the resistance level of 1.3450 (23.6% Fibonacci level). In an alternative scenario, the first signal for the resumption of short positions will be a breakdown of the local support level 1.2810, and the confirming one will be a breakdown of support levels 1.2785 (local support level), 1.2776 (200 EMA on the 1-hour chart).
The breakdown of the long-term support level 1.2655 significantly increases the risks of USD/CAD returning to the long-term bearish trend. Support levels: 1.2785, 1.2776, 1.2740, 1.2732, 1.2655, 1.2625, 1.2540, 1.2455, 1.2290, 1.2165 Resistance levels: 1.2855, 1.2900, 1.2960, 1.3100, 1.3450 Trading recommendations USD/CAD: Sell Stop 1.2805. Stop-Loss 1.2865. Take-Profit 1.2785, 1.2776, 1.2740, 1.2732, 1.2655, 1.2625, 1.2540, 1.2455, 1.2290, 1.2165 Buy Stop 1.2865. Stop-Loss 1.2805. Take-Profit 1.2900, 1.2960, 1.3100, 1.3450 The material has been provided by InstaForex Company - www.instaforex.com |
| Gold stands to be primary beneficiary Posted: 15 Mar 2022 04:31 AM PDT
The gold market is facing a dark period. Prices have already fallen for three consecutive trades. However, there is a view that this is a short-term pullback. Bullion will be in a bullish trend for the rest of the year, Bloomberg forecasts. The closer the big day comes, when the Fed is due to announce its first interest rate hike in four years, the lower the value of gold falls. Yesterday, gold was down 1.2%, or $24.20. The yellow asset was trading at $1,960.80 at the close of the session.
The US regulator's two-day monetary policy meeting starts today. The US central bank is expected to announce tomorrow how much it will raise interest rates this month. Markets are now expecting the Fed to raise rates by 25bp in the first stage. There could be a total of five to seven rate hikes before the end of the year. The prospect of higher rates reduces demand for the precious metal, which does not generate any income, unlike government bonds. On Monday, the yield on 10-year US bonds exceeded 2.12%, reaching the highest level since July 2019. The bullion also came under pressure from a sharp collapse in the price of oil. Quotes slipped below $100 a barrel on March 14. Brent and WTI futures fell by 8% over the day. The fall in oil prices is linked to signs of de-escalation in the Russo-Ukrainian conflict. The fourth round of talks between the conflicting sides took place yesterday. Against this backdrop, risky sentiment has returned to investors, which has reduced the attractiveness of safe haven assets, including gold. Nevertheless, many experts believe that the current decline in the value of the precious metal is a short-term phenomenon. And some of them expect an upward reversal immediately after the Fed announces a rate hike. With both geopolitical and inflation risks intensifying at the same time, more and more analysts are inclined to believe that a Fed rate hike is not a serious obstacle to gold prices this year. If the US regulator subsequently decides to tighten its monetary policy more aggressively, it could damage financial markets and increase the risk of recession. The crisis scenario is seen as a win-win for the precious metal. At the same time, too slow a Fed response to soaring inflation could lead to even more uncontrolled price rises. This is also positive for the asset, which is a classic hedge against inflationary pressures. Bloomberg analyst Mike McGlone is confident that soaring prices will lead to a significant rise in gold prices in the coming months. Also, a steady bullish trend in the precious metal market will be supported by the threat of a recession. Gold stands to be a primary beneficiary, potentially along with US Treasury long bonds and Bitcoin," McGlone said. "We view the metal as a leading potential 2022 end-game performer, notably when commodities priced for supply shocks succumb to inevitable demand destruction," he added. McGlone believes that by the end of the year, demand for oil will have fallen sharply and it will be trading at $50, while the value of the precious metal will set a new record. McGlone drew parallels between 2022 and 2008, which spurred an enduring gold bull market and a bear market for crude oil. He described the war in Ukraine as a catalyst that will accelerate the process of greener technologies replacing fossil fuels. The analyst believes that in the long term, the $2,000 mark, which has been seen as a strong resistance for gold over the past 2 years, is likely to become a steady support level. By the end of the year, M. McGlone expects the metal price to be around $2,500 per ounce. The material has been provided by InstaForex Company - www.instaforex.com |

| You are subscribed to email updates from Forex analysis review. To stop receiving these emails, you may unsubscribe now. | Email delivery powered by Google |
| Google, 1600 Amphitheatre Parkway, Mountain View, CA 94043, United States | |


Comments