Forex analysis review
Forex analysis review |
- Trading plan for GBP/USD on March 9, 2022
- Trading plan for EUR/USD on March 9, 2022
- AUD/USD back in sellers territory
- Simple trading tips for beginning traders. Outlook for GBP/USD on March 9.
- Europe vs North America: how difference in investment strategies affects BTC
- Elliott wave analysis of Gold for March 9, 2022
- Elliott wave analysis of Gold for March 9, 2022
- Forecast for EUR/USD on March 9, 2022
- Trading signals for GBP/USD on March 9-10, 2022: buy above 1.3122 (-1/8 Murray - symmetrical triangle )
- Forecast for GBP/USD on March 9, 2022
- Forecast for AUD/USD on March 9, 2022
- USDCHF, Potential For Reversal | 8th March
- USDJPY, Potential For Bullish Continuation | 9th Mar 2022
- ETHUSD, Bearish Pressure | 9th March 022
- US stocks closed lower, Dow Jones down 0.56%
- Trading signals for GOLD (XAU/USD) on March 9-10, 2022: buy above $2,027 (21 SMA)
- Forecast for USD/JPY on March 9, 2022
- Overview of the EUR/USD pair. March 9. The European currency asks for a timeout.Overview of the EUR/USD pair. March 9. The
- Forecast and trading signals for GBP/USD on March 9. COT report. Detailed analysis of the pair's movement and trade deals.
- Forecast and trading signals for EUR/USD on March 9. COT report. Detailed analysis of the pair's movement and trade deals.
- How to trade the GBP/USD currency pair on March 9? Simple tips and analysis of deals for beginners.
- Trading plan for US dollar index for March 09, 2022
- Trading plan for Bitcoin for March 09, 2022
- Trading plan for EURUSD for March 09, 2022
- Bitcoin analysis for March 8, 2022.
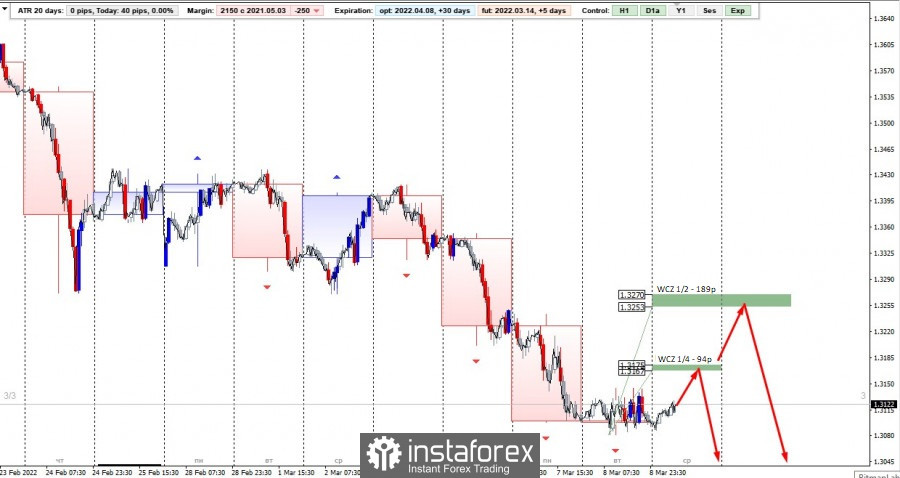
| Trading plan for GBP/USD on March 9, 2022 Posted: 08 Mar 2022 11:05 PM PST Inexperienced traders try to find reversal patterns in strong impulse movements, while experienced players do not resist the main movement and trade in its direction. This allows you to minimize the risks. Reversal patterns after strong impulses take a very long time, and the probability of updating the lows is always above 80%. The nearest resistance is WCZ 1/4 1.3175-1.3167. A test of this zone can be used to find a sell pattern. The main resistance will be the WCZ 1/2 1.3270-1.3253, which will also require work to find a model to enter a short position.
The daily candle formed on March 7 is impulsive, so any upward movement within its boundaries is a correction. The probability of updating yesterday's low is 80% in the short term. The material has been provided by InstaForex Company - www.instaforex.com |
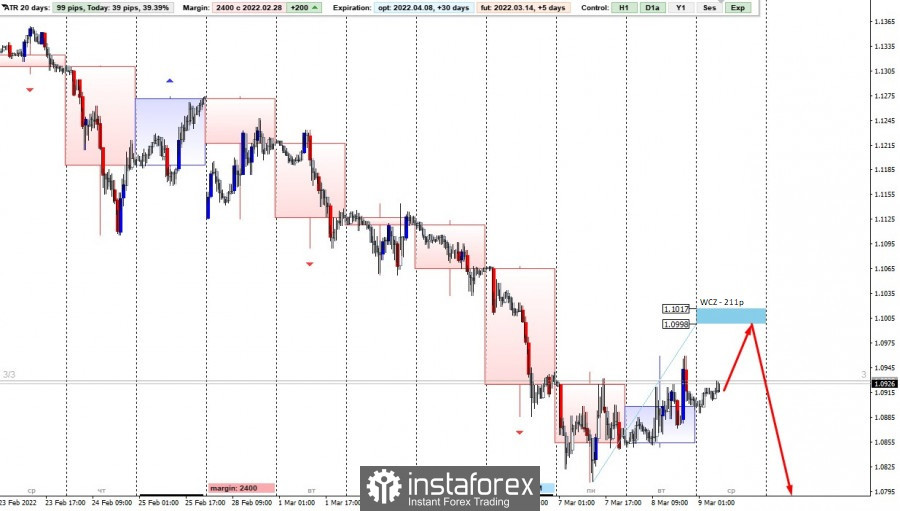
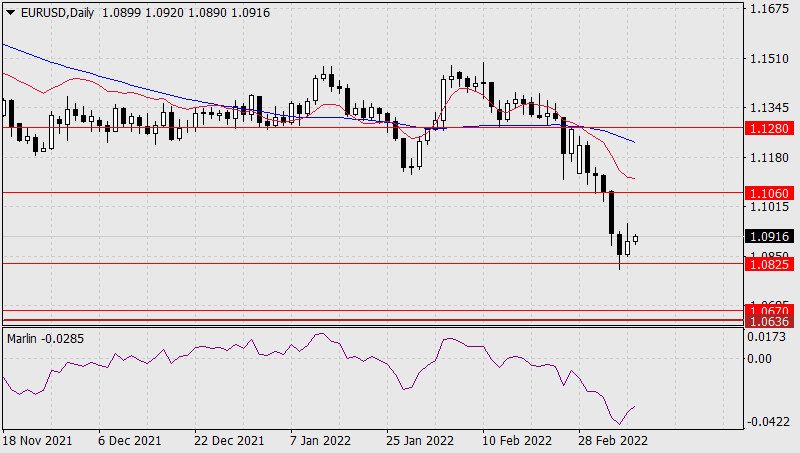
| Trading plan for EUR/USD on March 9, 2022 Posted: 08 Mar 2022 10:53 PM PST A strong downward momentum on the EURUSD pair has been going on for a long time. The question arises, what correction levels can be expected to sell this pair? The first significant resistance is the Weekly Control Zone 1.1017-1.1.0998. While the pair is trading below this zone, it is necessary to concentrate on finding a pattern to sell the instrument. A test of the specified zone will give the most favorable prices for entering a short position. Due to the strong pressure of the current situation, a reversal bearish pattern may form after a false breakout of yesterday's high.
It is important to understand that such a strong bearish momentum cannot be broken in a short time and the transition to a new phase will take quite a long time. This may take one to three months. In this regard, the search for purchases at this stage is not profitable. The material has been provided by InstaForex Company - www.instaforex.com |
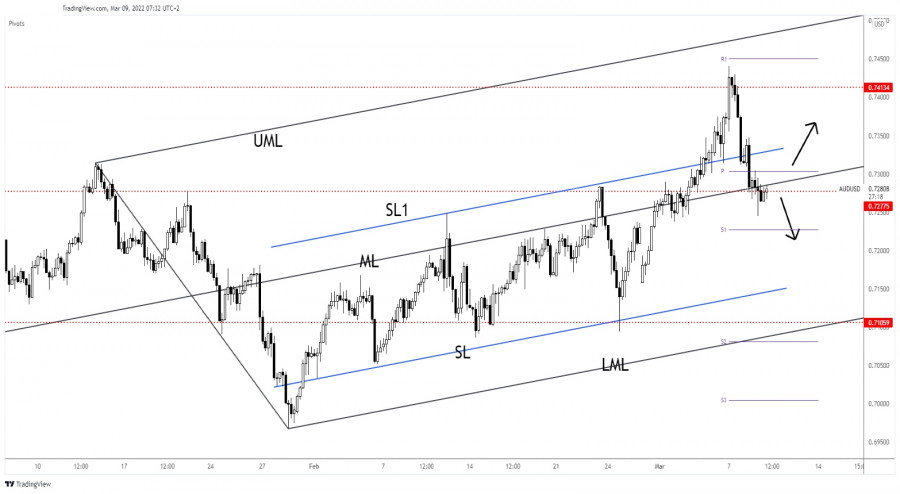
| AUD/USD back in sellers territory Posted: 08 Mar 2022 10:24 PM PST The AUD/USD pair is trading in the green at 0.7281 level at the time of writing but the downside pressure remains high. The pair is trying to rebound as the Dollar Index has retreated a little. After its amazing sell-off, a temporary rebound is natural. It could test and retest near-term broken obstacles before resuming its drop. Fundamentally, the Aussie received a hit from the Australian Westpac Consumer Sentiment which registered a 4.2% drop more versus a 1.3% drop in the previous reporting period. On the other hand, the AUD could still try to rebound as the Chinese CPI rose 0.9% matching expectations, while the PPI registered an 8.8% growth beating the 8.5% expected. Later today, the JOLTS Job Openings indicator is expected at 10.96M in January versus 10.93M in the previous reporting period. AUD/USD Validates Its Breakdown!
Technically, the currency pair found resistance right above the 0.7413 key level. After that, it has registered a strong sell-off. Now, it's located below the ascending pitchfork's median line (ML) and under the weekly pivot point of 0.7303. In the short term, AUD/USD could test and retest these levels before dropping deeper. Stabilizing below the ML may signal more declines. Only coming back and stabilizing above the median line (ML) and above the weekly pivot point could really announce that AUD/USD could come back higher. AUD/USD Forecast!Testing and retesting the 0.73 psychological level and the median line (ML), registering only false breakouts could confirm a deeper drop and could bring new short opportunities. A temporary rebound could help the sellers to catch a new bearish movement. The material has been provided by InstaForex Company - www.instaforex.com |
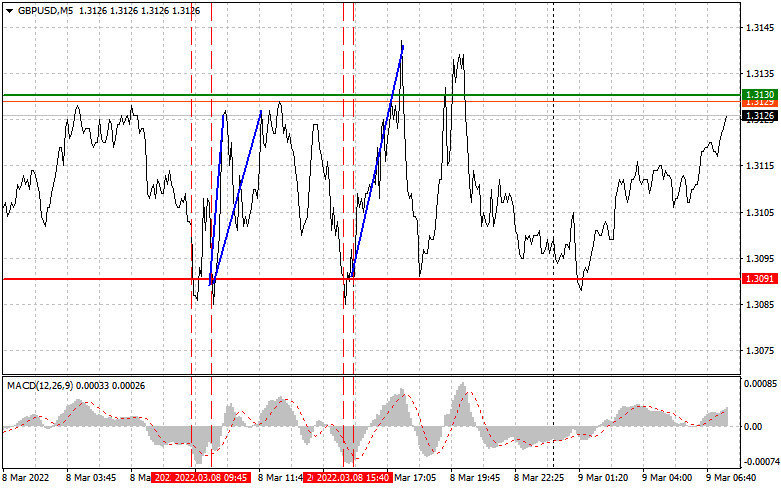
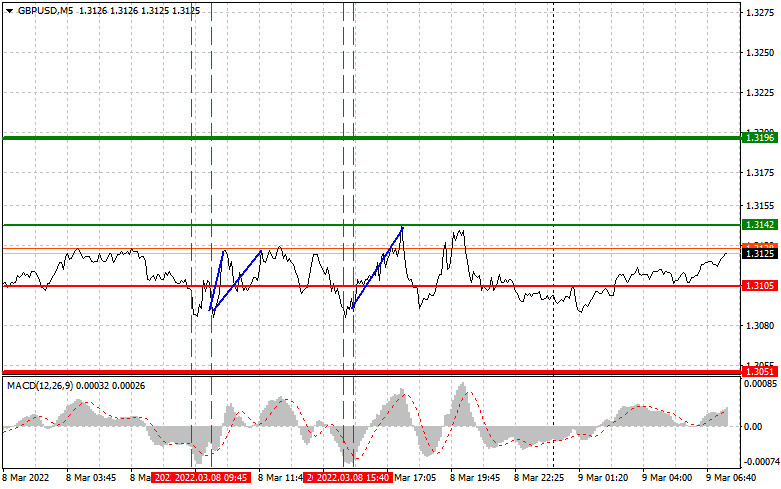
| Simple trading tips for beginning traders. Outlook for GBP/USD on March 9. Posted: 08 Mar 2022 09:57 PM PST Analysis of GBP/USD The pound/dollar pair tested 1.3091 when the MACD indicator was far from the zero level, thus capping the downward momentum. It was not a good idea to sell the pound sterling. Some time later, the pair once again tested the mentioned level. At that time, the MACD indicator was in the overbought area and was starting to recover, thus forming a buy signal according to scenario 2. As a result, the pair increased by 35 pips. In the second part of the day, the indicator formed the same signal from 1.3091. The pair climbed by 50 pips.
Positive news on the situation in Ukraine caused a rise in risky assets. In an interview on ABC News, Ukraine President Volodymyr Zelensky said that he was open to compromise on the status of Crimea and the Donbass. He also criticized NATO. "I have cooled down regarding this question a long time ago after we understood that ... NATO is not prepared to accept Ukraine," Zelensky said in the interview. The pound sterling grew amid the announcement. However, a lot depends on the actions of the UK's regulator. The Bank of England is trying to limit the surging inflation that is destroying the UK economy. In fact, the BOE may face even severe problems since energy prices have almost hit their all-time highs. In the first part of the day, the macroeconomic calendar is not rich in events. That is why trades will follow the situation in Ukraine. The second part of the day is also expected to be calm. Data on job openings and US crude oil inventories will hardly support the US dollar or push down the pound sterling. That is why traders will focus only on news from Ukraine and negotiations between the parties. Signals to buy GBP Scenario 1: today, it is possible to buy the pound sterling at 1.3142 (a green line) with the target of 1.3196 (a thicker green line). At the level of 1.3196, it is possible to open sell orders, expecting a decline of 15-20 pips. The British pound will hardly gain in value in the first part of the day. Only a break of 1.3142 may force speculators to close short positions. Importantly, before opening buy orders, make sure that the MACD indicator is above the zero level and is starting climbing from it. Scenario 2: it is also possible to buy the pound sterling when the price touches 1.3105. At that moment, the MACD indicator should be in the oversold area that may cap the pair's potential and cause the market reversal. The price may increase to 1.3142 and 1.3196. Signals to sell GBP Scenario 1: today, it is possible to sell the pound sterling after the price tests the 1.3105 (a red line), thus causing a decline. The key target is located at 1.3051. There, it is recommended to close sell orders and open buy positions, expecting a rise of 15-20 pips. The pound sterling is likely to remain under pressure since tomorrow the US is going to disclose its inflation report. The data may cause mixed reactions, including a bullish signal for the greenback. It is better to follow scenario 2. Importantly, before selling the currency, make sure that the MACD indicator is below zero and is starting to decline from it. Scenario 2: today, it is also possible to sell the British pound when the price touches 1.3142. At this moment, the MACD indicator should be in the overbought area, thus limiting the pair's potential and causing the price reversal. The asset may drop to 1.3105 and 1.3051.
What we see on the trading charts: A thin green line is the entry price at which you can buy a trading instrument. A thick green line is the estimated price where you can place a take-profit order or lock in profits by yourself, since the price will hardly go above this level. A thin red line is the entry price at which you can sell the trading instrument. A thick red line is the estimated price where you can place a take-profit order or lock in profits by yourself, since the price is unlikely to decline further. The MACD indicator. When entering the market, it is important to take into account overbought and oversold zones. Beginning traders should be very cautious when making decisions to enter the market. It is better to open positions ahead of the publication of important reports in order to avoid price fluctuations. If you decide to enter the market amid the news release, place stop orders to minimize losses. Otherwise, you may lose all your funds, especially if you do not use money management and trade big volumes. Please remember that successful trading requires an accurate trading plan similar to the one described above. Knee-jerk decisions made amid the current market situation is a losing strategy of an intraday trader. The material has been provided by InstaForex Company - www.instaforex.com |
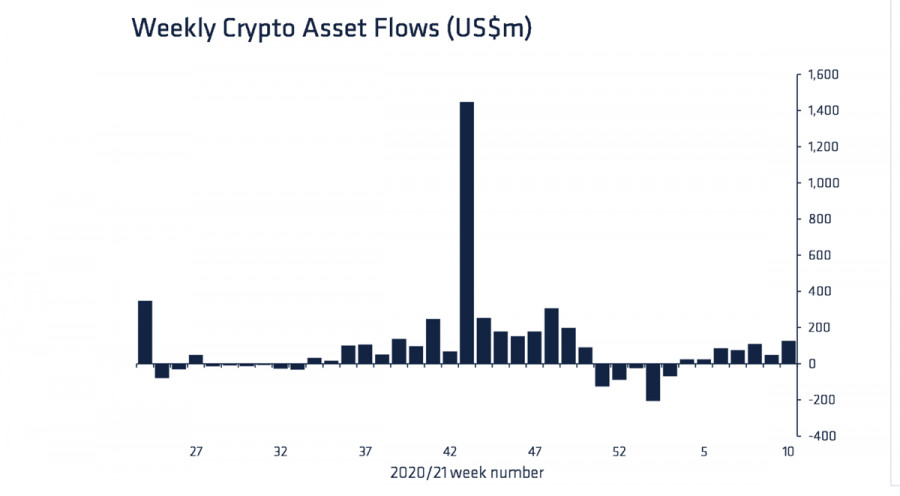
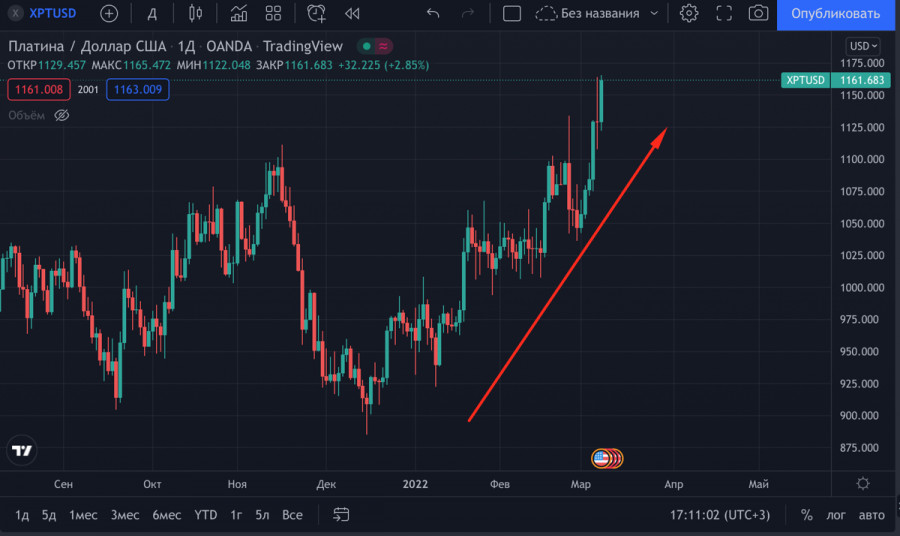
| Europe vs North America: how difference in investment strategies affects BTC Posted: 08 Mar 2022 09:11 PM PST The global stock market has experienced an unprecedented level of volatility over the past two weeks. Due to the Ukrainian crisis and sanctions against Russia, investment flows of capital have drastically changed. The crypto market is seriously harmed and its market capitalization barely reaches $1.7 trillion. A fall in bitcoin has started due to the unexpected bull run triggered by panicking investors in the wake of the military conflict. Despite all the scepticism, CoinShares, an analytical company, reported on inflows of capital into crypto products last week. Investors put in about $151 million in crypto-related projects. Digital-asset investment funds attracted $124 million. Bitcoin saw inflows of $95 million, the largest weekly inflow since 2021. Viewing flows on a geographical basis, North America saw inflows totalling $151 million, while Europe showed outflows of $24 million. In other words, the geopolitical situation seriously affects digital assets and bitcoin. It is worth noting that despite outflows of capital in Europe, the armed conflict in Ukraine has had a significant impact on the adoption of cryptos. In the US, senators insist on a reasonable distribution of cryptocurrency sanctions. In Europe, officials have a different stance and bet on the precious metals market. In addition, the record volume of investments in several products was recorded in 2022.
It is about hedging risks and redistributing investment flows that harm BTC and the crypto market as a whole. The European market is one of the key pillars of the coin's bullish rally along with inflows in North American. In the US, they express a keen interest in bitcoin and other cryptocurrencies. However, geopolitical factors will not allow the asset to maintain a long-term bullish movement. The US is actively imposing new sanctions, and banning Russian commodities will lead to fluctuations in the dollar.
The US Fed is highly likely to announce a rate hike at the next meeting. Due to the current global situation and the subsequent market volatility, the world's largest cryptocurrency may sustain significant losses. With this in mind, bitcoin's hedge properties will be levelled because of greater confidence in precious metals. Generally speaking, the geopolitical situation has a direct impact on the fundamental factors driving BTC up, which means the coin is unlikely to show long-term growth until the military conflict in Ukraine is over. What to expect from BTC in the coming months? The coin is moving within a wide range of $30K-$60K. This area could be divided into two narrow corridors: $45K-$57K and $32K-$45K. On March 8, BTC traded in the latter one.
The level of $45K serves as the mid-term resistance zone for the cryptocurrency. In case of a breakout there, the price may move towards the middle of the $45K-$56K range. The target is seen in the $40K-$42K area. Overall, investment activity and fundamental factors indicate that BTC will try to leave the $32K-$45K range in the coming months.
|
| Elliott wave analysis of Gold for March 9, 2022 Posted: 08 Mar 2022 08:55 PM PST
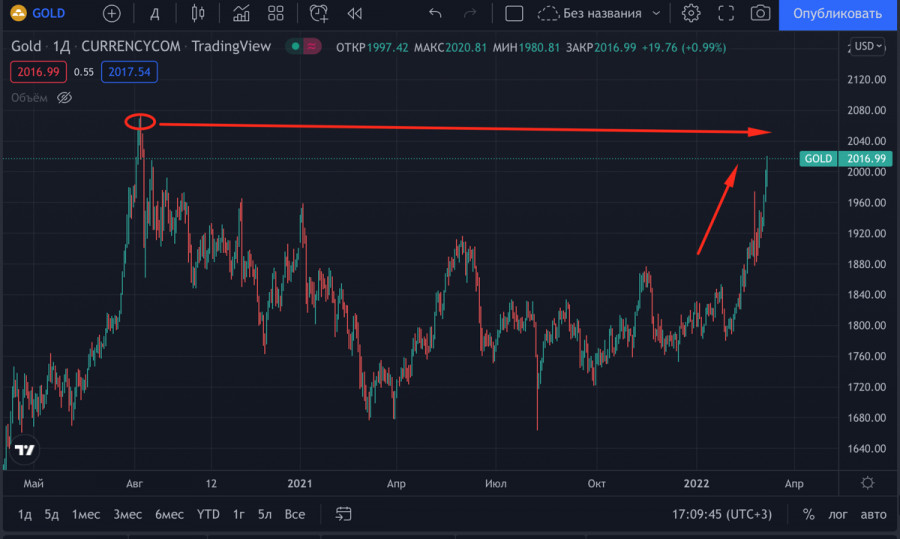
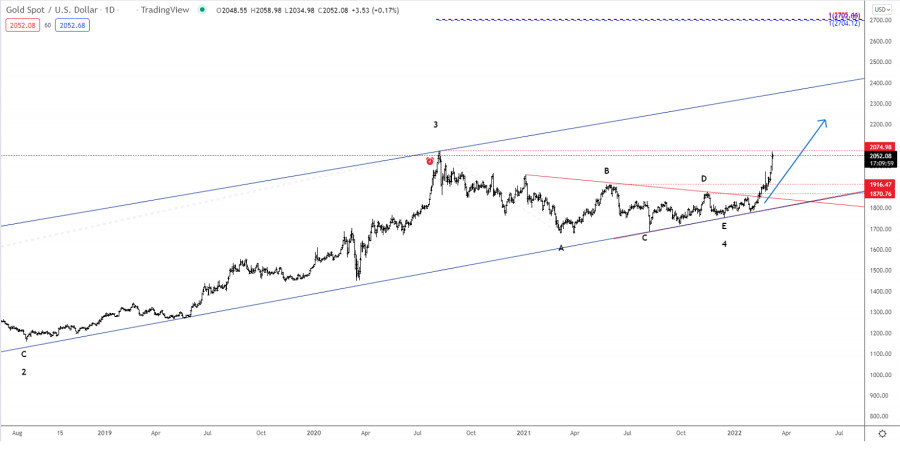
Gold is currently testing the former all-time high at 2,074. It should just be a matter of time before this resistance is broken for a continuation higher towards 2,400 and ultimately higher towards our long-term target at 2,700. Short-term we need to allow for some consolidation either just below the all-time high or just above the all-time high. If the consolidation takes place just below the all-time high at 2,074, we could see a correction towards 1,971 before the next rally higher towards 2,400 and 2,700. The material has been provided by InstaForex Company - www.instaforex.com |
| Elliott wave analysis of Gold for March 9, 2022 Posted: 08 Mar 2022 08:55 PM PST
Gold is currently testing the former all-time high at 2,074. It should just be a matter of time before this resistance is broken for a continuation higher towards 2,400 and ultimately higher towards our long-term target at 2,700. Short-term we need to allow for some consolidation either just below the all-time high or just above the all-time high. If the consolidation takes place just below the all-time high at 2,074, we could see a correction towards 1,971 before the next rally higher towards 2,400 and 2,700. The material has been provided by InstaForex Company - www.instaforex.com |
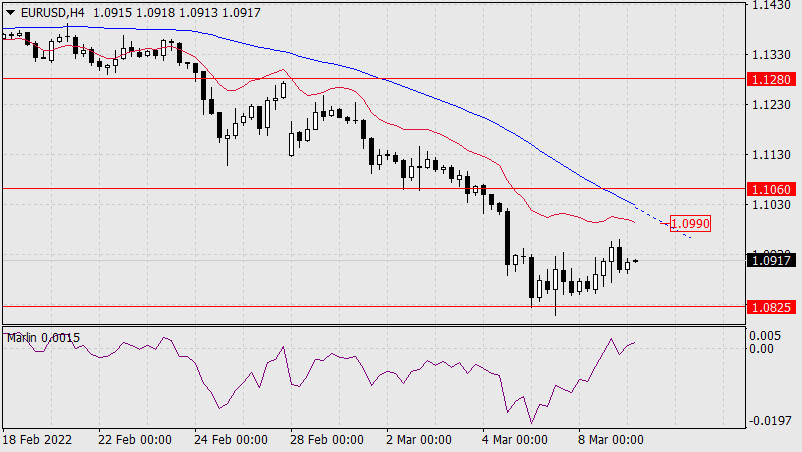
| Forecast for EUR/USD on March 9, 2022 Posted: 08 Mar 2022 08:38 PM PST EUR/USD rose by 45 pips on Tuesday because 1.0910 became weak amidst the current situation. However, the situation could change tomorrow as the ECB will announce its latest policy decision, and traders are unlikely to continue buying euro
The Marlin oscillator is in the positive area in the four-hour chart. The pair is heading towards the MACD line, near 1.0990. However, there could be a decline towards 1.0825 and 1.0636/70.
|
| Posted: 08 Mar 2022 08:28 PM PST
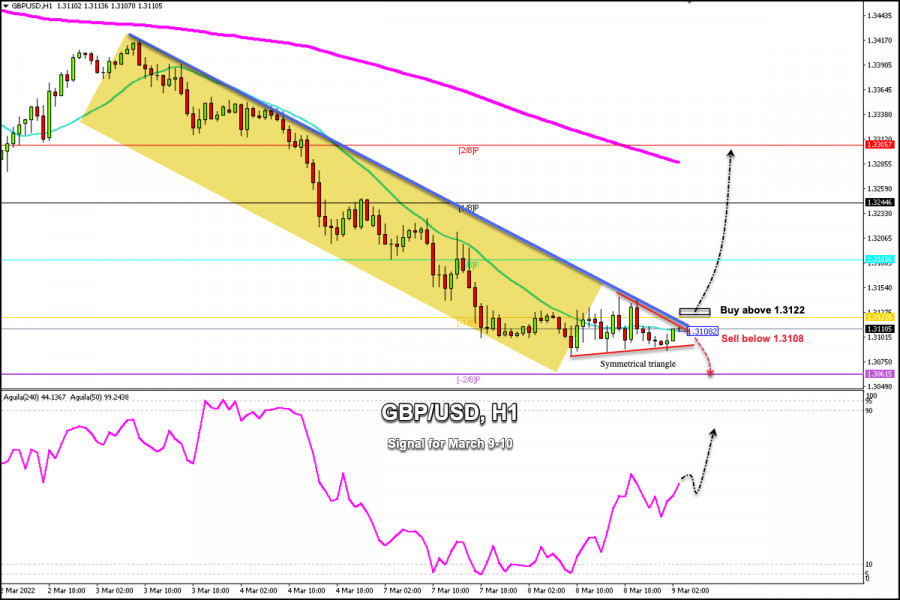
GBP/USD struggled to break the resistance zone of -1/8 Murray. Since the beginning of this week, the pound has been trading within a price range between 1.3082 -1.3140 against the US dollar. Its modest intraday bounce is capped below the top of the downtrend channel that was formed since March 3. The worsening of the situation in Ukraine makes investors take refuge in gold and the US dollar. This means that the British pound is under downward pressure as we can see in the chart above. Investors remain concerned about the economic fallout from the Russian invasion of Ukraine. In addition to this, recent very high gains in commodity prices have fueled fears of an inflationary shock to the world economy, increasing the risk of stagflation. The pair showed modest daily gains above 1.3100 in the early Asian session. Further losses are likely in the short term unless GBP bounces back and consolidates above 1.3122 (SMA 21). The uncertain outlook for the global economy and central bank policy make investors reassess their portfolios and the risks seem to be tilting towards further losses of GBP/USD. Even though the US economy is less vulnerable to the negative impact of the escalating Russia - Ukraine conflict, the US economy is still struggles with multi-decade high inflation. Next week, the FED is widely expected to increase its interest rates which could push down GBP/USD towards the level 1.2800. On the 1-hour chart, we can see the formation of a symmetrical triangle. A sharp break above this triangle and a sharp break of the downtrend channel could ease the pressure on the British pound and we could see a rally with targets towards 0 /8 Murray at 1.3183 and towards the 200 EMA at 1.3285. Our trading plan for the next few hours is to wait for a break above -1/8 Murray around 1.3122 to buy with targets at 1.3183, 1.3244 and up to 200 EMA at 1.3285. The material has been provided by InstaForex Company - www.instaforex.com |
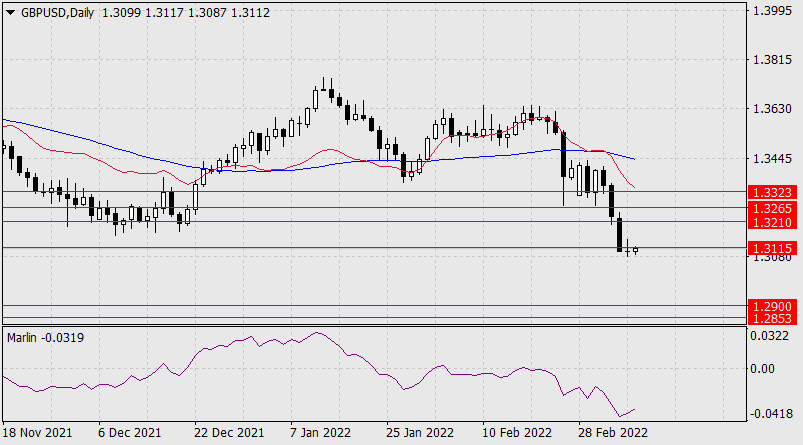
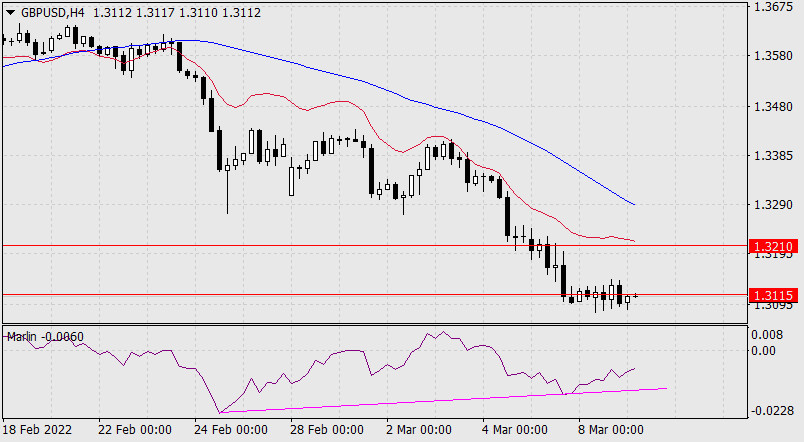
| Forecast for GBP/USD on March 9, 2022 Posted: 08 Mar 2022 08:25 PM PST Although volatility surged in GBP/USD on Tuesday, the quote halted below 1.3115, which is a sign that the pair is likely to move towards 1.2853-1.2900. But the Marlin Oscillator is still rising and has not left the oversold area yet. Perhaps, the sideways consolidation will extend for another day or two, allowing the oscillator to continue growing.
The H4 chart shows this sideways consolidation, but it is likely that the flat will end soon and the further decline of GBP/USD will begin.
|
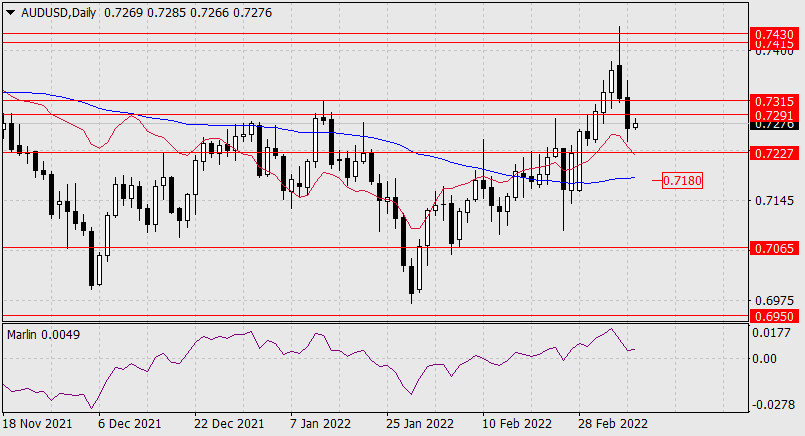
| Forecast for AUD/USD on March 9, 2022 Posted: 08 Mar 2022 07:49 PM PST AUD/USD fell under 0.7291-0.7315 on Tuesday. The Marlin oscillator turned down, but has not left the bullish trend yet. The pair is also above the red balance indicator line, which indicates the strength of 0.7227. Below it is the MACD line (0.7180), the breakdown of which will confirm the direction of the pair in the medium term. The growth of commodity markets prevents AUD from dipping lower.
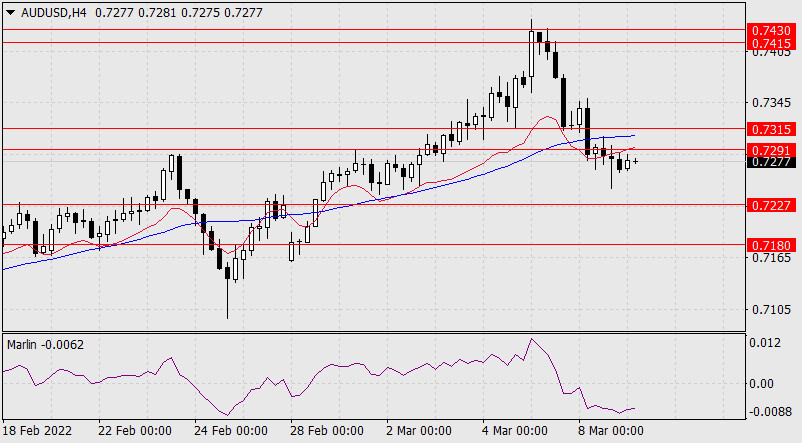
The pair is under the MACD and balance indicator lines in the four-hour chart. The Marlin oscillator is also in the negative area, which indicates that AUD/USD may attempt to overcome 0.7227.
|
| USDCHF, Potential For Reversal | 8th March Posted: 08 Mar 2022 07:45 PM PST
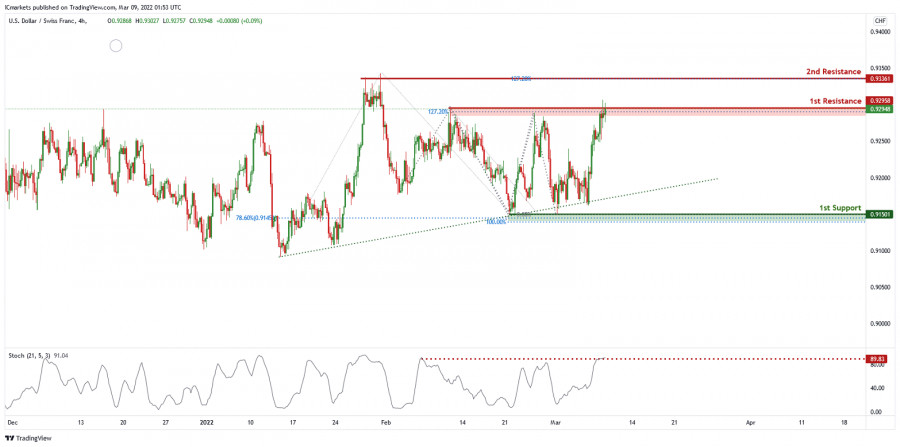
On the H4 , price is trading on an ascending trendline and near 1st resistance level of 0.92833 in line with 127.2% Fibonacci projection . Price can potentially dip to the 1st support of 0.91501 in line with 100% Fibonacci projection and 78.6% Fibonacci retracement. Our bearish bias is supported by the stochastic indicator as it is at resistance level. Alternatively, price can rally to the 2nd resistance level of 0.93361 in line with 127.2% Fibonacci projection. Trading Recommendation Entry: 0.92958 Reason for Entry: 61.8% Fibonacci retracement and 127.2% Fibonacci projection , graphical swing high Take Profit: : 0.91501 Reason for Take Profit: 78.6% Fibonacci retracement , 100% Fibonacci projection, Graphical swing low Stop Loss: 0.93361 Reason for Stop Loss: Graphical overlap resistance The material has been provided by InstaForex Company - www.instaforex.com |
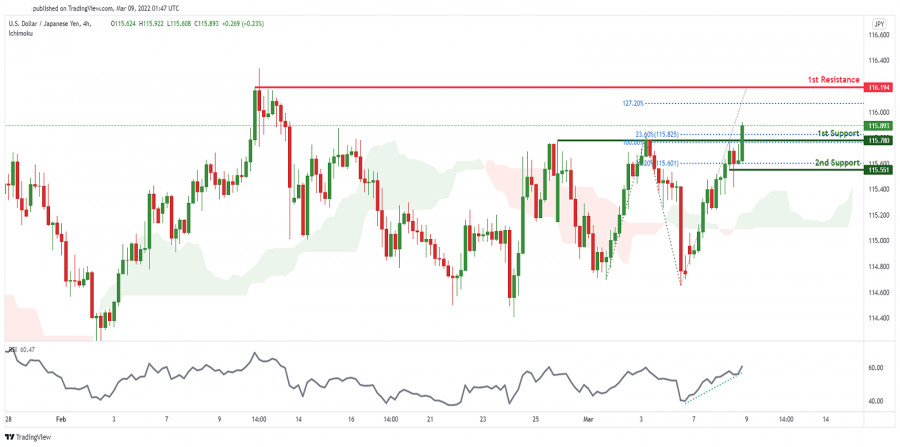
| USDJPY, Potential For Bullish Continuation | 9th Mar 2022 Posted: 08 Mar 2022 07:39 PM PST
On the H4 timeframe, prices are on bullish momentum. We see the potential for further bullish momentum from our 1st support at 115.780 in line with 23.6% Fibonacci retracement and 100% Fibonacci extension towards our 1st resistance at 116.194 in line with 127.2% Fibonacci extension. Our bullish bias is further supported by prices trading above our ichimoku cloud support and also RSI being on bullish momentum. Alternatively, prices may dip towards our 2nd support at 115.551 in line with 38.2% Fibonacci retracement. Trading Recommendation Entry: 115.780 Reason for Entry: 23.6% Fibonacci retracement and 100% Fibonacci extensionTake Profit: 116.194 Reason for Take Profit: 127.2% Fibonacci extension Stop Loss: 115.551 Reason for Stop Loss: 38.2% Fibonacci retracement The material has been provided by InstaForex Company - www.instaforex.com |
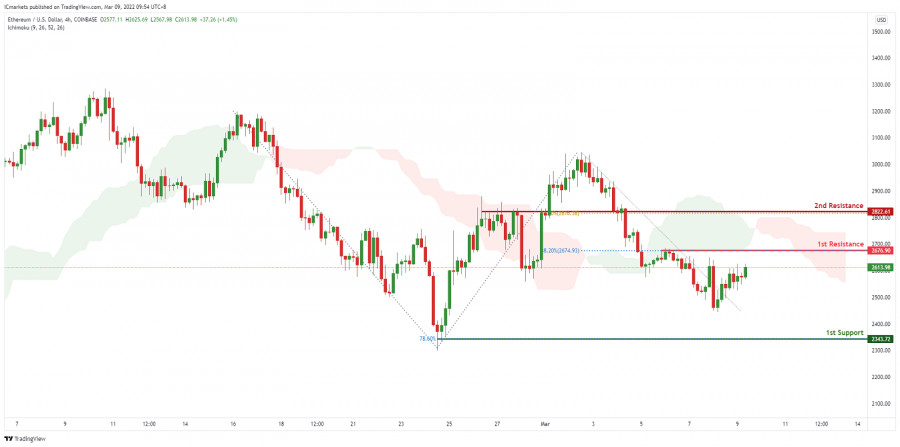
| ETHUSD, Bearish Pressure | 9th March 022 Posted: 08 Mar 2022 07:37 PM PST
On the H4,with price moving below the Ichimoku cloud, we have a bearish bias that price will drop to our 1st support at 2343 in line with the 78.6% Fibonacci retracement and horizontal overlap support from our 1st resistance at 2676 in line with the horizontal swing high resistance and 38.2% Fibonacci retracement. Alternatively, price may break 1st resistance and head for 2nd resistance at 2822 in line with the horizontal overlap resistance and 61.8% Fibonacci retracement. Trading Recommendation Entry: 2676 Reason for Entry: Horizontal swing high resistance and 38.2% Fibonacci retracement Take Profit: 2343 Reason for Take Profit: Horizontal overlap support and 78.6% Fibonacci retracement Stop Loss: 2822 Reason for Stop Loss:Horizontal overlap resistance and 61.8% Fibonacci retracement The material has been provided by InstaForex Company - www.instaforex.com |
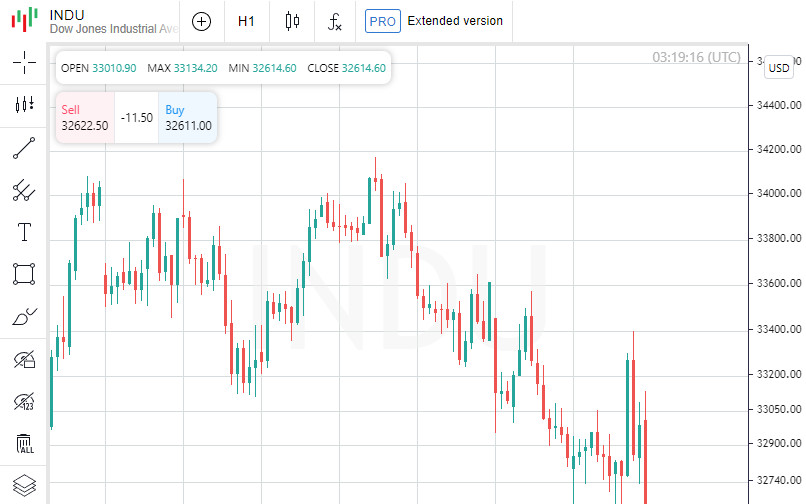
| US stocks closed lower, Dow Jones down 0.56% Posted: 08 Mar 2022 07:20 PM PST
At the close on the New York Stock Exchange, the Dow Jones fell 0.56% to a 6-month low, the S&P 500 index fell 0.73%, and the NASDAQ Composite index fell 0.28%. Caterpillar Inc was the top performer among the components of the Dow Jones index today, up 13.30 points or 6.76% to close at 210.00. Chevron Corp rose 8.49 points or 5.24% to close at 170.53. Boeing Co rose 4.63 points or 2.74% to close at 173.80. Shares of Coca-Cola Co were the leaders of the fall, the price of which fell by 2.42 points (3.96%), ending the session at 58.66. Procter & Gamble Company rose 3.96% or 6.05 points to close at 146.79 while UnitedHealth Group Incorporated shed 2.75% or 13.41 points to close at 473.46. Leading gainers among the S&P 500 index components in today's trading were Enphase Energy Inc, which rose 10.82% to 175.99, SolarEdge Technologies Inc, which gained 10.41% to close at 328.91, and also shares of Quanta Services Inc, which rose 8.17% to close the session at 116.83. The biggest losers were Seagate Technology PLC, which shed 9.51% to close at 90.57. Shares of ConAgra Foods Inc shed 8.22% to end the session at 30.93. Quotes of Intuitive Surgical Inc decreased in price by 7.98% to 269.32. Leading gainers among the components of the NASDAQ Composite in today's trading were Hycroft Mining Holding Corporation, which rose 203.31% to 1.00, Kala Pharmaceuticals Inc, which gained 88.49% to close at 1.15. as well as shares of Westport Fuel Systems Inc, which rose 52.63% to end the session at 2.03. The drop leaders were shares of Imperial Petroleum Inc, which fell 43.33% to close at 4.25. Shares of Inspirato Inc lost 42.78% to end the session at 15.25. Quotes of Digital Brands Group Inc decreased in price by 30.61% to 1.36. On the New York Stock Exchange, the number of securities that rose in price (1694) exceeded the number of those that closed in the red (1502), while quotes of 147 shares remained virtually unchanged. On the NASDAQ stock exchange, 2069 companies rose in price, 1727 fell, and 265 remained at the level of the previous close. The CBOE Volatility Index, which is based on S&P 500 options trading, fell 3.62% to 35.13. Gold futures for April delivery added 3.12%, or 62.35, to $2.00 a troy ounce. In other commodities, WTI crude for April delivery rose 4.44%, or 5.30, to $124.70 a barrel. Futures for Brent crude for May delivery rose 0.06%, or 0.08, to $129.27 a barrel. Meanwhile, in the Forex market, the EUR/USD pair remained unchanged at 0.00% to 1.09, while USD/JPY edged up 0.01% to hit 115.67. Futures on the USD index fell 0.17% to 99.12. The material has been provided by InstaForex Company - www.instaforex.com |
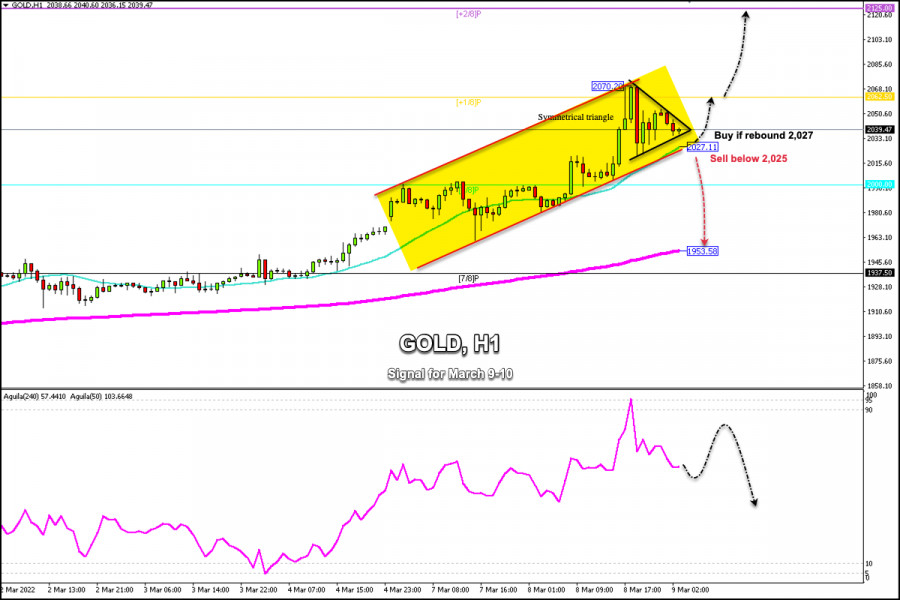
| Trading signals for GOLD (XAU/USD) on March 9-10, 2022: buy above $2,027 (21 SMA) Posted: 08 Mar 2022 07:11 PM PST
Gold broke sharply and reached a new high at 2,070.40 in the afternoon American session. Commodity prices resumed their gains and WTI hit new highs at 130.50. Gold price consolidates around the level 2,040 as US President Joe Biden and UK Prime Minister Boris Johnson have announced new sanctions against Russia amid its latest invasion of Ukraine. XAU/USD is in a correction phase from the high 2,070. On the 1-hour chart, a symmetrical triangle pattern has formed. A break above this triangle could resume its bullish move towards +1/8 Murray at 2,062 and up to +2/8 Murray at 2,150. The 21 SMA (2,057) has turned into dynamic support. A bounce around this level could offer the opportunity to buy back gold in the coming hours. In the short term, gold is likely to hit an all-time high of 2,150. In the short term, the price of gold is overbought. The eagle indicator has reached 95-points that is a sign of an imminent technical correction. In the course of hours, it could break the 21 SMA at 2,027 and accelerate the decline towards the 200 EMA at 1,953. The volatility of gold is very evident. After reaching 2,070, it made a correction of 4,700 pips in less than an hour, which means a price change of 47 dollars. Under normal conditions, this range of movements takes a few days or even weeks, due to the uncertainty of the market regarding the Russian invasion. Gold is one of the most volatile assets after oil. For this reason, we must be very careful when investing. Our trading plan is to buy above 2,027 with targets at 2,062. Closing above 2,070 on the daily chart, it could hit 2,150. On the contrary, sell below 2,025 with targets at the psychological level 2,000 and up to the 200 EMA at 1,953. The material has been provided by InstaForex Company - www.instaforex.com |
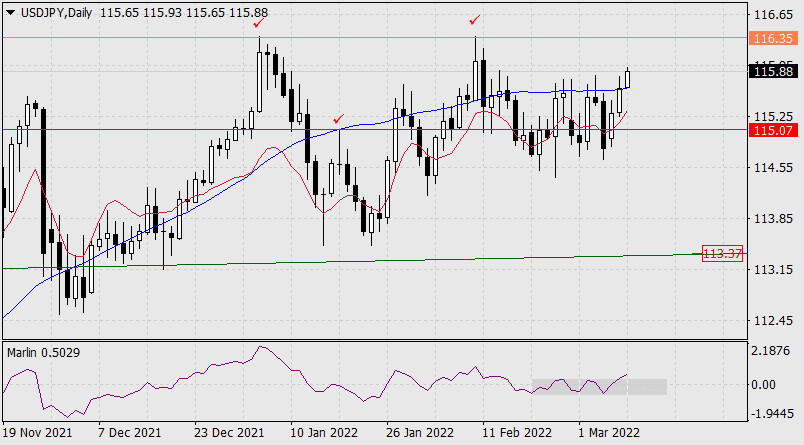
| Forecast for USD/JPY on March 9, 2022 Posted: 08 Mar 2022 06:53 PM PST USD/JPY rose by 34 pips on Tuesday, hitting the MACD line. This morning, it went above it and moved past the daily high. The Marlin oscillator also left the neutral area, indicating the pair's intention to continue rising. Most likely, it will go to 116.35.
There is little chance that the quote will reach 117.20 because stock markets are bearish. Dollar could receive support from the ECB meeting tomorrow as officials may announce a soft policy, but the Fed meeting next week, where interest rates may be raised, will put a lot of pressure on stock indices. This means that the situation is uncertain again, at least for today.
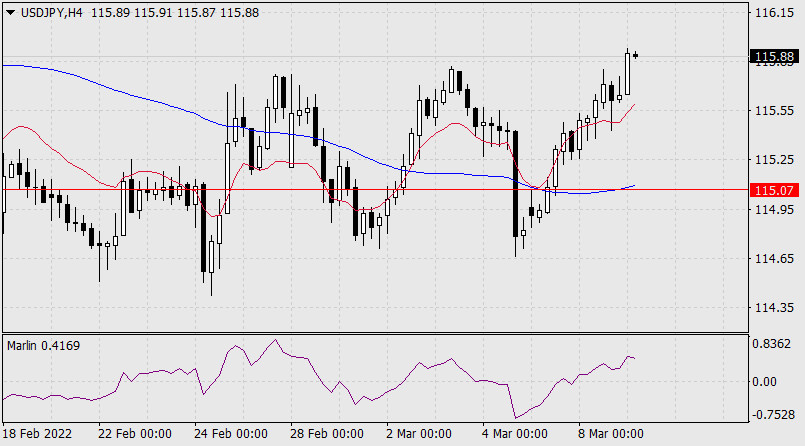
The pair is above both indicator lines in the four-hour chart. The Marlin oscillator is rising and may even go to 116.35. However, there could be surprises today. The material has been provided by InstaForex Company - www.instaforex.com |
| Posted: 08 Mar 2022 06:32 PM PST
The EUR/USD currency pair on Tuesday refrained from a new fall. This is, of course, sarcasm, but what has been happening with the European currency in the last week is sad and terrible. It cannot be said that an upward correction has begun for the pair and now the worst is behind us because there is no correction as such now. Now, in principle, it is very difficult to predict the movement of the pair even for a couple of days ahead. The first shock has already passed, but, as we can see, traders continue to get rid of the most risky currencies. Or is it just that the demand for the dollar is so high that the demand for other currencies simply does not matter, it is still less. Whatever it was, the US currency continues to grow in general and has excellent prospects. We consider yesterday simply as a pause. What will happen next? It largely depends not even on the escalation or de-escalation of the Ukrainian-Russian war, but on how traders and investors are now set up. Recall that the key reason for the growth of the dollar is the redistribution and redirection of capital around the world. We have already said that money is now leaving the Russian and Ukrainian economies. Naturally, they have to go into something with the help of some currency. It would be strange if investors brought Ukrainian hryvnia or Russian rubles to England or Spain. Naturally, these are dollars or euros. And to withdraw dollars, you need to buy dollars first, and therefore already withdraw them. What is the result? As a result: the longer the war between Ukraine and Russia lasts, the longer the riskiest currencies, assets, instruments, and markets can potentially fall. We are now witnessing absolute madness in the oil and gas market, for example. We see that the American stock market is falling. I don't even want to imagine what will happen today when the Moscow Stock Exchange opens after a long break. Therefore, the worst is not over yet. American inflation: no intrigue. As we have already said, there will be an extremely small number of important macroeconomic statistics and events this week. By and large, it will be possible to pay attention only to the report on American inflation and the ECB meeting. However, only the inflation report will be of interest, because no one is waiting for any action from the ECB right now. And what about inflation? In short, inflation is 90% likely to continue to rise in March and April. Recall that on March 15-16, the Fed is likely to decide to raise the key rate by 0.25%. But does anyone believe that this will stop inflation? In the UK, the rate has already been raised twice, and the consumer price index has been growing and growing. Now both Europe and the United States are facing another serious problem, and they have created another one for themselves. First, energy prices are rising against the background of the Ukrainian-Russian crisis. This is already enough for prices to start rising again for everything because oil and gas are still used in production and logistics everywhere. Second, Europe and the United States have decided to abandon Russian gas and oil. Naturally, this will not happen in 5 minutes, and not all countries of the European Union have refused, but the point is that now almost no one buys oil and gas from Russia. Or they buy it, but at a huge discount, because demand has fallen, and oil production cannot just be stopped. Oil is either being extracted, or the well needs to be preserved until better times. Therefore, the prices that are now established on world markets have nothing to do with the prices at which the Russian Federation sells oil and gas. Consequently, in any case, there will be a shortage of carbohydrates on the market, which partly explains the increase in their price. In turn, this causes panic in the stock markets, since again, many companies are somehow connected with Russian oil and gas. And now they will have to be bought more expensive and not in Russia. And it is still the United States that has not imposed an embargo on oil imports from Russia. A corresponding decision may be made by Congress in the coming days.
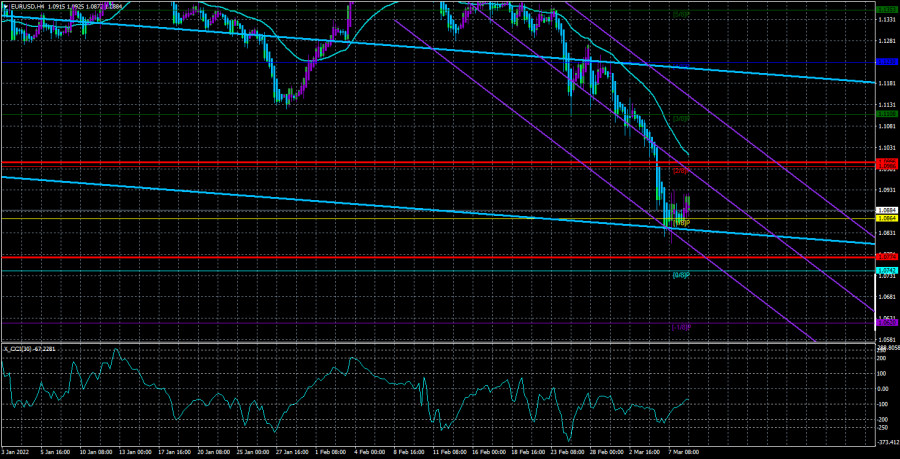
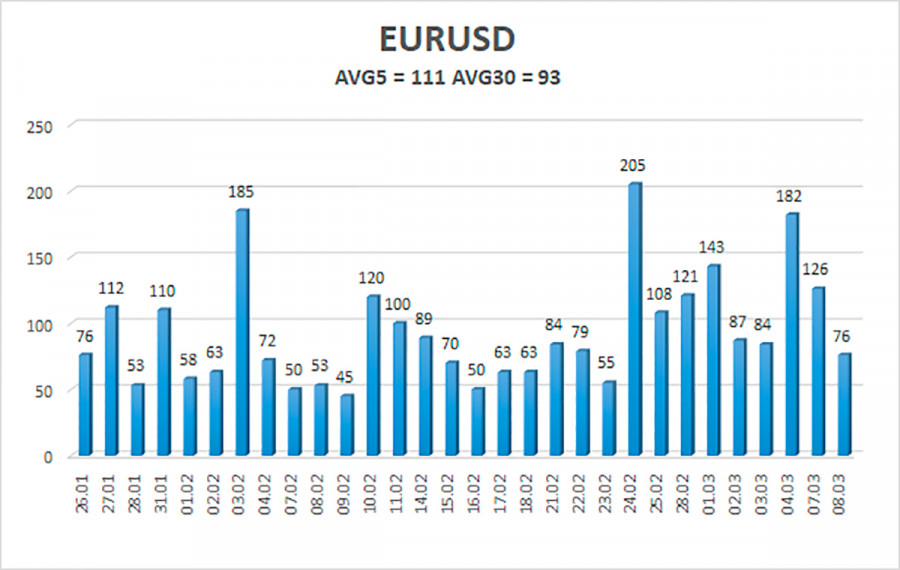
The volatility of the euro/dollar currency pair as of March 9 is 111 points and is characterized as "high". Thus, we expect the pair to move today between the levels of 1.0774 and 1.0996. The reversal of the Heiken Ashi indicator downwards signals the resumption of the downward movement. Nearest support levels: S1 – 1.0864 S2 – 1.0742 S3 – 1.0620 Nearest resistance levels: R1 – 1.0986 R2 – 1.1108 R3 – 1.1230 Trading recommendations: The EUR/USD pair has started to adjust. Thus, now we should consider new short positions with targets of 1.0774 and 1.0742 after the reversal of the Heiken Ashi indicator down. Long positions should be opened no earlier than the price-fixing above the moving average line with a target of 1.1108. Explanations to the illustrations: Linear regression channels - help to determine the current trend. If both are directed in the same direction, then the trend is strong now. Moving average line (settings 20.0, smoothed) - determines the short-term trend and the direction in which to trade now. Murray levels - target levels for movements and corrections. Volatility levels (red lines) - the likely price channel in which the pair will spend the next day, based on current volatility indicators. CCI indicator - its entry into the oversold area (below -250) or into the overbought area (above +250) means that a trend reversal in the opposite direction is approaching. The material has been provided by InstaForex Company - www.instaforex.com |
| Posted: 08 Mar 2022 06:32 PM PST Analysis of GBP/USD 5M. The GBP/USD currency pair was in a sideways movement all day on Tuesday. This is visible on the 5-minute timeframe, even if there were not two linear regression channels that are directed sideways. Nothing was interesting at all on Tuesday. Neither in the foreign exchange market, nor macroeconomic terms, nor in geopolitical terms. It seems that the markets have decided to celebrate International Women's Day, with which we congratulate all representatives of the fair sex. Volatility was low - about 65 points and the main news of the day was a possible US ban on any energy carriers from the Russian Federation. However, the foreign exchange market did not react to this news in any way. But oil has risen in price to $ 130 per barrel and is likely to continue to grow. At the same time, the Central Bank of the Russian Federation decided not to open the Moscow Stock Exchange on March 9. Recall that the exchange has been closed since February 25 and many experts fear that when it opens, the ruble may well collapse to 200-300 rubles for 1 dollar. It is also worth highlighting the statements of Boris Johnson, who on the one hand said that it would be difficult for Europe to abandon Russian oil and gas overnight, and on the other hand said that the UK would gradually abandon hydrocarbons from the Russian Federation in 2022. As for trading signals, there were none on Tuesday. And, from our point of view, it's for the best. It should be remembered that any flat is dangerous for traders. Yes, sometimes the price in a side-channel moves between its borders, even forming good signals at the same time. But this is not always the case. A lot of false signals are formed more often. COT Report: The latest COT report on the British pound showed an increase in bullish sentiment among professional traders. And a week earlier, the strengthening of the "bearish" mood. In general, the mood of the major players changes too often, which is seen by the two indicators in the illustration above. At the moment, the net position of the "Non-commercial" group is near zero, which means a "neutral" mood. The same conclusion is confirmed by the absolute data on the number of open contracts. There are 51 thousand of them for purchase now, and 50 thousand for sale. That is almost complete equality. Moreover, since July last year, professional traders have not been able to decide where to trade the British pound. Only in December, there was a serious strengthening of the "bearish" mood, which led to a significant drop in the UK currency. The rest of the time, the players cannot decide in the medium term what to do with the pound. Therefore, the absence of a strong fall in the British pound partly corresponds to the COT reports. However, we still believe that COT reports are not the best tool for forecasting right now. At a time when the whole world is increasing demand for the dollar as a reserve currency, we can expect growth of this particular currency, despite any data from COT reports. This is exactly the picture we are seeing now in the euro currency, where purchases are growing, while the currency itself is falling. Thus, geopolitics remains in the first place in terms of importance. Analysis of GBP/USD 1H. On the hourly timeframe, a downward trend is visible to the naked eye, which is supported by a descending trend line. We have redrawn several levels and now the price is between 1.3082 and 1.3134, and there are simply no lower levels. Thus, the further fall of the British currency will be quite difficult to work out due to the small number of signals and the lack of target levels. On March 9, we highlighted the following important levels: 1.3082, 1.3134, 1.3273, 1.3367. The Senkou Span B (1.3454) and Kijun-sen (1.3249) lines can also be signal sources. Signals can be "bounces" and "surmounts" of these levels and lines. It is recommended to set the Stop Loss level to breakeven when the price passes in the right direction by 20 points. The lines of the Ichimoku indicator can move during the day, which should be taken into account when determining trading signals. Also in the illustration, there are support and resistance levels that can be used to fix profits on transactions. There are no major events or publications scheduled for Wednesday in the UK and the US. Thus, during the day, traders will be able to pay attention again only to geopolitical news, if there are any. We believe that the probability of a stronger correction is high, but Monday and Tuesday showed that traders are not ready to take profits on short positions and open long ones yet. Explanations to the illustrations: Price levels of support and resistance (resistance /support) - thick red lines, near which the movement may end. They are not sources of trading signals. Kijun-sen and Senkou Span B lines - the lines of the Ichimoku indicator, transferred to the hourly timeframe from the 4-hour one. Are strong lines. Extreme levels - thin red lines from which the price bounced earlier. They are sources of trading signals. Yellow lines - trend lines, trend channels, and any other technical patterns. Indicator 1 on the COT charts - the net position size of each category of traders. Indicator 2 on the COT charts - the net position size for the "Non-commercial" group. The material has been provided by InstaForex Company - www.instaforex.com |
| Posted: 08 Mar 2022 06:31 PM PST EUR/USD 5M analysis. During the second trading day of the week, the EUR/USD pair was trading almost in a side channel. This is seen by the two linear regression channels, which are built automatically. They have a minimal upward slope. Tuesday's volatility was 71 points, which seems to be not a little, but not much either. There are no levels in the area where the price is now. Therefore, there were no trading signals on Tuesday. We believe that this is even for the best since many false signals could have been formed in flat conditions. Tuesday in general was extremely boring. The European Union published a report on GDP in the fourth quarter in the third estimate, but, as we warned yesterday, there was no reaction to it. GDP grew by 0.3% q/q, which is very little. Therefore, the European currency did not receive any support. There was no geopolitical news during the day either. Therefore, traders had absolutely nothing to react to. As already mentioned, not a single trading signal was formed on Tuesday. We believe that today the picture may repeat itself since there will be no important data today. Negotiations between Sergey Lavrov and Dmytro Kuleba are scheduled for March 10. The report on US inflation will be released on March 10. The ECB meeting will be held on March 10. Thus, the market can now take a wait-and-see position and just wait for the key Thursday, so as not to risk unnecessarily and in advance. COT Report: The new COT report, which was released on Friday, showed a new strengthening of the "bullish" mood among professional traders. This time, the Non-commercial group has opened about 16 thousand contracts for purchase and 6.8 thousand contracts for sale. Thus, the net position increased by another 9 thousand, which is visible on the second indicator in the illustration above. The total number of purchase contracts exceeds the number of sale contracts by 70 thousand, so now we can say that a new upward trend is beginning to form. The only problem is that the euro continues to fall, and not grow. And this is an absolute divergence. What are we observing now? We observe that the demand among major players for the euro currency is growing, but at the same time, the euro currency itself is falling. What does this mean? This means that the demand for the US currency is growing at a much higher rate. After all, COT reports reflect exactly the demand for the euro currency, not taking into account the dollar. And the dollar is now used by the whole world as a reserve currency. In a difficult geopolitical situation, the demand for the dollar is only growing, which is why we are seeing such a picture. Based on this, we can conclude that now COT reports cannot be considered to predict the further movement of the euro/dollar pair. These reports simply do not coincide with what is happening in the market itself. Therefore, we need to wait for the resolution of the geopolitical conflict in Eastern Europe. EUR/USD 1H analysis.
On the hourly timeframe, the downward trend persists, as evidenced by the downward trend line. The price is very far from it and has not made any attempts to adjust to it yet. Today will be a boring day in terms of news, so the market is most likely already waiting for March 10. On Wednesday, we allocate the following levels for trading - 1.0729, 1.0767, 1.0990, 1.1057, 1.1144, as well as the Senkou Span B (1.1224) and Kijun-sen (1.0975) lines. There are also auxiliary support and resistance levels, but no signals will be formed near them. The lines of the Ichimoku indicator may change their position during the day, which should be taken into account when searching for trading signals. Signals can be "bounces" and "overcoming" levels-extremes and lines. Do not forget about placing a Stop Loss order at breakeven if the price went in the right direction of 15 points. This will protect against possible losses if the signal turns out to be false. On March 9, no important reports or other events are scheduled in the European Union and the United States. Therefore, the fundamental and macroeconomic backgrounds will be absent. Most likely, the geopolitical background will also be weak, as the parties are presumably waiting for a meeting between Lavrov and Kuleba on March 10 in Turkey. Nevertheless, a military conflict is an unpredictable thing, there may be surprises. Explanations to the illustrations: Price levels of support and resistance (resistance /support) - thick red lines, near which the movement may end. They are not sources of trading signals. Kijun-sen and Senkou Span B lines - the lines of the Ichimoku indicator, transferred to the hourly timeframe from the 4-hour one. Are strong lines. Extreme levels - thin red lines from which the price bounced earlier. They are sources of trading signals. Yellow lines - trend lines, trend channels, and any other technical patterns. Indicator 1 on the COT charts - the net position size of each category of traders. Indicator 2 on the COT charts - the net position size for the "Non-commercial" group. The material has been provided by InstaForex Company - www.instaforex.com |
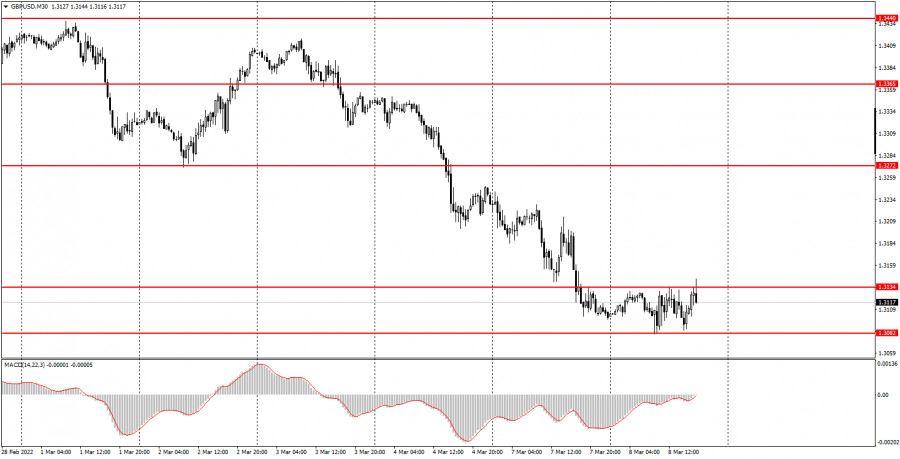
| How to trade the GBP/USD currency pair on March 9? Simple tips and analysis of deals for beginners. Posted: 08 Mar 2022 06:31 PM PST Analysis of Tuesday's deals: 30M chart of the GBP/USD pair.
The GBP/USD pair was in a total flat on Tuesday. Although the levels of 1.3082 and 1.3134 are "old" levels that were formed more than a year ago, the price showed that it is ready to "respect" them and spent the entire Tuesday exactly between them. Thus, now we are talking about a flat and a side-channel. However, this channel is unlikely to keep the pair inside for a long time. First, geopolitics remains very complicated, so a new fall in the pound may follow. Second, the channel is very narrow and it will be physically difficult for the price to stay inside it. Third, an upward correction is now expected, albeit not strong. No important macroeconomic statistics were published on Tuesday either in America or the UK. Therefore, in part, the market worked out this day quite logically. However, we recall that there was no important news on Monday either, but the pair showed volatility of 130 points during the day. The downward trend continues. 5M chart of the GBP/USD pair. On a 5-minute timeframe, the movement looks very eloquent and does not even need explanations. From a technical point of view, the pair moved almost perfectly, because, despite the side channel, it worked out each of the borders in turn, thus forming trading signals. Let's look at them. The first two buy signals were formed when they rebound from the level of 1.3082. Novice traders could work them out and make a profit, as prices subsequently rose to the level of 1.3134 and worked out this level with minimal error. This was followed by a sell signal in the form of a rebound from 1.3134, after which the price dropped back to 1.3082 and also bounced off it with minimal error, forming another buy signal. This signal also turned out to be profitable, as the price rose again to the level of 1.3134 and bounced off it once again, forming another sell signal. As a result, today we have 4 trading signals, all profitable, each one could earn about 25 points. It is clear that 25 points on each trade in the flat are an ideal option, but in total, you could still earn at least 70 points. The movement was lateral, but if there are good signals, you can even earn money on it. How to trade on Wednesday: On the 30-minute TF, the pair continued its downward movement and on Monday it only intensified. It is very difficult to predict how the pair will move further now since there are very few levels now and there were no more of them on Tuesday since the price perfectly worked out the existing levels. On the 5-minute TF tomorrow, it is recommended to trade at the levels of 1.3082, 1.3134, 1.3241. When the price passes after opening a deal in the right direction, 20 points should be set to Stop Loss at breakeven. There are no major macroeconomic or fundamental events scheduled for tomorrow in the UK and the US. Therefore, all attention is again on the geopolitical background, if there is one, of course. Although, as Monday showed, even its absence does not mean that the pair will stand in one place. On Tuesday, the market may take a little break, and on Wednesday it may get down to business with renewed vigor. Basic rules of the trading system: 1) The signal strength is calculated by the time it took to generate the signal (rebound or overcoming the level). The less time it took, the stronger the signal. 2) If two or more trades were opened near a certain level on false signals, then all subsequent signals from this level should be ignored. 3) In a flat, any pair can form a lot of false signals or not form them at all. But in any case, at the first signs of a flat, it is better to stop trading. 4) Trade transactions are opened in the period between the beginning of the European session and the middle of the American session when all transactions must be closed manually. 5) On a 30-minute TF, signals from the MACD indicator can be traded only if there is good volatility and a trend, which is confirmed by a trend line or a trend channel. 6) If two levels are located too close to each other (from 5 to 15 points), then they should be considered as a support or resistance area. What's on the chart: Price support and resistance levels - the levels that are the targets when opening purchases or sales. Take Profit levels can be placed near them. Red lines - channels or trend lines that display the current trend and show in which direction it is preferable to trade now. MACD indicator (14, 22, 3) - a histogram and a signal line. An auxiliary indicator that can also be used as a signal source. Important speeches and reports (always contained in the news calendar) can greatly influence the movement of a currency pair. Therefore, during their exit, it is recommended to trade as carefully as possible or exit the market to avoid a sharp price reversal against the previous movement. Beginners to trade in the forex market should remember that every transaction cannot be profitable. Developing a clear strategy and money management is the key to success in trading for a long period. The material has been provided by InstaForex Company - www.instaforex.com |
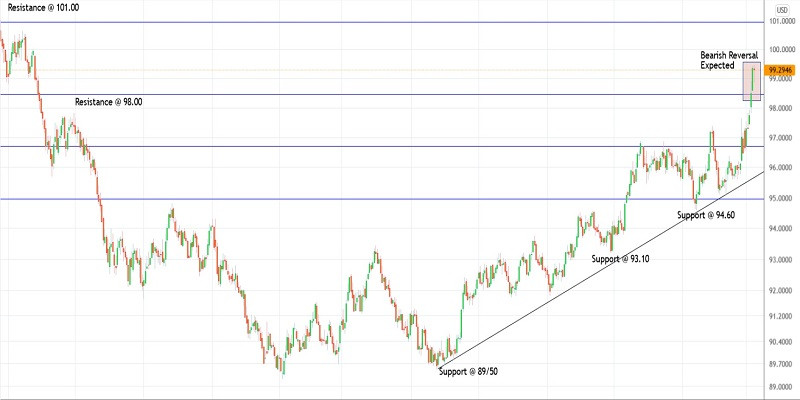
| Trading plan for US dollar index for March 09, 2022 Posted: 08 Mar 2022 04:13 PM PST
Technical outlook:The US dollar index might have carved a meaningful top around 99.50-60 mark on Tuesday. The index has pulled back a bit and is seen to be trading close to 99.30 mark at this point in writing. Please note that prices have produced a Doji candlestick pattern on the daily chart indicating a potential trend reversal ahead. High probability remains for bears to be back in control from here and produce an Evening Star by the end of Wednesday. Furthermore, prices have reached the Fibonacci 0.618 retracement of the previous downswing between 104.00 and 89.20 levels. Bears need to hold prices below 99.60 mark to keep potential bearish structure intact. The index is facing strong support around 95.00 mark and a break lower will confirm that bears are back in control and a major top is in place. Further, a break below the trendline support would accelerate the drop to 94.50 and 91.00 levels respectively. Looking at the larger wave structure, potential remains for a drop below 89.20 going forward. Trading plan:Potential drop to 94.00-95.00 against 100.00 Good luck! The material has been provided by InstaForex Company - www.instaforex.com |
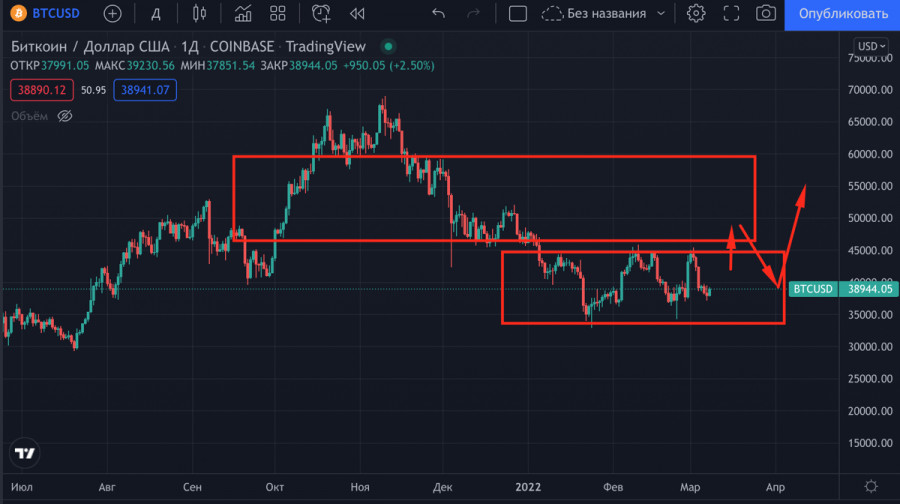
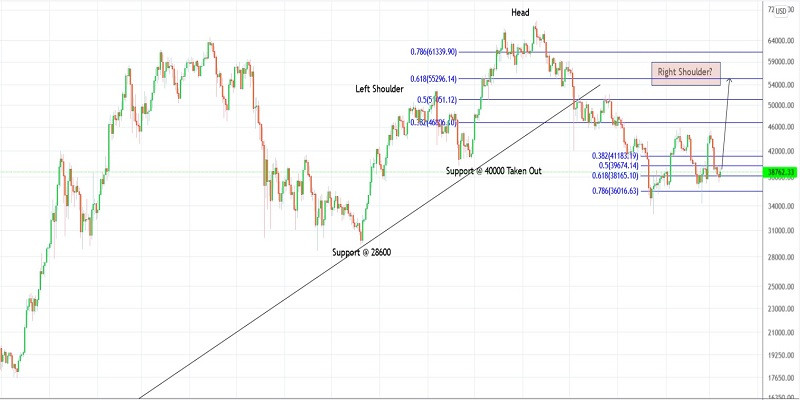
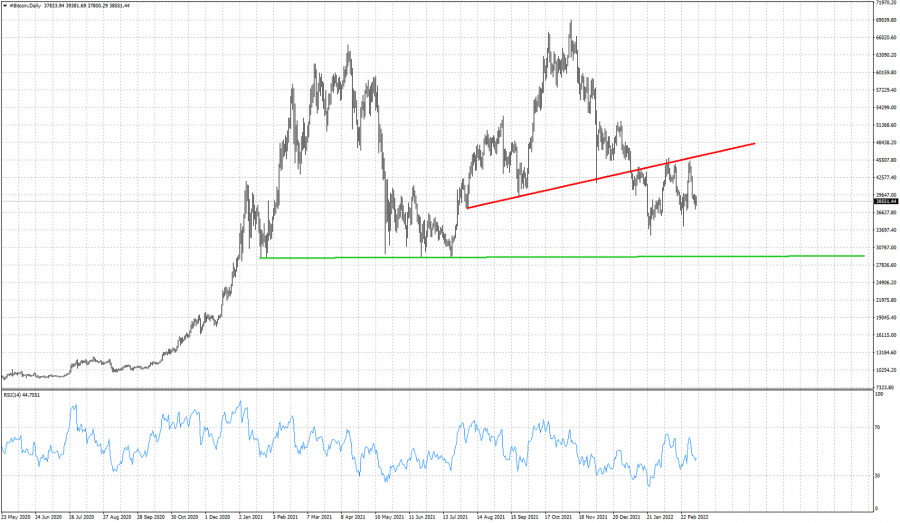
| Trading plan for Bitcoin for March 09, 2022 Posted: 08 Mar 2022 03:52 PM PST
Technical outlook:Bitcoin is preparing to resume its rally toward $48,000-50,000 mark in the next few trading sessions. The crypto is trading just below the $39,000 mark at this point in writing and is expected to produce a rally from here. Bulls are looking poised to hold prices above $33,000 interim support and keep the structure intact. Bitcoin has been carving a counter trend rally since the $33,000 mark. On the flip side, it could be unfolding a triangle structure before breaking below $33,000 and pushing through $27,000 support. We continue to remain bullish till $33,000 remains intact going forward. Prices need to push through the $46,000 mark to accelerate further. Bitcoin is working on the primary downswing boundary between $69,000 and $33,000 levels. The Fibonacci 0.618 retracement is also seen to be passing close to $50,000 mark as seen on the chart. High probability remains for a bearish turn if prices are able to push through $50,000 mark. Potential Right Shoulder could be in the making within the proposed Head and Shoulder reversal. Trading plan:Potential rally through $50,000 against $33,000 Good luck! The material has been provided by InstaForex Company - www.instaforex.com |
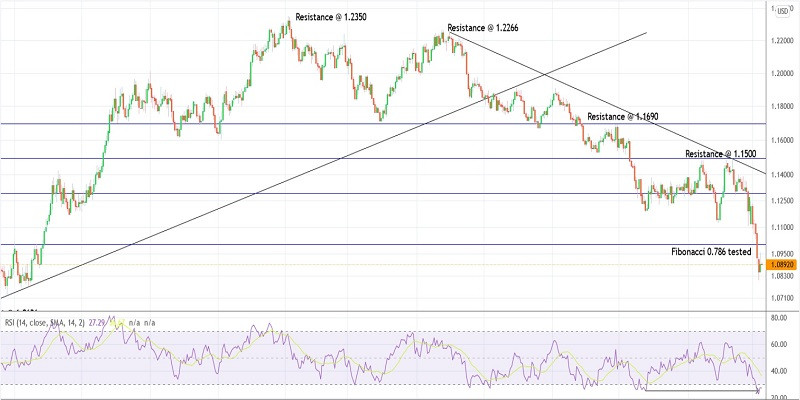
| Trading plan for EURUSD for March 09, 2022 Posted: 08 Mar 2022 03:34 PM PST
Technical outlook:EURUSD rallied through 1.0960-70 mark overnight on Tuesday, March 08, 2022 before facing interim resistance. The single currency pair is seen to be trading just below 1.0900 mark at this point in writing and is expected to carve higher highs and higher lows from here on. Bulls need to hold prices above 1.0600 broadly to keep the bullish structure intact. EURUSD has printed fresh swing lows close to 1.0800 mark early this week. The previous swing low was seen close to 1.1195 in November 2021. It is worth noting that as prices dropped during the above period, the RSI in daily chart almost remained flat as shown here. This phenomenon could be viewed as a potential bullish divergence, indicating a trend reversal. EURUSD could still find prices drifting sideway for another few sessions but bias remains on the upside as bulls prepare to come back in control. The 1.0800 handle is expected to hold as the single currency prepares to rally towards 1.2000 mark in the next several weeks time. Intraday support comes in around 1.0880-90 zone. Trading plan:Potential rally through 1.1500 against 1.0600 Good luck! The material has been provided by InstaForex Company - www.instaforex.com |
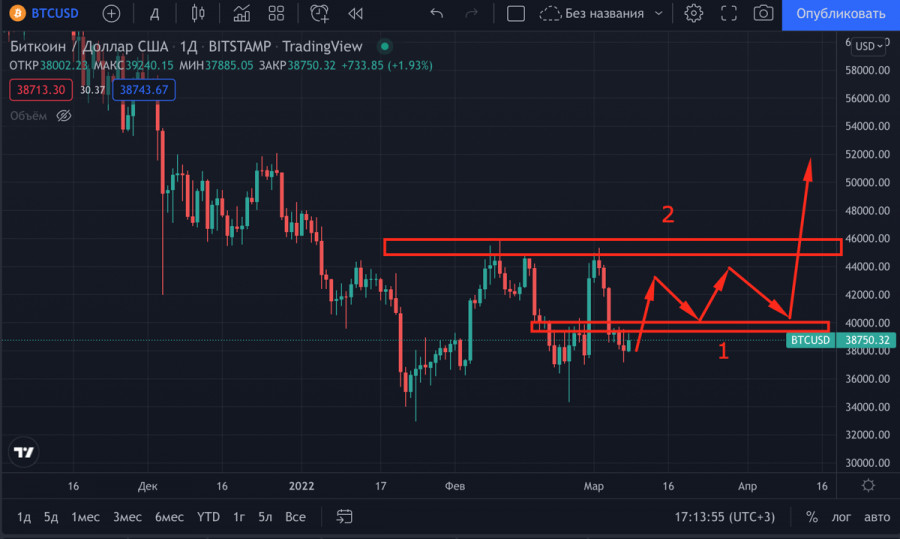
| Bitcoin analysis for March 8, 2022. Posted: 08 Mar 2022 01:48 PM PST Bitcoin is trading again below $39,000 after bouncing higher and creating a double top around $45,300. Price back tested the red broken support trend line which is now resistance. Bulls will need to recapture $40,000 soon, otherwise we should expect a move lower towards $35,000.
Green line - support Bitcoin bulls are struggling to break above resistance. The $39,000-$40,000 price level has been recently confirmed as a major resistance. Breaking above these resistance levels is what bulls want to see. Until then, price is vulnerable to more downside. Specially if price falls below $36,800, Bitcoin should continue towards $30,000. The material has been provided by InstaForex Company - www.instaforex.com |

| You are subscribed to email updates from Forex analysis review. To stop receiving these emails, you may unsubscribe now. | Email delivery powered by Google |
| Google, 1600 Amphitheatre Parkway, Mountain View, CA 94043, United States | |


Comments