Forex analysis review
Forex analysis review |
- Technical analysis Apple for March 8, 2022
- Elliott wave analysis of Copper for March 8, 2022
- Swiss National Bank pledges to stem franc's rise
- How to trade GBP/USD on March 4, 2022. Tips and trades analysis for beginners
- How to trade EUR/USD on March 8, 2022. Tips and trades analysis for beginners
- Forecast for EUR/USD on March 8, 2022
- Trading signals for Ethereum (ETH/USD) on March 8-9, 2022: buy above $2,500 (4/8 Murray)
- Forecast for GBP/USD on March 8, 2022
- Forecast for AUD/USD on March 8, 2022
- USDCHF Potential For Reversal | 8th March
- Forecast for USD/JPY on March 8, 2022
- USDJPY Potential For Bullish Continuation | 8th Mar 2022
- ETHUSD, Bearish Pressure | 8th March 2022
- Overview of the GBP/USD pair on March 8, 2022
- Overview of the EUR/USD pair. March 8. ECB meeting.
- Forecast and trading signals for GBP/USD on March 8. COT report. Detailed analysis of the pair's movement and trade deals.
- Forecast and trading signals for EUR/USD on March 8. COT report. Detailed analysis of the pair's movement and trade deals.
- Trading plan for US dollar index for March 08, 2022
- Trading plan for Bitcoin for March 08, 2022
- Trading plan for EURUSD for March 08, 2022
- USD/CHF symmetrical triangle to explode soon
- Bitcoin at crossroads, attention at support
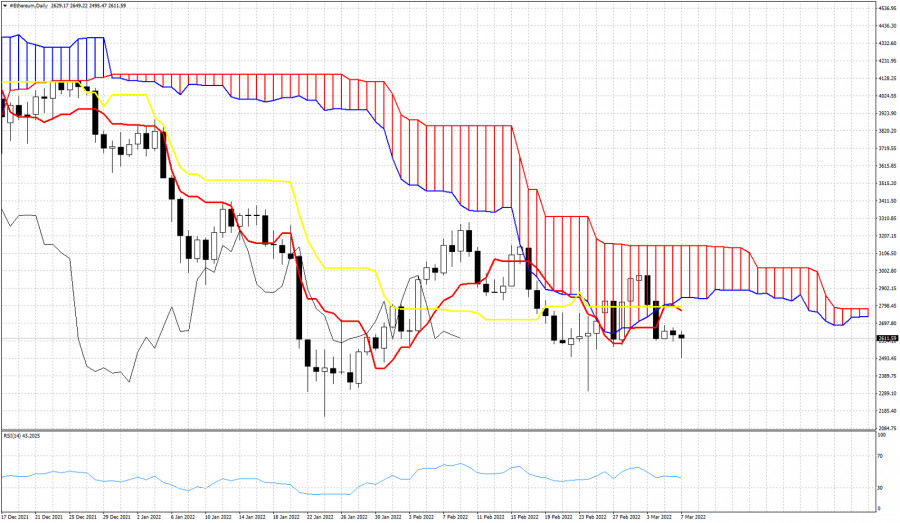
- Ichimoku cloud indicator analysis on Ethereum for March 7, 2022.
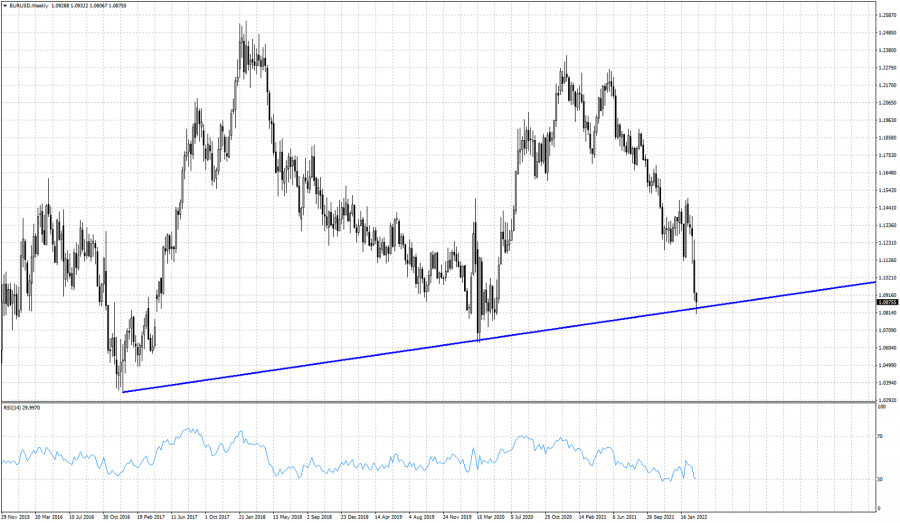
- EURUSD reached 1.0850 support trend line.
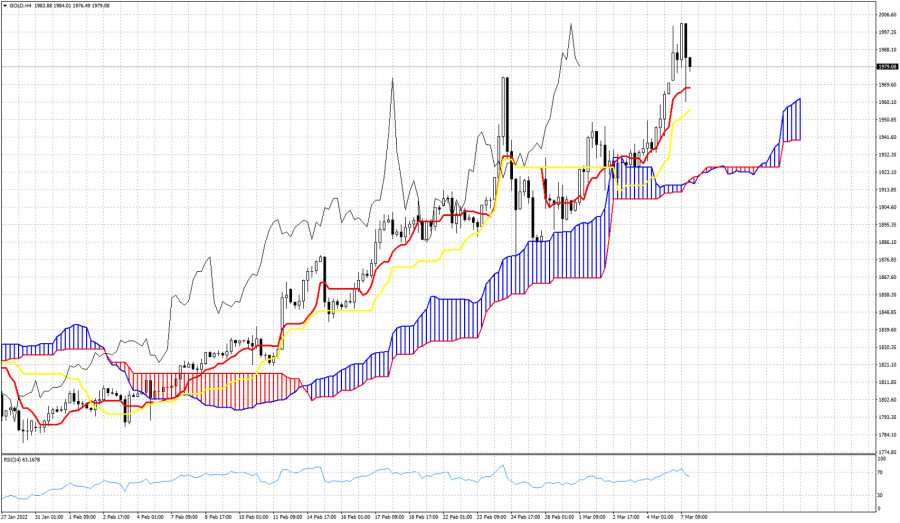
- Ichimoku cloud indicator analysis on Gold for March 7, 2022.
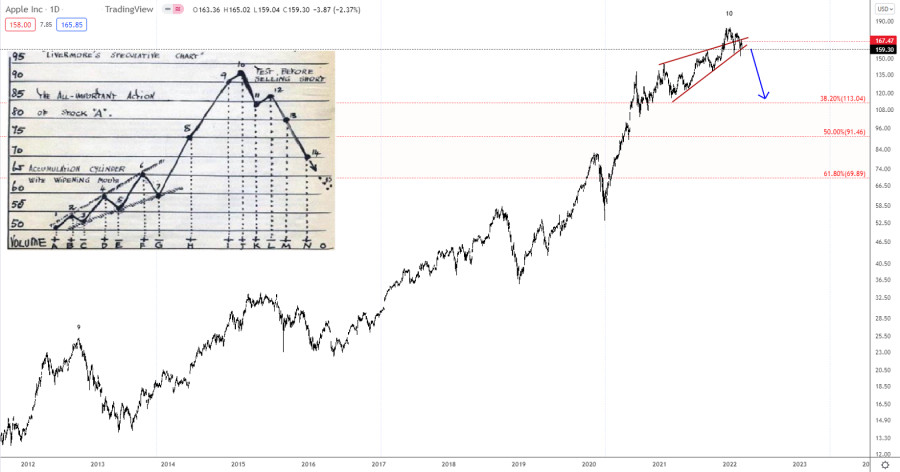
| Technical analysis Apple for March 8, 2022 Posted: 07 Mar 2022 10:24 PM PST
Apple is showing clear evidence of having complete Livermore's accumulation cylinder and a larger decline is on now in play. The first corrective downside target to look for is seen at 113, but we should not at all be surprised to see a continuation lower to the 50% corrective target at 91.46 and possibly even closer to the 61.8% corrective target at 70.00 if panic grips the equity markets, which is a clear possibility. A break below support at 160.87 will confirm the decline to 113 as the next target. The material has been provided by InstaForex Company - www.instaforex.com |
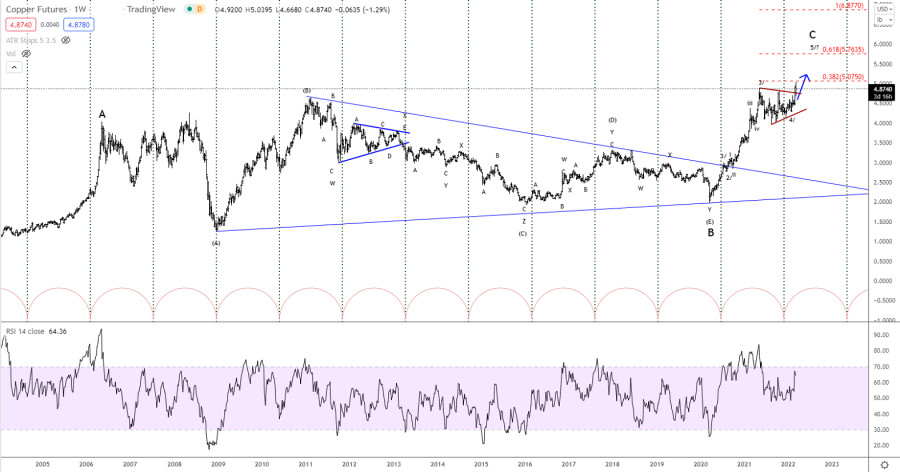
| Elliott wave analysis of Copper for March 8, 2022 Posted: 07 Mar 2022 10:19 PM PST
Copper has completed its triangle consolidation in wave 4 and wave 5 is now unfolding. The first target seen at 5.08 has already been tested, but we should expect wave 5 to move higher towards at least the 61.8% target at 5.76 and most likely the extension target at 6.88 before the top is in place and a larger corrective decline can begin. So for now keep your focus towards the upside and the 5.76 target. The material has been provided by InstaForex Company - www.instaforex.com |
| Swiss National Bank pledges to stem franc's rise Posted: 07 Mar 2022 09:07 PM PST The Swiss National Bank on March 7 confirmed its intention to intervene on the currency markets to curb a rise in the franc after safe-haven inflows driven by the Ukraine conflict briefly pushed the currency above parity with the euro. |
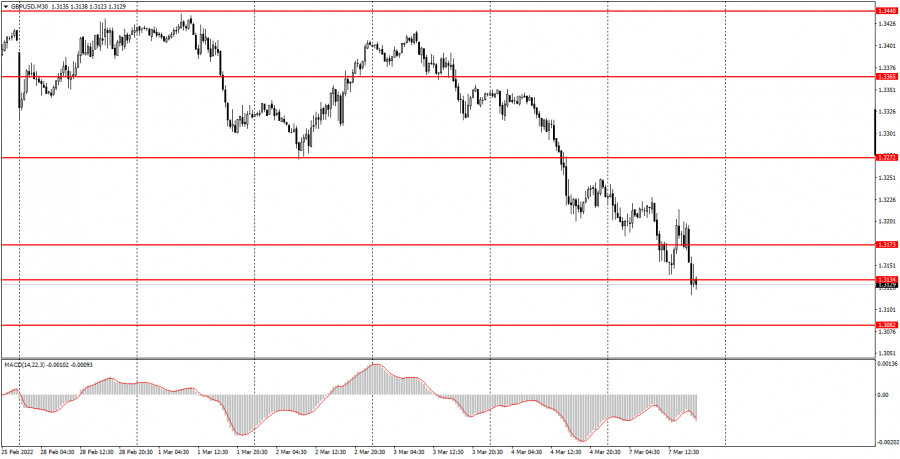
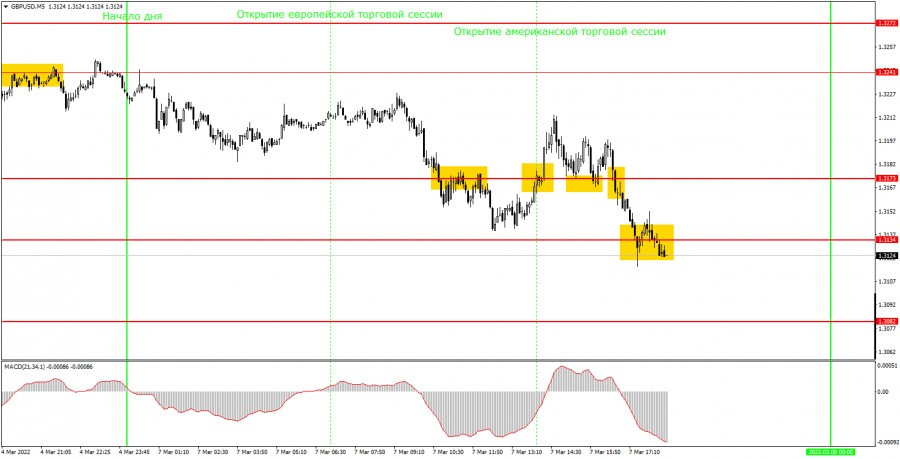
| How to trade GBP/USD on March 4, 2022. Tips and trades analysis for beginners Posted: 07 Mar 2022 09:02 PM PST Analysis of Monday's trades:30M chart of GBP/USD
On Monday, GBP/USD plunged further. Although no significant reports had been published in the United States or the United Kingdom, the market found a reason for a sell-off. At the end of the day, the pound lost 125 pips. The downtrend is now visible to the naked eye, so no trendline or channel is still needed. The levels the pair is now at were formed over a year ago. No wonder, they won't be able to neither provide support or resist the pair. Like the euro, the pound may plunge in the coming days/weeks/ months. However, if the geopolitical situation starts to improve and a breakthrough is achieved in the peace talks between Moscow and Kyiv, the euro and the pound will be able to strengthen. So far, the situation is very complicated, and the market keeps selling off risk assets. M5 chart of GBP/USD
In the M5 time frame, a correction occurred. If not for the corrective move, the technical picture would look perfect. Since the beginning of the correction was impossible to predict, traders were guessing whether it would emerge or not. There had been no rebound from an important level before the correction started. Most of the trading signals of the day cannot be called either false or strong. The first sell signal was made very late. The price broke through 1.3173 and went down by 23 pips, which was enough to place a stop-loss order at the breakeven point. Therefore, beginner traders did not suffer any losses. A buy signal was produced, and the price went up by 20 pips. In that case, the novice did not sustain any losses as well. Two more signals near 1.3173 should have been ignored because the previous two turned out to be false and brought no profit at all. The last sell signal near 1.3134 should have been ignored as well because it was produced very late, and the price had already gone down by 120 pips. Trading plan for Tuesday:In the 30M time frame, the bearish trend got stronger on Monday. It is now hard to tell where the price will go as there are just a few signals and all of them are weak enough. In addition, it remains unclear how long the geopolitical situation will be weighing on the market. The target levels in the 5M time frame are seen at 1.3082, 1.3134, and 1.3241. A stop-loss order should be set at the breakeven point as soon as the price passes 20 pips in the right direction. No important fundamentals or macroeconomic events are expected in the United Kingdom on Tuesday. The focus will be solely on the geopolitical background. However, even its absence does not guarantee the beginning of a correction or a lack of downward movement. From the technical point of view, the situation with the pound is rather complex as there are not enough reference points. Basic principles of the trading system:1) The strength of the signal depends on the time period during which the signal was formed (a rebound or a break). The shorter this period, the stronger the signal. 2) If two or more trades were opened at some level following false signals, i.e. those signals that did not lead the price to Take Profit level or the nearest target levels, then any consequent signals near this level should be ignored. 3) During the flat trend, any currency pair may form a lot of false signals or do not produce any signals at all. In any case, the flat trend is not the best condition for trading. 4) Trades are opened in the time period between the beginning of the European session and until the middle of the American one when all deals should be closed manually. 5) We can pay attention to the MACD signals in the 30M time frame only if there is good volatility and a definite trend confirmed by a trend line or a trend channel. 6) If two key levels are too close to each other (about 5-15 pips), then this is a support or resistance area. How to interpret charts:Support and resistance levels can serve as targets when buying or selling. You can place Take Profit near them. Red lines are channels or trend lines that display the current trend and show which direction is better to trade. MACD indicator (14,22,3) is a histogram and a signal line showing when it is better to enter the market when they cross. This indicator is better to be used in combination with trend channels or trend lines. Important speeches and reports that are always reflected in the economic calendars can greatly influence the movement of a currency pair. Therefore, during such events, it is recommended to trade as carefully as possible or exit the market in order to avoid a sharp price reversal against the previous movement. Beginner traders should remember that every trade cannot be profitable. The development of a reliable strategy and money management is the key to success in long-term trading. The material has been provided by InstaForex Company - www.instaforex.com |
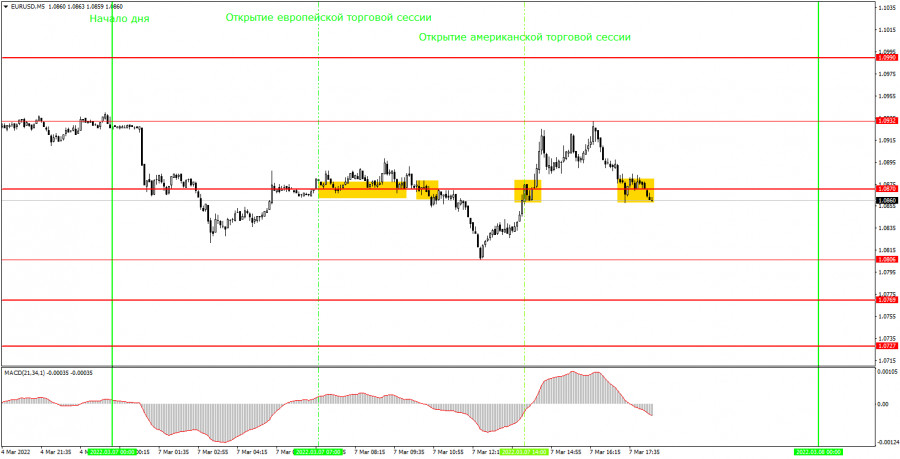
| How to trade EUR/USD on March 8, 2022. Tips and trades analysis for beginners Posted: 07 Mar 2022 09:02 PM PST Analysis of Monday's trades:30M chart of EUR/USD
Volatility on EUR/USD remains high. All levels near the price are relatively formal because the pair approached them for the last time over a year ago. So, these are the levels of a year ago and older. The downtrend is visible to the naked eye, and the euro falls almost every day. On Monday, the price somewhat retraced up but resumed its slide by the end of the day. Important macroeconomic reports weren't published either in the European Union or the United States. There was no significant geopolitical news as well. So, there were absolutely no factors that could somehow boost the US dollar. Nevertheless, it seems that the euro/dollar pair will be in the downtrend for a long time. M5 chart of EUR/USD
In the M5 time frame on Monday, the pair was mostly moving sideways or retracing up, but hit new lows at the end of the day. All trading signals were produced near 1.0870. On the chart above, you can also see the levels of 1.0806 and 1.0932 - Monday's low and high. They had nothing to do with Monday trading. So, let's get back to the trading signals. The pair retraced up from 1.0870 several times, and beginner traders were able to enter long positions. However, these buy signals were very weak. Therefore, after consolidation below 1.0870, the novice should have gone short. That signal turned out to be somewhat stronger as the pair went down by 48 pips. That is, traders had enough time to close their trades manually and receive a profit (the closest target level was located at a long distance). A new buy signal was generated after consolidation above 1.0870 and the pair rose by 30 pips, which was enough to place a stop-loss order at the breakeven point. The last trading signal emerged too late. So, there was no point in following it. Trading plan for Tuesday:In the 30M time frame, the downtrend continues. Therefore, it would be wise to expect the pair to go further down and enter just short positions, and not vice versa. If only the price fixes above the descending channel, long positions could be considered. In the meantime, the pair may retrace up several times due to the empty macroeconomic calendar at the beginning of the week. The target levels in the 5M time frame are seen at 1.0727, 1.0769, 1.0806, 1.0870, 1.0932, and 1.0990. A stop-loss order should be set at the breakeven point as soon as the price passes 15 pips in the right direction. On Tuesday, the third estimate of Q4 GDP in the eurozone will be published. It should come in line with the previous two estimates. Therefore, it is unlikely to have any influence on the market. In the United States, no important macroeconomic events are scheduled for release. Basic principles of the trading system:1) The strength of the signal depends on the time period during which the signal was formed (a rebound or a break). The shorter this period, the stronger the signal. 2) If two or more trades were opened at some level following false signals, i.e. those signals that did not lead the price to Take Profit level or the nearest target levels, then any consequent signals near this level should be ignored. 3) During the flat trend, any currency pair may form a lot of false signals or do not produce any signals at all. In any case, the flat trend is not the best condition for trading. 4) Trades are opened in the time period between the beginning of the European session and until the middle of the American one when all deals should be closed manually. 5) We can pay attention to the MACD signals in the 30M time frame only if there is good volatility and a definite trend confirmed by a trend line or a trend channel. 6) If two key levels are too close to each other (about 5-15 pips), then this is a support or resistance area. How to interpret charts:Support and resistance levels can serve as targets when buying or selling. You can place Take Profit near them. Red lines are channels or trend lines that display the current trend and show which direction is better to trade. MACD indicator (14,22,3) is a histogram and a signal line showing when it is better to enter the market when they cross. This indicator is better to be used in combination with trend channels or trend lines. Important speeches and reports that are always reflected in the economic calendars can greatly influence the movement of a currency pair. Therefore, during such events, it is recommended to trade as carefully as possible or exit the market in order to avoid a sharp price reversal against the previous movement. Beginner traders should remember that every trade cannot be profitable. The development of a reliable strategy and money management is the key to success in long-term trading. The material has been provided by InstaForex Company - www.instaforex.com |
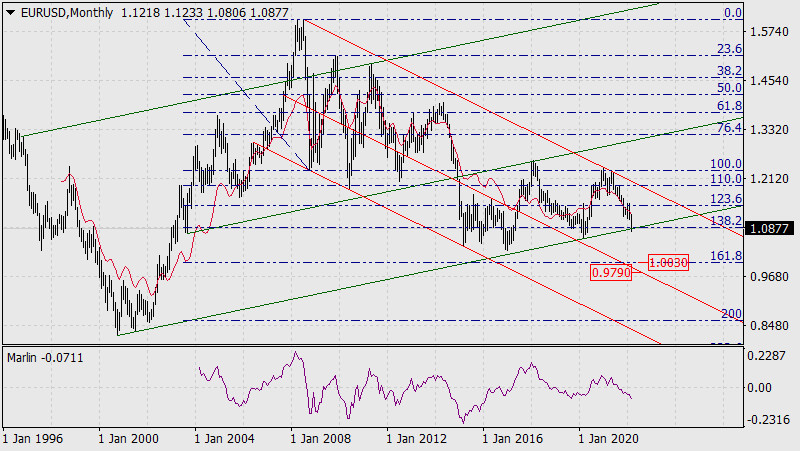
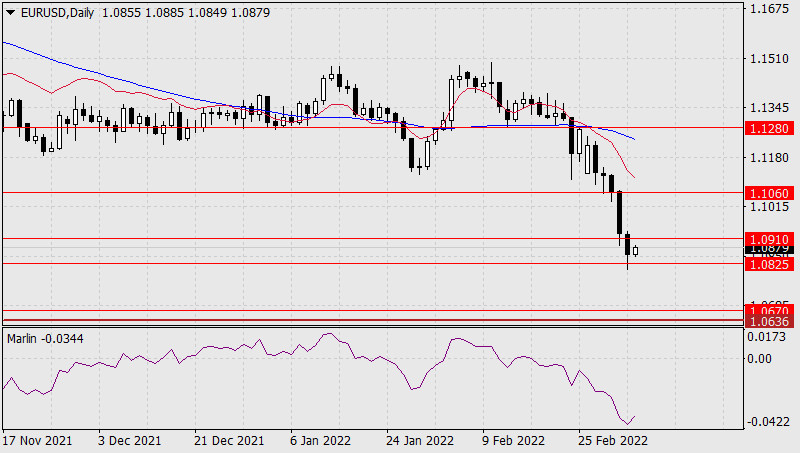
| Forecast for EUR/USD on March 8, 2022 Posted: 07 Mar 2022 08:06 PM PST EUR/USD hit the lower line of the upward channel in the monthly chart. But a little earlier, it was below the 138.2% Fibonacci retracement level. This scenario suggests that the pair could dip to 0.9790-1.0030 (161.8% Fibonacci retracement level) this month.
The Marlin oscillator is slightly turned up in the daily chart, most probably because it is set to leave the oversold area before moving down. The consolidation could last for 1-2 days. And if the meeting goes without surprises, the Fed will raise rates by 0.25% next week. That will prompt the pair to rise to 1.0636/70, the lower limit of which is the March 2020 low. But if the pair dips instead, euro will decline for quite a long time.
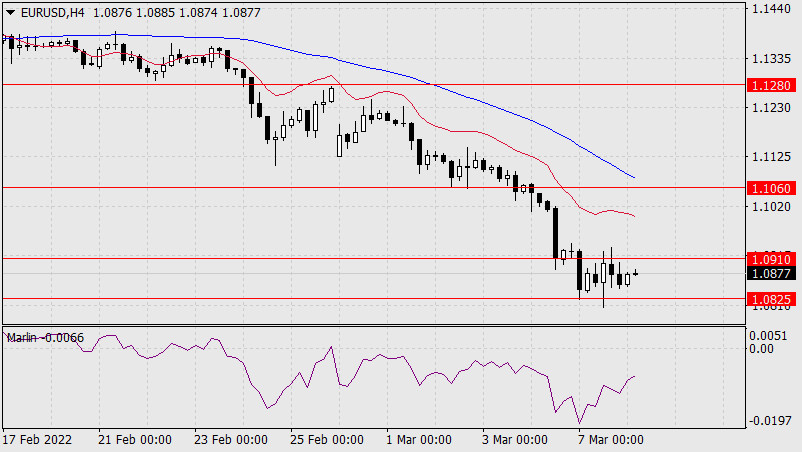
The consolidation in 1.0825-1.0910 is very visible in the four-hour chart. The pair hit the borders in both directions, which indicates potential high volatility in the future. The Marlin oscillator is also growing strongly, so it is likely that it will leave the oversold area soon. But the end of the ongoing correction will provoke a further decline in EUR/USD.
|
| Trading signals for Ethereum (ETH/USD) on March 8-9, 2022: buy above $2,500 (4/8 Murray) Posted: 07 Mar 2022 07:44 PM PST
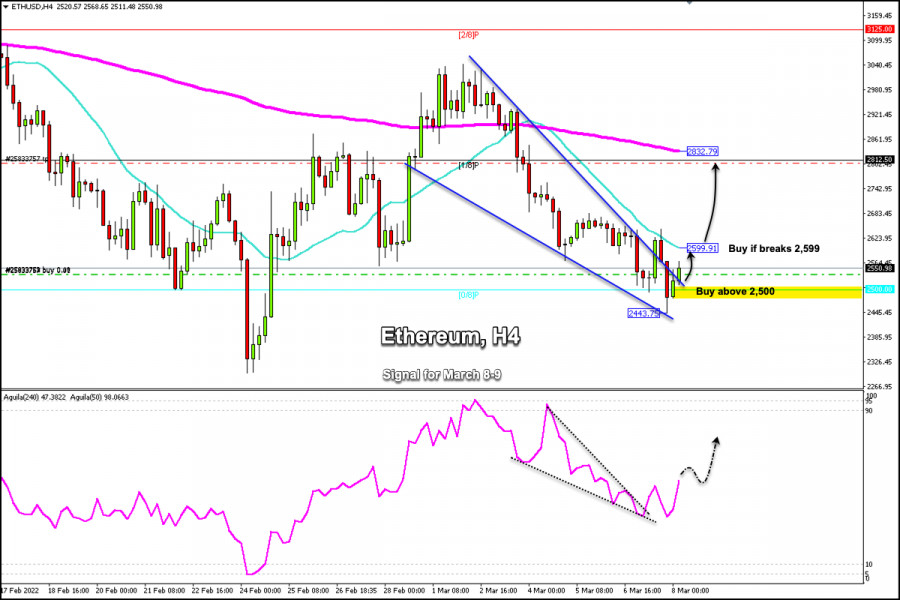
Ethereum (ETH) in the American session fell to a low of 2,443. The support at $2,500 continued to be the key to avoiding heavier losses. Concerns over Russia circumventing sanctions via the crypto market continues to deliver market uncertainty. After reaching the psychological level of $3000 on March 1, ETH started a technical correction towards 4/8 Murray around 2,500. This represents a loss of more than 20% in less than a week. A technical correction could follow in the next few hours if the price consolidates above $2,500. Since March 1, ETH has been forming a falling wedge pattern. A sharp break of this technical pattern could confirm the technical bounce above 4/8 Murray. A breakout and consolidation on the 4-hour chart above the 21 SMA will be the start of a bullish rally towards the 200 EMA at 2,832. Ethereum is likely to consolidate above 2,500 in the next few hours, giving us an opportunity to buy, with targets at 2,599 and 2,832. The short-term outlook for Ether remains bearish, due to the fact that it is located below the moving averages of 200 and 21. This means that as long as it remains below these moving averages, Ether could continue its decline and reach the support level of February 24 at 2,300. Our trading plan for the next few hours is to buy above 4/8 Murray located at 2,500. If there is a break above 2,600, it will be a clear signal to buy with targets at 2,844 and towards the psychological level of $3,000. The material has been provided by InstaForex Company - www.instaforex.com |
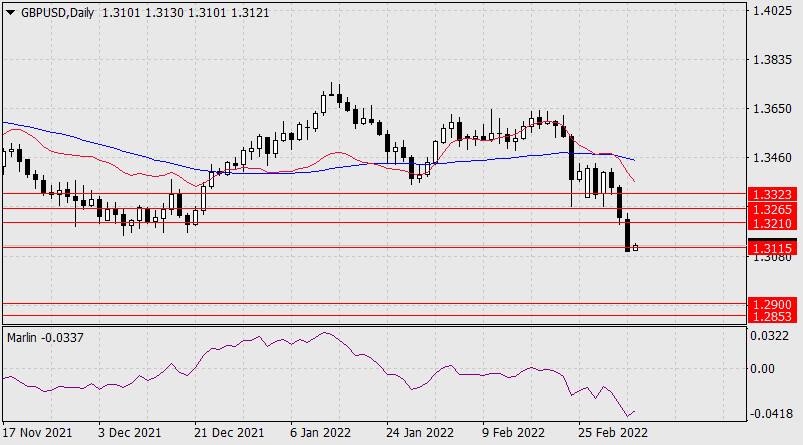
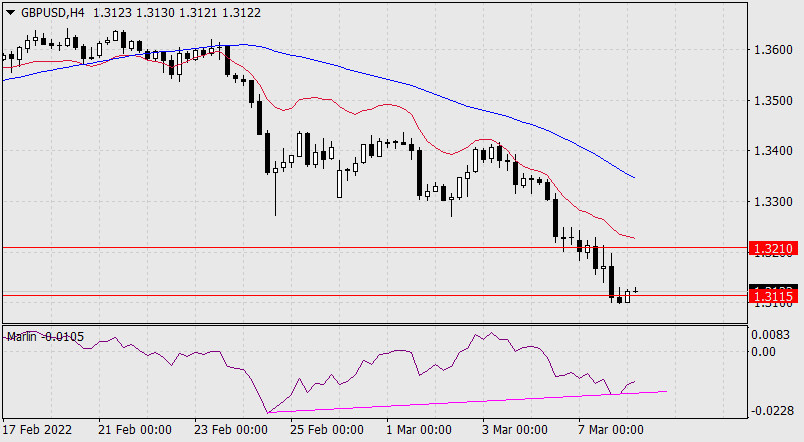
| Forecast for GBP/USD on March 8, 2022 Posted: 07 Mar 2022 07:43 PM PST GBP/USD is falling very sharply. It declined by three figures over the past three days, with the price hitting 1.3115 on Monday. A further drop will bring the pair to 1.2853-1.2900, which are the November 2020 and December 2019 lows. A rebound seems impossible at the moment because yesterday's trading volumes were close to the yearly high, which is a clear signal for medium-term sell-offs.
The Marlin oscillator also formed a convergence in the four-hour chart, so it is likely that many traders will take a break today and then continue their efforts for a deeper decline.
|
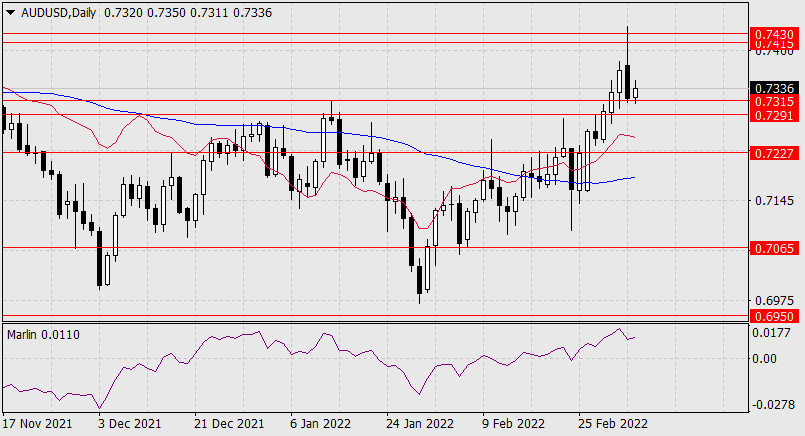
| Forecast for AUD/USD on March 8, 2022 Posted: 07 Mar 2022 07:36 PM PST The rebound in commodity markets led to the decrease of AUD/USD. The dip was as much as 128 pips, with the price stopping at the upper border of the range 0.7291-0.7315. The Marlin oscillator also showed a downward reversal in the daily chart. A further decline below 0.7291 opens the opportunity to reach 0.7227.
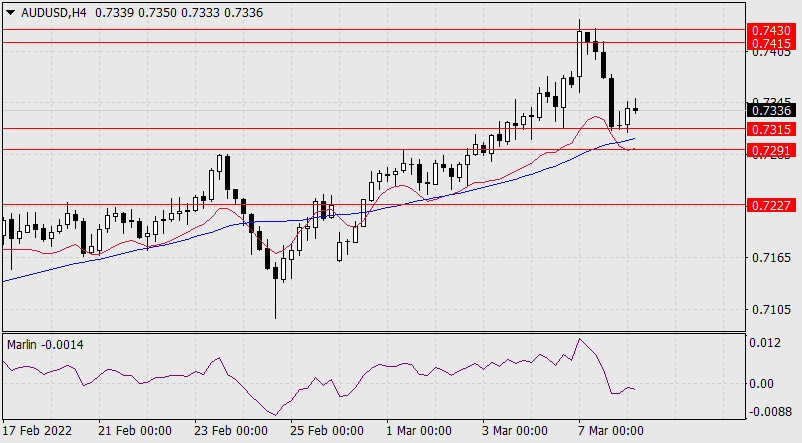
In the four-hour chart, the Marlin oscillator is in the negative area, with sellers trying to push the quote below 0.7291-0.7315. The MACD line is also inside the range, so traders need to have more strength to overcome it. If they succeed, AUD/USD will leave 0.7291 and go to 0.7227.
|
| USDCHF Potential For Reversal | 8th March Posted: 07 Mar 2022 07:24 PM PST
Entry: 0.92833 Reason for Entry:61.8% Fibonacci retracement and 127.2% Fibonacci projection , graphical swing high Take Profit: : 0.91501 Reason for Take Profit:78.6% Fibonacci retracement , 100% Fibonacci projection, Graphical swing low Stop Loss: 0.93361 Reason for Stop Loss: Graphical overlap resistance The material has been provided by InstaForex Company - www.instaforex.com |
| Forecast for USD/JPY on March 8, 2022 Posted: 07 Mar 2022 07:23 PM PST USD/JPY is trading around 115.07. It initially rose by 47 pips on Monday morning, but then fell to 113.36. The point of fluctuation is the area below the MACD line, which is turned downwards in the chart. The Marlin oscillator, on the other hand, is along zero or the neutral line. Obviously, investors are waiting for the Fed's policy decision on March 16. If a rate cut occurs, the stock markets will fall along with the USD/JPY pair.
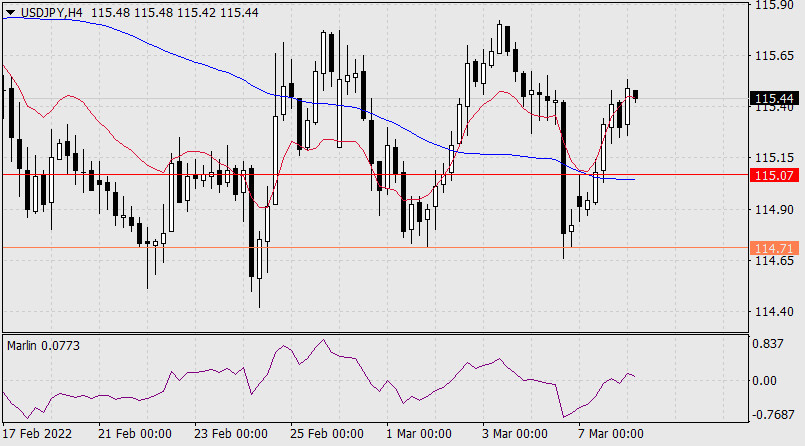
The pair is in an uptrend in the four-hour chart, but its movement is horizontal around the MACD line. The Marlin oscillator could also turn down any moment, the signal for which is a price drop below 114.71.
|
| USDJPY Potential For Bullish Continuation | 8th Mar 2022 Posted: 07 Mar 2022 07:21 PM PST
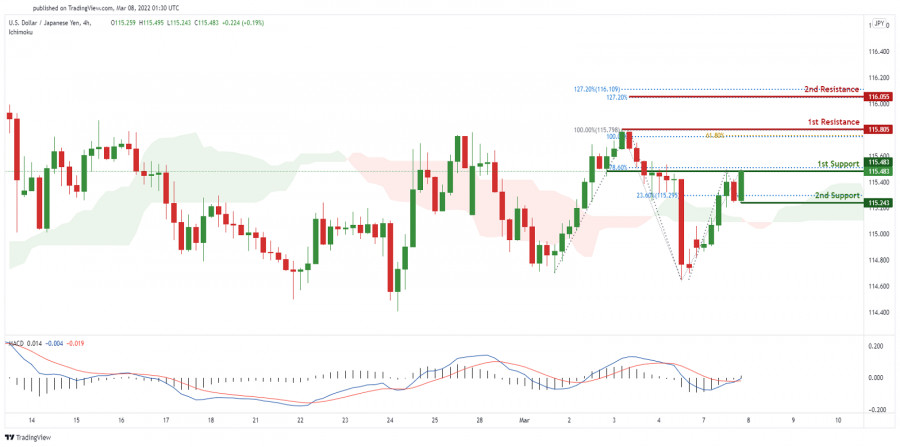
On the H4 timeframe, prices are on bullish momentum. We see the potential for further bullish momentum from our 1st support at 115.483 in line with 78.6% Fibonacci retracement towards our 1st resistance at 115.805 which is an area of fibonacci confluences. Our bullish bias is further supported by prices trading above our Ichimoku cloud support and also MacD being on bullish momentum. Alternatively prices may dip to our 2nd support at 115.243 in line with 23.6% Fibonacci retracement. Trading Recommendation Entry: 115.483 Reason for Entry: 78.6% Fibonacci retracement Take Profit: 115.805 Reason for Take Profit: Area of fibonacci confluences Stop Loss: 115.243 Reason for Stop Loss: 23.6% Fibonacci retracement The material has been provided by InstaForex Company - www.instaforex.com |
| ETHUSD, Bearish Pressure | 8th March 2022 Posted: 07 Mar 2022 07:17 PM PST
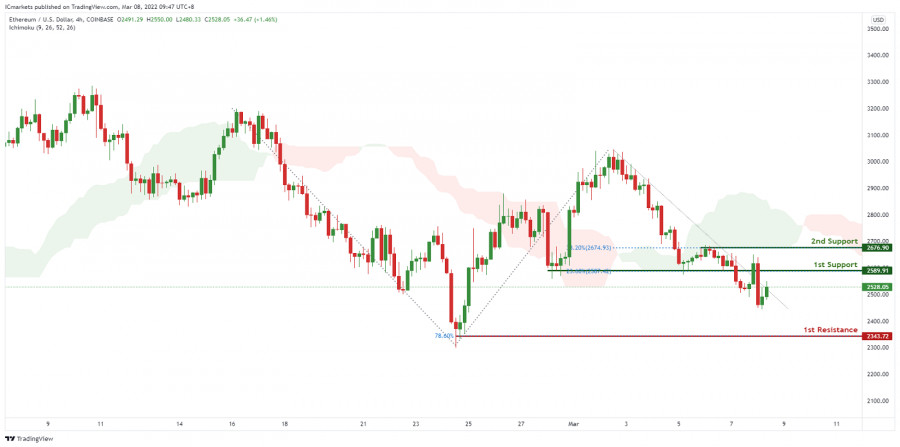
On the H4,with price moving below the Ichimoku cloud, we have a bearish bias that price will drop to our 1st support at 2343 in line with the 78.6% Fibonacci retracement and horizontal overlap support from our 1st resistance at 2589 in line with the horizontal overlap resistance and 23.6% Fibonacci retracement. Alternatively, price may break 1st resistance and head for 2nd resistance at 2676 in line with the horizontal swing high resistance and 38.2% Fibonacci retracement. Trading Recommendation Entry: 2589 Reason for Entry: Horizontal overlap resistance and 23.6% Fibonacci retracement Take Profit: 2343 Reason for Take Profit:Horizontal overlap support and 78.6% Fibonacci retracement Stop Loss: 2676 Reason for Stop Loss:Horizontal swing high resistance and 38.2% Fibonacci retracement The material has been provided by InstaForex Company - www.instaforex.com |
| Overview of the GBP/USD pair on March 8, 2022 Posted: 07 Mar 2022 06:19 PM PST
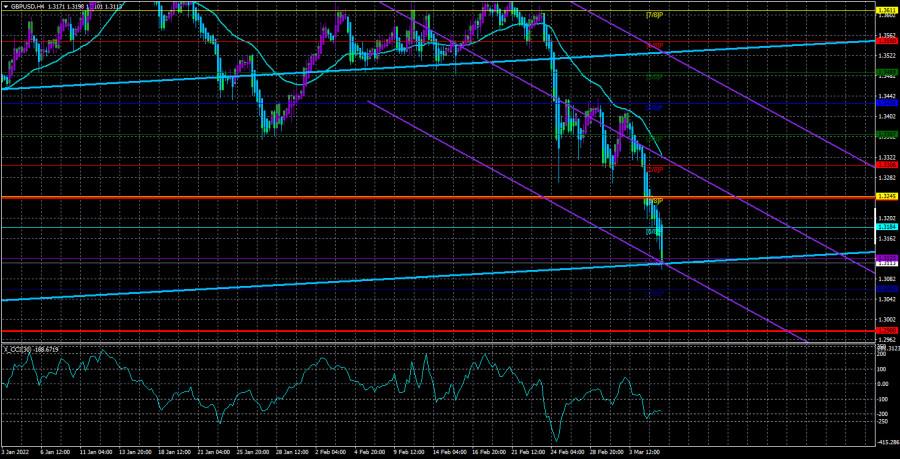
The GBP/USD currency pair did not even qualify for a correction on Monday. The pair started the decline at night and continued it all day. However, the correction for the European currency is very weak, so it's not quite right to say now that the euro currency is being adjusted, but the pound is not. It is correct to say that both currencies continue to fall strongly against the US dollar. And it's not their fault at all. Recall that the euro and the pound are not falling because of any macroeconomic events or reporting. They are falling simply because the demand for the dollar is growing every day. The US dollar continues to be the "reserve currency" for the whole world, and it is difficult to find a more dangerous geopolitical situation than now in Eastern Europe. Recall that we are talking about a full-scale war in the very center of Europe. We are talking about an invasion of a neighboring state. Naturally, Western leaders impose sanctions against the Russian Federation in batches, breaking even more logistics and production chains and leaving the Russian market. This is more than a stressful situation for markets and investors. However, this can be seen in any instrument and any market. Cryptocurrencies as a whole have continued to fall in the last few months (and it hasn't even reached the Fed rate hike yet), stock markets are declining, the raw materials and oil market are growing, Russian markets are falling into the abyss. What does this mean? The flow of capital from one instrument to another, the flow of capital from one market to another. Thus, the foreign exchange market also gets it. Here, too, there is a flow and inflow of capital into dollars. And the pound and the euro, it turns out, just happened to be at the wrong time and in the wrong place. Although this situation cannot even be considered beneficial for the States. Recall that Donald Trump has repeatedly stated that the States do not need an "expensive" dollar. This was explained by the fact that America has a very high public debt that should be serviced and the more expensive the dollar, the more difficult it is to do it. Nothing has changed now. Only the debt has grown and it is already 30 trillion. American inflation. There will be an extremely small number of important statistics this week. In the UK, economic publications are scheduled only for Friday. On this day, GDP and industrial production will be known. Recalling previous similar reports, we can assume that there will be no market reaction to them. The market is now too keen on the dollar and the US currency is growing even without the help of a "foundation". And strong statistics from the UK will be able to raise the rate of the British currency by 50 points no more. Therefore, this data will not affect anything in any case. Especially now. In the US this week, it will be possible to pay attention only to the inflation report, which will be released on Thursday. The consumer price index is expected to grow to 7.9-8.0% y/y by the end of February. That is, it will not even lose its growth rate and, as it were, will send "greetings" to Jerome Powell, who recently announced that he would support a rate hike of only 0.25% at the Fed meeting on March 15-16. Earlier, Powell repeatedly said that "the growth of inflation is a temporary phenomenon" and only in January admitted that the interpretation of "temporary" was wrong. Well, the beginning of 2022 shows the whole world that all economic forecasts for this year can be safely thrown into the trash. To at least stop the current inflation in the States, the rate needs to be raised to at least 1%. And such a value can be achieved only in the summer. It's hard to even imagine how much inflation will be in the summer. Apart from inflation, there will be no more important publications in the US. On Friday, the consumer sentiment index from the University of Michigan will be released, but who can be interested in it at all now? Therefore, geopolitics and the inflation report in the States will be in the first place this week.
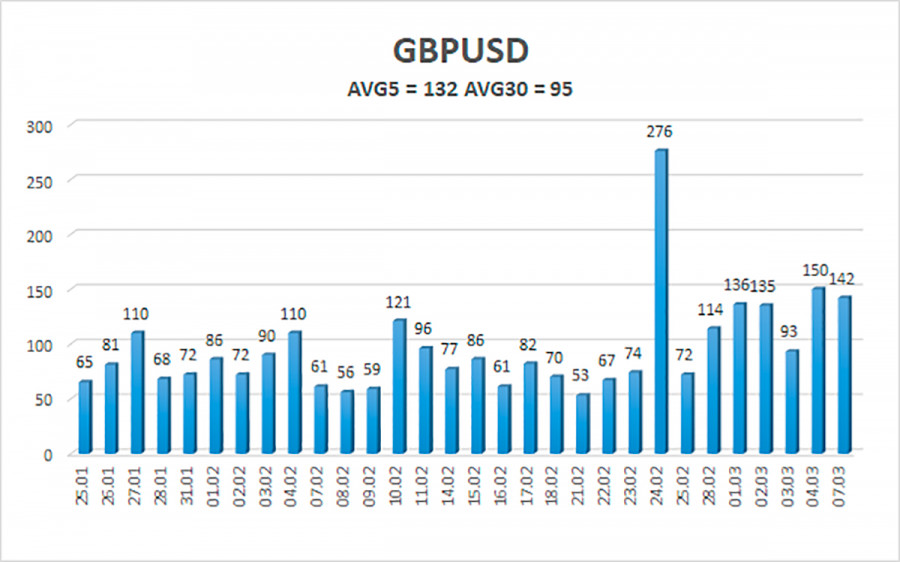
The average volatility of the GBP/USD pair is currently 132 points per day. For the pound/dollar pair, this value is "high". On Tuesday, March 8, thus, we expect movement inside the channel, limited by the levels of 1.2980 and 1.3242. A reversal of the Heiken Ashi indicator upwards will signal a round of corrective movement. Nearest support levels: S1 – 1.3123 S2 – 1.3062 Nearest resistance levels: R1 – 1.3184 R2 – 1.3245 R3 – 1.3306 Trading recommendations: The GBP/USD pair continues its strong southward movement on the 4-hour timeframe. Thus, at this time, you should stay in new sell orders with targets of 1.3062 and 1.2980 until the Heiken Ashi indicator turns up. It will be possible to consider long positions no earlier than fixing the price above the moving average with targets of 1.3367 and 1.3428. Explanations to the illustrations: Linear regression channels - help determine the current trend. If both are directed in the same direction, then the trend is strong now. Moving average line (settings 20.0, smoothed) - determines the short-term trend and the direction in which trading should be conducted now. Murray levels - target levels for movements and corrections. Volatility levels (red lines) - the likely price channel in which the pair will spend the next day, based on current volatility indicators. CCI indicator - its entry into the oversold area (below -250) or into the overbought area (above +250) means that a trend reversal in the opposite direction is approaching. The material has been provided by InstaForex Company - www.instaforex.com |
| Overview of the EUR/USD pair. March 8. ECB meeting. Posted: 07 Mar 2022 06:19 PM PST
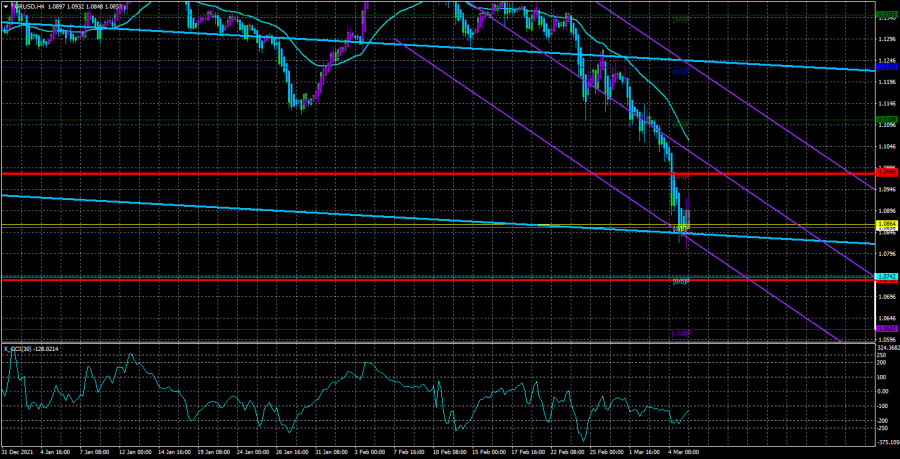
The EUR/USD currency pair performed two scenarios at once on Monday. We said that a correction may begin on Monday since the macroeconomic background will be absent on this day. However, the pair first managed to fall even more (the fall began at night) and only then began the correction. To be honest, at the moment, this meager correction looks like bullying. However, the latter is practically not on the market now. Although even this judgment is not entirely true. Recall that according to COT reports, the "bullish" mood among the major players is intensifying. It turns out to be an absolute paradox, which, however, we have already observed earlier. On the one hand, professional traders continue to open long contracts for the euro, and on the other hand, the euro is falling. We have already seen something similar in 2020-2021, when the US currency was falling, ignoring any data from COT reports. Then the Fed pumped money into the American economy (simply printed it), so no matter what traders did, the dollar was still getting cheaper as the money supply grew. Now we see what the QE program has resulted in. Inflation is off the scale because 7.5% for the States is a lot. How to stop inflation is completely unclear. There is economic growth, but if rates are raised at each meeting, it will slow down and the question arises to what extent the Fed will be able to raise rates and whether this increase will be enough to bring inflation back to the target value. Moreover, it should be remembered that Jerome Powell and Christine Lagarde have repeatedly stated over the past few months that inflation will sooner or later begin to slow down by itself. Naturally, they implied that oil and gas prices would stop rising and supply chains would recover. It is now clear that these forecasts of Lagarde and Powell are simply worth nothing, because oil almost every day updates its cost maximums (as well as gas), and even greater difficulties may arise with supply chains because Russia is now, in fact, isolated from the whole world. In general, the year 2022 brought even more problems to the economy, although it has just begun, and now, probably, many would agree to the continuation of the pandemic, which everyone somehow very quickly forgot about, in exchange for the removal of geopolitical tensions in Eastern Europe. What should traders expect this week? In short, nothing good. In terms of macroeconomic statistics and fundamental background, there will not be a single more or less significant event in the European Union. There will only be an ECB meeting and a subsequent speech at a press conference by Christine Lagarde. But even this, of course, is a "high-profile event" we do not consider important. What could theoretically happen? It's nothing. Christine Lagarde and her colleagues have repeatedly stated that the rate will not be raised in 2022. That's all, it can diverge. The PEPP program, which was supposed to end in March, is no longer of interest to anyone. The APP program will have to be in effect for the entire current year, but now the European Union and the ECB have so many geopolitical problems that it's kind of a shame to even talk about any quantitative stimulus programs there. The only thing that can attract attention is the change in the rhetoric of ECB head Lagarde. But what reason do we have to expect her rhetoric to change to a more "hawkish" one? We believe that none. This issue should be based on the state of the European economy. Recall that in the 4th quarter of 2021, GDP grew by 0.3%. It's practically nothing. With such economic growth, raising the rate is practically suicide. Inflation continues to rise, but there is simply nothing to fight it with if you do not raise the rate. In the end, it all boils down to the fact that either there will be some kind of surprise (probability 5%), or there will be nothing interesting at all (probability 95%). Thus, geopolitics will be in the first place this week.
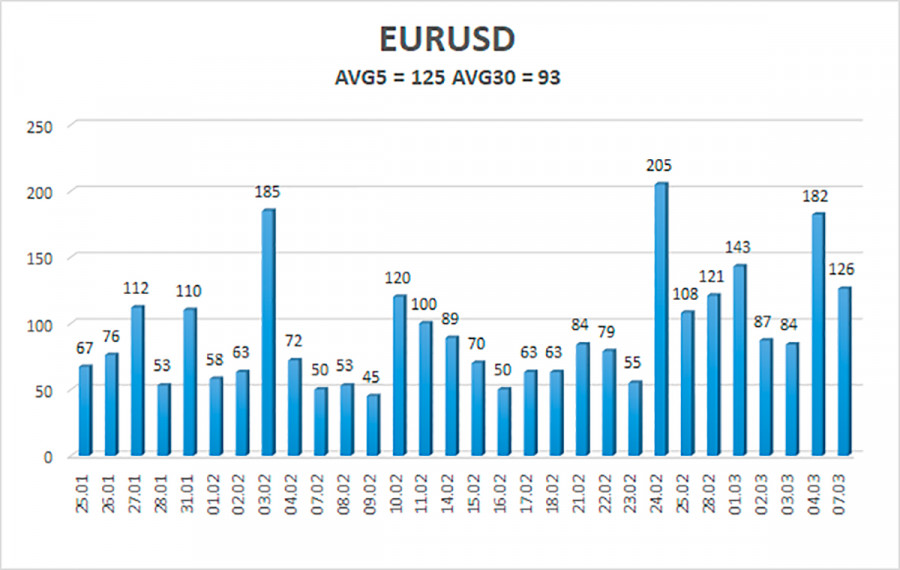
The volatility of the euro/dollar currency pair as of March 8 is 125 points and is characterized as "high". Thus, we expect the pair to move today between the levels of 1.0738 and 1.0982. The upward reversal of the Heiken Ashi indicator signals a round of corrective movement. Nearest support levels: S1 – 1.0864 S2 – 1.0742 S3 – 1.0620 Nearest resistance levels: R1 – 1.0986 R2 – 1.1108 R3 – 1.1230 Trading recommendations: The EUR/USD pair continues its strong downward movement. Thus, it is now possible to stay in short positions with targets of 1.0742 and 1.0620 until the Heiken Ashi indicator turns up. Long positions should be opened no earlier than the price-fixing above the moving average line with targets of 1.1108 and 1.1230, which is not expected in the coming days. Explanations to the illustrations: Linear regression channels - help determine the current trend. If both are directed in the same direction, then the trend is strong now. Moving average line (settings 20.0, smoothed) - determines the short-term trend and the direction in which trading should be conducted now. Murray levels - target levels for movements and corrections. Volatility levels (red lines) - the likely price channel in which the pair will spend the next day, based on current volatility indicators. CCI indicator - its entry into the oversold area (below -250) or into the overbought area (above +250) means that a trend reversal in the opposite direction is approaching. The material has been provided by InstaForex Company - www.instaforex.com |
| Posted: 07 Mar 2022 06:19 PM PST Analysis of GBP/USD 5M. The GBP/USD currency pair also tried to adjust on Monday but eventually collapsed even more. The fall began immediately at the opening of trading on Monday night. There were strong downward movements and strong upward pullbacks. No important macroeconomic events were planned on Monday in either the UK or the US. Nevertheless, as we can see, now traders do not need them to actively trade the pair. All pairs. The military conflict in Ukraine continues, although in recent days, admittedly, they have started shooting much less. However, this does not mean that tomorrow Kyiv and Moscow will sign a truce and that will be the end of it. The positions of the parties to the conflict differ radically from each other. There were three trading signals during the past day. And, at least, the first two leave much to be desired. At first, the pair gained a foothold below the 1.3170-1.3185 area, which should have been used to open short positions. The price managed to go down about 20 points, which was barely enough to set the Stop Loss to zero, according to which the deal eventually closed. Then a buy signal was formed when the price was fixed above the level of 1.3185. This time, traders were also frankly lucky, as the price went up 21 points, which again allowed them to set a Stop Loss at breakeven, at which the transaction closed. The third sell signal should have already been ignored since twice traders exited Stop Loss trades. However, it was the third signal that turned out to be profitable. As a result, traders did not receive a loss on Monday, but they also failed to close in profit. COT Report: The latest COT report on the British pound showed an increase in bullish sentiment among professional traders. And a week earlier - the strengthening of the "bearish" mood. In general, the mood of the major players changes too often, which is seen by the two indicators in the illustration above. At the moment, the net position of the "Non-commercial" group is near zero, which means a "neutral" mood. The same conclusion is confirmed by the absolute data on the number of open contracts. There are 51 thousand of them for purchase now, and 50 thousand for sale. That is almost complete equality. Moreover, since July last year, professional traders have not been able to decide where to trade the British pound. Only in December, there was a serious strengthening of the "bearish" mood, which led to a significant drop in the UK currency. The rest of the time, the players cannot decide in the medium term what to do with the pound. Therefore, the absence of a strong fall in the British pound partly corresponds to the COT reports. However, we still believe that COT reports are not the best tool for forecasting right now. At a time when the whole world is increasing demand for the dollar as a reserve currency, we can expect growth of this particular currency, despite any data from COT reports. This is exactly the picture we are seeing now in the euro currency, where purchases are growing, and the currency itself is falling at the same time. Thus, geopolitics remains in the first place in terms of importance. Analysis of GBP/USD 1H. A downward trend is also visible to the naked eye on the hourly timeframe, but now there is also a downward trend line that visualizes the trend well. The price overcame the levels of 1.3170 and 1.3185 and these were the last actual levels. There are simply no lower levels since the price has not been so low for a very long time. Therefore, all transactions below this area will have to be closed only manually. On March 8, we highlighted the following important levels: 1.3170-1.3185, 1.3273, 1.3367. The Senkou Span B (1.3457) and Kijun-sen (1.3267) lines can also be signal sources. Signals can be "bounces" and "surmounts" of these levels and lines. It is recommended to set the Stop Loss level to breakeven when the price passes in the right direction by 20 points. The lines of the Ichimoku indicator can move during the day, which should be taken into account when determining trading signals. Also in the illustration, there are support and resistance levels that can be used to fix profits on transactions. There are no major events or publications scheduled for Tuesday in the UK and the US. Thus, during the day, traders will be able to pay attention again only to geopolitical news. We believe that the probability of a stronger correction is high, especially for the pound, but Monday showed that traders are ready to sell the pair further, regardless of the need to adjust. Explanations to the illustrations: Price levels of support and resistance (resistance /support) - thick red lines, near which the movement may end. They are not sources of trading signals. Kijun-sen and Senkou Span B lines - the lines of the Ichimoku indicator, transferred to the hourly timeframe from the 4-hour one. Are strong lines. Extreme levels - thin red lines from which the price bounced earlier. They are sources of trading signals. Yellow lines - trend lines, trend channels, and any other technical patterns. Indicator 1 on the COT charts - the net position size of each category of traders. Indicator 2 on the COT charts - the net position size for the "Non-commercial" group. The material has been provided by InstaForex Company - www.instaforex.com |
| Posted: 07 Mar 2022 06:19 PM PST EUR/USD 5M analysis. During the first trading day of the week, the EUR/USD pair started falling again from the very opening of the market. During the day, it made more attempts to continue its downward movement, but still adjusted slightly at the end of the day. It is hardly possible to say now that this is the end of the fall of the European currency. Most likely, the bears just took a little break. As we expected yesterday, Monday was in a correction, but the volatility was still very high. Unfortunately, the pair is now at such price values where there is not a single extreme level because the last time the price was at these levels was more than a year ago. Therefore, no trading signals were generated on Monday. Perhaps for the best. At the same time, the third round of negotiations between Kyiv and Moscow ended in Belarus. As we expected, there are no serious achievements and progress. The parties continue to stand their ground, which means that the military conflict persists. The Russian ruble on Monday fell to 150 rubles for 1 dollar and the general panic in the markets of the Russian Federation persists. Experts admit that the Russian currency can easily fall to 300 rubles for 1 dollar. This means that there is no question of any reassurance now. Accordingly, this mood may be reflected in the international currency market. COT Report: The new COT report, which was released on Friday, showed a new strengthening of the "bullish" mood among professional traders. This time, the Non-commercial group has opened about 16 thousand contracts for purchase and 6.8 thousand contracts for sale. Thus, the net position increased by another 9 thousand, which is clearly visible on the second indicator in the illustration above. The total number of purchase contracts exceeds the number of sale contracts by 70 thousand, so now we can really say that a new upward trend is beginning to form. The only problem is that the euro continues to fall, and not grow. And this is an absolute divergence. What are we observing now? We observe that the demand among major players for the euro currency is growing, but at the same time, the euro currency itself is falling. What does this mean? This means that the demand for the US currency is growing at a much higher rate. After all, COT reports reflect exactly the demand for the euro currency, not taking into account the dollar. And the dollar is now used by the whole world as a reserve currency. In a difficult geopolitical situation, the demand for the dollar is only growing, which is why we are seeing such a picture. Based on this, we can conclude that now COT reports cannot be considered in order to predict the further movement of the euro/dollar pair. These reports simply do not coincide with what is happening in the market itself. Therefore, we need to wait for the resolution of the geopolitical conflict in Eastern Europe. EUR/USD 1H analysis. On the hourly timeframe, the downward trend persists, and the price is very far from the trend line. Thus, on the one hand, the pair has room to adjust, and on the other hand, a strong downward trend persists. Geopolitics continues to have a strong impact on the pair and the lack of news about progress in negotiations can only upset traders. The European currency remains at risk. On Tuesday, we allocate the following levels for trading - 1.0729, 1.0767, 1.0990, 1.1057, 1.1144, as well as the Senkou Span B (1.1224) and Kijun-sen (1.0985) lines. There are also auxiliary support and resistance levels, but no signals will be formed near them. The lines of the Ichimoku indicator may change their position during the day, which should be taken into account when searching for trading signals. Signals can be "bounces" and "overcoming" levels-extremes and lines. Do not forget about placing a Stop Loss order at breakeven if the price went in the right direction of 15 points. This will protect against possible losses if the signal turns out to be false. On March 8, only one report will be published in the European Union - the level of GDP for the fourth quarter in the third assessment. Since this is not the first or even the second assessment, we do not expect any reaction from traders. Nevertheless, the pair may continue to trade very actively and volatile, because the geopolitical background is clearly not letting traders go now. Therefore, you can expect strong movements in any direction. It is also necessary to adjust from time to time. Explanations to the illustrations: Price levels of support and resistance (resistance /support) - thick red lines, near which the movement may end. They are not sources of trading signals. Kijun-sen and Senkou Span B lines - the lines of the Ichimoku indicator, transferred to the hourly timeframe from the 4-hour one. Are strong lines. Extreme levels - thin red lines from which the price bounced earlier. They are sources of trading signals. Yellow lines - trend lines, trend channels, and any other technical patterns. Indicator 1 on the COT charts - the net position size of each category of traders. Indicator 2 on the COT charts - the net position size for the "Non-commercial" group. The material has been provided by InstaForex Company - www.instaforex.com |
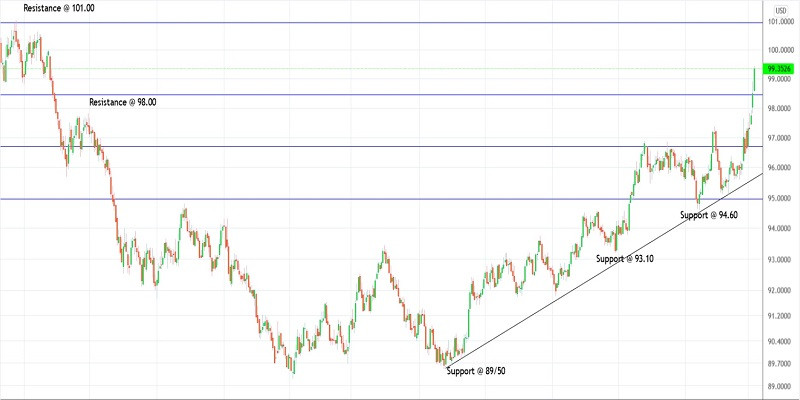
| Trading plan for US dollar index for March 08, 2022 Posted: 07 Mar 2022 04:21 PM PST
Technical outlook:The US dollar ndex has rallied through 99.50-60 zone on Monday as USD strengthened across major currencies. The index is expected to face resistance here and a bearish reversal can be expected soon. If prices continue to push higher from here, the next potential target is 101.00 mark, which is next in-line resistance. The US dollar index has managed to reach fibonacci 0.618 retracement of the entire drop between 104.00 and 89.20 as presented on the daily chart here. High probability remains for a bearish turn from current levels as bears prepare to be back in control. The index is seen to be trading close to 99.35 mark at this point in writing and a close below 98.50 today will produce an engulfing bearish candlestick pattern. If correct, prices will reverse sharply lower from here and drag towards 95.00 initial support in the near term. IT would confirm that bears are back in control and are here to stay for long. Please also note that a break below the trend line support will be encouraging to bears as they drag prices through the 89.20 mark going forward. Trading plan:Potential drop through 95.00 against 100.00 Good luck! The material has been provided by InstaForex Company - www.instaforex.com |
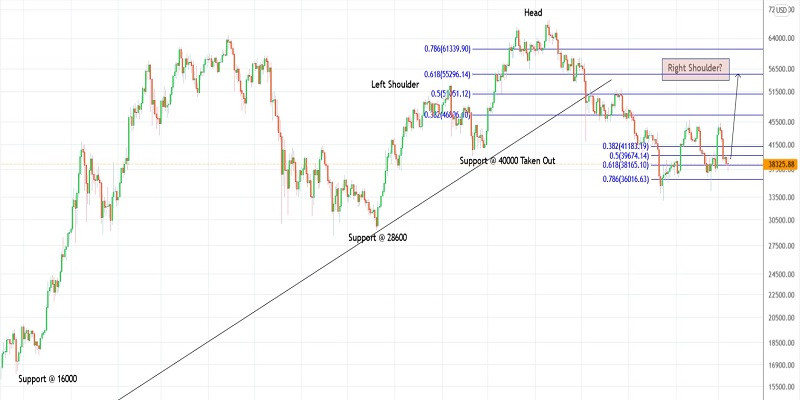
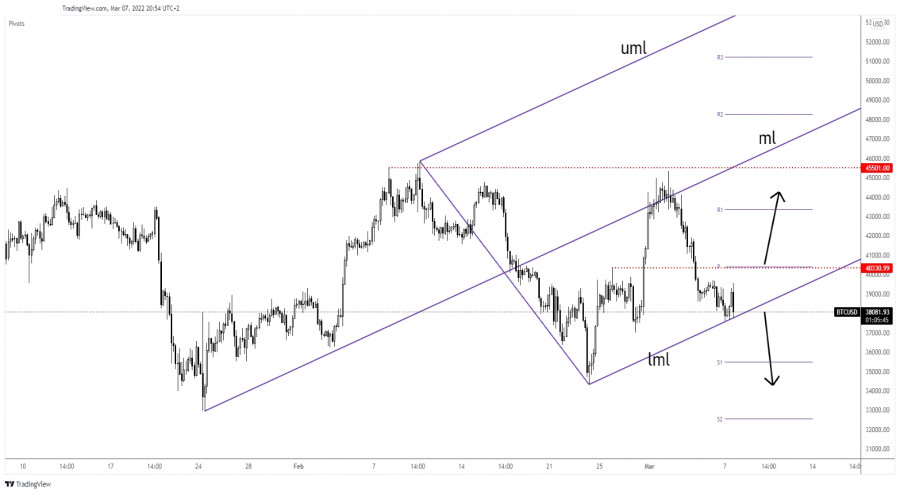
| Trading plan for Bitcoin for March 08, 2022 Posted: 07 Mar 2022 03:57 PM PST
Technical outlook:Bitcoin has dropped through $37,000 levels late on Monday before pulling back through $38,200 mark. The crypto is seen to be trading around $38,200-300 level at this point in writing and is expected to rally beyond $46,000 in the near term. Bulls need to hold prices above the $33,000 mark though to keep the structure intact. Bitcoin has produced a doji candlestick pattern on the daily chart suggesting a potential bullish reversal against $33,000 mark. If correct, bulls will remain inclined to push through $50,000 mark before finding resistance again. Also note that fibonacci 0.618 retracement of the entire drop between $69,000 and $33,000 is seen passing through $55,000 mark. High probability remains for a bearish turn if prices manage to reach the $50,000 mark going forward. Only a push through $61,000 will open the door to print fresh all-time highs above $69,000. For now, possibility remains for a potential Righ Shoulder being carved close to $50,000 mark, and continue the proposed Head and Shoulder reversal pattern. Trading plan:Potential rally through $50,000 against $33,000. Good luck! The material has been provided by InstaForex Company - www.instaforex.com |
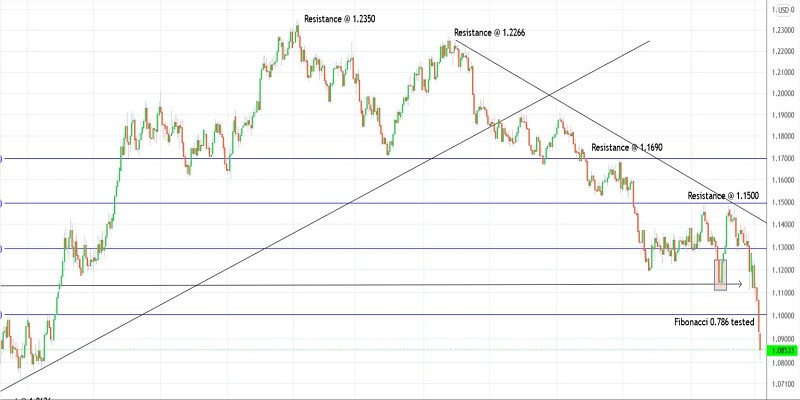
| Trading plan for EURUSD for March 08, 2022 Posted: 07 Mar 2022 03:38 PM PST
Technical outlook:EURUSD seems to have finally carved a meaningful bottom close to 1.0800 mark on Monday. The single currency rallied through 1.0930 levels thereafter and is now pulling back through 1.0850-60 levels before resuming its rally. A daily close above 1.0940 today will also confirm an engulfing bullish reversal candlestick pattern on the daily chart. EURUSD has dropped through the last support zone around fibonacci 0.786 retracement of its earlier rally between 1.0636 and 1.2350 levels. High probability remains for a turn higher from here and push through 1.2350 levels in the next several weeks. Bulls will remain inclined to push through 1.1500 resistance in the near term. A break above 1.1500 will also confirm that EURUSD bulls are back in control and a meaningful bottom is in place. On the flip side, a drop below 1.0800 will open the door to test 1.0636, the March 2020 support. It would be considered bearish for the currency and attract further selling pressure going forward. Trading plan:Potential rally towards 1.1500 against 1.0600 Good luck! The material has been provided by InstaForex Company - www.instaforex.com |
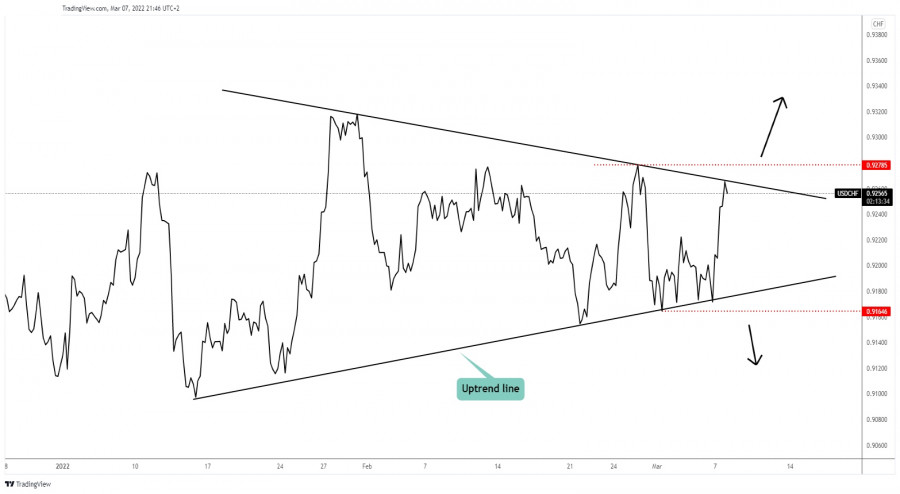
| USD/CHF symmetrical triangle to explode soon Posted: 07 Mar 2022 12:02 PM PST
USD/CHF Sideways Movement!The USD/CHF pair is moving somehow in range. It's located at 0.9256 at the time of writing, right below the downtrend line which represents an upside obstacle. The price registered strong growth after testing and retesting the uptrend line. As you already know from my previous analysis, only stabilizing below the uptrend line and dropping below the 0.9164 former low would have confirmed a larger drop. Technically, escaping from the current sideways movement, from the triangle pattern could bring great trading opportunities. USD/CHF Trading Conclusion!The USD/CHF pair could develop a larger growth if it passes above the downtrend line and if it jumps above 0.9278 former high. This scenario could bring new buying opportunities. The material has been provided by InstaForex Company - www.instaforex.com |
| Bitcoin at crossroads, attention at support Posted: 07 Mar 2022 11:39 AM PST The price of Bitcoin is trading in the red at the time of writing. The pressure remains high, so a deeper drop won't be a surprise. It's trading at 37,934.24 at the time of writing above 37,592.73 today's low. It remains to see what will really happen as the price continues to challenge dynamic support. BTC/USD dropped by 5.31% from yesterday's high of 39,701 to today's low. In the last 24 hours, the crypto is down by 2.11% and by 7.50% in the last 7 days. Bitcoin's drop caused the altcoins to drop as well. BTC/USD Sellers In Control!
BTC/USD is putting pressure on the ascending pitchfork's lower median line (lml) which represents dynamic support. After failing to stabilize above the ascending pitchfork's median line (ml), a sell-off was expected. Dropping below 40,330.99 static support signaled a potential drop at least till the pitchfork's lower median line (lml). A valid breakdown below this dynamic support could open the door for a larger drop. Only staying above it may announce a new bullish momentum. BTC/USD Outlook!The pressure is high after failing to make a new higher high. As you can see on the H4 chart, BTC/USD is moving somehow sideways. A valid breakdown below the lower median line (lml) could announce a potential deeper drop towards the 34,324.05 lower low. A false breakdown below the lower median line (lml) may announce that the sell-off ended and that the price of Bitcoin is developing a new leg higher. The material has been provided by InstaForex Company - www.instaforex.com |
| Ichimoku cloud indicator analysis on Ethereum for March 7, 2022. Posted: 07 Mar 2022 08:17 AM PST Ethereum remains in a bearish trend. Recently Ethereum price entered the Ichimoku cloud turning trend to neutral from bearish. Ethereum bulls tried to push price higher above $3,000 but price got rejected at the Ichimoku cloud resistance.
|
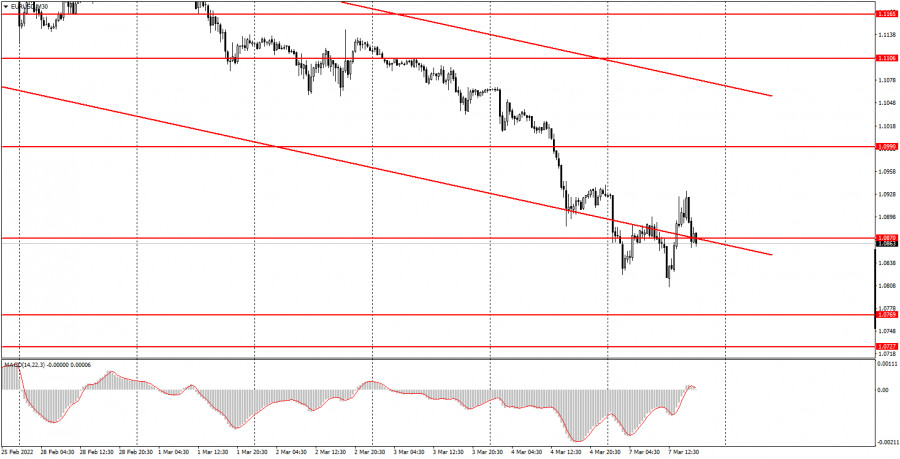
| EURUSD reached 1.0850 support trend line. Posted: 07 Mar 2022 08:12 AM PST EURUSD remains under heavy pressure. Trend remains bearish. Price continues making lower lows and lower highs. Price has reached the final support for bulls at 1.0850. Failure to respect this support level will be a very bearish sign for the future of EURUSD.
Blue line- support trend line EURUSD has so far retraced more than 78.6% of the entire upward move from 1.0637 to 1.2350. Price has now reached the trend line connecting the long-term lows from 2017 and 2020. Bulls need to step in to defend support. A reversal and bounce off this trend line is justified. The RSI is close to cancelling its bullish divergence. If price bounces towards 1.10 this week, then the RSI wouldn't make a lower low. So far there is no sign of a reversal. There is no sign of a bounce yet. If there is a bounce coming, it should come from the 1.0850-1.09 price level. The material has been provided by InstaForex Company - www.instaforex.com |
| Ichimoku cloud indicator analysis on Gold for March 7, 2022. Posted: 07 Mar 2022 08:05 AM PST Gold price briefly passed above the $2,000 level today but is now trading around $1,980. Short-term trend remains bullish as price continues to make higher highs and higher lows. Gold price continues to trade above the 4 hour Kumo (cloud). There is no sign of weakness.
|
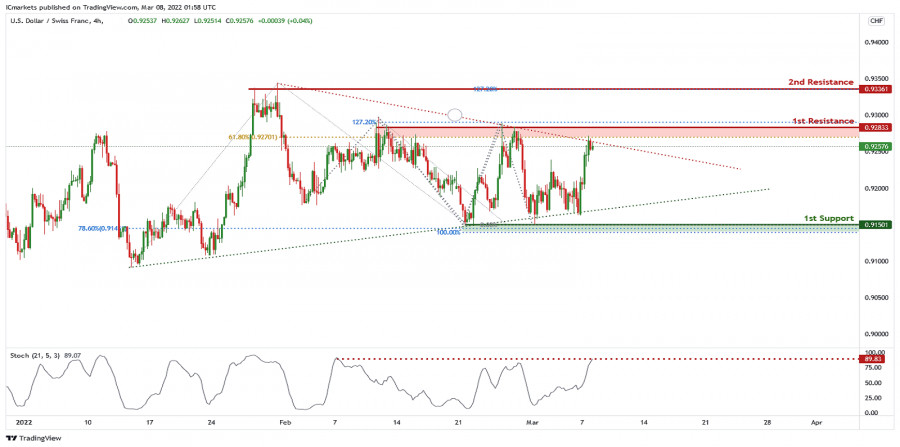 On the H4 , price is trading in a triangle and near 1st resistance level of 0.92833 in line with 61.8% Fibonacci retracement and 127.2% Fibonacci projection . Price can potentially dip to the 1st support of 0.91501 in line with 100% Fibonacci projection and 78.6% Fibonacci retracement. Our bearish bias is supported by the stochastic indicator as it is at resistance level. Alternatively, price can rally to the 2nd resistance level of 0.93361 in line with 127.2% Fibonacci projection.Trading Recommendation
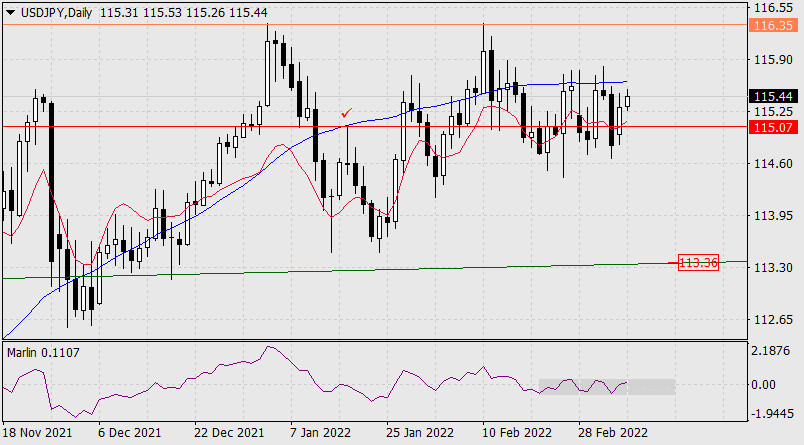
| You are subscribed to email updates from Forex analysis review. To stop receiving these emails, you may unsubscribe now. | Email delivery powered by Google |
| Google, 1600 Amphitheatre Parkway, Mountain View, CA 94043, United States | |


Comments