Forex analysis review
Forex analysis review |
- EUR/USD: Will consolidation range expand?
- US stock market rises after NATO summit
- XAU/USD: strong upward momentum
- GBP/USD: trading plan for North American session on March 25, 2022. Overview of morning trading
- Oil could cost $200-250 by the end of 2022
- EUR/USD: trading plan for US session on March 25 (morning trades analysis). Euro plummets after German economic data release
- Trading tips for gold
- Oil production grew much faster in the first quarter, but so did costs
- GBP/USD technical analysis and outlook for March 25, 2022
- USD/CHF deeper drop activated
- Analysis and trading tips for EUR/USD on March 25
- Gold is set to move higher amid running inflation
- Forex forecast 03/25/2022 EUR/USD, EUR/JPY, Gold and Bitcoin from Sebastian Seliga
- Technical analysis of GBP/USD for March 25, 2022
- Technical analysis of AUD/USD for March 25, 2022
- EUR/USD, GBP/USD technical analysis and recommendations on March 25, 2022
- Ethereum further growth activated
- BTC update for March 25,.2022 - Upside objective reached and potential for downside rotation
- GBP/USD update for March 25, 2022 - Breakout of rising trendline in the background
- Daily Video Analysis: GBPUSD, D1 Bearish Channel Selling Opportunity
- Video market update for March 25,,2022
- Analysis of Gold for March 25,.2022 - Upisde objective reached but potential for the downside rotation
- Trading plan for starters of EUR/USD and GBP/USD on March 25, 2022
- Fed prepares tighter monetary policy: how it can affect Bitcoin?
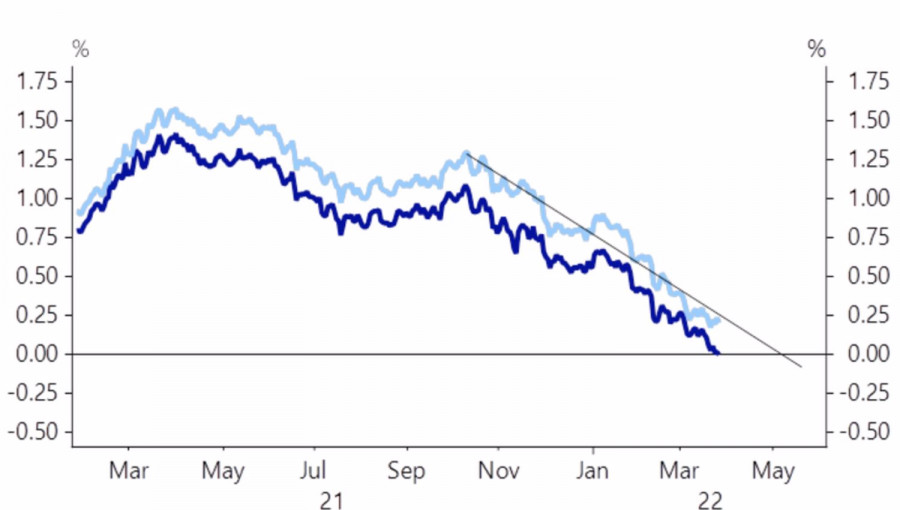
| EUR/USD: Will consolidation range expand? Posted: 25 Mar 2022 06:57 AM PDT Markets often go from the calm before the storm to the storm itself. How strong it will be, no one knows. The busy economic calendar of the week of April 1 only suggests that after marking time in one place, EURUSD will finally move into action. However, when the U.S. dollar fails to develop an advantage and the euro does not want to force things, there is a big risk of expanding consolidation. With talks between Russia and Ukraine stalled, hostilities continue; FOMC members using pronounced hawkish rhetoric, and divergent U.S. and Eurozone business directions hinting at a divergence in economic growth, the fate of the EURUSD pair seems to be predetermined. And if the willingness of St. Louis Fed President James Bullard to raise rates to 3%, and Cleveland Fed President Loretta Mester to exceed the neutral level of 2.5% as quickly as possible, surprises no one, then the aggressive speeches of yesterday's doves, Mary Daly and Charles Evans, indicate that the Fed is determined. The derivatives market gives an almost 75% chance of a 50 basis point increase in borrowing costs in March. In such conditions, the U.S. dollar should grow by leaps and bounds. However, it is not growing. For some reason, investors are confident that a recession will happen in the United States faster than in the eurozone. They are not impressed either by the latter's proximity to the war zone or by the weakness of the German economy. The market is looking closely at the willingness of the yield curve to invert and at the widening spread between consumer confidence and sentiment. The first indicator focuses on employment, the second shows a pronounced sensitivity to prices. U.S. yield curve dynamics
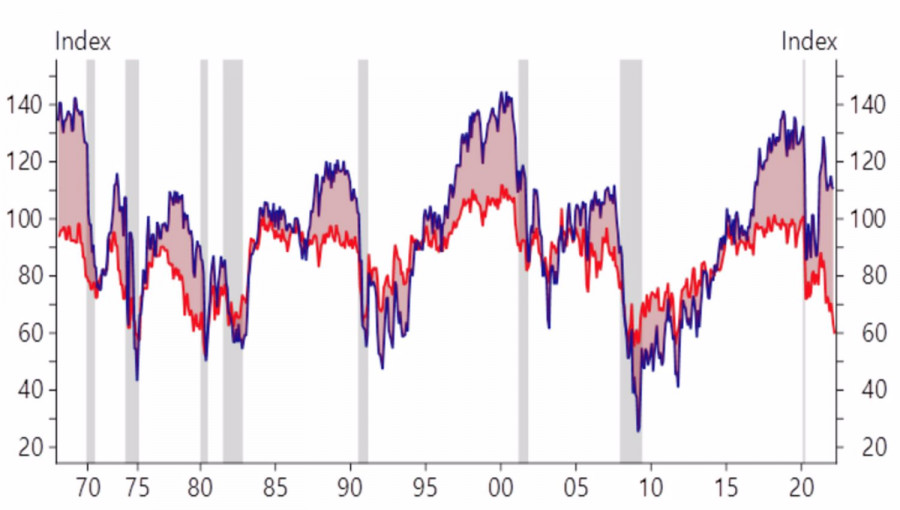
Trends in U.S. Consumer Confidence and Sentiment
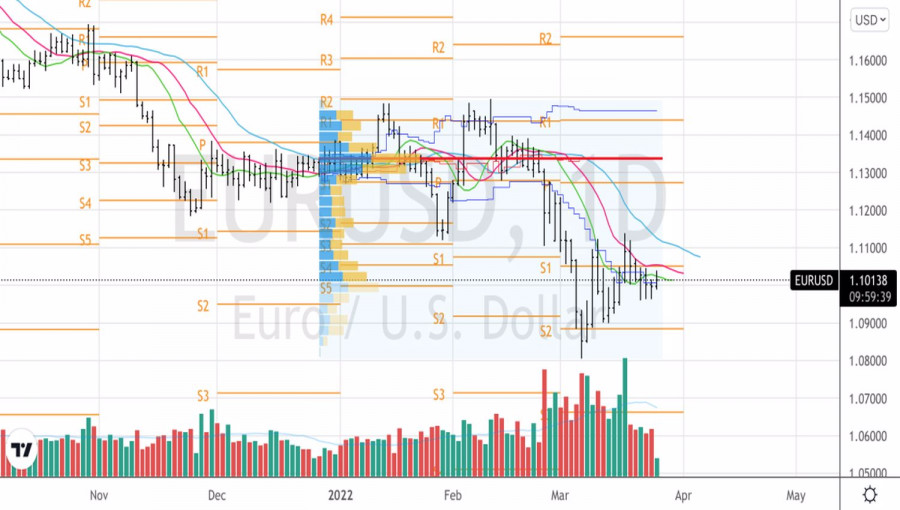
It is curious that a clear understanding of the intentions of the Fed, no matter how terrible they may seem for the economy, leads to an increase in the yield of U.S. Treasury bonds and to the flow of capital into the stock market. Investors are dumping debt and buying equities, fueling a rally in stocks. The associated improvement in global risk appetite allows EURUSD bulls to counterattack. This is how the U.S. dollar weakening scheme works during the Fed's monetary tightening cycle. The problem is that the euro is currently so weak that it simply cannot fully realize it. As a result, other G10 currencies are strengthening against the U.S. dollar. For example, its Australian and New Zealand namesakes. Theoretically, data on German and European inflation, as well as disappointing statistics on the index of personal consumption expenditures and the U.S. labor market, can support the bulls on EURUSD in the week to April 1. Consumer prices in the euro area are at risk of accelerating to a new record peak of more than 6%, which will further scare the members of the Governing Council of the ECB. However, I would not regard the break of resistance at 1.105 as the start of an upward trend. Technically, the EURUSD fell into a consolidation in the range of 1.09-1.114. In my opinion, it can expand it, so it makes sense to sell the euro on the rebound from the resistance at 1.116 and 1.122, or buy it in case of an unsuccessful assault on the supports at 1.092 and 1.088. EURUSD, Daily chart
|
| US stock market rises after NATO summit Posted: 25 Mar 2022 06:24 AM PDT US indices gained on Thursday because no sharp statements and actions were made at the NATO summit. However, shares of energy companies fell as natural gas prices dipped after the US and the European Union announced plans to cut European countries off Russian supplies.
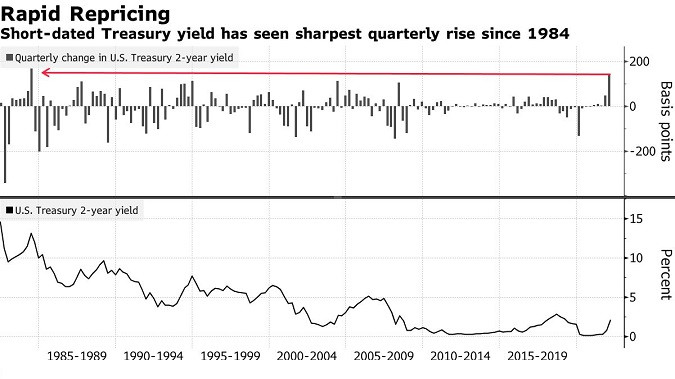
Meanwhile, Treasury yields have risen even though they have remained on one of the worst quarterly tracks since the early 1970s. The dollar index, on the other hand, fell. Oil also rolled back after the leaders of the European Union refrained from new steps to reduce imports of Russian oil.
Investors continue to grapple with the geopolitical situation, which caused higher commodity costs that have fueled expectations of higher inflation and more aggressive Fed rate hikes. Key parts of the US Treasury yield curve continue to flatten or invert, sparking debate about whether the bond market will prompt a sharp slowdown in the economy, or even cause a recession.
"We think it will happen pretty quickly," said Gene Tannuzzo, global head of fixed income at Columbia Threadneedle Investments. "It doesn't necessarily signal a recession", he added, as "this is a very different cycle and the first time in more than 30 years the Fed is playing catch-up with inflation. The material has been provided by InstaForex Company - www.instaforex.com |
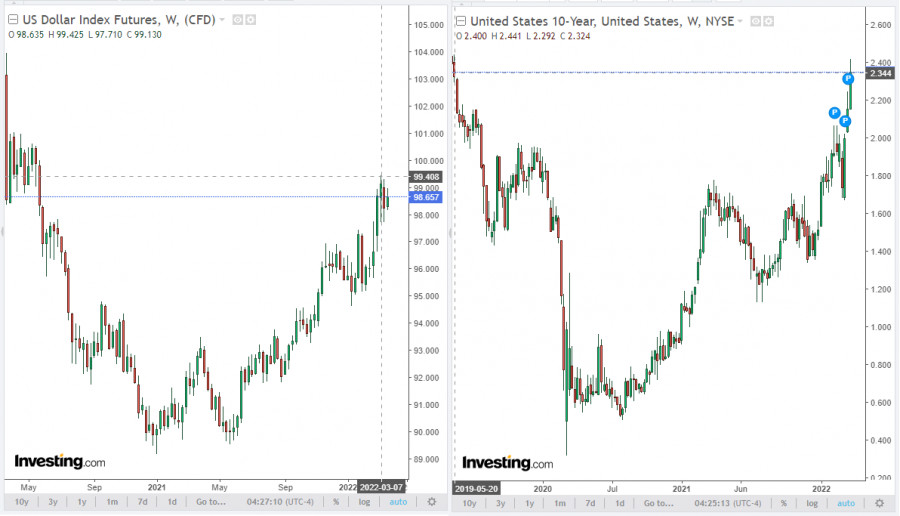
| XAU/USD: strong upward momentum Posted: 25 Mar 2022 05:50 AM PDT The dollar seems to end this week in positive territory despite the decline during the Asian session. Futures for the dollar index (DXY) are trading near 98.66 at the beginning of today's European session, corresponding to levels of almost 2 years ago. The dollar, in particular, is supported by the rising yields of U.S. government bonds. Thus, the yield on 10-year U.S. bonds reached 2.417% this week, continuing to grow since August 2020.
The current levels correspond to the levels of May 2019, when the Fed's interest rate was at 2.50%. On the one hand, investors are actively withdrawing from protective government bonds, preferring the dollar. And on the other hand, we can say that market participants are already taking into account the increase in the Fed's interest rates in prices. As is known (in normal economic conditions), an increase in the interest rate and a tightening of the monetary policy of the central bank contributes to the strengthening of the national currency. During his speeches this week, Fed Chairman Jerome Powell confirmed the possibility of a one-time increase in interest rates by 50 basis points at once. In total, Fed officials are planning 6 more interest rate hikes this year. Thus, by the end of the year, the Fed's interest rate should be at least 2% or more, if it is raised at Fed meetings not by 0.25%, but by 50%. As for gold, it should be noted that it does not bring investment income, but is in active demand in conditions of economic and geopolitical uncertainty. It is also in demand as a protective asset in the face of rising inflation, and its quotes are extremely sensitive to changes in the policy of the world's largest central banks, primarily the Fed. When their interest rates increase, gold quotes usually decrease. Nevertheless, at the moment we are seeing an interesting picture. Despite the fact that the Fed has begun to tighten its monetary policy, and some other major world central banks have signaled their readiness to follow this course as well, gold quotes are not declining, and this month reached an almost 2-year high of $2,070.00 per troy ounce. Recall that the record closing high was reached on August 6, 2020, at $2,069.00.
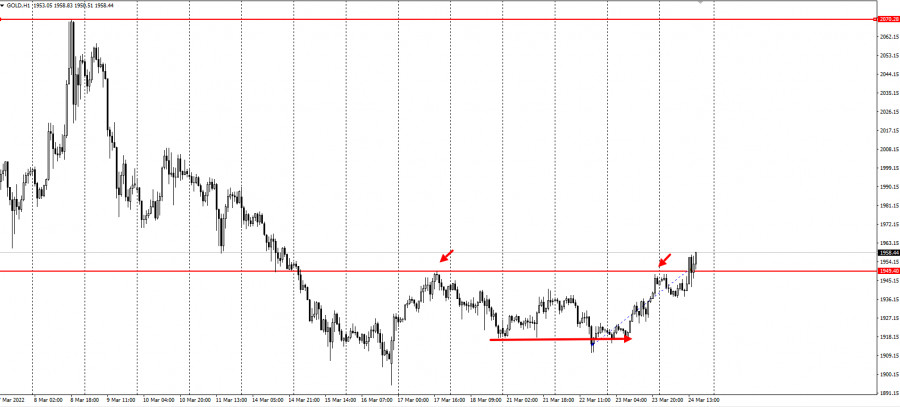
There are several reasons for the growth of gold quotes. One of the main ones is the geopolitical tension in the world and the situation in Ukraine, where Russia is conducting a military special operation, and on the other hand, it is accelerating inflation in the world. As follows from the data published on March 10, the consumer price index (CPI) in the United States in February increased by 7.9% (against 7.5% in January) compared to the same period of the previous year, reaching the highest level in 40 years. In Europe, inflation, which was 5.8% in February, almost three times higher than the ECB's 2% target, is also accelerating rapidly, while the European Central Bank is in no hurry to take measures to contain it, fearing to damage the European economy. Tensions in Ukraine represent a stagflationary shock for Europe, economists say. It increases the risks of a new recession due to restrictions on European exports, problems in supply chains, and rising costs of energy, raw materials for households, and the large industrial sector of the region. Geopolitical tensions remain, taking into account also economic sanctions against Russia. The situation on the raw materials markets remains difficult, since the Russian Federation is one of the largest suppliers of oil and other energy carriers to the European markets. It is obvious that this tension will further inflate inflation, primarily in Europe. However, restrictive measures on Russian energy carriers, primarily oil, create problems for the United States, where the price of gasoline in a number of U.S. states has passed the $6 per gallon mark and is likely to continue to rise, according to economists, further accelerating inflation. Thus, despite the Fed's plans to further tighten monetary policy, there are no strong reasons for a decline in the price of gold. On the contrary, many economists expect its growth to resume, especially if it becomes obvious that the Fed is unable to cope with rising inflation. It seems that investors perceive investments in the precious metal as a hedging and value preservation tool, rather than as a speculative position. One way or another, gold quotes are finishing this week in positive territory with an increase of about 1.5%, near the mark of $1,957.00 per ounce, despite the growth in yields of U.S. government bonds and the dollar. In the current situation, it will be considered expedient to look for opportunities for the best entry into long positions. One of them, in our opinion, will be a decline to the levels of 1,949.00, 1,942.00 and a breakdown of the level of 1,965.00. Technical analysis and trading recommendations
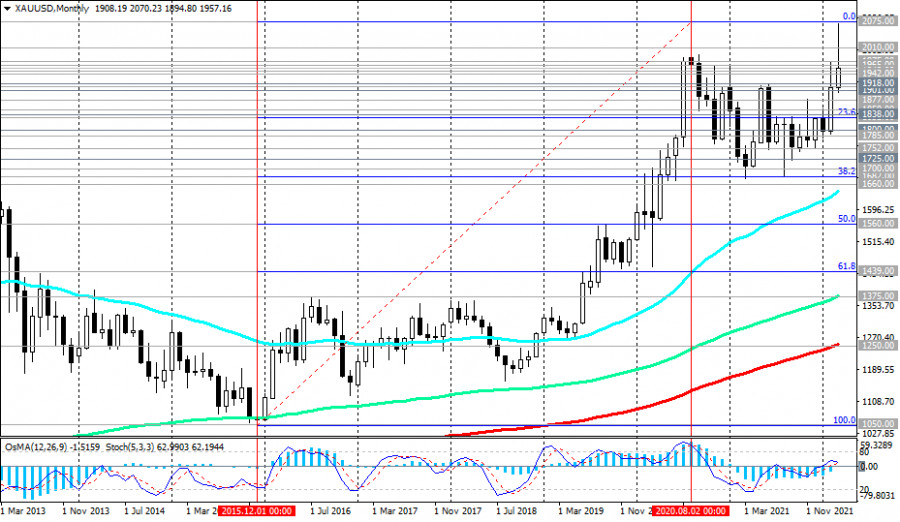
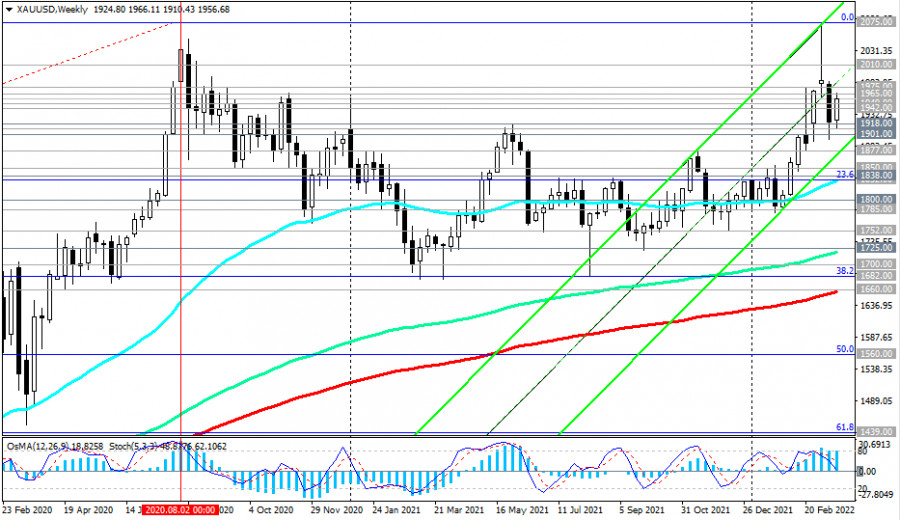
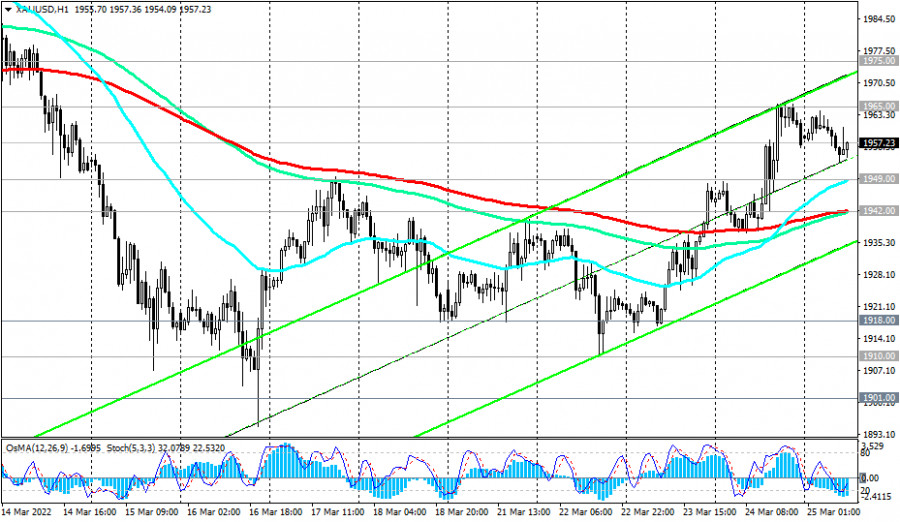
At the time of writing this article, the XAU/USD pair is trading near the 1,957.00 mark, remaining in the bull market zone. A strong upward momentum prevails. In the current situation, long positions look preferable.
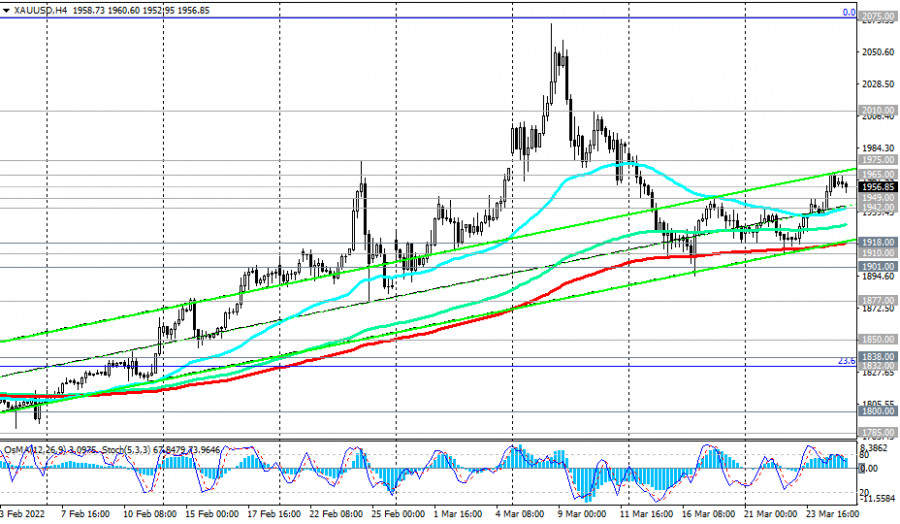
A signal to enter them may be a breakdown of the local resistance level of 1,965.00. However, the decline to short-term support levels of 1,949.00 (200 EMA on the 15-minute chart), 1942.00 (200 EMA on the 1-hour chart, and the lower line of the ascending channel on the daily chart) provides additional opportunities to increase long positions.
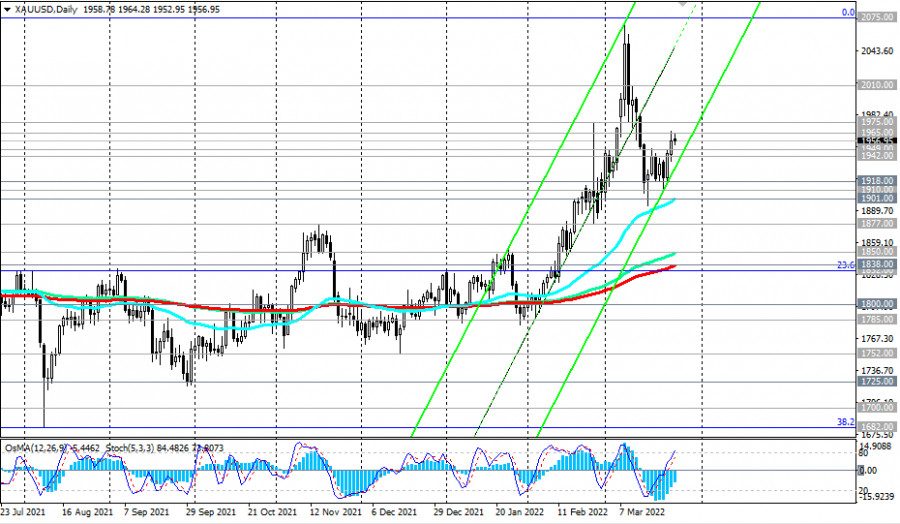
In an alternative scenario, the price will break through the support level of 1,942.00. In this case, the correction may continue to the support levels of 1,918.00 (200 EMA on the 4-hour chart), 1,910.00 (local lows), 1,901.00 (50 EMA on the daily chart). This decrease can probably also be used to increase long positions (near the support levels of 1,918.00, 1,910.00, 1,901.00).
Above the key support level of 1,838.00 (200 EMA on the daily chart), XAU/USD remains in the long-term bull market zone. Only a breakdown of the support levels of 1,682.00 (38.2% Fibonacci level retracement to the growth wave since December 2015 and the mark of 1,050.00), 1,660.00 (200 EMA on the weekly chart) will increase the risks of breaking the long-term bullish trend of XAU/USD. Support levels: 1949.00 1942.00 1918.00 1910.00 1901.00 1877.00 1850.00 1838.00 1832.00 1800.00 1785.00 1752.00 Resistance levels: 1965.00, 1975.00, 2000.00, 2010.00, 2070.00, 2075.00 Trading recommendations XAU/USD: Sell Stop 1935.00. Stop-Loss 1966.00. Take-Profit 1918.00, 1910.00, 1901.00, 1877.00, 1850.00, 1838.00, 1832.00, 1800.00, 1785.00, 1752.00, 1725.00, 1700.00, 1682.00, 1660.00 Buy Limit 1950.00, 1945.00, Buy Stop 1966.00. Stop-Loss 1935.00. Take-Profit 1975.00, 2000.00, 2010.00, 2070.00, 2075.00, 2100.00, 2200.00 The material has been provided by InstaForex Company - www.instaforex.com |
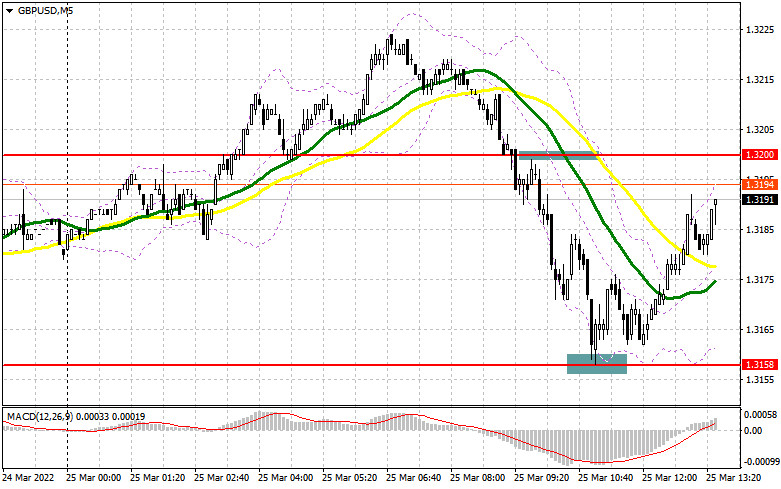
| GBP/USD: trading plan for North American session on March 25, 2022. Overview of morning trading Posted: 25 Mar 2022 05:20 AM PDT When to go long on GBP/USD: In my morning review, I paid attention to levels 1.3200 and 1.3158 and said you should consider entering the market from there. Let's now turn to the 5-minute chart and try to figure out what happened. A fall of the pound after disappointing retail sales data in the UK and a retest of the mark bottom-top produced a sell signal. The pair went down by 40 pips to support at 1.3158. A false breakout there generated a buy signal, and the price rose by 30 pips. Technically, nothing has changed, and the trading strategy is still the same.
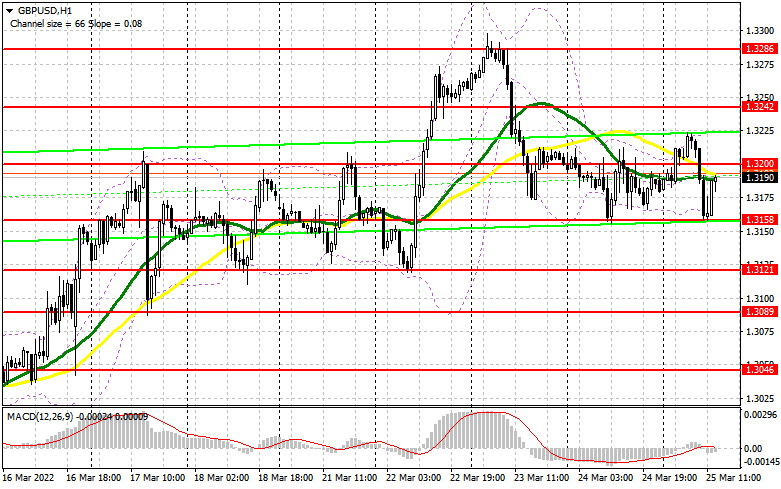
A plunge in UK retail sales became a major contributor to a fall in the pound in the first half of the day. Although for the Bank of England this is definitely good news as they can forget about rising inflation for a moment. Geopolitical developments are again in the view. Today, Russia's Press Secretary Dmitry Peskov said it is too early to talk about the future of peace talks as the reality has changed and a serious reassessment of the current situation is needed. It is unclear what he has meant by that. Macro reports scheduled for release in the US in the second half of the day are highly unlikely to cause a burst of volatility. Therefore, the levels highlighted in the morning are still relevant. Thus, to extend gains, bulls need to regain control over the 1.3200 level. A breakout, consolidation, and a retest of the mark top-bottom will produce a buy signal with the target at 1.3242. The pair will be able to go above the barrier only in the case of a positive fundamental background and increased demand for risky assets, which is unlikely to happen during the North American session. A breakout and a test of the 1.3242 mark will make a buy signal, allowing bulls to approach the area of the 1.3286 and 1.3340 highs. A more distant target stands at 1.3390, where taking a profit should be considered. However, the pair will be able to test it if only some breakthrough is achieved in peace talks between Russia and Ukraine. In the event of bearish GBP/USD during the North American session and a decrease in bullish activity at 1.3200, you may go long when the price has reached support at 1.3158 and a false breakout has occurred. Long positions on GBP/USD could also be entered on a rebound from 1.3121 or the 1.3089 low, allowing a 30-35 pips correction intraday. When to go short on GBP/USD: Bears have reached the target set in the morning and everything now depends on their behavior at the resistance level of 1.3200. It is highly unlikely to be tested in the second half of the day as bulls will try to regain control over the market and extend gains. In the case of a false breakout at 1.3200, the pair may fall to support at 1.3158. A false breakout and a retest of the mark bottom-top will produce an additional sell signal, with targets at the 1.3121 and 1.3089 lows, where you should consider taking a profit. The 1.3046 level serves as a more distant target. In the event of bullish GBP/USD in the second half of the day and a decrease in bearish activity at 1.3200, you could go short when the price reaches resistance at 1.3242, and only if there is a false breakout. Short positions on GBP/USD could be entered on a rebound from 1.3286 or the 1.3340 high, allowing a 20-25 pips correction intraday.
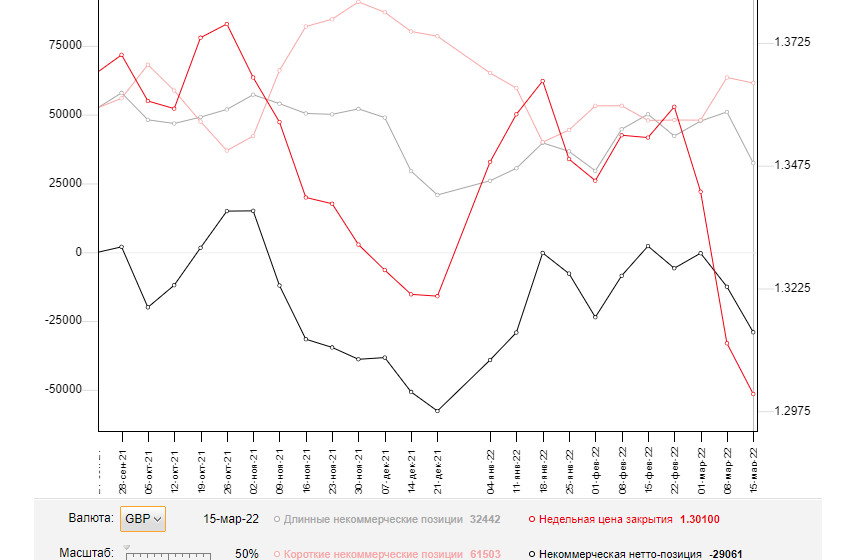
Commitments of Traders: The COT report for March 15 logged a sharp drop in long positions and only small changes in short ones. The results of the BoE meeting avidly affected the British currency. Despite the expected increase in the interest rate, the regulator did not hint at a further tightening of monetary policy. It decided to stick to more dovish rhetoric despite soaring inflation that already reached all-time highs. Falling household income and the worsening standard of living are weighing on the regulator. The regulator is hesitant to take more aggressive measures because of the current geopolitical situation. A more aggressive tightening may harm the economy rather than help it. The regulator needs to find measures to cap rising inflation, avoiding potentially harmful decisions. Many analysts believe that inflation may climb higher in spring. Therefore, traders are in no hurry to buy the pound sterling. Besides, it is losing momentum against the US dollar. The FOMC meeting was in the limelight last week. The watchdog raised the interest rate by 0.25%. This decision did not stir up volatility as many traders had already priced it in. To this end, it is recommended to open long positions on the US dollar as the bearish trend on the GBP/USD pair persists. The only thing that may halt a sell-off of the pound sterling is high inflation. It will eventually force the Bank of England to take a hawkish stance. The COT report for March 15 revealed that the number of long non-profit positions declined to 32,442 from 50,982, while the number of short non-profit positions dropped to 61,503 from 63,508. It increased in the negative delta of the non-commercial net position to -29,061 from -12,526. The weekly closing price dropped to 1.3010 against 1.3113.
Indicator signals: Moving averages Trading is carried out in the area of the 30-day and 50-day moving averages, indicating a sideways market. Note: The period and prices of moving averages are viewed by the author on the hourly chart and differ from the general definition of classic daily moving averages on the daily chart. Bollinger Bands The lower band at 1.3160 stands as support. Resistance is seen at 1.3230 in line with the upper band. Indicator description:
|
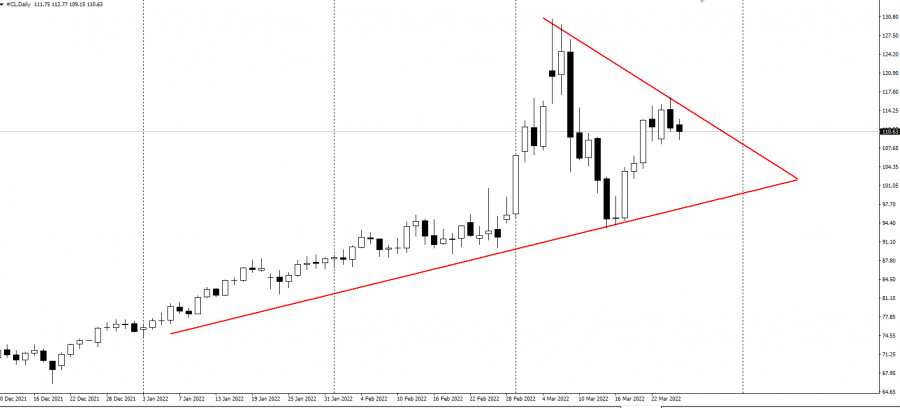
| Oil could cost $200-250 by the end of 2022 Posted: 25 Mar 2022 05:18 AM PDT
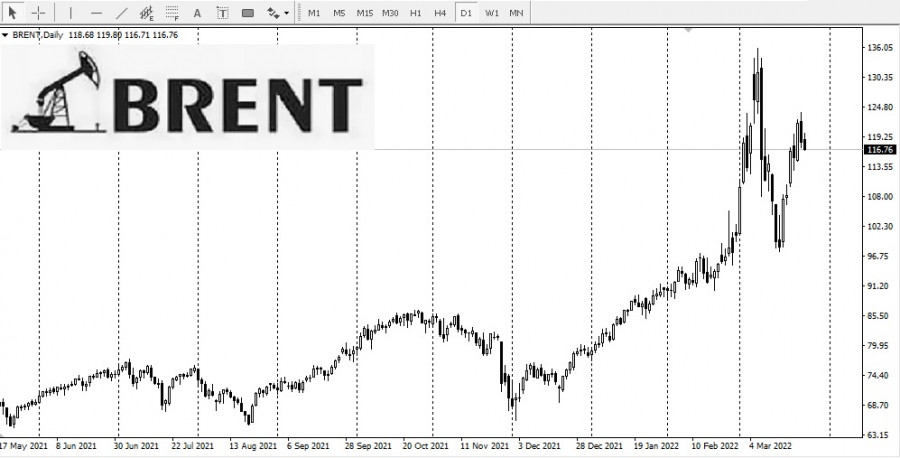
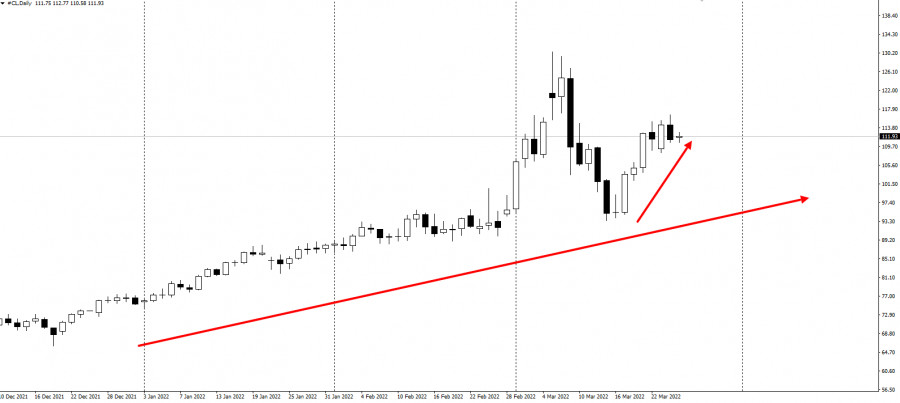
Some of the world's largest oil traders are expecting prices to exceed $200 a barrel by the end of this year. Pierre Andurand, a hedge fund manager, said it may be because supplies will probably come from Europe from now on. Andurand made his first prediction at $200 a barrel, saying it would be difficult for producers to replace Russian oil as it exits the market. He is not the only one who expect such prices, as RCMA Group Chairman Doug King said crude oil could rise to $200 before reaching $250 by the end of the year.
A little earlier this March, there was a forecast that the price of Brent would reach $200 by April. But it was probably a reaction to the US measures implemented because of the conflict in Ukraine, so now that initial shock has subsided, prices are likely to fall from their record highs. However, the upside potential remains significant because, according to economists, about 3 million bpd of Russian oil will leave the market, and such cannot be replaced quickly and easily. The material has been provided by InstaForex Company - www.instaforex.com |
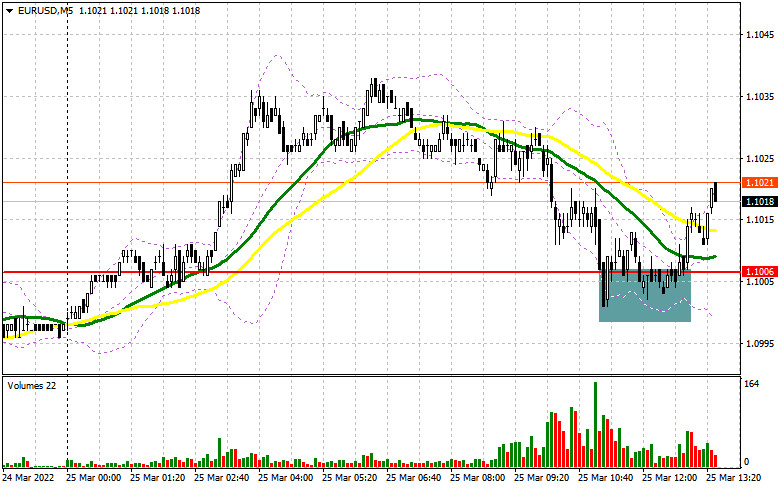
| Posted: 25 Mar 2022 05:01 AM PDT Long positions on EUR/USD: In my forecast this morning, I drew your attention to the level of 1.1006 and recommended entering the market from it. Let's have a look at the 5-minute chart and analyze what happened. The weak IFO data from Germany disappointed investors because the report was much worse than economists forecasted. Against this backdrop, the euro plummeted to the support area at 1.1006, where bulls created a false breakout and an excellent buy signal to continue the pair's recovery. At the moment, the pair humped by more than 15 pips. Technically, nothing much has changed, as well as the plan for the second half of the day.
As noted above, the German business conditions indicator and the economic expectations indicator were so weak that even the most pessimistic economists did not expect such a sharp drop. Nevertheless, pressure on the euro was rather moderate. Due to geopolitical tensions, the readings might have been much worse. Today the press secretary of the President of the Russian Federation Dmitry Peskov said that it was too early to speak about the future of the negotiations on the security guarantees because the reality had changed and a serious reassessment was needed. What he meant by that is not clear yet, but it is definitely nothing good in his words. The possible prolongation of the negotiations by the Ukrainian authorities is the reason for this kind of statement. So far, the market has not reacted to all of this, but tensions are likely to gradually rise. This may hurt risky assets in the short term. Against this background, the bulls need to hold the price above support at 1.1006. They succeeded in the first half of the day. As long as trading is carried out above this level, we can expect a recovery of the euro to the new swing high at 1.1050. The repeated falling down to 1.1006 is unlikely to occur today because of the fundamental US statistics, as the report on home sales has no major impact on the currency market. If euro buyers do not continue to take active actions to strengthen the pair, only in this case we will see a test of 1.1006. I would not count on this level in the afternoon. Only a false breakout there, similar to the one I described above, may lead to a larger increase in the EUR/USD pair, with an upside target of 1.1050. A breakthrough and a test of this level are likely to create a buy signal and open the way to the pair's recovery to the area of 1.1091. The next target is the monthly high at 1.1136, where traders may lock in profits. A breakthrough of this range will cancel the bearish trend and trigger sellers' stop-loss orders, opening a direct way to the highs of 1.1181 and 1.1227. However, this scenario is unlikely to be implemented at the end of the week. If the pair declines and bulls are not so active at 1.1006, and that is where the moving averages are passing, which are playing on their side, it is better to postpone opening long positions. A false breakout of the low at 1.0968 would be the best buy scenario, but you can go long from 1.0928 on a rebound, allowing an upward intraday correction of 30-35 pips. Short positions on EUR/USD: Bears almost reached their main goal, as they only tested 1.1006 failing to consolidate below this level. If the pair rises in the afternoon, a false breakout at 1.1050 may trigger a sell signal with the target at the support of 1.1006. Considering this, there are not many US statistics during the US session, the lack of activity and a return to 1.1006 may ruin bulls' plans, forcing them to take profit at the end of the week. A reverse test bottom/top of this level is likely to create an additional signal for opening short positions, and there is also a chance of going back to the lower boundary of the sideways channel at 1.0968. A breakthrough of this level is likely to trigger some stop-orders of bulls, which will cause a nosedive to the higher levels at 1.0928 and 1.0891. Once the pair hits 1.0855, it would be better to lock in profits. If the euro grows and bears show weak activity at 1.1050, bulls may continue to build up long positions, counting on a return to the monthly highs. In such a case, it is best not to hurry up with selling the pair. It is also possible to open short positions if a false breakout at 1.1091 occurs. Selling the EUR/USD on the rebound is possible from 1.1136, or higher at 1.1181, allowing a downward correction of 20-25 pips.
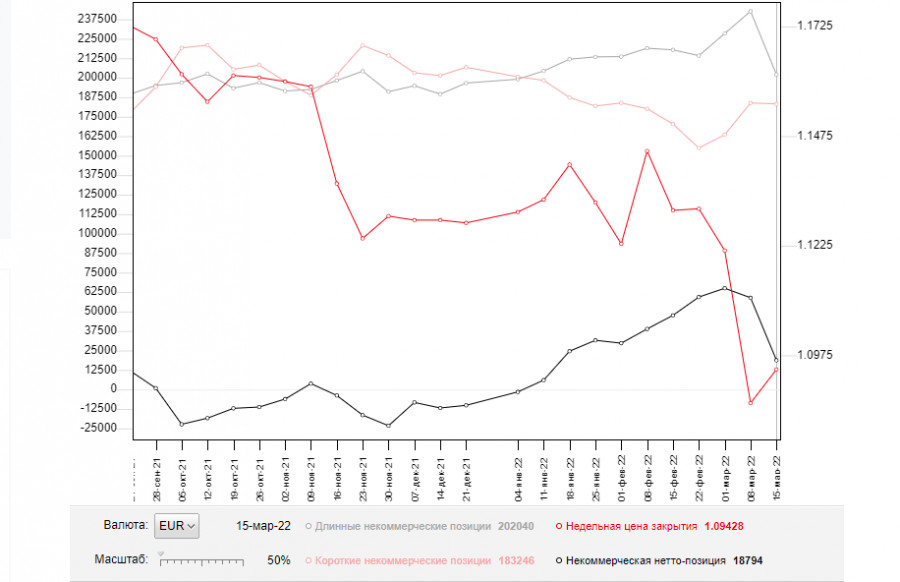
The COT (Commitment of Traders) report for March 15 showed a decrease in both long and short positions. However, if you look at the readings, you can see that the reduction of short positions was only slight, unlike the long ones, which slumped significantly. This was not surprising, against the background of the Russian special military operation in Ukraine. The Federal Reserve meeting was the central event of last week. As a result, the committee raised interest rates by 0.25%, which did not lead to serious changes in the market, as many had expected such decisions. Fed Chairman Jerome Powell took a wait-and-see approach during his speech, failing to signal a more aggressive policy, which triggered a build-up of long positions in risky assets. However, at the beginning of this week, the Fed Chairman changed his approach saying in the interview that there was a high probability of a 0.5% point hike at the next FOMC meeting. It was a strong bullish signal for USD, which is likely to continue its rise against the euro. Recently, the European Central Bank also held a meeting. President Christine Lagarde announced plans for a more aggressive tapering of economic support measures and interest rate hikes. It turned out to be good for the medium-term outlook of the European currency, which is already heavily oversold against the US dollar. The COT report showed that long non-commercials fell to 202,040 from 242,683, while short non-commercials declined to 183,246 from 183,839. At the end of the week, total non-commercial net positioning was down to 18,794 against 58,844. The weekly closing price rose slightly to 1.0942 from 1.0866.
Signals of indicators: Moving Averages Trading is conducted above the 30- and 50-day moving averages, which indicates the sideways market. Note: The period and prices of moving averages are considered by the author on the one-hour chart that differs from the general definition of the classic daily moving averages on the daily chart. Bollinger Bands If the price rises, the upper boundary of the indicator located at 1.1015 will act as a resistance level. A breakthrough of the lower boundary at 1.0970 is likely to cause a larger sell-off in the euro. Description of indicators
|
| Posted: 25 Mar 2022 04:22 AM PDT
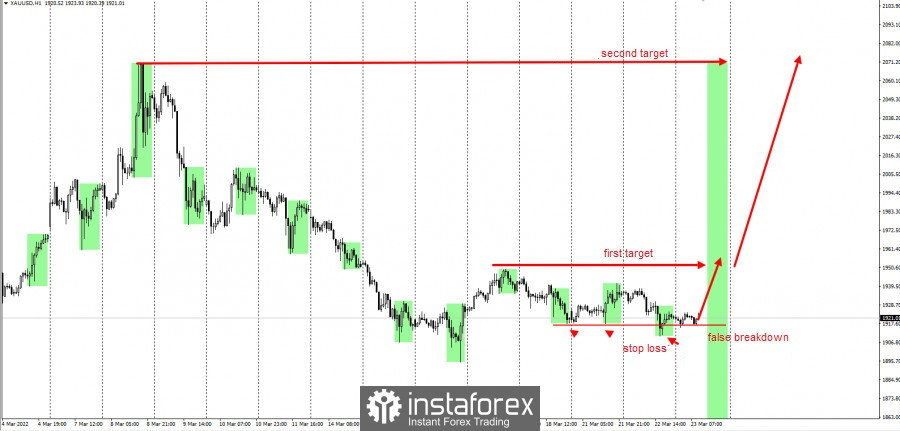
Gold rallied after the NATO summit on Thursday, breaking through $1,950, the first target presented at the trading plan last Wednesday. Plan:
Development:
Congratulations to those who followed the idea as gold moved by more than 350 pips! For those who have not taken profits, close part of your position at current prices. Then, wait for the second target, which is the high of 2020 and 2022 - $2,075. This idea is based on the Price Action and Stop Hunting strategies. Good luck and have a nice day! The material has been provided by InstaForex Company - www.instaforex.com |
| Oil production grew much faster in the first quarter, but so did costs Posted: 25 Mar 2022 03:58 AM PDT
US crude oil production grew much faster in the first quarter, but so did costs, said the Dallas Federal Reserve. Nevertheless, price sentiment was optimistic as the majority of survey respondents expect that by the end of 2022, WTI would cost between $80 and $90 per barrel. A minority of those surveyed, which was approximately 5%, assumed that by the end of 2022 WTI would cost between $110 and $120. Interestingly, most of the respondents believed that the benchmark price in the US would stop at more than $120 per barrel.
Another result from the survey is that about 41% believe that the price of WTI, which is in the range of $80 to $100, is enough for more producers to ramp up output. Although the Dallas Fed's own data confirms this, the US government says production is not growing fast enough. However, about 30% respondents said production plans do not depend on oil prices. 59% explained that the main reason for limited production was pressure from investors to maintain capital. Respondents also cited labor shortages, limited availability of equipment, disruptions in the supply chain, and social, environmental and governance concerns as other reasons to be wary of production growth. According to the Dallas Fed's latest data, crude oil production jumped to 45 in the first quarter of 2022, from 19.1 in the fourth quarter of 2021. The natural gas production index, meanwhile, jumped from 14 to 40 in the same period. Costs also rose to a record high of 77.1, from 69.8 in the fourth quarter of 2021. The Dallas Fed said the cost of oilfield services has been rising for five consecutive quarters. The material has been provided by InstaForex Company - www.instaforex.com |
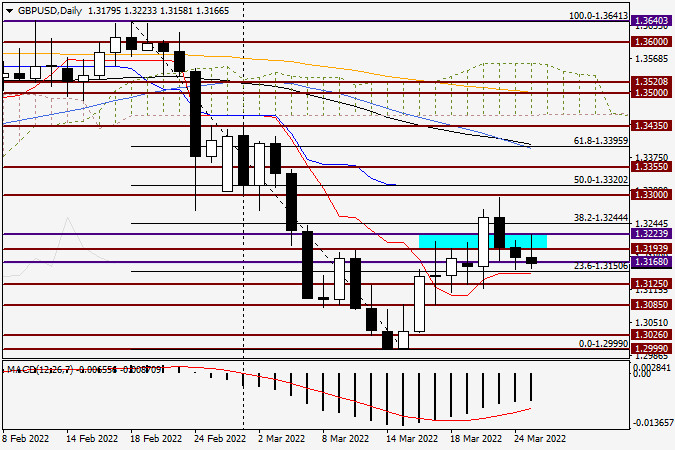
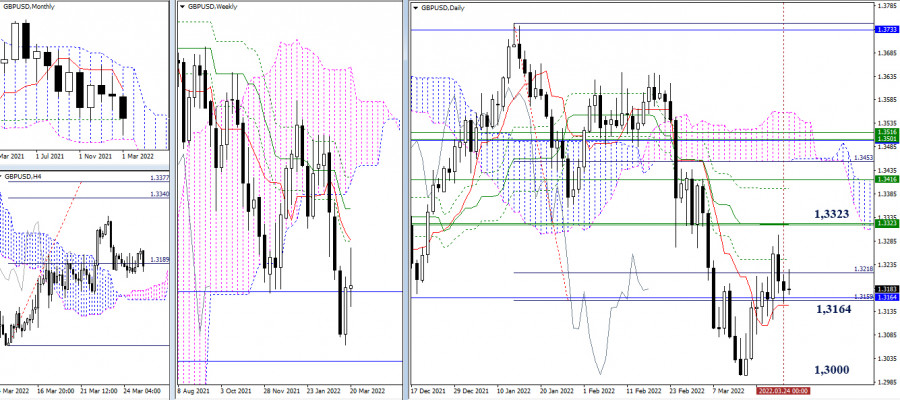
| GBP/USD technical analysis and outlook for March 25, 2022 Posted: 25 Mar 2022 03:04 AM PDT Today, we will again focus on high inflation in the UK, take a look at the economic calendar, and discuss how the week may end for the GBP/USD pair. Inflation in the UK remains high which is confirmed by the CPI report for February. It is logical to assume that market participants would have expected the Bank of England to take aggressive measures to tackle inflation. However, it seems that investors have shrugged off the report on consumer prices. Such a neutral reaction of the market may be due to several factors. Either the price growth has already been priced in by investors, or traders have simply ignored it. However, this report may affect the trajectory of the pair later. The latter scenario seems very unlikely, but I would not completely dismiss it. Recently, market participants have shown mixed reaction to the incoming macroeconomic news, downplaying it most of the time. Annual inflation growth to 6.5% poses a challenge to the Bank of England who needs carefully consider its every step. As I have already mentioned in my previous reviews, some investors expect the UK regulator to raise the interest rate by 25 basis points at its meeting on May 5. However, the BoE may hesitate to take such aggressive measures due to the weak economic growth. For instance, today's data on retail sales also fell below expectations. Thus, retail sales in the UK declined by 0.3% month-on-month, while analysts predicted a 0.6% increase. In annual terms, the indicator came in below the forecast of 7.8% and stood at 7%. In the US, two reports can be mentioned today: the University of Michigan's sentiment index and pending home sales. In addition, San Francisco Fed President John Williams and Richmond Fed President Thomas Barkin will make statements today. Daily chart
Yesterday, the pound bulls lost control. The shape of the candlestick formed on March 24 proves this fact. At the start of the trading, the pair advanced to 1.3212, but then the market sentiment changed sharply towards the US dollar. As a result, GBP/USD closed the session at 1.3179. A similar scenario is repeated today. Although the pair managed to rise higher to 1.3223, it made a strong pullback afterward. At the moment of writing, GBP/USD was trading near 1.3166. Such a price dynamic confirms the strength of bearish resistance at 1.3200-1.3225. If the pound bulls manage to move above this price zone, this will open the way towards another key technical level of 1.3300. If the current decline continues, the pair may find support at the red Tenkan line of the Ichimoku Indicator located at 1.3148. On the weekly chart, I saw a candlestick with no body and long shadows, with the upper shadow being much longer. Such a mixed picture discourages me from opening new positions, especially on the last day of the week. I think we should stay out of the market for now and wait for the final closing price of the week. Let's hope that on Monday the situation will be clearer. Have a good day! The material has been provided by InstaForex Company - www.instaforex.com |
| Posted: 25 Mar 2022 02:52 AM PDT
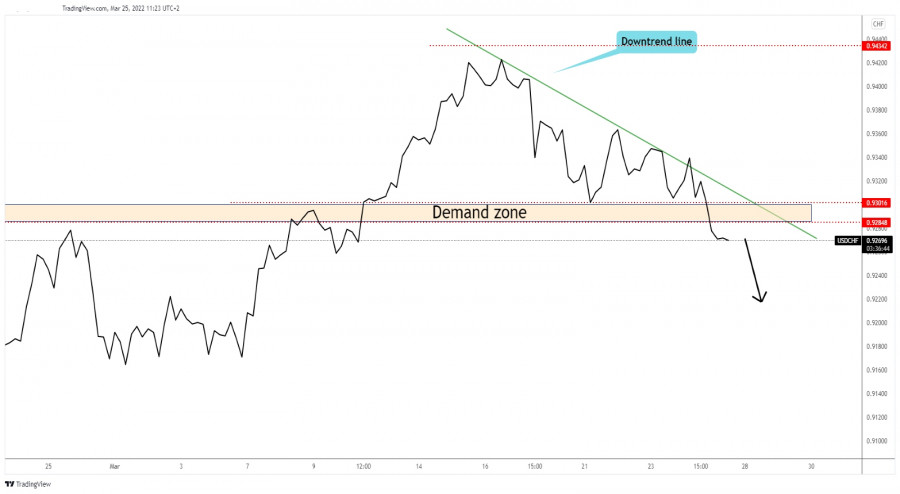
USD/CHF New Downtrend!The USD/CHF pair drops at the time of writing after ignoring the 0.9284 - 0.9301 demand zone which represented a downside obstacle. As you can see on the H4 chart, the price tested and retested the downtrend line which acts as a dynamic upside obstacle. I've told you in my previous analyses that staying below the downtrend line and dropping below the demand zone may activate more declines. USD/CHF Trading Conclusion!After dropping below the demand zone, the rate could try to come back to test and retest the broken levels before resuming its sell-off. Technically, the current breakdown may activate a larger drop as long as it stays below the downtrend line and could help the sellers to catch a downwards movement. The material has been provided by InstaForex Company - www.instaforex.com |
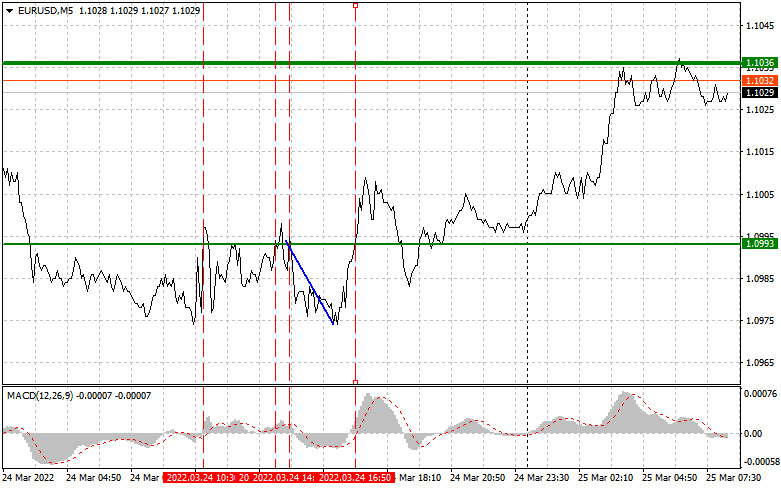
| Analysis and trading tips for EUR/USD on March 25 Posted: 25 Mar 2022 02:50 AM PDT Analysis of transactions in the EUR / USD pair A signal to buy emerged after EUR/USD hit 1.0993. It coincided with the MACD line being in a good area, but surprisingly no increase happened, leading to losses. The second and third test of the level took place at the moment when the MACD line went far enough from zero, so sell-offs happened in the market. The third one even resulted in a 20-pip drop in price. Meanwhile, the fourth prompted another signal to buy, but the indicator being far from zero limited the upside potential of the pair.
Thursday's economic bulletin from the European Central Bank was ignored, as well as the data on activity in the manufacturing and service sectors of the eurozone countries. This is because it is obvious that the indicators will diverge from preliminary estimates due to the very poor geopolitical situation in the world. The same thing happened with the US data released in the afternoon, even though the figures exceeded forecasts. Nothing happened in EUR/USD because demand for dollar did not return, and trade remained within the side channel. Reports on business environment in Germany, assessment of current situation and economic expectations will be released today, and it is likely that those will lead to a decline in EUR/USD because all can collapse very seriously. Meanwhile, the volume of lending in the private sector and change in the M3 aggregate of the money supply are unlikely to have any impact on the market, as will the reports on the US real estate market. Most likely, attention will continue to be focused on the development of the geopolitical situation in the world, as well as statements by Fed representatives regarding the future of the US monetary policy. For long positions: Buy euro when the quote reaches 1.1039 (green line on the chart) and take profit at the price of 1.1075 (thicker green line on the chart). A rally to new weekly highs is possible if Germany publishes strong data on its economy. But before buying, make sure that the MACD line is above zero or is starting to rise from it. It is also possible to buy at 1.1015, but the MACD line should be in the oversold area as only by that will the market reverse to 1.1039 and 1.1075. For short positions: Sell euro when the quote reaches 1.1015 (red line on the chart) and take profit at the price of 1.0969. Pressure is likely to return at any moment because market participants prefer safe assets than risky ones at the moment, especially in anticipation of the Fed's aggressive policy and weak data on the German economy. But before selling, make sure that the MACD line is below zero, or is starting to move down from it. Euro can also be sold at 1.1039, however, the MACD line should be in the overbought area, as only by that will the market reverse to 1.1015 and 1.0969.
What's on the chart: The thin green line is the key level at which you can place long positions in the EUR/USD pair. The thick green line is the target price, since the quote is unlikely to move above this level. The thin red line is the level at which you can place short positions in the EUR/USD pair. The thick red line is the target price, since the quote is unlikely to move below this level. MACD line - when entering the market, it is important to be guided by the overbought and oversold zones. Important: Novice traders need to be very careful when making decisions about entering the market. Before the release of important reports, it is best to stay out of the market to avoid being caught in sharp fluctuations in the rate. If you decide to trade during the release of news, then always place stop orders to minimize losses. Without placing stop orders, you can very quickly lose your entire deposit, especially if you do not use money management and trade large volumes. And remember that for successful trading, you need to have a clear trading plan. Spontaneous trading decisions based on the current market situation is an inherently losing strategy for an intraday trader. The material has been provided by InstaForex Company - www.instaforex.com |
| Gold is set to move higher amid running inflation Posted: 25 Mar 2022 02:49 AM PDT
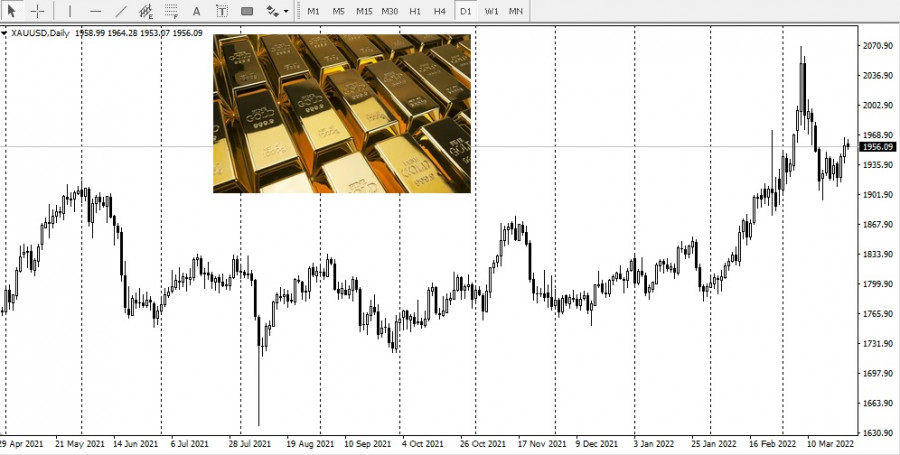
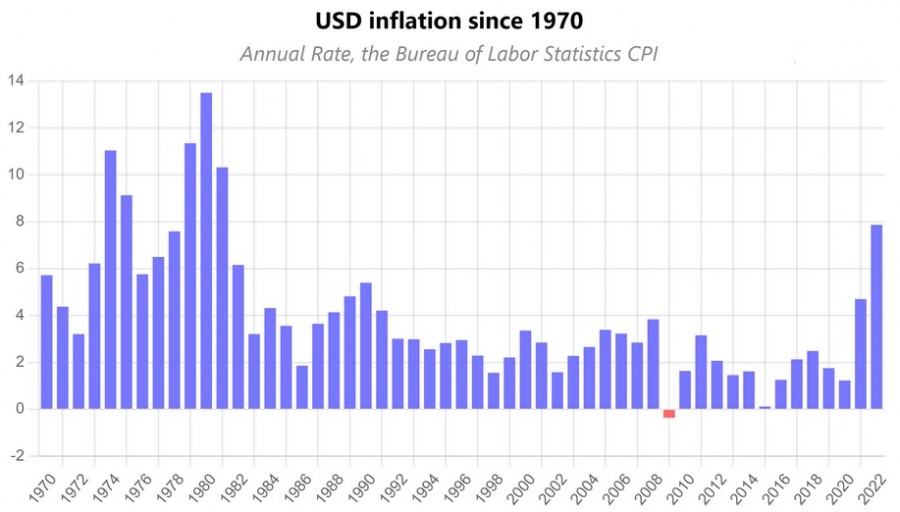
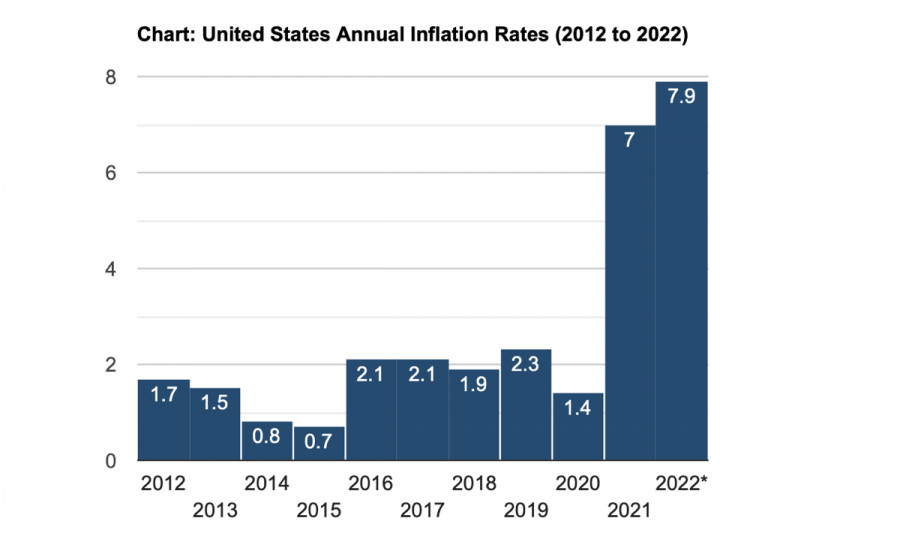
Inflation is currently running at 7.9%, approaching its highest level since 1979. If it goes like this, and the price growth reaches the level from 1979, gold will definitely continue to move higher. The main factor that has taken gold above $1,900 over the past three days is inflation with a twist.
Notably, inflation began to accelerate long before the conflict in Ukraine. It has been extremely rapid this year, having exceeded the levels not seen over the past 40 years. In 2019, consumer prices were holding between 1.5% and 2.3% in December. In 2022, inflation ranged between 2.5% and 1%. However, 2021 was marked with a cascade effect of inflationary spikes, appearing throughout the year. While the average inflation rate was 4.7%, there were times when it went above 5% and was even holding at 6.2% and 6.8% for a couple of months. The CPI for January came in at 7.5% year-over-year. The CPI for February beat the previous high for the last 40 years and reached 7.9%. The next report for March will be available on April 12. The geopolitical crisis in Ukraine has affected imports into the EU. Many analysists have said a lot about the key reasons behind these inflationary pressures. At the moment, the Russia-Ukraine conflict is a direct cause of additional inflationary pressure. Grain continues to be the most important food export in the world. In the first 10 months of 2021, Russia exported $388.4 billion in grain, 42.8% up from the previous year. The primary buyers were China, Germany, and the Netherlands. According to the International Food Policy Research Institute, exports from Russia and Ukraine collectively represent 12% as of March 11, 2022. Ukraine is the second-largest supplier of grains to the EU. Their primary export is barley and wheat. What is more alarming is that Russia is the leading exporter of wheat and one of the top exporters of crude oil, refined petroleum oil, and coal. These are the facts that were relevant in 2021 and are still relevant today. As a result of the military conflict, the EU will face the reduction of exports of necessary goods and services from Russia and Ukraine. This will inevitably lead to massive supply chain disruptions. The consequences are awful, and there are no solutions yet. For that reason, gold has reacted with a strong rally to higher consumer prices. This month, gold traded just $10 below the record high it reached in August 2020. The current level of inflation was last observed in April 1980 when the rate hit 14.6%.
Today, inflation running at 7.9% could easily reach 15% if nothing is done to stop it. As long as inflation stays uncontrolled, gold will continue to gain value. Until the conflict in Ukraine is resolved, global prices will keep rising higher. Therefore, gold is set to trade at all-time highs in the near future. The material has been provided by InstaForex Company - www.instaforex.com |
| Forex forecast 03/25/2022 EUR/USD, EUR/JPY, Gold and Bitcoin from Sebastian Seliga Posted: 25 Mar 2022 02:46 AM PDT Let's take a look at the technical picture of EUR/USD, EUR/JPY, Gold and Bitcoin The material has been provided by InstaForex Company - www.instaforex.com |
| Technical analysis of GBP/USD for March 25, 2022 Posted: 25 Mar 2022 02:24 AM PDT
The GBP/USD pair continues moving downwards from the level of 1.3204 this morning. Today, the first resistance level is currently seen at 1.3204, the price is moving in a bearish channel now. According to the previous events, we expect the GBP/USD pair to trade between 1.3204 and 1.3080. So, the support level stands at 1.3080, while daily resistance is found at 1.3204. Therefore, the market is likely to show signs of a bearish trend around the spot of 1.3204. In other words, sell orders are recommended below the spot of 1.3204 with the first target at the level of 1.3110 and continue towards 1.3080 in order to test the weekly support 3 on the 30M chart. Furthermore, the price has been set below the strong resistance at the level of 1.3204, which coincides with the 50% Fibonacci retracement level. This resistance has been rejected several times confirming the downtrend. Additionally, the RSI starts signaling a downward trend. As a result, if the GBP/USD pair is able to break out the first support at 1.3154, the market will decline further to 1.3110 in order to test the weekly support 2. On the other hand, if the GBP/USD pair succeed to break through the weekly pivot point level of 1.3204 today, the market will move upwards continuing the development of the bullish trend to the level 1.3298 (double top). Stop loss : On the other hand, if a breakout happens at the resistance level of 1.3298, then this scenario may be invalidated. The material has been provided by InstaForex Company - www.instaforex.com |
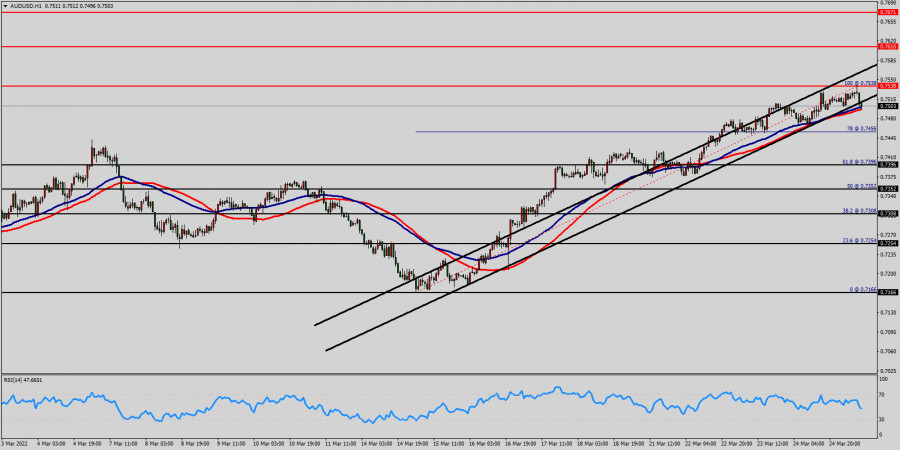
| Technical analysis of AUD/USD for March 25, 2022 Posted: 25 Mar 2022 02:15 AM PDT Overview :
The weekly pivot is seen at the level of 0.7396, so the trend is still moving above it since two weeks. The market is still in an uptrend. We still prefer the bullish scenario today (25th of March 2022). The AUD/USD pair rose from the level of 0.7396 towards 0.7538 yesterday. Now, the current price is set at 0.7508. On the H1 chart, the resistance is seen at the levels of 0.7610 and 0.7610. Besides, the weekly support 1 is seen at the level of 0.7396. Today, the AUD/USD pair is continuing to move in a bullish trend from the new support level of 0.7396, to form a bullish channel. In consequence, the AUD/USD pair broke resistance, which turned strong support at the level of 0.7396 (pivot). Today, the level of 0.7396 is expected to act as major support. The level of 0.7396 is expected to act as major support today. Currently, the price is moving in a bullish channel. This is confirmed by the RSI indicator signaling that we are still in a bullish market. The price is still above the moving average (100) and (50). From this point, we expect the AUD/USD pair to continue moving in the bullish trend from the support level of 0.7396. Hence, we expect the AUD/USD pair to continue moving in the bullish trend from the support level of 0.7396 towards the target level of 0.7610. If the pair succeeds in passing through the level of 0.7610, the market will indicate the bullish opportunity above the level of 0.7610 in order to reach the second target at 0.7671. In coming days, the pair will move upwards continuing the development of the bullish trend to the level 0.7671 in order to test the daily resistance 2. On the other hand, if the AUD/USD pair fails to break through the resistance level of 0.7538 today, the market will decline further to 0.7396.
|
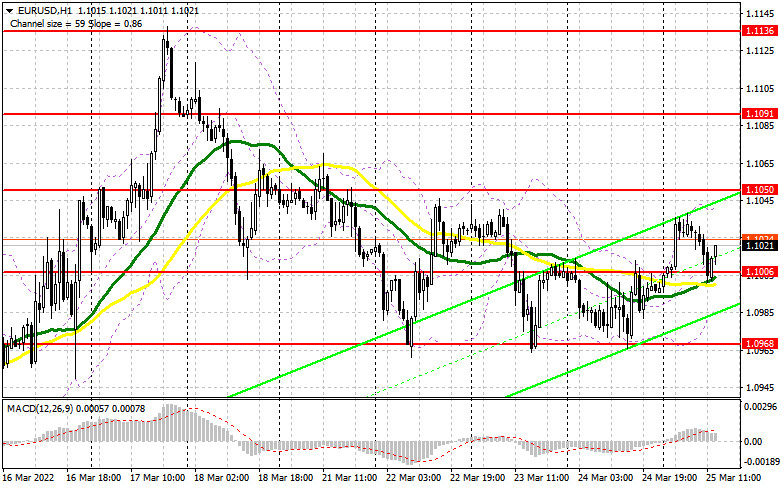
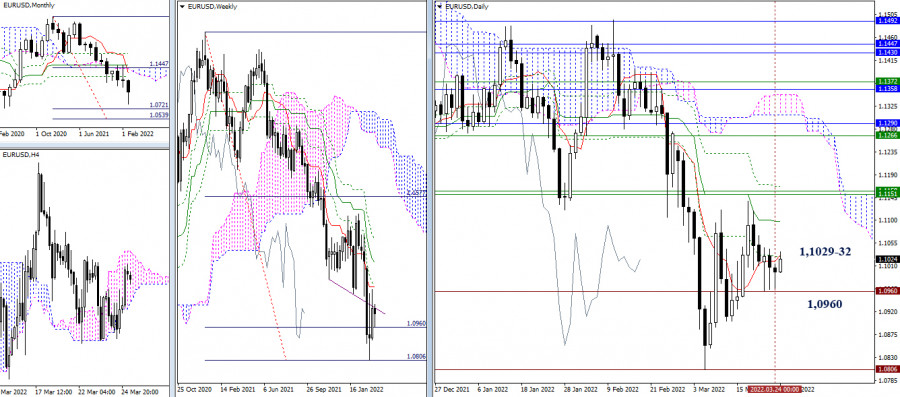
| EUR/USD, GBP/USD technical analysis and recommendations on March 25, 2022 Posted: 25 Mar 2022 02:01 AM PDT EUR/USD
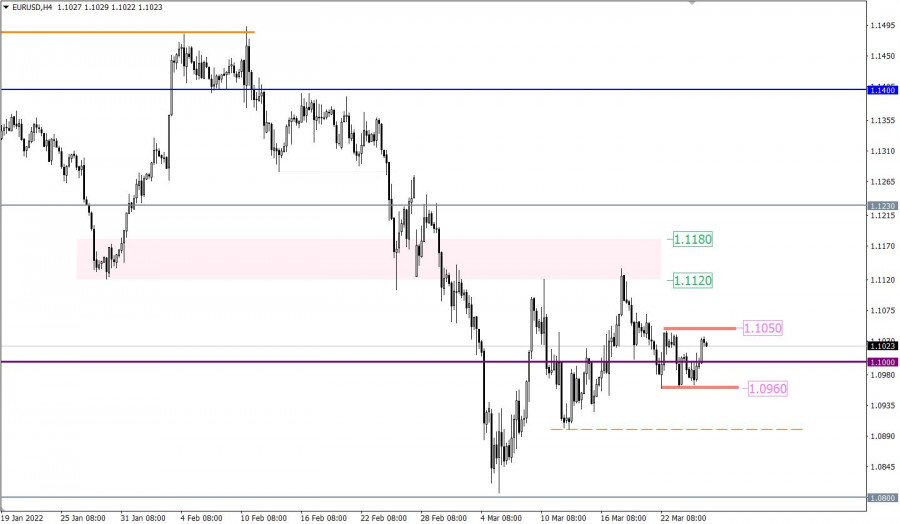
The state of uncertainty still prevails in the market. EUR/USD is holding near the support of 1.0960. At the moment, traders are testing daily resistance levels in the area of 1.1029-32. Consolidation of the price will limit the pair's movements within this range. Today is the end of the week, so it is possible that the pair will close this weekly session in a state of uncertainty and with no clear results. The main task for bears is to break through the weekly target located at the support level, which corresponds to the Ichimoku Cloud indicator (1.0960 - 1.0806). In case of an uptrend, bulls will focus on the level of 1.1099, which represents the daily medium-term trend, and the area of 1.1151-68 (weekly levels + closing level of the daily cross). On lower time frames, bulls are trying to take control over the market. At the moment, buyers are pushing the price above the key levels of 1.0993 – 1.1017 (central pivot level + weekly long-term trend). The breakout of the nearest pivot point (1.1041) and the overcoming of the next one (1.1067) will allow buyers to head for the targets on higher time frames (1.1099 – 1.1151-68). If the price returns under the area of 1.1017 – 1.0993, then the pair may decline on the intraday chart and find support in the range of 1.0971 – 1.0945 – 1.0923 (classic pivot levels). *** GBP/USD
Yesterday, the pair was stuck in the accumulation zone at 1.3164 formed by support levels on higher time frames. The situation has not changed much. At this stage, bulls need to break through the resistance area of 1.3323 (weekly levels + daily medium-term trend). Meanwhile, the main task for bears is to resume the downtrend by pushing the price below 1.3000. On lower time frames, the situation is still uncertain. The pound is hovering near the key levels of 1.3192-83 (central pivot level + weekly long-term trend). The resistance located at the classic pivot levels of 1.3240 and 1.3247, as well as the support lines at 1.3153 - 1.3126 - 1.3096, may serve as additional targets for today. *** Technical analysis is based on: On higher time frames – Ichimoku Kinko Hyo (9.26.52) + Fibo Kijun levels On H1 - Pivot Points (classic) + Moving Average 120 (weekly long-term trend) The material has been provided by InstaForex Company - www.instaforex.com |
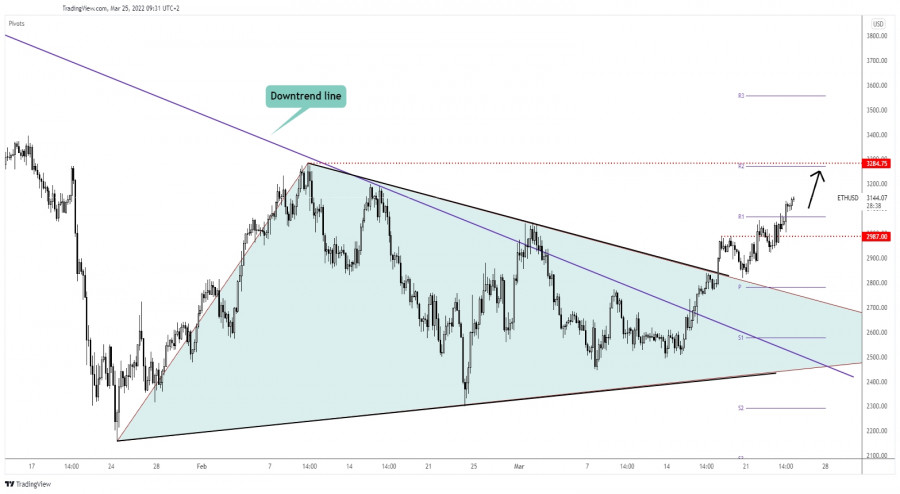
| Ethereum further growth activated Posted: 25 Mar 2022 02:01 AM PDT The price of Ethereum is trading in the green at 3,143 at the time of writing. Bitcoin's growth helped ETH/USD to approach and reach new highs as well. In the short term, the bias is bullish after escaping from a major triangle and after taking out important resistance levels. ETH/USD increased by 11.73% from Sunday's low of 2,819.18 to 3,149.78 today's high. In the last 24 hours, the altcoin is up by 2.87%. ETH/USD Aims At 3,284!
ETH/USD was somehow expected to resume its growth after escaping from the triangle pattern. You knew from my analyses that a valid breakout above 2,987 after trying to retest the triangle's resistance may signal an upside continuation. Now, it has passed above the weekly R1 (3,067) which represented an upside target and obstacle. Stabilizing above it may signal potential further growth. ETH/USD Outlook!Its breakout above the R1 may confirm an upside continuation at least towards the 3,284.75 high. A larger upwards movement could be signaled and confirmed by a valid breakout above this upside obstacle. An upside continuation could be invalidated if ETH/USD drops and stabilizes below the 2,987. The material has been provided by InstaForex Company - www.instaforex.com |
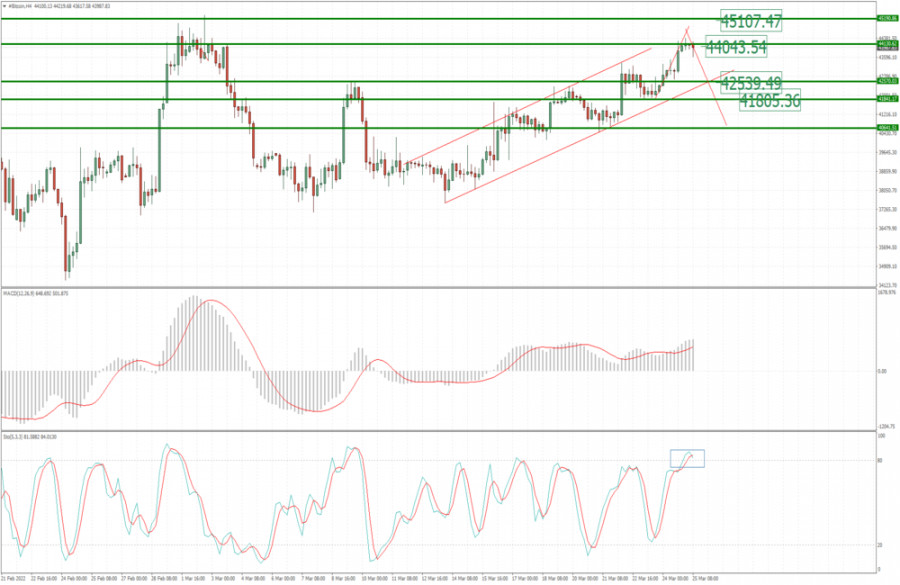
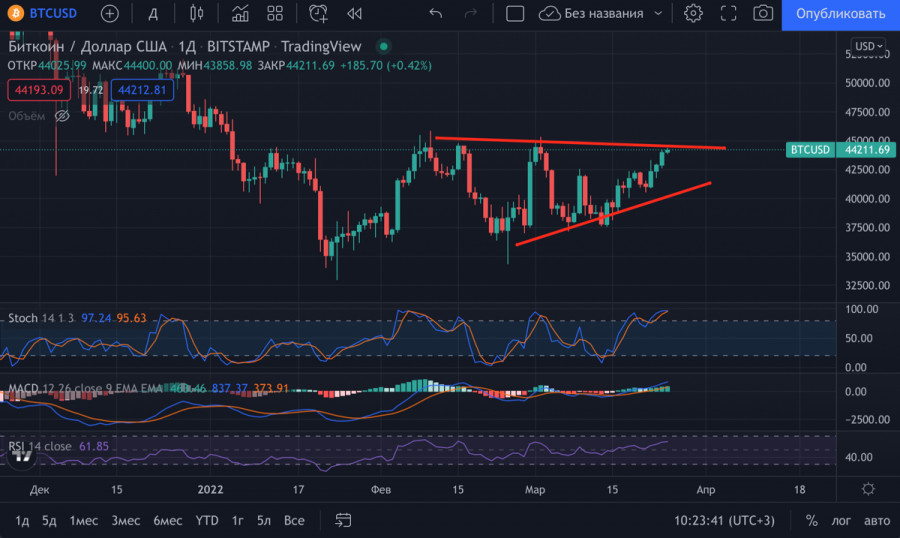
| BTC update for March 25,.2022 - Upside objective reached and potential for downside rotation Posted: 25 Mar 2022 01:47 AM PDT Technical analysis:
BTC has been trading upside as I expected. The price reached my upside objective at the price of $44.045. Anyway, due to overbought condition I see potential for the downside rotation. Trading recommendation: Buyers are still in control and inside of the rising trend-channel but I see potential extreme condition and downside rotation. Watch for potential selling opportunities in case of the breakout of support at $43.300. Downside objectives are set at $42.500, $41.800 and $40.600 Stochastic oscillator is showing overbought condition, which is another sign for the downside rotation. Resistance is set at $45.200 The material has been provided by InstaForex Company - www.instaforex.com |
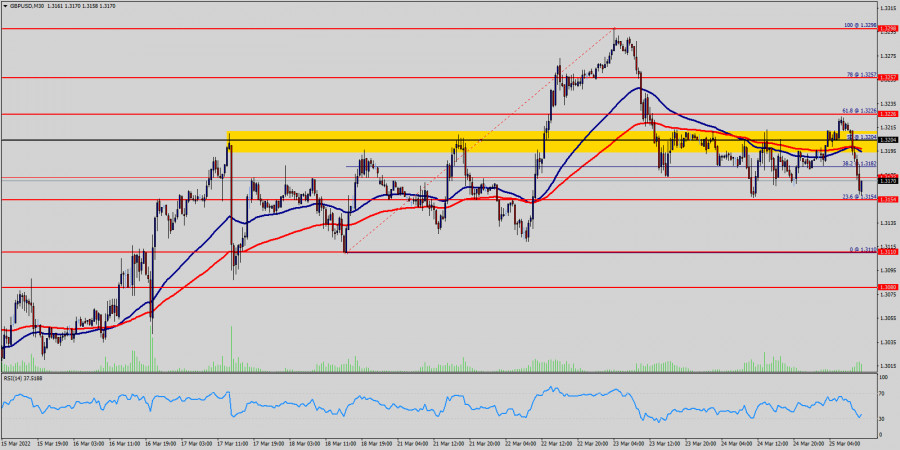
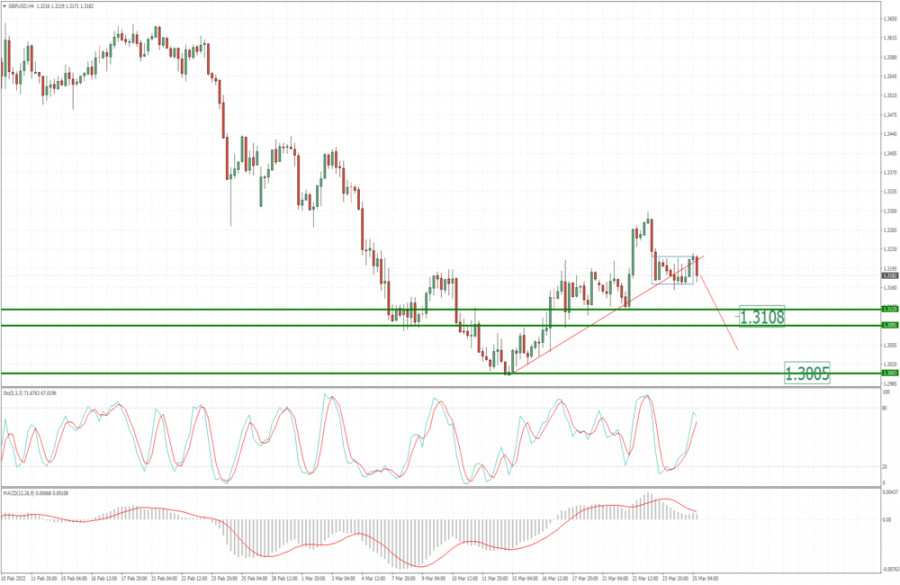
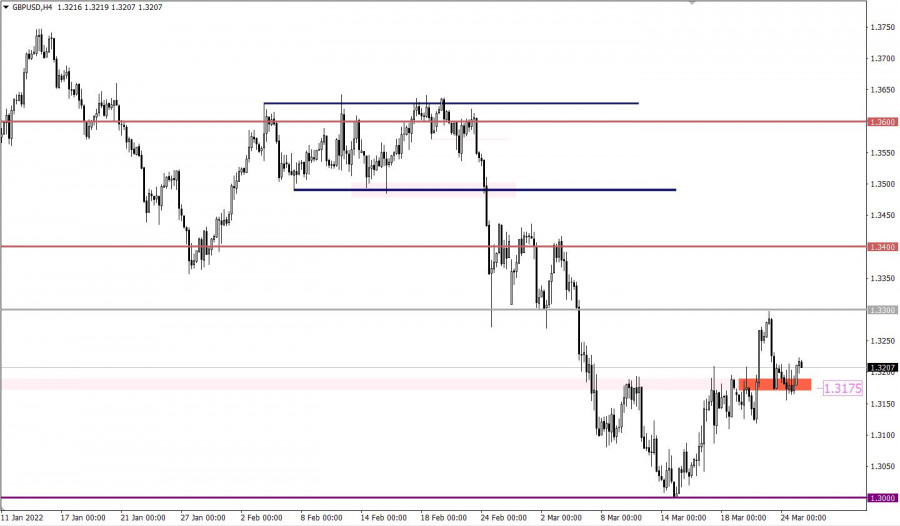
| GBP/USD update for March 25, 2022 - Breakout of rising trendline in the background Posted: 25 Mar 2022 01:40 AM PDT Technical analysis:
GBP has been trading side that the price of 1.3185. I see potential for the downside movement due to the breakout of the rising trend-line in the background. Trading recommendation: Due to the breakout of the rising trend-line in the background and failed breakout of the mini consolidation, I see potential for the downside movement. Watch for potential selling opportunities in case of the breakout of support at 1.3160. Downside objectives are set at 1.3110 and 1.3005 Stochastic oscillator is showing overbought condition, which is another sign for the downside rotation. Resistance is set at 1.3284 The material has been provided by InstaForex Company - www.instaforex.com |
| Daily Video Analysis: GBPUSD, D1 Bearish Channel Selling Opportunity Posted: 25 Mar 2022 01:36 AM PDT Today we take a look at GBPUSD. Combining advanced technical analysis methods such as Fibonacci confluence, correlation, market structure, oscillators and demand/supply zones, we identify high probability trading setups. The material has been provided by InstaForex Company - www.instaforex.com |
| Video market update for March 25,,2022 Posted: 25 Mar 2022 01:35 AM PDT Watch for downside opportunities on GBP.... The material has been provided by InstaForex Company - www.instaforex.com |
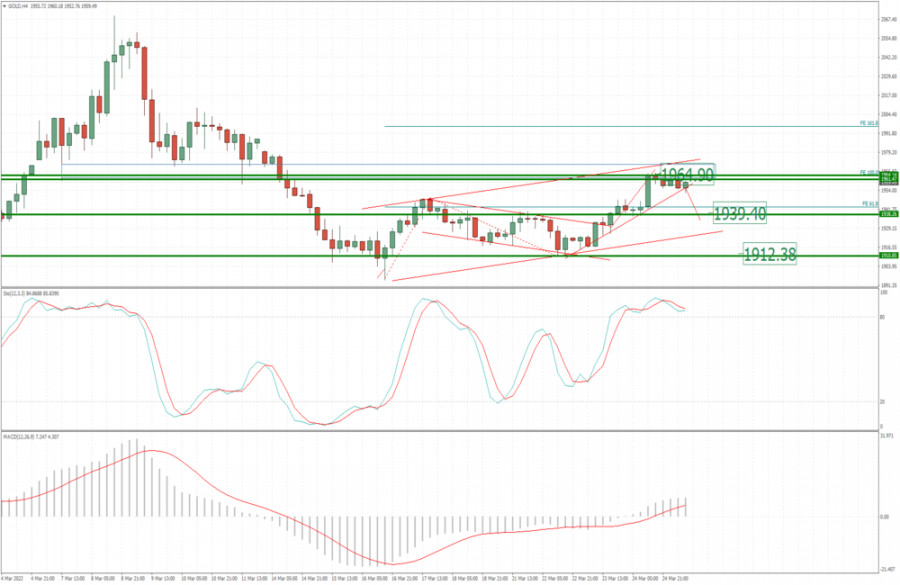
| Posted: 25 Mar 2022 01:31 AM PDT Technical analysis:
Gold has been trading upside as I expected. The price reached my upside objective at $1.964. Anyway, there is strong resistance at the price of $1.970 and I see potential downside rotation. Trading recommendation: Due to strong resistance at $1.970, I see potential for the downside rotation. Watch for potential selling opportunities with the downside objectives at $1.939 and $1.912. Stochastic oscillator is showing overbought condition, which is another sign for the downside rotation. Additionally, Gold reached upper trend-line projection... The material has been provided by InstaForex Company - www.instaforex.com |
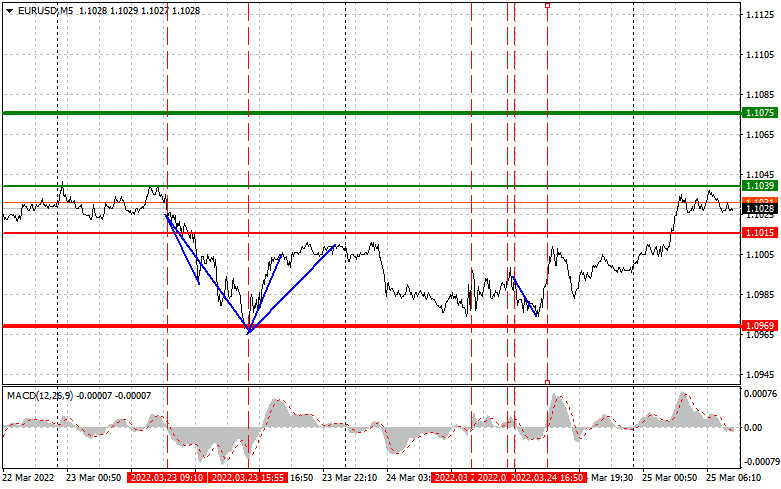
| Trading plan for starters of EUR/USD and GBP/USD on March 25, 2022 Posted: 25 Mar 2022 01:29 AM PDT Details of the economic calendar of March 24Preliminary data on business activity indices for March in Europe, Britain, and the United States were published. They expected a widespread decline in performance, but instead saw an increase. The discrepancy in expectations did not affect the market in any way due to the ongoing pressure from the information flow. In the United States, weekly data on jobless claims were also published, where they recorded a decrease in their volume, but this factor did not play into the currency market. Statistics details: The volume of initial claims for unemployment benefits decreased from 215,000 to 187,000. The volume of continuing claims decreased from 1.417 million to 1.350 million. Analysis of trading charts from March 24The EURUSD currency pair once again found a foothold in the area of 1.0960. This led to a reduction in the volume of short positions and, as a result, a price rebound. On the trading chart of the daily period, a downward trend formed where a three-week corrective move has appeared from the support level of 1.0800. The GBPUSD currency pair on the way of the downward move met a variable pivot point in the face of the value of 1.3175. Initially, there was a stagnation within this mark, which was expressed in the form of versatile Doji-type candles, after which the price began to roll back.
March 25 economic calendarToday at 07:00 UTC, data on retail sales in the UK were published, the growth rate of which slowed down from 9.1% to 7.0%. It is worth considering that the data was published for February, and given the current situation, they are no longer considered informative, since the March figures may turn out to be more deplorable. Trading plan for EUR/USD on March 25In this situation, the corrective move is still relevant in the market, despite repeated attempts to change trading interests. An increase in the volume of long positions is possible if the price holds above the value of 1.1050 in a four-hour period. In this case, buyers will have a chance to prolong the correction. A downside scenario will be considered by traders if the price holds below 1.0960 in a four-hour period. This step will indicate the completion of the corrective move.
Trading plan for GBP/USD on March 25During the recent rebound, there was an increase in the volume of long positions, which stimulated traders to action. The subsequent growth in the value of the pound sterling should be expected after the price holds above 1.3230. This move may lead to another touch of the resistance level 1.3300. At the same time, the downward scenario along the path of the main trend is considered by market participants. For a signal to sell the pound, the quote needs to stay below 1.3150 in a four-hour period.
What is reflected in the trading charts?A candlestick chart view is graphical rectangles of white and black light, with sticks on top and bottom. When analyzing each candle in detail, you will see its characteristics of a relative period: the opening price, closing price, and maximum and minimum prices. Horizontal levels are price coordinates, relative to which a stop or a price reversal may occur. These levels are called support and resistance in the market. Circles and rectangles are highlighted examples where the price of the story unfolded. This color selection indicates horizontal lines that may put pressure on the quote in the future. The up/down arrows are the reference points of the possible price direction in the future. The material has been provided by InstaForex Company - www.instaforex.com |
| Fed prepares tighter monetary policy: how it can affect Bitcoin? Posted: 25 Mar 2022 01:04 AM PDT In March 2022, the global community and financial markets experienced one of the most considerable shocks. Investors are trying to get used to the new realities, which are significantly influenced by two key factors. While the special military operation in Ukraine cannot be swayed, they can adapt to the new Fed policy. As we expected, the Fed's accommodative tightening of monetary policy will be reversed because the body's strategy did not take full-scale military operations into account. This was implicitly confirmed by Jerome Powell, who said that the rate of inflation was still high. Similar statements can be heard from other members of the Fed, which seems quite consistent.
The regulator decided to stick to a planned rate hike so as not to stress already nervous investors. As a result, the market favorably reacted to the tightening of monetary policy. As a result, Bitcoin climbed to a new swing high of $44,000. Market players tuned in for nine mild key rate hikes in two years. However, given the economic redistribution, imposed sanctions, and pressure on the US dollar, the monetary policy needed to be revised against the record 30-year inflation rate. It is likely that at the end of 2022 we may see the key rate at 2.5%-3.0%. Investors are gradually preparing for a sharper tightening of monetary policy due to geopolitical factors.
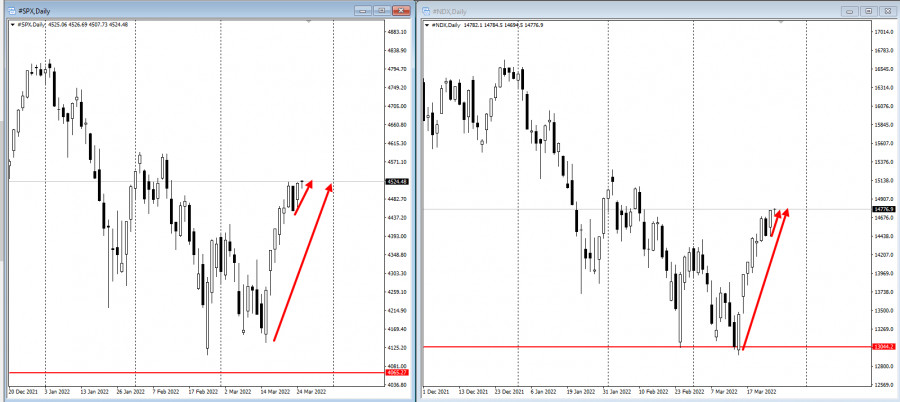
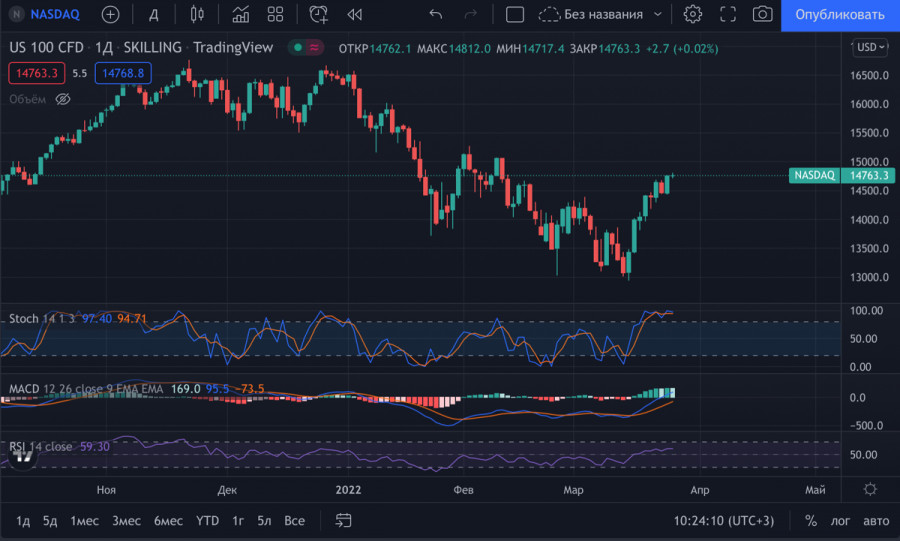
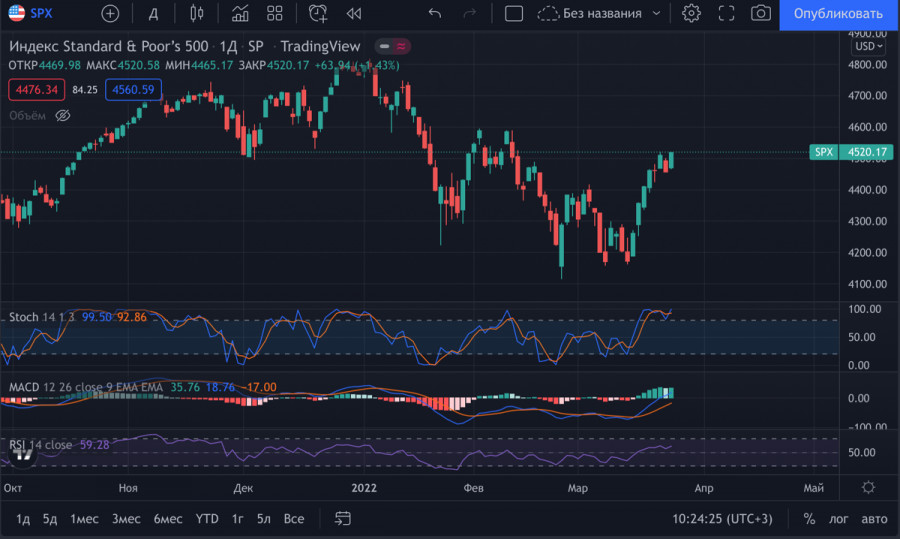
In such an environment, Bitcoin is likely to gain an advantage in the medium term. Investors understand that with each Fed meeting there will be less and less liquidity in the market. Therefore, Bitcoin may become a major risky asset. At this stage, the key rate hike has not been so hurtful, as you can see by the growth of the SPX and NASDAQ indices. Investors want to invest in high-risk assets again. In the near future, preserving current capital in the face of a tough key rate hike will come to the fore. Bitcoin may become the number one investment asset due to its deflationary component, the emergence of the draft of legal regulation, and the fade of the bear market.
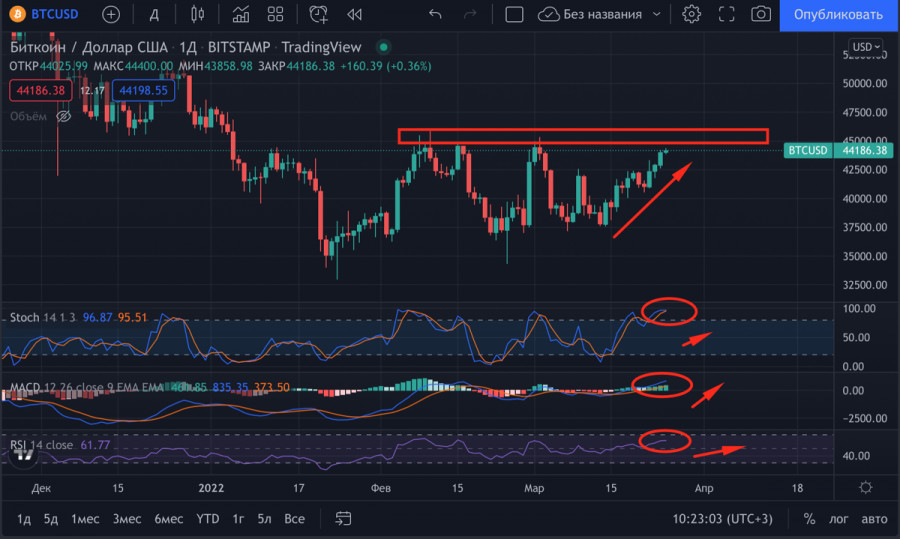
Positive changes are already reflected on cryptocurrency charts. The asset is gradually approaching the key resistance at $44,500-$45,700 by small buying volumes. As we expected, there will be no growth momentum to this range. Instead, we see systematic upward growth based on accumulation and an increase in volumes. Technical indicators continue to confirm the bullish trend of the asset. Growing volumes of purchases and increased demand amid Fed's statements significantly increase the chances of BTC to go beyond the wide range of $32,000-$45,700.
|


| You are subscribed to email updates from Forex analysis review. To stop receiving these emails, you may unsubscribe now. | Email delivery powered by Google |
| Google, 1600 Amphitheatre Parkway, Mountain View, CA 94043, United States | |


Comments