Forex analysis review
Forex analysis review |
- Technical analysis of ETH/USD for March 06, 2022
- How to trade EUR/USD on March 7, 2022. Simple trading tips and analysis for beginners
- The hit parade of bitcoin optimists continues
- Bitcoin continues to fall
| Technical analysis of ETH/USD for March 06, 2022 Posted: 06 Mar 2022 12:19 PM PST
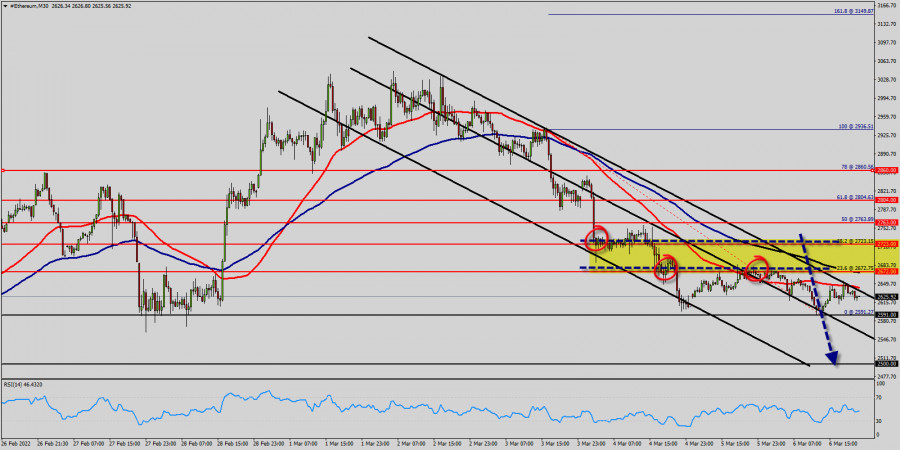
Technical market outlook (Ethereum) : Ethereum is flighting around the price of $2,607 after dropping under the price of $2,672 immediately following the attack, and Ethereum is back below $2,672 (23.6% of Fibonacci retracement levels). ETH/USD is in a wide trading range with strong below the resistance levels of $2,627 ; $2,723 and $2,763. Technical indicators are mostly showing downtrend. Downtrend scenario : A Downtrend will start as soon, as the market rises below the resistance levels 2,627 ; $2,723 and $2,763, which will be followed by moving down to support level $2,763 (S1). Further close below the high end may cause a rally towards $2,763. Nonetheless, the weekly support level and zone should be considered. Now, the price is set at $2,723 to act as a daily pivot point. It should be noted that volatility is very high for that Ethereum is still moving between $2,723 and $2,500 in coming hours. F Eurthermore, the price has been set below the strong resistance at the levels of $2,627 ; $2,723 and $2,763, which coincides with the 23.6%, 38.2 and 50% Fibonacci retracement level respectively. Additionally, the price is in a bearish channel now. Amid the previous events, the pair is still in a downtrend. From this point, Ethereum is continuing in a bearish trend from the new resistance of $2,672. On the downside, the $2,591 level represents support. The next major support is located near the $2,500, which the price may drift below towards the $2,500 support region. The material has been provided by InstaForex Company - www.instaforex.com |
| How to trade EUR/USD on March 7, 2022. Simple trading tips and analysis for beginners Posted: 06 Mar 2022 09:36 AM PST Analyzing trades on Friday: EUR/USD on 30M chart
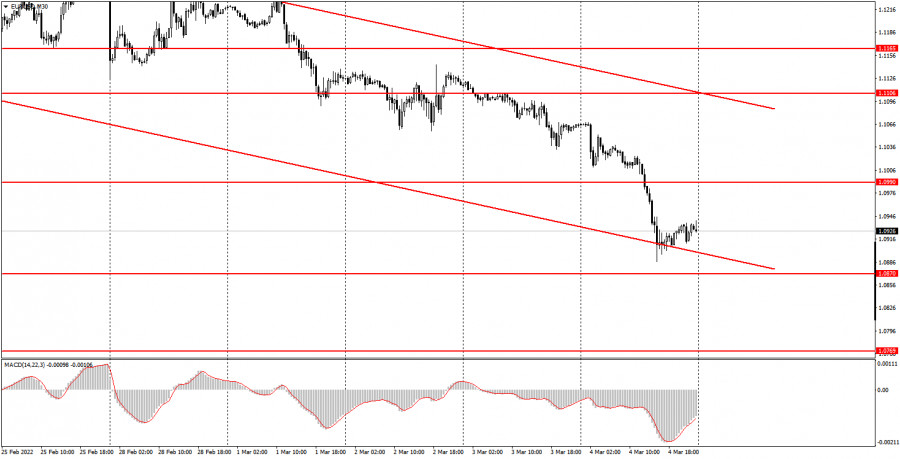
On Friday, trading activity on EUR/USD was rather high, and the pair was moving mostly in one direction throughout the day. The downtrend continues, which is confirmed by the descending channel. The pair is declining almost every day, so now we are dealing with a very strong downward movement. The current geopolitical situation is to blame for this fall. Someone might think that on Friday the US dollar advanced thanks to strong macroeconomic data. However, this is not entirely true. First of all, the price began to decline at night when there was no news. Secondly, it resumed its fall three hours before the release of the data in the US. Thus, the European currency had been depreciating even before the unemployment data and nonfarm payrolls reports were published in the US. Yet, the unemployment rate that fell to 3.8% and more than 600,000 new jobs outside the agricultural sector (far more than expected) also fueled the demand for the US dollar. So, on Friday, the greenback benefited both from the geopolitical situation and the macroeconomic background. EUR/USD on 5M chart
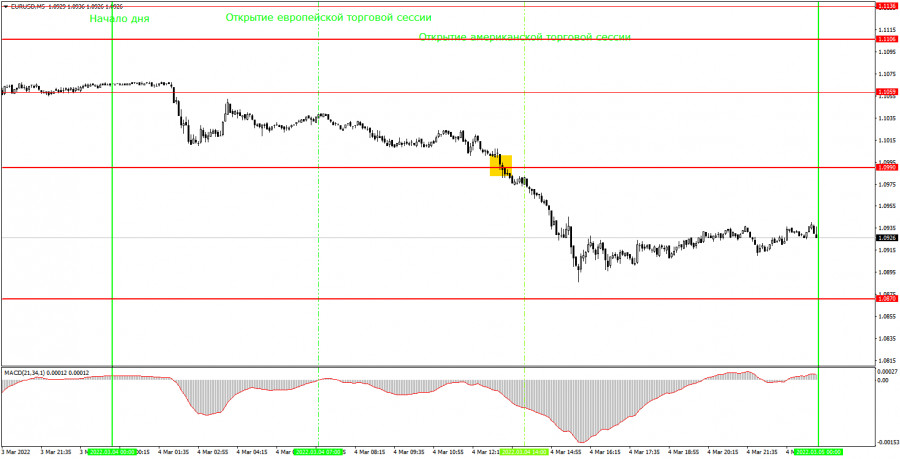
On the 5-minute time frame on Friday, the pair was declining for the whole day. Only by the end of the session, the pair started a slight upside pullback which was of no use. There was only one trading signal formed during the day as this price area has very few levels to trade from. The fact is that the price has not been so low for a very long time. When the pair broke through the level of 1.0990, traders had a good opportunity to sell. The quote failed to go down to the nearest target level of 1.0870. Therefore, the trade had to be closed manually in the late afternoon, which could have brought us about 70 pips. Traders could have downplayed the macroeconomic data from the US. By the time of the news release, the price had already declined by more than 15 pips. So, when opening this trade, beginners should have set a Stop Loss to breakeven. Friday turned out to be an excellent day for trading: there were few trading signals, and all trades turned out to be profitable. Trading tips on Monday On the 30-minute time frame, the downtrend is still in place. Therefore, it is better to stay bearish on the pair. If the price manages to consolidate above the channel, then it would be possible to say that the downtrend is over. At the moment, the geopolitical factor is strongly affecting traders' sentiment, so it is likely that the US dollar will surge again in case the situation worsens. However, this process cannot continue forever. On the 5-minute time frame on Monday, it is recommended to trade at the levels of 1.0769, 1.0870, 1.0990, 1.1059, and 1.1106. You should set a Stop Loss to breakeven as soon as the price moves by 15 pips in the right direction. On Monday, there will be no important reports either in the US or in the EU. Thus, when making trading decisions, you will have to rely only on the geopolitical factor and technical analysis. If the news background is relatively stable, the pair may start a slight upward correction. Otherwise, the decline may continue. Basic rules of the trading system 1) The strength of the signal is determined by the time it took the signal to form (a rebound or a breakout of the level). The quicker it is formed, the stronger the signal is. 2) If two or more positions were opened near a certain level based on a false signal (which did not trigger a Take Profit or test the nearest target level), then all subsequent signals at this level should be ignored. 3) When trading flat, a pair can form multiple false signals or not form them at all. In any case, it is better to stop trading at the first sign of a flat movement. 4) Trades should be opened in the period between the start of the European session and the middle of the US trading hours, when all positions must be closed manually. 5) You can trade using signals from the MACD indicator on the 30-minute time frame only amid strong volatility and a clear trend that should be confirmed by a trendline or a trend channel. 6) If two levels are located too close to each other (from 5 to 15 pips), they should be considered support and resistance levels. On the chart Support and Resistance Levels are the levels that serve as targets when buying or selling the pair. You can place Take Profit near these levels. Red lines are channels or trend lines that display the current trend and show in which direction it is better to trade now. The MACD indicator (14, 22, and 3) consists of a histogram and a signal line. When they cross, this is a signal to enter the market. It is recommended to use this indicator in combination with trend patterns (channels and trendlines). Important announcements and economic reports that can be found on the economic calendar can seriously influence the trajectory of a currency pair. Therefore, at the time of their release, we recommend trading as carefully as possible or exiting the market in order to avoid sharp price fluctuations. Beginners on Forex should remember that not every single trade has to be profitable. The development of a clear strategy and money management is the key to success in trading over a long period of time. The material has been provided by InstaForex Company - www.instaforex.com |
| The hit parade of bitcoin optimists continues Posted: 06 Mar 2022 06:12 AM PST
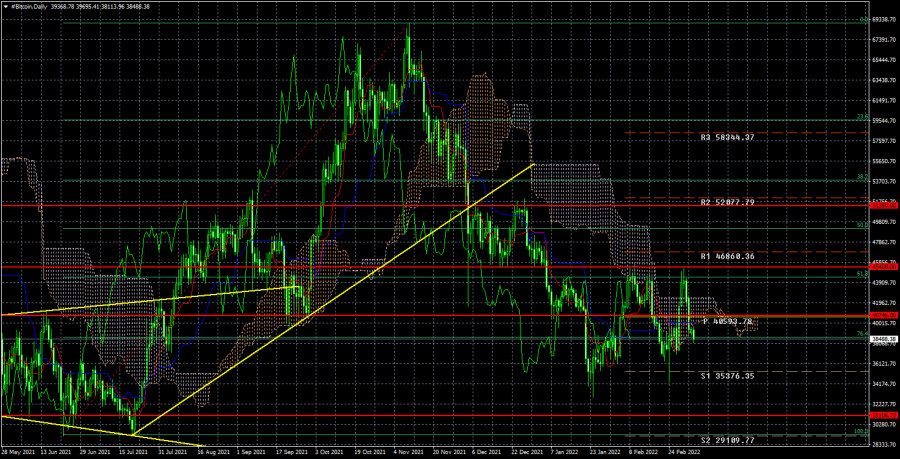
On the 24-hour TF, the technical picture for bitcoin looks bad too. The price bounced three times from the important level of $ 45,408 and the Fibonacci level of 61.8%, which is currently located below the Ichimoku cloud. All this suggests that the fall will continue, at least, to the previous local minimum of $ 34,400. However, we have been expecting for several months to fall to the minimum of last year – $ 31,100. The fact that bulls cannot overcome important levels and the very fact of a four-month drop indicates a "bearish" trend. How can we not remember that any "bullish" trend always ended with a drop of 80-90%. Thus, bitcoin still has a place to fall. Forecasters continue to believe in growth. Nevertheless, even in the period when bitcoin is frankly falling, some people continue to declare its growth in the near future. For example, the head of the consulting company "deVere Group" Nigel Green said that bitcoin will grow to $ 50,000 by the end of this month. He believes that the conflict in Ukraine is the cause of serious financial turmoil for all markets, so many will look for alternative investments. Green probably means that all investors who have left Russia and Ukraine will have to transfer their funds to other instruments. Although, from our point of view, it is the turmoil in Ukraine and Russia that will have to discourage investors from risky markets for a long time. Green also believes that bitcoin is a viable, decentralized system that is well protected from unauthorized access, trust in bitcoin is growing, more and more institutions are joining. But the head of SkyBridge, Anthony Scaramucci, believes that bitcoin will grow to the notorious $ 100,000 mark by the end of 2024, which, from our point of view, is already a real forecast, not a fantasy. But there is one "but". Scaramucci owns at least $1 billion worth of bitcoin. This means that he is interested in the growth of its value. If you had bitcoins for a large amount and you understood that the more people believe in its growth, the more it grows, what would you say and what forecasts would you give? Therefore, we believe that the forecasts of interested individuals should be treated with great skepticism.
On the 24-hour timeframe, the quotes of the "bitcoin" failed to overcome the level of $ 45,408 and began a new round of downward movement within the framework of the downward trend that has been observed for 4 months. There are no obstacles on the way to the $31,100 level. If traders manage to overcome it, then the drop in quotations of the "bitcoin" will continue almost guaranteed. Geopolitics continues to deteriorate, so there are fewer reasons for bitcoin to grow, too. The material has been provided by InstaForex Company - www.instaforex.com |
| Posted: 06 Mar 2022 06:12 AM PST
The bitcoin cryptocurrency began a new round of decline on March 2 and at the moment has already lost $ 6,800 of its value. Thus, from our point of view, a new period of decline in this cryptocurrency has begun. We draw traders' attention to the fact that buyers failed to overcome the $ 45,408 level three times, which is an important resistance level. Therefore, now there should be a drop below the previous local minimum, that is, below the level of $ 34,400. The difficult geopolitical situation in Eastern Europe only supported the first cryptocurrency in the world for a short period. At the moment, according to most experts, it is generally flat between the levels of $ 30,000 and $ 50,000. From our point of view, this definition is completely wrong, because we might as well say that the euro/dollar pair has been between the levels of $ 0.8 and $ 1.6 in the flat for more than 20 years. We remind you that bitcoin is a very "thin" tool. A minimal change in the mood of traders and cryptocurrency can fly up or down by $ 10,000 in a day. That is, in the context of bitcoin, it is generally very difficult to make forecasts for the next couple of weeks. Nevertheless, on the 4-hour TF, the price was fixed below the Ichimoku cloud, which is a strong signal to maintain the current trend. And the trend is now downward. Meanwhile, it's already March 6th. That is, in 10 days, the results of the next Fed meeting will be known, at which, with a probability of almost 100%, a 0.25% increase in the key rate will be announced. For all risky assets, this is bad news, since tightening monetary policy will lead to the fact that the profitability of other, safer assets will increase. In addition, the Fed is not just going to raise the rate 1-2 times, but to do it at least 5 times this year. Consequently, we are talking about a systematic and prolonged tightening of monetary policy. We stand by our previous opinion: in 2022, it will be extremely difficult for bitcoin to update its absolute highs. We are more inclined to leave below $ 31,100. You should also keep in mind inflation. Last year, almost everyone said that bitcoin is the best means of hedging inflation. Let me ask then, why has bitcoin been falling for 4 months now, although inflation in the US continues to rise? After all, there was no Ukrainian-Russian conflict 2 weeks ago, so the market could not get rid of bitcoin for four months due to geopolitical tensions. Therefore, we believe that at least now the "inflation factor" is not important for investors and traders. Based on all of the above, there are no special chances for bitcoin to grow now. The trend on the 4-hour timeframe remains downward. The price dropped below the trend line, below the Ichimoku cloud, and at the $ 40,746 level. Thus, now the way is open for her to the level of $ 31,100, and we recommend selling cryptocurrency at this time. So far, there is no reason to expect a recovery of the "bullish" trend. Absolutely all factors, technical, fundamental, geopolitical, speak in favor of the fact that the fall will continue. Reserve plan – after fixing above the level of $ 45,408. The material has been provided by InstaForex Company - www.instaforex.com |
| You are subscribed to email updates from Forex analysis review. To stop receiving these emails, you may unsubscribe now. | Email delivery powered by Google |
| Google, 1600 Amphitheatre Parkway, Mountain View, CA 94043, United States | |


Comments